Article

Multidigraph Autocatalytic Set for Modelling Complex Systems

1
Department of Mathematical Sciences, Faculty of Science, Universiti Teknologi Malaysia, Johor Bahru 81310, Malaysia
2
Faculty of Management, Universiti Teknologi Malaysia, Johor Bahru 81310, Malaysia
3
Department of Mathematics, Faculty of Natural and Applied Sciences, Sule Lamido University, 048 SLU Kafin Hausa, Kano 700271, Nigeria
*
Author to whom correspondence should be addressed.
Mathematics 2023, 11(4), 912; https://doi.org/10.3390/math11040912
Submission received: 18 December 2022 / Revised: 28 January 2023 / Accepted: 1 February 2023 / Published: 10 February 2023

Abstract

:
The motion of solid objects or even fluids can be described using mathematics. Wind movements, turbulence in the oceans, migration of birds, pandemic of diseases and all other phenomena or systems can be understood using mathematics, i.e., mathematical modelling. Some of the most common techniques used for mathematical modelling are Ordinary Differential Equation (ODE), Partial Differential Equation (PDE), Statistical Methods and Neural Network (NN). However, most of them require substantial amounts of data or an initial governing equation. Furthermore, if a system increases its complexity, namely, if the number and relation between its components increase, then the amount of data required and governing equations increase too. A graph is another well-established concept that is widely used in numerous applications in modelling some phenomena. It seldom requires data and closed form of relations. The advancement in the theory has led to the development of a new concept called autocatalytic set (ACS). In this paper, a new form of ACS, namely, multidigraph autocatalytic set (MACS) is introduced. It offers the freedom to model multi relations between components of a system once needed. The concept has produced some results in the form of theorems and in particular, its relation to the Perron–Frobenius theorem. The MACS Graph Algorithm (MACSGA) is then coded for dynamic modelling purposes. Finally, the MACSGA is implemented on the vector borne disease network system to exhibit MACS’s effectiveness and reliability. It successfully identified the two districts that were the main sources of the outbreak based on their reproduction number, R 0 .

1. Introduction

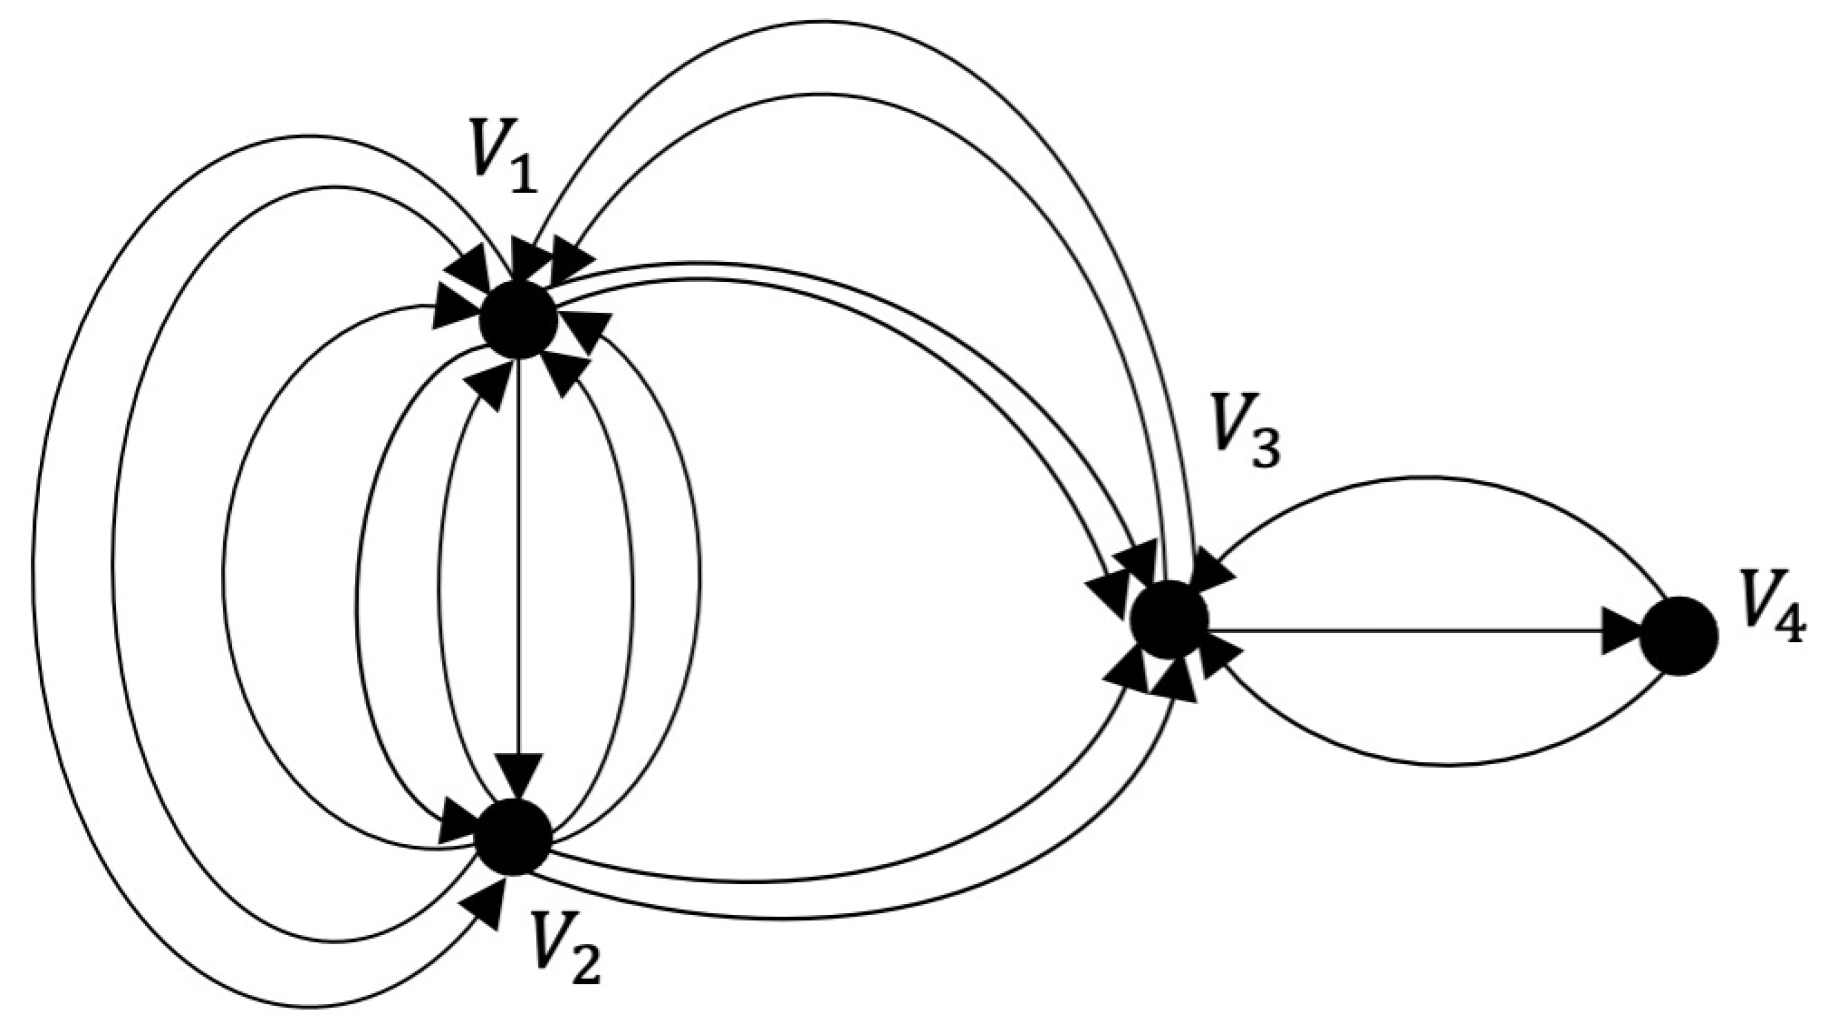
A system is said to be complex if it has emergent global dynamics that come from the activities of its elements rather than being imposed by a central controller [1]. Emergent behaviours are large-scale consequences of a system of locally interacting agents that are frequently unexpected and difficult to predict [1]. Modelling a system is essential for understanding its behaviour. In addition, a complex system is always complicated to analyse and requires advanced analysis using various mathematical methods [2]. It involves various structures due to the multiple relationships between its components. These relationships offer important information about the behaviour and dynamics of the system. Therefore, in this research, we infused multidigraph as a special feature in our modelling to enhance systems’ connectivity and be able to consider various relationships and information in the system.
A multidigraph is a modelling technique that employs multiple edges to represent the connection of its variables in a given system. In the graph, two or more edges share the same tail and head vertices. Numerous researchers have used multigraph to model their problems, especially those involving multiple interrelationships systems. Some of the systems are networks of education systems [3], multi-agent systems [4], vector-borne diseases [5], and financial transactions [6]. Fedriani and Moyano [3] studied situations related to education, particularly on the detection of levels of mathematical education in which several variables were involved. Zhang and Chen [4] used multidigraph to model the communication network of a multiagent for achieving bipartite consensus, whereby their nodes or vertices correspond to the agents and the edges correspond to the communication strength between agents. Iggidr et al. [5] studied the dynamics of a multi-group model for vector-borne disease models by applying the connectivity graph involving multiple edges. Furthermore, Lin et al. [6] proposed a novel graph embedding method called Temporal Weighted Multidigraph Embedding (T-EDGE), which incorporates transaction information from both time and amount of domains to capture the properties of their dynamic transaction networks. Multidigraph has been successfully used to present relationships between its components. The great capability provided by multidigraph inspires us to integrate it with a well-known concept called autocatalytic set (ACS).
The concept of ACS was first introduced in the context of catalytically interacting molecules [7,8]. In 1998, Jain and Krishna introduced the definition of autocatalytic set in the form of a graph. The researchers described an ACS as a subgraph whose every node has at least one incoming link from a node that belongs to the same subgraph [9]. Then fuzzy autocatalytic set (FACS) was developed by Ahmad et al. [10] by combining fuzzy graph and ACS. A fuzzy graph is a graph that integrates fuzziness [11], while ACS is another form of a graph that embeds the closed connection or catalytic features between its vertices. Ahmad et al. [10] modelled a clinical waste incineration process using FACS. Their system’s vertices represent chemical variables with significant roles throughout the process and the edges reflect their chemical reactions. The FACS approach was able to determine both the sequence of depleting variables and the system’s products. Since then, FACS has been investigated further and has been used in several other systems, including the pressurized water reactor (PWR) [12]. Ahmad et. al. [13] explored the mathematical features of FACS further and introduced the coordinated transformation form of FACS. The introduction of coordinated FACS has made it possible for Hassan et al. [14] to develop FACS into a chemometrics method and later named it a chemometric fuzzy autocatalytic set (c-FACS). The c-FACS was used by the researchers [14] for analysing a set of Fourier Transform Infrared Red (FTIR) signal data of gelatine. Most of the applications of ACS and FACS from previous researchers involve single-directed edge between a pair of vertices.
In this paper, a new form of ACS called the multidigraph autocatalytic set (MACS) is introduced for such complex systems that require multiple edges and ‘closed’ interactions. Multidigraph for ACS has never been reported in the literature. The integration of these two mathematical structures is expected to be able to model any complex system that has multiple components and interrelationships.
The research framework is depicted in Figure 1 below. The paper is organized as follows. Section 2 provides basic concepts, definitions and backgrounds associated with this study. Section 3 describes the MACS, some of its features, its algorithm, namely, MACSGA and its implementation. The conclusion and future work of this study are outlined in Section 4.

2. Preliminaries

2.1. Autocatalytic Set

Kauffman [7] first proposed the concept of autocatalytic set (ACS) and coined its potential role as a tool to model complex systems. Hordijk [15] then further pointed out that it can be used as a possible modelling technique in chemistry, physics, biology, and computer science. The later researchers aimed to understand the necessary conditions for the catalytically of the system. The theory was further developed by Jain and Krishna [9] who then introduced ACS in the form of a graph where the components (which could be species, neurons, agents, etc.) are represented by nodes and their mutual interactions by the links of the graph. The introduction of ACS as a graph has provided an important tool to capture various aspects of a given network structure [16]. The formal definition of an autocatalytic set is as follows.
Definition 1
([9]). An autocatalytic set is a subgraph, each of whose vertices has at least one incoming link from vertices belonging to the same subgraph.
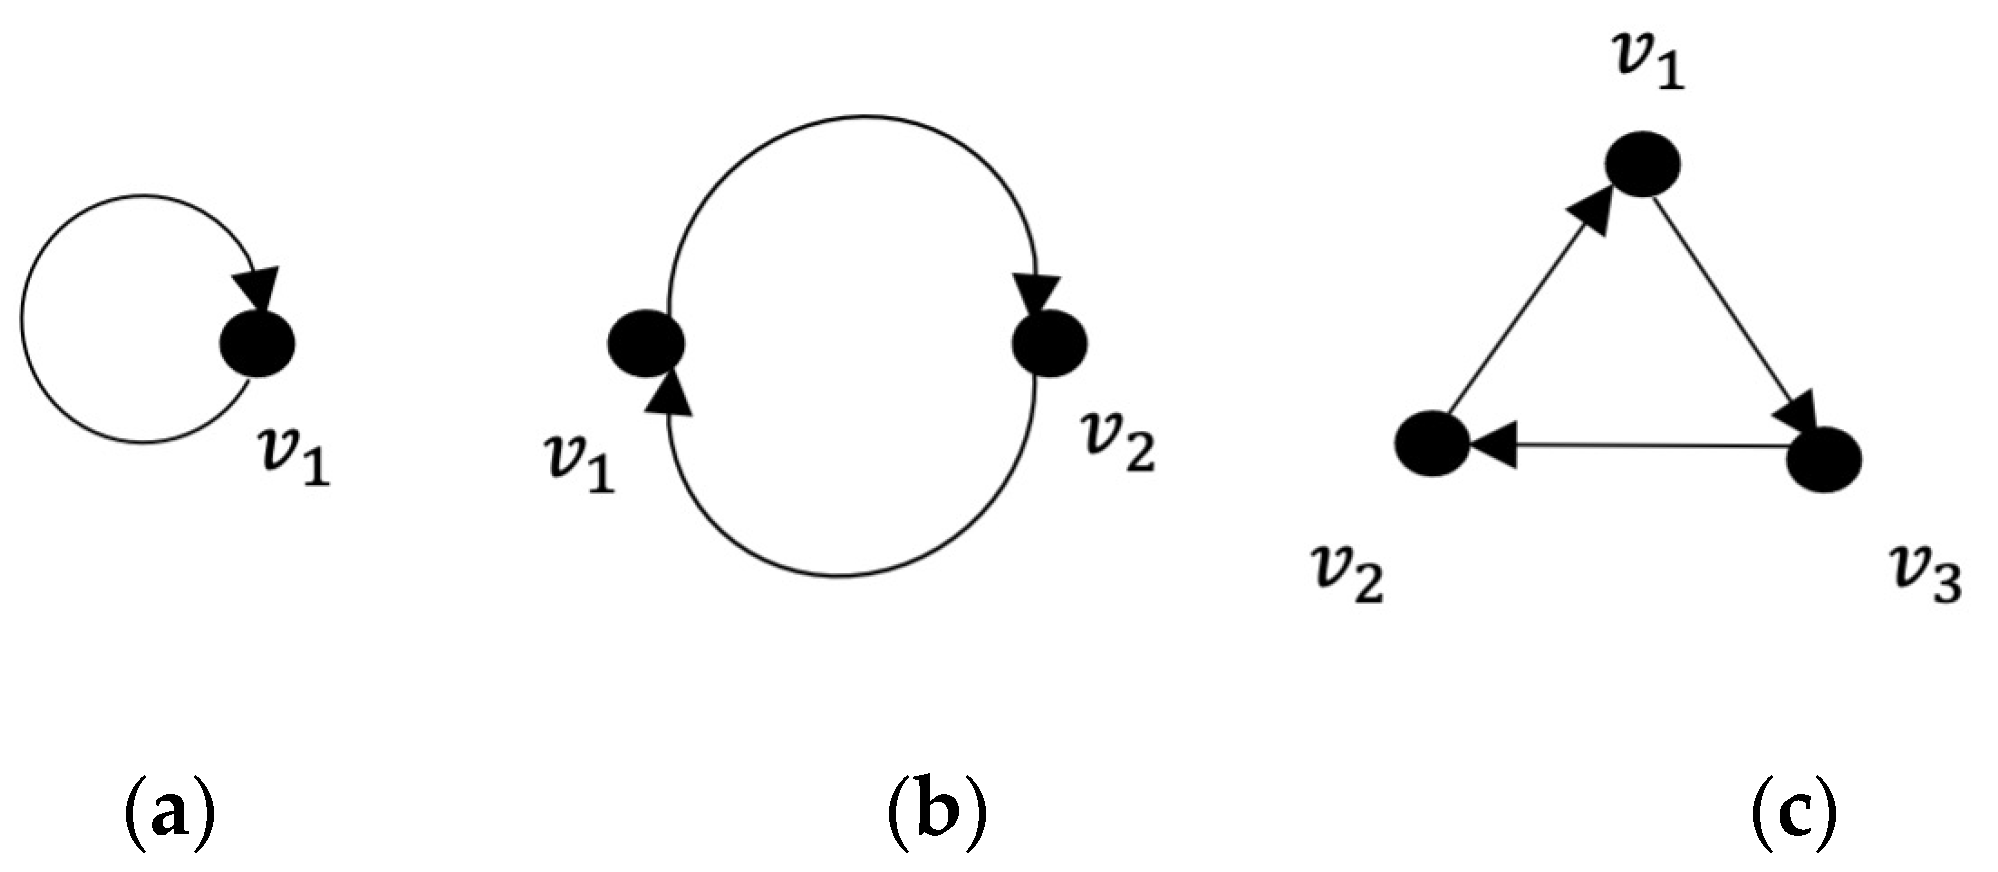
Some examples of ACS with 1-cycle, 2-cycles, and 3-cycles are illustrated in Figure 2. They are cyclic graphs because each graph has a closed path, i.e., there exists a path that begins and ends at the same vertex.
A graph with v nodes is completely specified by a v × v matrix, A ( G ) = ( a i j ) , which is called an adjacency matrix of the graph.
Definition 2
([17]). An adjacency matrix of a graph  G = G ( V , E ) with v nodes is a v × v matrix, denoted by A ( G ) = ( a i j ) , where a i j = 1 if E contains a directed link ( j , i ) (arrow pointing from node j to node i ), and a i j = 0  otherwise.
Below are some examples of the adjacency matrices drawn from the examples of ACS illustrated in Figure 2.
( 1 ) ( 0 1 1 0 ) ( 0 1 0 0 0 1 1 0 0 )
(a)(b)(c)
Furthermore, the relationship between ACS and Perron–Frobenius eigenvalue, λ 1 is given by the following Theorem 1. Eventhough the property has been casually mentioned in [18]; therefore, we take the pleasure to prove it here.
Theorem 1.
An ACS should consist of a closed walk. Therefore, the most dominant eigenvalue, λ 1 , possess the following:
  • λ 1 1 if a graph has an ACS.
  • λ 1 = 0 if a graph has no ACS.
Proof. 
Suppose G is an ACS with adjacence matrix C G = ( a 11 a 12 a 1 n a n 1 a n 2 a n n ) . Next, consider a sequence a non-zero entries of C G , a α β 0 , such that a i j a s i a t s a p l a j p . Notice
a i j indicates link from j to i,
a s i indicates link from i to s,
a t s indicates link from s to t,
a p l indicates link from l to p,
a j p indicates link from p to j.
All the above links are connected, and the path starts and ends at the same vertex; thus, the sequence in the form of a i j a s i a t s a p l a j p is a cycle or a closed walk.
Now, since G is a cycle graph, the set of its eigenvalues (spectrum), S ( G ) , is given by [18], that is
S ( G ) = { λ i : λ i = 2 c o s ( 2 π i n ) ,   i = 0 , 1 , 2 , , n 1 } .
Firstly,
| c o s ( 2 π i n ) | 1 for i = 0 , 1 , 2 , , n 1 .
If that the case,
1 | 2 c o s ( 2 π i n ) | 2 for i = 0 , 1 , 2 , , n 1 .
Now, if λ 1 is assigned as the most dominant eigenvalue for i = 0 , 1 , 2 , , n 1 , therefore,
λ 1 1 .
In other words,
an ACS should consist of a closed walk, then λ 1 1 that is statement (i).
For statement (ii), takes the contrapositive of (i), namely,
if λ 1 < 1 , then the graph has no closed walk, hence is not an ACS.
In particular, λ 1 = 0 , then the graph has no closed walk, hence is not an ACS that is the statement (ii) exactly. □
The concept of “fuzzy graph” was introduced by Rosenfeld [11] as a graph that incorporates fuzziness. The new concept of a fuzzy graph has caught the attention of many researchers, such as Sameena [19] who introduced a clustering method based on the connectedness concept in a fuzzy graph. Figure 3 illustrates a fuzzy graph. The formal definition of fuzzy graph and its adjacency matrix for the fuzzy graph are as follows.
Definition 3
([11]). A fuzzy graph  G = ( σ , μ ) is a pair of functions  σ : S [ 0 , 1 ] and  μ : S × S [ 0 , 1 ] x , y S , μ ( x , y ) σ ( x ) σ ( y ) .
Definition 4
([11]). An adjacency matrix, A of a fuzzy graph G = ( V , σ , μ ) is an n × n matrix defined as A = ( a i j ) such that a i j = μ ( v j , v i ) .
The adjacency matrix for the fuzzy graph in Figure 3 is
A = ( 0 0 1 0 0.7 0 0 0 0 0.5 0 0 0 0 0.2 0 )

2.2. Fuzzy Autocatalytic Set

In 2010, Ahmad et al. [10] introduced a novel mathematical concept called fuzzy autocatalytic set. The researchers incorporated fuzzy graph with an autocatalytic set to form fuzzy autocatalytic set (FACS) to model a clinical waste incineration process, whereby the edges of the graph have fuzzy membership values. The formal definition of FACS is as follows.
Definition 5
([10]). A fuzzy autocatalytic set is a subgraph each of whose nodes has at least one incoming link with membership value  μ ( e i ) ( 0 , 1 ] , e i E .
The following theorem is trivial, and the proof can be referred in [10]. However, we reinstate the proof here again for benefit of the readers.
Theorem 2
([10]). Every crisp graph is a fuzzy graph.
Proof. 
Suppose G ( V , E ) is a crisp graph. It can be considered as G ( σ , μ ) which is a pair of function σ : V { 0 , 1 } and μ : V × V { 0 , 1 } . It immediately fulfils the definition of fuzzy graph given by Rosenfeld [11] as well as the definition given by Yeh and Bang [20] since { 0 , 1 } [ 0 , 1 ] . □
Theorem 3
([10]). Every autocatalytic set is a fuzzy graph.
Theorem 4
([10]). Every fuzzy autocatalytic set is also a fuzzy graph.
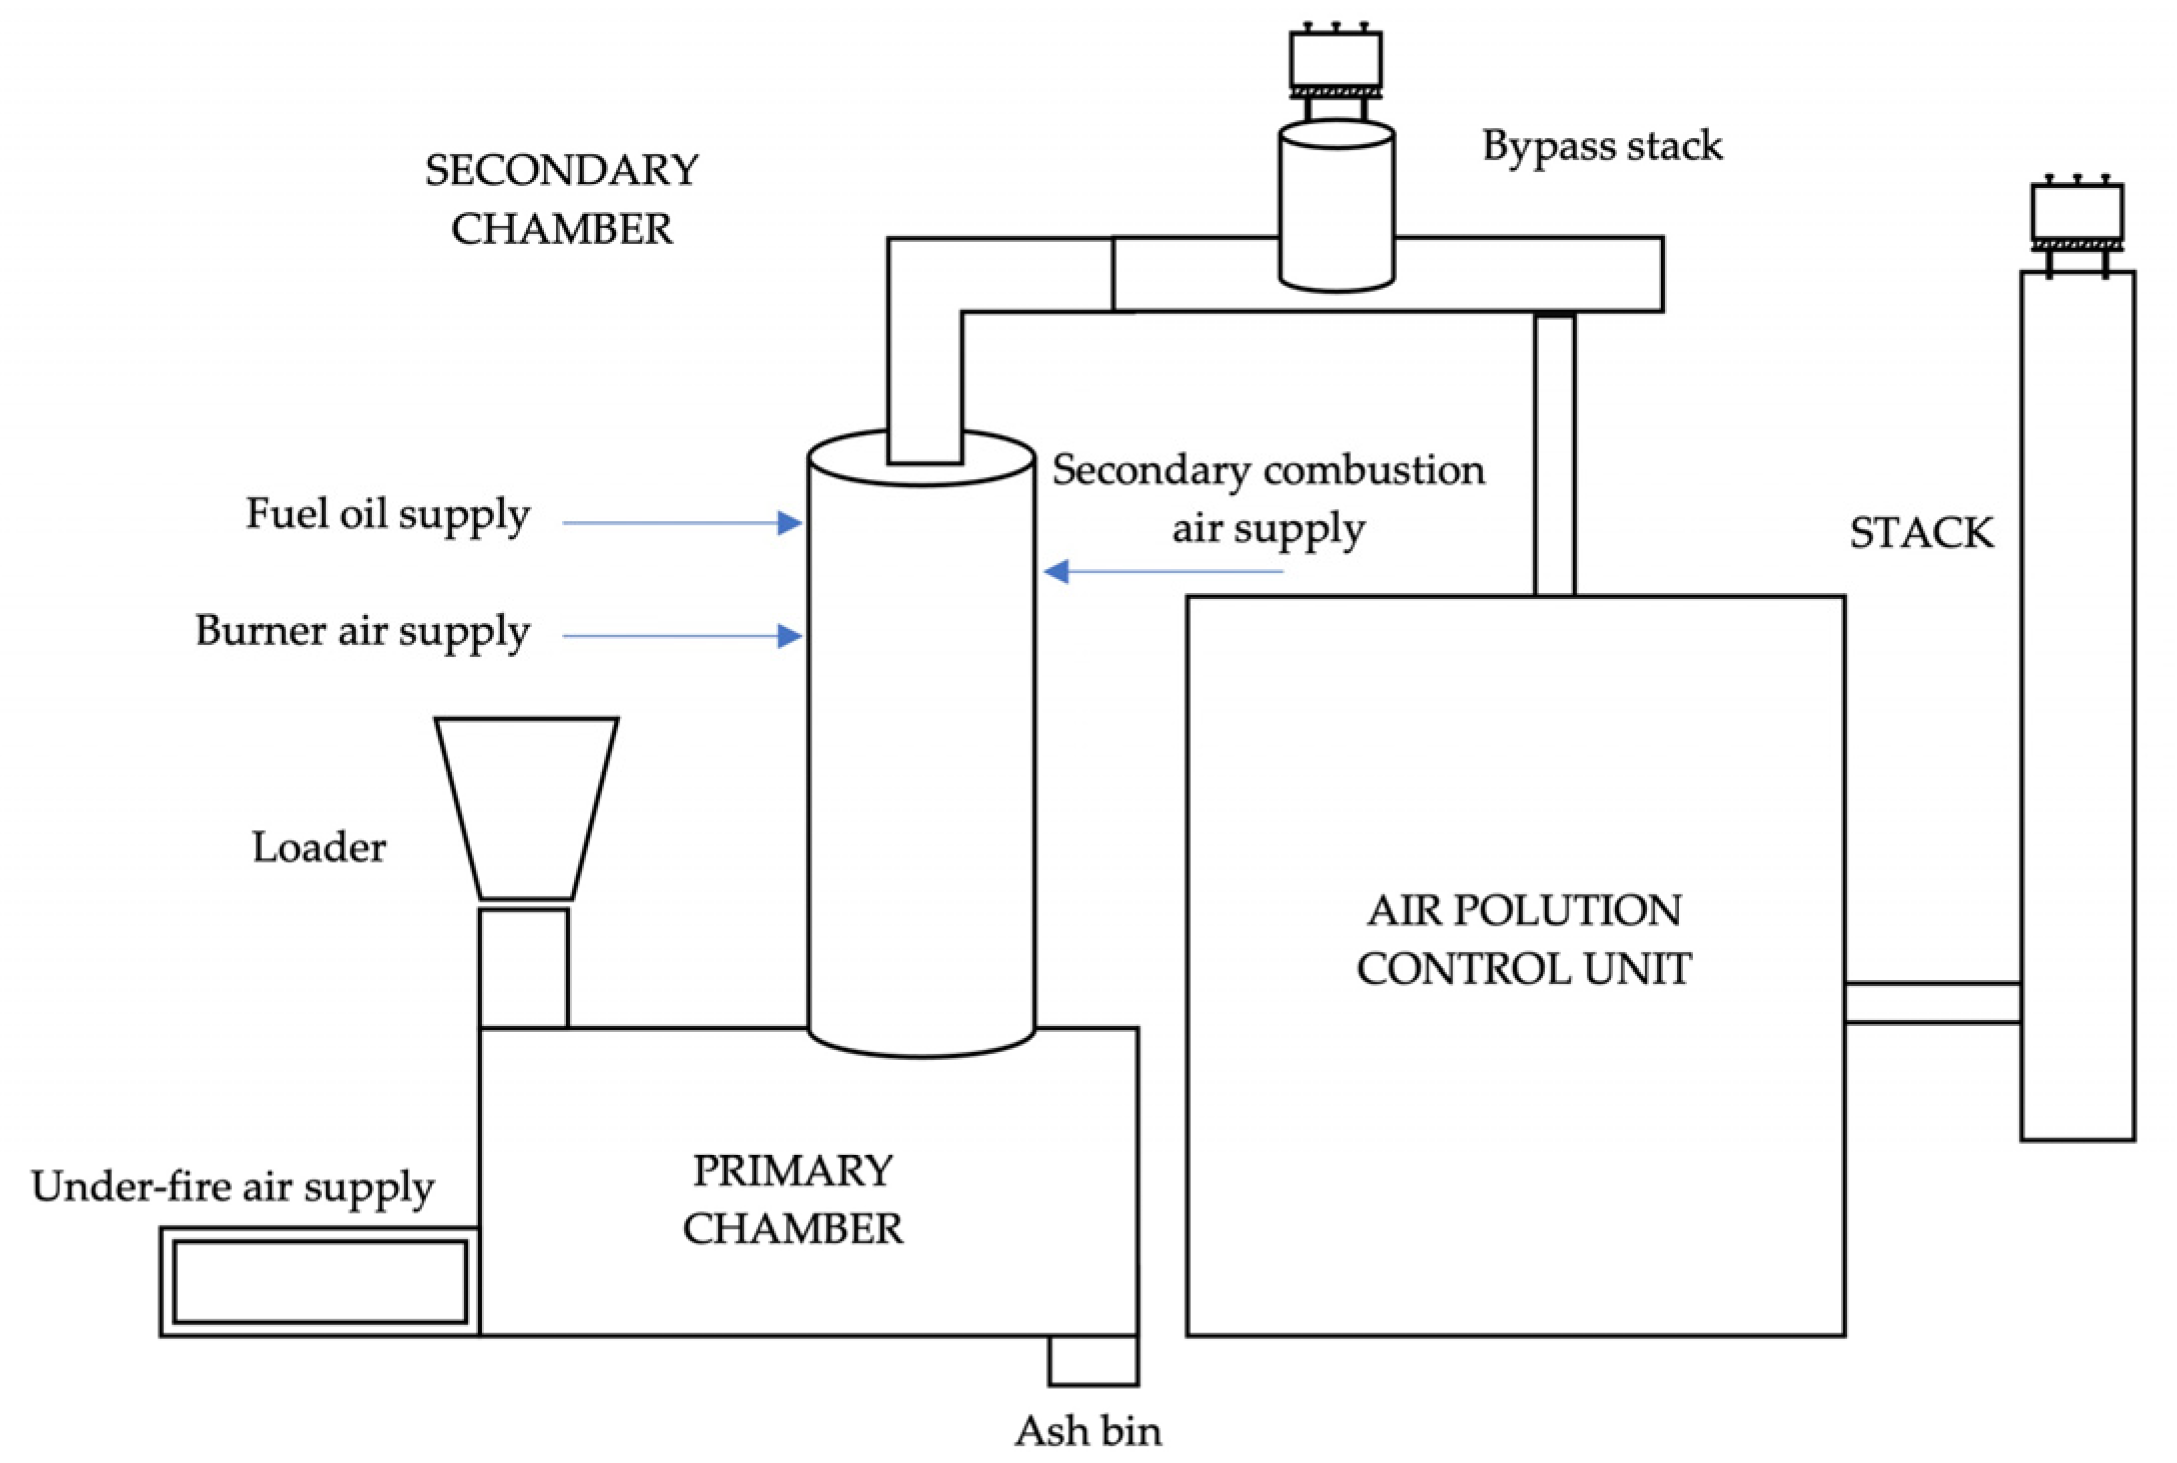
The FACS have been widely used to model various systems. For example, Ahmad et al. [10] implemented FACS for a clinical waste incineration process. Clinical waste can be incinerated to eliminate any dangerous components while also lowering the volume of the waste and leaving just ash for disposal. Figure 4 showed a schematic diagram of a district clinical waste incinerator facility in Malacca.
The formal definition of FACS for a clinical waste incinerator system in Figure 4 is as follows.
Definition 6
([10]). Let  e i E . The fuzzy head of  e i denotes as  h ( e i ) and the tail  t ( e i ) are functions of  e i such that  h : E [ 0 , 1 ] and  t : E [ 0 , 1 ] for  e i E . A fuzzy edge connectivity is a tuple  ( t ( e i ) ,   h ( e i ) ) and the set of all fuzzy edge connectivity is denoted as  C = { ( t ( e i ) ,   h ( e i ) ) : e i E } .
The fuzzy tail value, t ( e i ) is equal to 1 since each variable was taken as a whole before it evolved to other variables. However, the fuzzy head value h ( e i ) is taken in the interval of ( 0 , 1 ) due to the strength of connection or reaction with another variable. Therefore, the membership value for fuzzy edge is defined as follows:
μ ( e i ) = min { t ( e i ) ,   h ( e i ) }
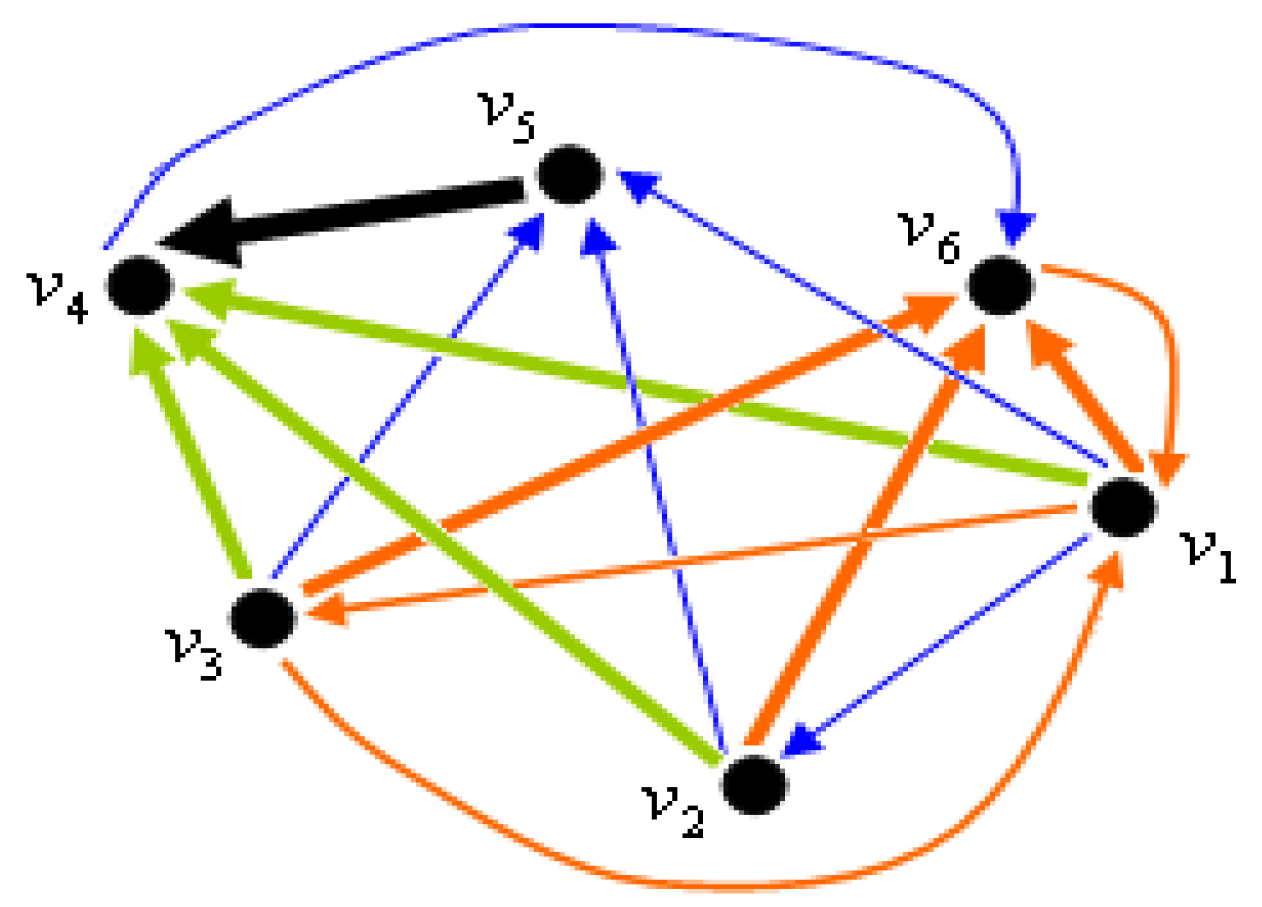
The thickness represents the connectivity strength between vertices and the colour of the edges denotes different ranges of membership values for the fuzzy edge connectivity (see Figure 5).
Since every vertex of an ACS must have an incoming edge or link, FACS is guaranteed to have a cycle. This feature is stated formally as Theorem 5.
Theorem 5
([10]). If  G is a FACS with adjacency matrix
A ( G ) = ( a 11 a 12 a 1 n a n 1 a n 2 a n n )
and for each α = 1 ,   2 ,   ,   n there exist β α ,   β = 1 ,   2 ,   ,   α 1 ,   α + 1 ,   ,   n such that a α β 0 , then a i j   a s i   a t s   a p l   a j p is a cycle.
Surprisingly, the FACS fulfils the Perron–Frobenius Theorem, in particular regarding the Perron–Frobenius Eigenvalues (PFE). This property is stated formally as Theorem 6.
Theorem 6
([10]). If a graph is a FACS, then  λ 1 > 0 .
The FACS’s adjacency matrix is a square matrix, A = [ a i j ] , with entries representing membership values ranging from 0 to 1. The procedure involves computing the matrix’s Perron–Frobenius eigenvalues and eigenvectors. The smallest value of the Perron–Frobenius eigenvector is identified and removed from the system. In other words, the graph dynamic procedure removes the insignificant elements until 2 × 2 matrix is obtained.
In addition, numerous researchers have studied the properties and different types of FACS. Liew et al. [21] composed FACS into an omega algebra to generate a transformation semigroup of it. Furthermore, Liew et al. [22] introduced FACS as a category and revealed several types of morphisms. Ashaari et al. [12] modelled their secondary system of a pressurized water reactor using FACS and showed the obtained model of the system was better than the crisp graph model. Ahmad et al. [13] investigated the mathematical structure of FACS that has led to the visualization of it in ordinary Euclidean space and named their procedure coordinated FACS. Qasim and Ahmad [23] further introduced the normed space for FACS of fuzzy graph Type-3. Since there is a possibility of a weak form of ACS whereby it may contain a vertex with no incoming link, the condition has spurred Mamat et al. [24] to define two new concepts of ACS, namely weak autocatalytic set (WACS) and fuzzy weak autocatalytic set (FWACS). Many researchers have been drawn to use FACS in complex systems ever since due to its unique feature. For example, Hassan et al. [14] created a chemometric fuzzy autocatalytic set (c-FACS) for gelatine authentication purposes. The c-FACS can identify the bovine, porcine, and fish gelatine signatures and their distinct features. Ashaari et al. [25] used FACS to model their palm oil refining process. Their FACS were able to identify the desired and undesired compounds during the process. The researchers’ contributions to ACS and FACS are summarised in Table 1.

3. Materials and Methods

3.1. Multidigraph Autocatalytic Set (MACS)

Multiple directed graphs or multidigraphs are widely available in the literature. It is an ordinary graph but with multiple directed edges between any pair of its vertices. The formal definition of a multidigraph is as follows:
Definition 7
([26]). A multidigraph  G is a nonempty set of vertices whereby every two of its vertices are joined by a finite number of directed edges. The multidigraph  G can be expressed as  G = ( V ,   E ) where  V is a nonempty set of vertices and  E   is a set of directed edges between a pair of its vertices in  V .
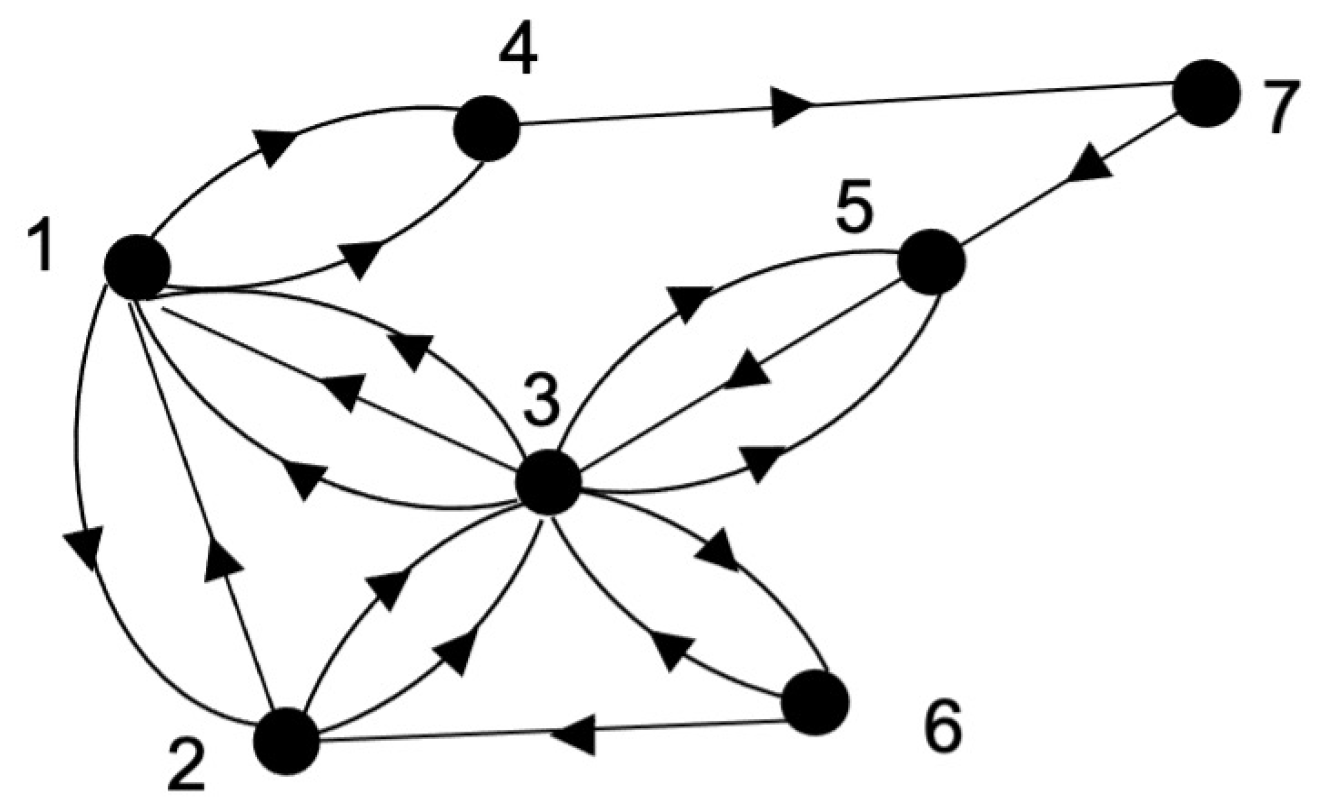
An example of a multidigraph is shown in Figure 6.
A new form of autocatalytic set, namely, multidigraph autocatalytic set (MACS) is defined formally now.
Definition 8.
A multidigraph autocatalytic set (MACS) is an autocatalytic set that allows multiple directed edges between any pair of its vertices.
A MACS that contains an incoming link at each vertex is shown in Figure 7a. On the other hand, a multidigraph that has no incoming link to at least one of its vertices is a non-autocatalytic (see Figure 7b).
Both multidigraphs in Figure 7 are not cyclic as well.

3.2. MACS’s Adjacency Matrix

The crucial thing about MACS is how one defines its adjacency matrix. It is not as straightforward as ACS since the former allows multiple directed edges between any pair of its vertices. Here, we adopt Barik and Sahoo [27] form of adjacency matrix for the purpose.
Definition 9.
Let  G ( V , A ) be a MACS with  V = { 1 ,   2 ,   3 ,   ,   n } . Let  f i j and  b i j denote the number of directed edges from  i to  j and  j to  i , respectively. Then the complex adjacency matrix  A M A C S ( G ) of  G is a  n × n matrix  A M A C S ( G ) = [ a i j ] whose entries are defined as
a i j = f i j + b i j 2 + f i j b i j 2 i
The MACS’s complex adjacency matrix is further discussed in the following examples which are Example 1 and Example 2. Example 1 illustrates how one calculates an entry for a MACS’s matrix. Example 2 demonstrates a MACS, its adjacency matrix, its eigenvalues and its eigenvectors.
Example 1.
Consider the multidigraph  G   in Figure 7a. The MACS’s adjacency matrix of  G   is given as follows.
A M A C S ( G ) = ( 0 3 2 1 2 i 0 3 2 + 1 2 i 0 3 2 + 3 2 i 0 3 2 3 2 i 0 )
In particular, a 12 and a 23 , are determined as follows.
a 12 = f 12 + b 12 2 + f 12 b 12 2 i = 1 + 2 2 + 1 2 2 i = 3 2 1 2 i a 23 = f 23 + b 23 2 + f 23 b 23 2 i = 3 + 0 2 + 3 0 2 i = 3 2 + 3 2 i
Lemma 1.
The adjacency matrix for a MACS is
A M A C S ( G ) = [ c i j ] = { α + β i     f o r   i j               | e i i |         f o r   i = j         α β i     f o r   j i              
whereby α ,   β and | e i i | is the number of self-loops.
Proof. 
Consider 2 arbitrary vertices of a MACS, v i and v j such that the number of directed edges from v i to v j is f i j = m , the number of directed edges from v j to   v i is b i j = n , the number of self-loops at v i is | e i i | and the number of self-loops at v j is | e j j | .
Mathematics 11 00912 i001
Therefore, by employing (1) of Definition 9,
c i j = f i j + b i j 2 + f i j b i j 2 i = m + n 2 + m n 2 i = α + β i   ,
c j i = f j i + b j i 2 + f j i b j i 2 i = n + m 2 + n m 2 i = m + n 2 m n 2 i = α β i   ,
c i i = | e i i | + | e i i | 2 + | e i i | | e i i | 2 i = 2 | e i i | 2 = | e i i | and
c j j = | e j j | + | e j j | 2 + | e j j | | e j j | 2 i = 2 | e j j | 2 = | e j j | .
Hence,
A M A C S ( G ) = [ c i j ] = { α + β i   f o r   i j   | e i i |   f o r   i = j   α β i   f o r   j i  
whereby α ,   β and | e i i | is the number of its self-loops. □
MACS produces a complex adjacency matrix that contains the real and imaginary parts.
Theorem 7.
Let  G ( V , A ) be a MACS, then, A M A C S ( G ) is a Hermitian matrix.
Proof. 
Let  G ( V , A ) be a MACS and  A M A C S ( G ) = ( a 11 a 12 a 1 n a n 1 a n 2 a n n ) .
Now,
A M A C S ( G ) = ( a 11 a 12 a 1 n a n 1 a n 2 a n n ) However ,   by   Lemma   1   then   we   have ,   = ( | e 11 |   α 12 β 12 i α 12 + β 12 i | e 22 |   α 1 ( n 1 ) + β 1 ( n 1 ) i α 2 ( n 1 ) + β 2 ( n 1 ) i α 1 n + β 1 n i α 2 n + β 2 n i α 1 ( n 1 ) β 1 ( n 1 ) i α 1 n β 1 n i α 2 ( n 1 ) β 2 ( n 1 ) i α 2 n β 2 n i | e ( n 1 ) ( n 1 ) |   α ( n 1 ) n β ( n 1 ) n i α ( n 1 ) n + β ( n 1 ) n i | e n n | ) = ( A M A C S ( G )   ) T ¯ .
Hence, A M A C S ( G ) is a Hermitian matrix since A M A C S ( G ) = ( A M A C S ( G )   ) T ¯ . □
The following lemma and theorem associated with MACS are generated.
Lemma 2.
Let  A M A C S ( G ) is a Hermitian matrix for graph G that is MACS, then
( A M A C S ( G )   ) T ¯ T = A M A C S ( G ) ¯
Proof. 
Let A M A C S ( G ) = [ a + b i ] i j . Therefore, A MACS ( G ) ¯ = [ a b i ] i j .
Then,
( A M A C S ( G )   ) T = [ a + b i ] j i and ( A M A C S ( G )   ) T ¯ = [ a b i ] j i .
Hence, ( A M A C S ( G )   ) T ¯ T = [ a b i ] i j = A M A C S ( G ) ¯ . □
Even though MACS’s complex adjacency matrix is a complex matrix; however, it yields real eigenvalues.
Theorem 8.
Let  G ( V , E ) be a MACS, then  d e t ( A M A C S ( G ) ) .
Proof. 
Let G ( V , E ) be a MACS. Therefore, A M A C S ( G ) = ( A M A C S ( G )   ) T ¯ .
Look,
d e t ( A M A C S ( G ) ) = d e t ( A M A C S ( G )   ) T ¯ since A M A C S ( G ) is a Hermitian matrix
= d e t ( ( A M A C S ( G )   ) T ¯ ) T since d e t A = det A T
= det A M A C S ( G ) ¯ by lemma 2.
It is only possible when only d e t ( A M A C S ( G ) ) . □
Thus, all eigenvalues obtained from A M A C S ( G ) must be reals too.
Corollary 1.
All eigenvalues of  A M A C S ( G ) are reals.
Proof. 
Let A M A C S ( G ) = [ a + b i ] i j = [ a ] i j + i [ b ] i j .
Therefore, ρ ( λ ) = d e t ( A M A C S ( G ) λ I )
= d e t ( [ a λ I ] i j + i [ b ] i j ) since λ I is a real matrix
= d e t ( B M A C S ( G ) ) by letting B M A C S ( G ) = [ a λ I ] i j + i [ b ] i j .
using Theorem 7.
Therefore, all eigenvalues of A M A C S ( G ) , namely, λ 1 , λ 2 , λ 3 , , λ n 1 , λ n   are reals.  
Since A M A C S ( G ) is Hermitian and is a complete ordered field; therefore, all its eigenvalues are reals and ordered as well, i.e., λ 1 > λ 2 > λ 3 > > λ n 1 > λ n , where the index can be rearranged when necessary. This immediately implies λ 1 { λ i : i = 1 , 2 , 3 , , n } λ 1 > λ 2 > λ 3 > > λ n 1 > λ n .
Theorem 9.
R e ( A M A C S ( G ) ) n > 0 ,   n .
Proof. 
(by mathematical induction)
Consider the statement P n :   R e ( A M A C S ( G ) ) k > 0 .
Let A M A C S ( G ) = [ a + b i ] i j = [ a ] i j + i [ b ] i j .
(i) P 1
( A M A C S ( G ) ) 1 = ( [ a ] i j + i [ b ] i j ) 1 = [ a ] i j + i [ b ] i j .
R e ( A M A C S ( G ) ) = [ a ] i j > 0 since G is a MACS.
Therefore, P 1 is true.
(ii) P n P n + 1
Assume P n :   R e ( A M A C S ( G ) ) n > 0 is true.
Now,
( A M A C S ( G ) ) n + 1 = ( [ a ] i j + i [ b ] i j ) n + 1 = ( [ a ] i j + i [ b ] i j ) ( [ a ] i j + i [ b ] i j ) ( [ a ] i j + i [ b ] i j ) n   t i m e s = ( [ a ] i j + i [ b ] i j ) [ R e ( A M A C S ( G ) ) n + I m ( A M A C S ( G ) ) n ] = [ [ a ] i j R e ( A M A C S ( G ) ) n + [ a ] i j i [ c ] i j + i [ b ] i j R e ( A M A C S ( G ) ) n [ b ] i j [ c ] i j ]
by taking I m ( A M A C S ( G ) ) n = i [ c ] i j
= [ [ a ] i j R e ( A M A C S ( G ) ) n [ b ] i j [ c ] i j R e ( A M A C S ( G ) ) n + 1 + i ( [ a ] i j [ c ] i j + [ b ] i j R e ( A M A C S ( G ) ) n ) I m ( A M A C S ( G ) ) n + 1 ]
since R e ( A M A C S ( G ) ) n > 0 by assumption.
In other words,
( A M A C S ( G ) ) n + 1 = [ s ] i j + i [ t ] i j for some [ s ] i j , [ t ] i j M ( ) n .
Using one of the properties of eigenspace, that is
A v = λ v A k v = λ k v   for   k
therefore
( A M A C S ( G ) ) n + 1 v = [ s ] i j v + i [ t ] i j v = λ n + 1 v > 0   [ s ] i j = R e ( A M A C S ( G ) ) n + 1 > 0
If that is the case, P n + 1 is also true.
Hence, R e ( A M A C S ( G ) ) n > 0 ,   n . □
Example 2.
An example of a MACS is shown in Figure 8 and followed by its respective complex adjacency matrix.
The complex adjacency matrix for G ( V , A ) is then determined such that
A M A C S ( G ) = ( 0 4 i 2 0 4 + i 0 1 + i 0 2 1 i 0 3 2 i 2 0 0 3 2 + i 2 0 ) = ( 0 4 2 0 4 0 1 0 2 1 0 3 2 0 0 3 2 0 ) + ( 0 1 0 0 1 0 1 0 0 1 0 1 2 0 0 1 2 0 ) i
The A M A C S ( G ) is a complex adjacency matrix that contains its real and imaginary parts. The eigenvalues of A M A C S ( G ) are −4.3093, −1.9298, 0.9699, and 5.2692, and their corresponding eigenvectors are ( 0.3752 + 0.6026 i 0.4185 0.5071 i 0.2250 0.0750 i 0.0870 ) , ( 0.1098 + 0.1345 i 0.3127 0.1002 i 0.6813 + 0.2271 i 0.5884 ) ,   ( 0.2282 0.0197 i 0.2862 + 0.0006 i 0.4615 0.1538 i 0.7931 ) and ( 0.6375 0.0840 i 0.6049 + 0.1097 i 0.4150 0.1383 i 0.1313 ) respectively.

3.3. MACS and Perron–Frobenius Theorem

The next stage is to establish MACS possessing the Perron–Frobenius Theorem as ACS in [9] and FACS in [10]. This is crucial to adopt and modify the algorithm developed by Ahmad et al. [10] so that it can be used for MACS as well without hesitation.
There are several definitions that are needed to be reinstated here. It starts with the notion of dominant eigenvalue.
Definition 10
([28]). We say  λ 1 is a dominant eigenvalue of a matrix  A n , n if it is the largest modulus in modulus eigenvalue, i.e.,  | λ 1 | > | λ i | , i = 2 , 3 , , n , so that  | λ 1 | = ρ ( A ) .
The relation between the dominant eigenvalue and the Perron–Frobenius theorem is spelled in the following Definition 11.
Definition 11
([29]). A matrix  A n , n possesses the Perron–Frobenius property if its dominant eigenvalue  λ 1 is positive and the corresponding eigenvector x ( 1 ) is nonnegative.
The matrix A n , n can also possess the strong Perron–Frobenius property if it satisfies the three conditions stated in Definition 12.
Definition 12
([29]). A matrix  A n , n possesses the strong Perron–Frobenius property if its dominant eigenvalue  λ 1 is positive, simple  ( λ 1 > | λ i | , i = 2 , 3 , , n ) and the corresponding eigenvector  x ( 1 ) is positive.
There are also complex Perron–Frobenius and strong complex Perron–Frobenius properties defined in the following Definition 13 and Definition 14, respectively.
Definition 13
([29]). A matrix  A n , n possesses the complex Perron–Frobenius property if its dominant eigenvalue  λ 1 is positive and its corresponding eigenvector  x ( 1 ) can be chosen so that  R e x ( 1 ) 0 . i.e., if  x ( 1 ) = [ x 1 ( 1 ) x 2 ( 1 ) x n ( 1 ) ] T , then R e x j ( 1 ) 0 for all  j = 1 , 2 ,   , n .
Definition 14
([29]). A matrix  A n , n possesses the strong complex Perron–Frobenius property if its dominant eigenvalue  λ 1 is positive, simple, with  λ 1 > | λ i | , i = 2 , 3 , , n , and for the corresponding eigenvector x ( 1 ) , there holds: R e x ( 1 ) > 0 , i.e., R e x j ( 1 ) > 0 for all  j = 1 , 2 ,   , n .
The next theorem is needed to establish the sufficient and necessary conditions for our intended MACS algorithm.
Theorem 10
([29]). For a matrix  A n , n , the following properties are equivalent:
(i)
Both matrices A and A H possess the strong Perron–Frobenius property.
(ii)
There exists an integer k 0 > 0 such that R e ( A k ) > 0 for all k k 0 and for the eigenvalues of A hold | λ 1 | > | λ i | , i = 2 , 3 , , n .
All results obtained in the previous section are now ready to be assembled to prove the final important theorem for MACS that is stated and proved formally.
Theorem 11.
A MACS  G ( V , E )   with its adjacency matrix
A M A C S ( G ) = [ c i j ] = { α + β i     f o r   i j               | e i i |         f o r   i = j         α β i     f o r   j i              
with α ,   β and | e i i | is the number of self-loops, then A M A C S ( G ) possesses the strong Perron–Frobenius property.
Proof. 
Let G ( V , E )   be   a   MACS with an adjacency matrix as given in (2).
Theorem 8 guarantees A M A C S ( G ) is a Hermitian matrix. All its eigenvalues of A M A C S ( G ) , namely, λ 1 , λ 2 , λ 3 , , λ n 1 , λ n   are reals by Corollary 1, i.e., λ 1 , λ 2 , λ 3 , , λ n 1 , λ n   .
Since A M A C S ( G ) is Hermitian and is a complete ordered field; therefore, all its eigenvalues are reals and ordered as well, i.e., λ 1 > λ 2 > λ 3 > > λ n 1 > λ n , where the index can be rearranged when necessary.
(i)
This immediately implies λ 1 { λ i : i = 1 , 2 , 3 , , n } λ 1 > λ 2 > λ 3 > > λ n 1 > λ n .
(ii)
Furthermore, R e ( A M A C S ( G ) ) n > 0 ,   n by Theorem 9.
However, then, A M A C S ( G ) = ( A M A C S ( G ) ) H by Lemma 2.
The above two items are the necessary and sufficient conditions for A M A C S ( G ) = ( A M A C S ( G ) ) H to be equivalent to the strong complex Perron–Frobenius property guaranteed by Theorem 10. □

3.4. MACS Graph Algorithm (MACSGA)

A new algorithm involving a graph of MACS is constructed in this section. The MACS Graph Algorithm (MACSGA) is developed to assist the modelling procedure for MACS. In general, a MACS’s adjacency matrix, A M A C S ( G ) is the input of this algorithm. The output is the 2 × 2 matrix. The MACSGSA algorithm is outlined as follows (Algorithm 1).
Algorithm 1: The MACS graph algorithm (MACSGA)
1.Identify a given system as a multidigraph autocatalytic set, G ( V , E ) and determine its set of vertices V = { v 1 ,   v 2 ,   v 3 , ,   v n } for i = 1 , 2 , 3 , , n and its set of multiple directed edges, E = { e 1 , e 2 , e 3 , ,   e m } for j = 1 , 2 , 3 , , m .
2.Determine the complex adjacency matrix A M A C S ( G ) of the G ( V , E )   as defined by (1) in Definition 9.
3.Calculate the dynamic concentration for each variable,
x i = j = 1 n a i j x j x i j , k = 1 n a i j x j .
Variable x i is evolved with time t . The variable x i is large enough to get close to the Perron–Frobenius eigenvector, Χ as denoted by Χ i x i ( t ) .
(At this stage A M A C S ( G ) possesses the strong complex Perron–Frobenius property guaranteed by Theorem 11).
4.Determine the lowest value of Χ i for Perron–Frobenius eigenvector (PFE) from;
V = { i A | X i = min j A X j , A = { 1 , 2 , 3 , , n } } .
The vertex that has the lowest PFE value is removed from graph G . Hence, the resultant graph contains n 1 vertices.
5.Determine the new adjacency matrix for the updated graph G .
6.Repeat Step 4 and Step 5 for the new multidigraph G until a matrix with dimension 2 × 2 is produced.

3.5. MACS’s Implementation and Results

A published system with its respective data by Iggidr et al. [30] is used to show the MACS’s capability, reliability, and efficiency. The researchers studied the effect of human movements on the dynamics of a vector-borne disease. They proposed that the migration of human hosts can have a significant impact on the epidemiological dynamics in locations where there are extensive movements such as large urban transit networks which enable extensive host movements. Therefore, hosts can become sick or infect others in areas that are geographically remote from where they normally reside, and the pattern of movement should be a key factor in the dynamics of the disease. Iggidr et al. [30] applied the Bailey–Dietz model that presents a consistent derivation of a multigroup model for urban environments. The model also identified which district favours the endemic based on its basic reproduction number, R 0 . Two equilibrium-related intervals are identified: (i) if R 0 1 , then it is a disease-free equilibrium (DFE), and (ii) when R 0 > 1 , it is an endemic equilibrium. The identified reproduction numbers, R 0 for eight districts in the city of Rio de Janeiro, Brazil, are listed in Table 2.
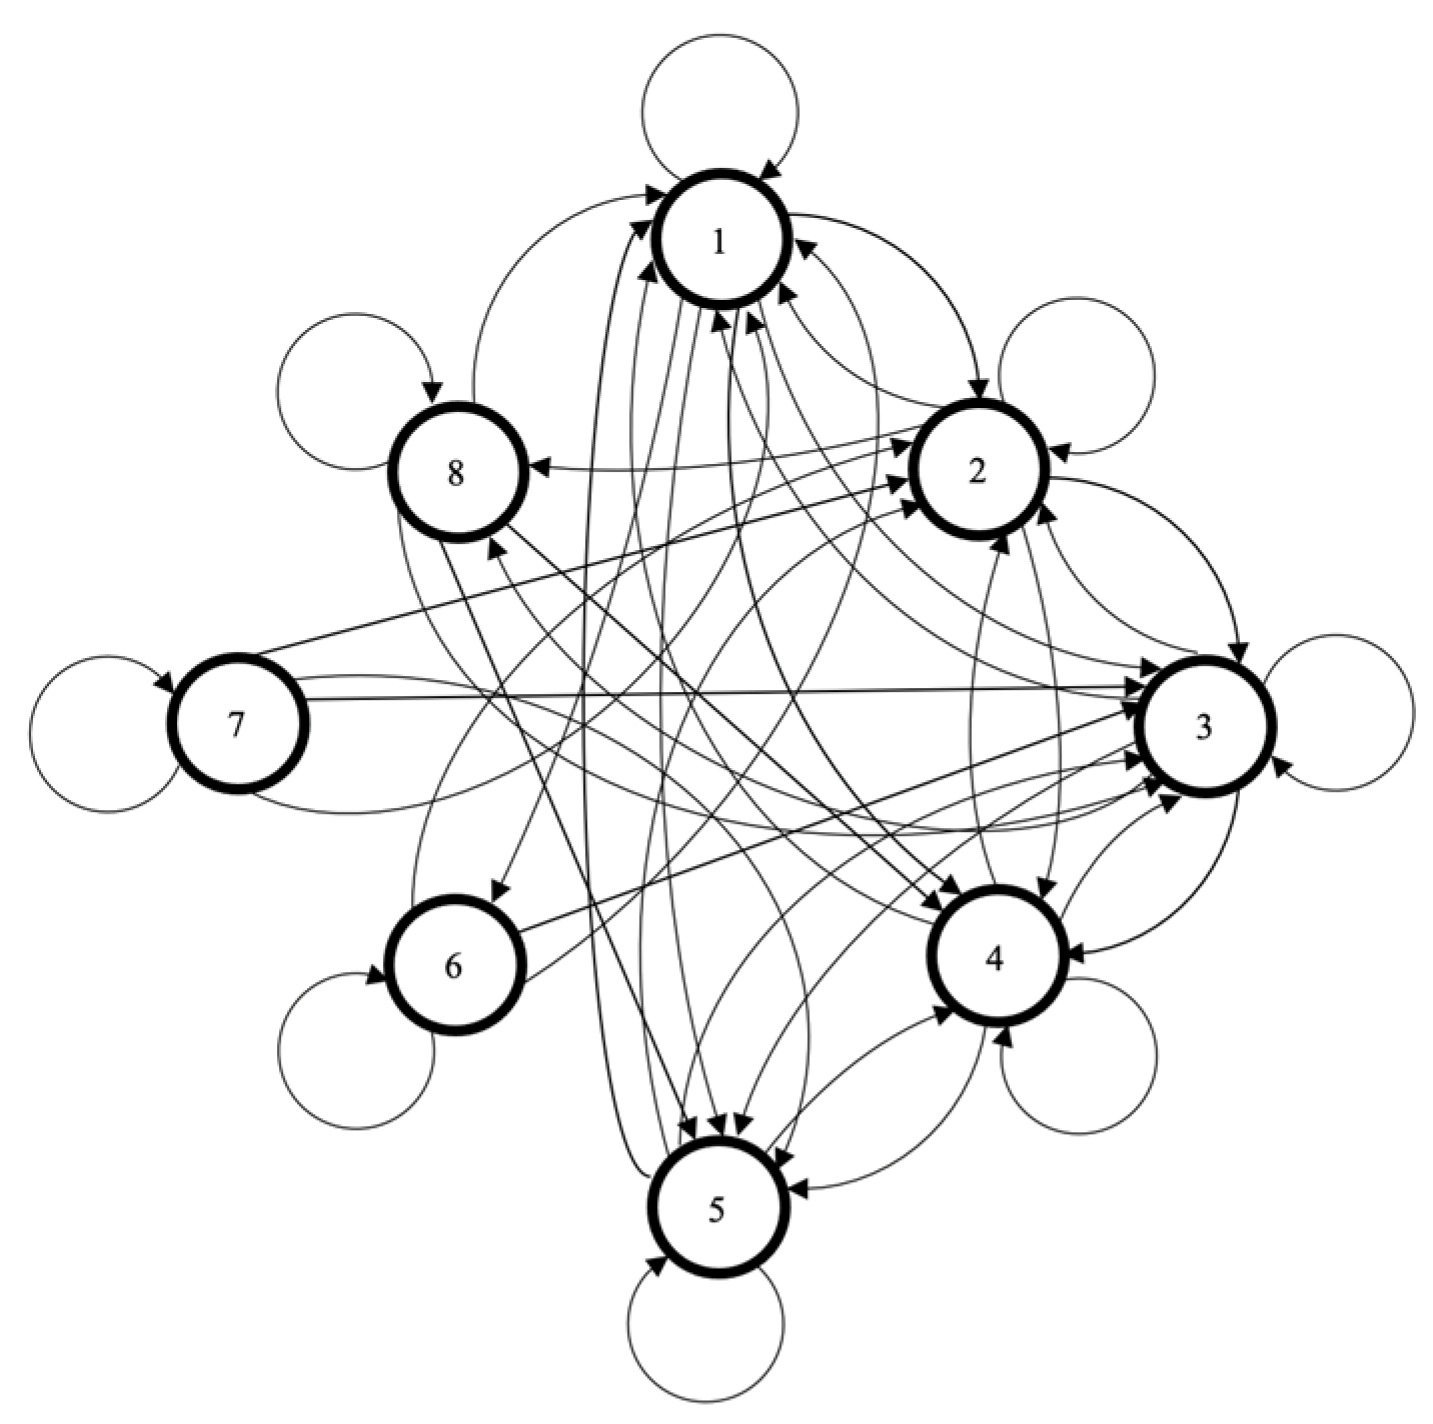
However, in this work, the dynamic of the disease is analysed using the developed MACS algorithm and its graph G is shown in Figure 9. The vertices represent the identified districts, namely, Centro (1), Sul (2), Norte (3), Oeste (4), Baixada (5), Niteroi (6), Mage (7), and Itaguai (8). On the other hand, the edges represent the individuals’ movement from one district to another district.
The obtained adjacency matrix of the graph is determined.
A M A C S ( G ) = [ 1 1 1 1 1 1 0 0 1 1 1 1 0 0 0 0 1 1 1 1 1 0 0 0 1 1 1 1 1 0 0 0 1 1 1 1 1 0 0 0 1 1 1 0 0 1 0 0 1 1 1 0 1 0 1 0 1 0 0 1 1 0 0 1 ]
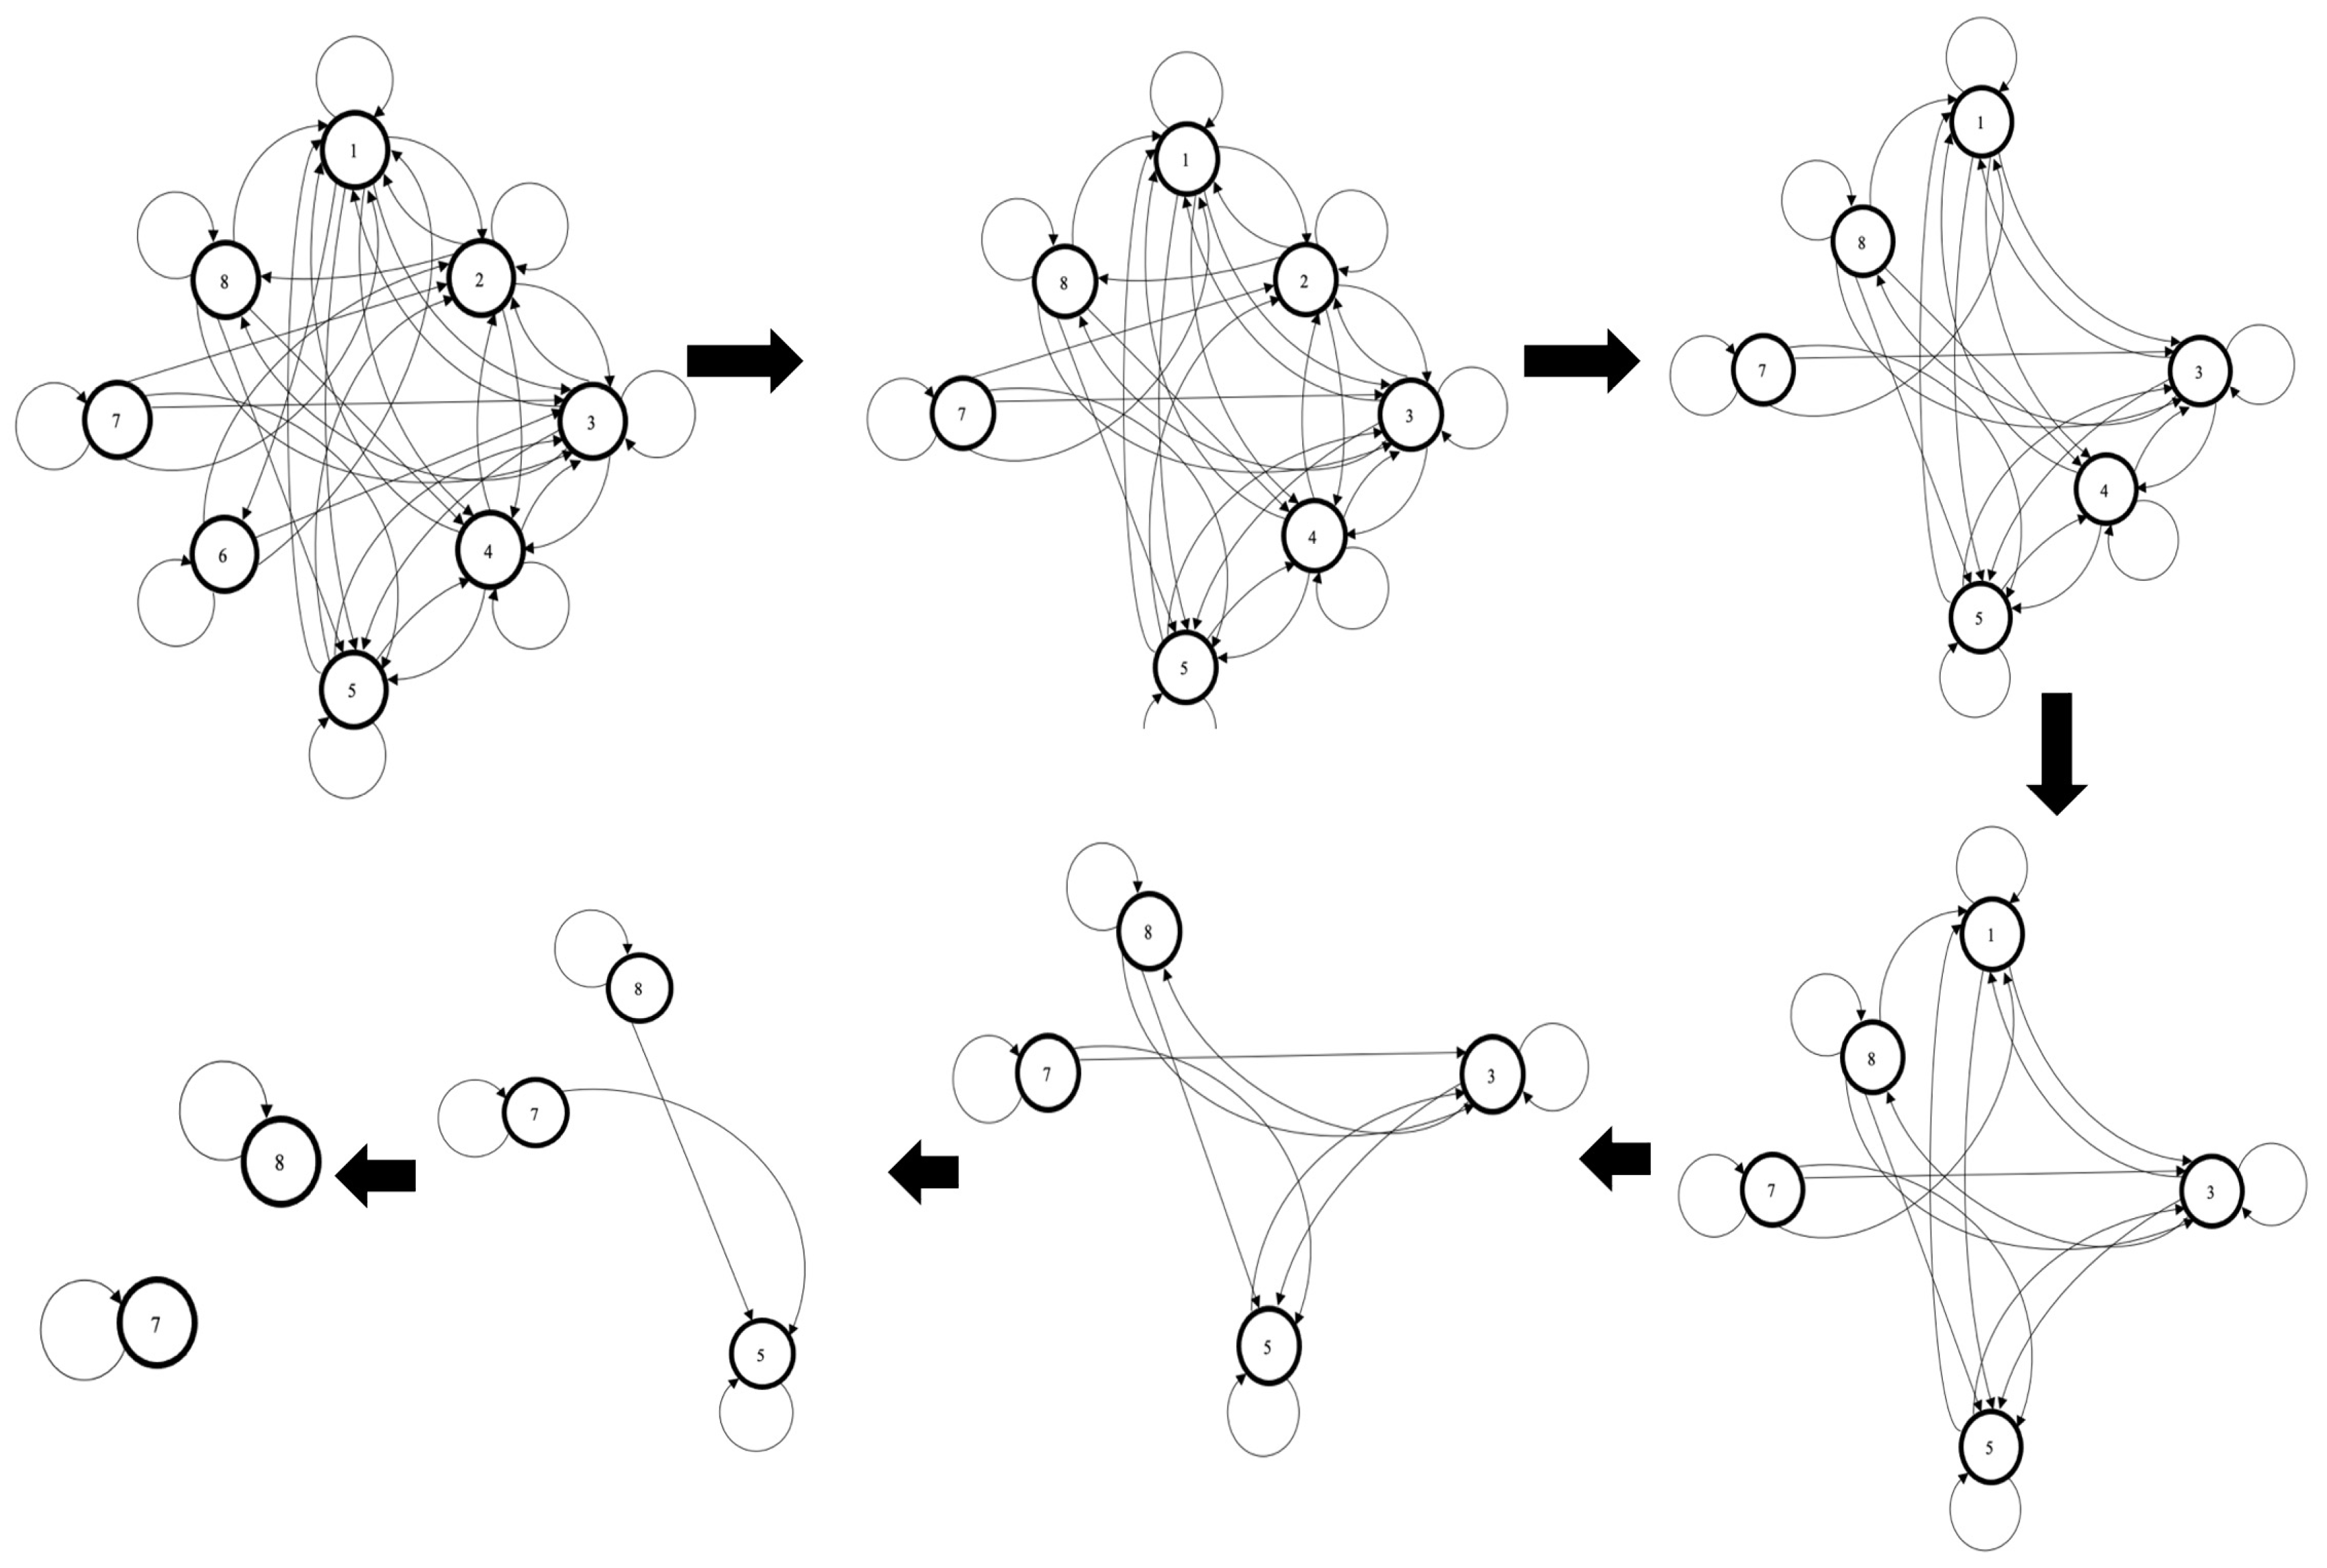
The developed algorithm MACSGA is coded using MATLAB version R2022A. The coding was then executed on a MacBook Air using Macintosh HD macOS 12.5. The total computing time was recorded to be 161.803 s. Figure 10 illustrates the updated stages of the MACS graph G . Initially, it consists of eight vertices, which are reduced to two vertices at the end.
The dynamicity of the MACS graph is simulated by MACSGA (see Table 3) whereby the lowest value for PFE is determined, hence its respective vertex of MACS is removed. The two surviving vertices that represent the two districts (Mage and Itaguai) of Rio indicated the main sources of the outbreak.
The obtained results are compared with the Bailey-Dietz model used by Iggidr et al. [30] (see Table 4).
Our obtained results using MACSGA concur with the published results by Iggidr et al. [30]. The later researchers reported that Mage and Itaguai had the two highest values of the basic reproduction number, R 0 = 2.618   and R 0 = 1.991 , respectively.

4. Conclusions and Future Work

This paper has introduced a new form of autocatalytic set, namely, multidigraph autocatalytic set (MACS). The MACS is defined and some of its mathematical structures have been investigated. A new algorithm named MACSGA has been developed and implemented on the system posted by Iggidr et al. [30]. The effectiveness of MACS has been established since the obtained results using MACSGA concur with the researchers’ result. The advantages of MACS as a modelling tool are shown, namely,
  • It can model complex systems that possess multi parameters and relations.
  • It requires less data, mainly for verification only.
  • It is efficient and requires less computing time.
  • No governing equation is needed.
  • It can be used for any types of modelling, static or dynamic.
The contributions of this work can be summarized as follows.
Most of the recent studies on complex systems have focused on what has come to be termed “connectivity”[31]. Connectivity is a description of the relationship between distinct parameters in the system [32]. The more complicated the system, the more complex the level of connectedness within it for example number and relation between its components increase, then the amount of data required and governing equations increase too. The MACS is able to simplify the connectivity in the system and act as a network representation of a complex system to gain a better understanding of how a system function and evolve.
Emergent behaviour is a crucial concept in complex system theory. It is the behaviour of a system that is determined by its interactions rather than its individual pieces. As a result, examining a system’s separate parts cannot anticipate emergent behaviour. It can only be predicted, managed, or controlled if the pieces and their relationships are understood. It is important to identify the relevant structure of the system and its most important parts. In any complex problem, if we cannot model the system accurately, we cannot solve the problem. The MACS can depict the structure of a complicated system, especially when the system has significant interrelationships.
For example, implement MACS in social network analysis. The discovery and identification of influencers and decision-makers are two of the most important jobs in social network analysis. Ensuring the continued engagement of these influencers can lead to increased overall network engagement or specific communities built around such people. MACS can be used for identifying the most influential users and identifying relationships between specific components. While data becomes more complex and interconnected, the application of MACS is essential for timely and effective data processing and analysis.
Finally, the MACS offers a new modelling technique for complex system whereby no governing equation is required to start with. It only demands system identification in form of nodes and edges initially. However, in the future, the MACS can be incorporated with fuzziness via fuzzy membership values of its relations to form Fuzzy Multiple Autocatalytic Set (FMACS). It can be used further to model system with some missing crucial information. Needless to say, the MACS is possible to be coupled with other conventional modelling techniques. The capability of MACS for modelling other complex systems and its possibilities are endless.

Author Contributions

Conceptualization, N.K.K. and T.A.; methodology T.A.; software, N.K.K.; formal analysis, N.K.K.; investigation, N.K.K.; writing—original draft preparation, T.A. and N.K.K.; writing—review and editing, M.A.; supervision, T.A., A.I. and S.R.A.; funding acquisition, T.A. and S.R.A. All authors have read and agreed to the published version of the manuscript.

Funding

The research is supported by the Fundamental Research Grant Scheme (FRGS) [FRGS/1/2020/STG06/UTM/01/1] awarded by the Ministry of Higher Education, Malaysia. The first author is financially sponsored by UiTM’s Skim Latihan Akademik Bumiputera (SLAB) for her study.

Data Availability Statement

Not applicable.

Acknowledgments

Authors acknowledge the support of Universiti Teknologi Malaysia (UTM), Universiti Teknologi MARA, Pasir Gudang, and the Ministry of Higher Education Malaysia (MOHE) in this work.

Conflicts of Interest

The authors declare no conflict of interest.

References

  1. Boccara, N. Modeling Complex Systems, 2nd ed.; Springer: Berlin/Heidelberg, Germany, 2010. [Google Scholar]
  2. Preiser, R. Identifying general trends and patterns in complex systems research: An overview of theoretical and practical implications. Syst. Res. Behav. Sci. 2019, 36, 706–714. [Google Scholar] [CrossRef]
  3. Fedriani, E.M.; Moyano, R. A Computational Measure of Heterogeneity on Mathematical Skills; Department of Economics, Quantitative Methods and Economic History: St. Ann Arbor, MI, USA, 2010. [Google Scholar]
  4. Zhang, H.; Chen, J. Bipartite Consensus of Linear Multi-Agent Systems Over Signed Digraphs: An Output Feedback Control Approach. IFAC Proc. Vol. 2014, 47, 4681–4686. [Google Scholar] [CrossRef]
  5. Iggidr, A.; Sallet, G.; Souza, M.O. On the dynamics of a class of multi-group models for vector-borne diseases. J. Math. Anal. Appl. 2016, 441, 723–743. [Google Scholar] [CrossRef]
  6. Lin, D.; Wu, J.; Yuan, Q.; Zheng, Z. T-EDGE: Temporal WEighted MultiDiGraph Embedding for Ethereum Transaction Network Analysis. Front. Phys. 2020, 8, 204. [Google Scholar] [CrossRef]
  7. Kauffman, S.A. Cellular Homeostasis, Epigenesis and Replication in Randomly Aggregated Macromolecular Systems. J. Cybern. 1971, 1, 71–96. [Google Scholar] [CrossRef]
  8. Rössler, O.E. A System Theoretic Model of Biogenesis. Z. Nat. B 1971, 26, 741–746. [Google Scholar] [CrossRef]
  9. Jain, S.; Krishna, S. Autocatalytic Sets and the Growth of Complexity in an Evolutionary Model. Phys. Rev. Lett. 1998, 81, 5684–5687. [Google Scholar] [CrossRef]
  10. Ahmad, T.; Baharun, S.; Arshad, K.A. Modeling a clinical incineration process using fuzzy autocatalytic set. J. Math. Chem. 2010, 47, 1263–1273. [Google Scholar] [CrossRef]
  11. Rosenfeld, A. Fuzzy Graphs. In Fuzzy Sets and Their Applications to Cognitive and Decision Processes, Proceedings of the US–Japan Seminar on Fuzzy Sets and their Applications, Held at the University of California, Berkeley, CA, USA, 1–4 July 1974; Elsevier: Amsterdam, The Netherlands, 1975; pp. 77–95. [Google Scholar] [CrossRef]
  12. Ashaari, A.; Ahmad, T.; Shamsuddin, M.; Mohamad, W.M.W.; Omar, N. Graph representation for secondary system of pressurized water reactor with autocatalytic set approach. J. Math. Stat. 2016, 11, 107–112. [Google Scholar] [CrossRef]
  13. Ahmad, T.; Bakar, S.A.; Baharun, S.; Binjadhnan, F.A.M. Coordinated transformation for fuzzy autocatalytic set of fuzzy graph type-3. J. Math. Stat. 2016, 11, 119–127. [Google Scholar] [CrossRef]
  14. Hassan, N.; Ahmad, T.; Zain, N.M.; Awang, S.R. A fuzzy graph based chemometrics method for gelatin authentication. Mathematics 2020, 8, 1969. [Google Scholar] [CrossRef]
  15. Hordijk, W. A History of Autocatalytic Sets. Biol. Theory 2019, 14, 224–246. [Google Scholar] [CrossRef]
  16. Jain, S.; Krishna, S. Graph Theory and the Evolution of Autocatalytic Networks. 2002. Available online: https://www.researchgate.net/publication/2145591 (accessed on 15 December 2022).
  17. Harary, F. Graph Theory; Addison Wesley Publishing Company: Boston, MA, USA, 1969. [Google Scholar]
  18. Celik, F.; Cangul, I.N. On The Spectra of Cycles and Paths. 2019. Available online: https://acikerisim.isikun.edu.tr/xmlui/bitstream/handle/11729/2745/vol.9.no.3-17.pdf?sequence=1&isAllowed=y (accessed on 15 December 2022).
  19. Sameena, K. Clustering Using Strong Arcs in Fuzzy Graphs. 2015. Available online: https://www.emis.de/journals/GMN/yahoo_site_admin/assets/docs/6_GMN-6312-V30N1.301103206.pdfwww.i-csrs.orgAvailablefreeonlineathttp://www.geman.in (accessed on 15 December 2022).
  20. Yeh, R.T.; Bang, S.Y. Fuzzy Relations, Fuzzy Graphs, and Their Applications to Clustering Analysis. In Fuzzy Sets and Their Applications to Cognitive and Decision Processes, Proceedings of the US–Japan Seminar on Fuzzy Sets and their Applications, Held at the University of California, Berkeley, CA, USA, 1–4 July 1974; Elsevier: Amsterdam, The Netherlands, 1975; pp. 125–149. [Google Scholar] [CrossRef]
  21. Liew, S.; Ahmad, T. Deduction of Fuzzy Autocatalytic Set to Omega Algebra and Transformation Semigroup. World Acad. Sci. Eng. Technol. 2010. [Google Scholar] [CrossRef]
  22. Liew, S.Y.; Ahmad, T. Category of Fuzzy Graph and Its Relation to Morphism. Mat. Malays. J. Ind. Appl. Math. 2011, 27, 11–20. [Google Scholar]
  23. Obaid, U.Q.; Ahmad, T. Novel Structures of Normed Spaces with Fuzzy Autocatalytic Set (FACS) of Fuzzy Graph Type-3. Res. J. Appl. Sci. Eng. Technol. 2016, 12, 562–573. [Google Scholar] [CrossRef]
  24. Mamat, S.S.; Awang, S.R.; Ahmad, T. Preference Graph of Potential Method as a Fuzzy Graph. Adv. Fuzzy Syst. 2020, 2020, 8697890. [Google Scholar] [CrossRef]
  25. Ashaari, A.; Ahmad, T.; Awang, S.; Shukor, N. A graph-based dynamic modeling for palm oil refining process. Processes 2021, 9, 523. [Google Scholar] [CrossRef]
  26. Chartrand, G.; Lesniak, L.; Zhang, P. Graphs & Digraphs; Chapman and Hall/CRC: Boca Raton, FL, USA, 2015. [Google Scholar] [CrossRef]
  27. Barik, S.; Sahoo, G. A new matrix representation of multidigraphs. AKCE Int. J. Graphs Comb. 2020, 17, 466–479. [Google Scholar] [CrossRef]
  28. Noutsos, D.; Varga, R.S. On the Perron-Frobenius Theory for Complex Matrices Dimitrios Noutsos Perron Frobenius Theory. 2010. Available online: http://ala2010.pmf.uns.ac.rs/presentations/4g1120dn.pdf (accessed on 15 December 2022).
  29. Noutsos, D.; Varga, R.S. On the Perron–Frobenius Theory for Complex Matrices. Linear Algebra Appl. 2012, 437, 1071–1088. [Google Scholar] [CrossRef]
  30. Iggidr, A.; Koiller, J.; Penna, M.; Sallet, G.; Silva, M.; Souza, M. Vector borne diseases on an urban environment: The effects of heterogeneity and human circulation. Ecol. Complex. 2017, 30, 76–90. [Google Scholar] [CrossRef]
  31. Turnbull, L.; Hütt, M.-T.; Ioannides, A.A.; Kininmonth, S.; Poeppl, R.; Tockner, K.; Bracken, L.J.; Keesstra, S.; Liu, L.; Masselink, R.; et al. Connectivity and complex systems: Learning from a multi-disciplinary perspective. Appl. Netw. Sci. 2018, 3, 11. [Google Scholar] [CrossRef] [PubMed]
  32. Kool, J.T.; Moilanen, A.; Treml, E.A. Population connectivity: Recent advances and new perspectives. Landsc. Ecol. 2013, 28, 165–185. [Google Scholar] [CrossRef]
Figure 1. The research framework of MACS.
Mathematics 11 00912 g001
Figure 2. (a) 1-cycle ACS (b) 2-cycles ACS (c) 3-cycles ACS.
Mathematics 11 00912 g002
Figure 3. An example of a fuzzy graph.
Mathematics 11 00912 g003
Figure 4. The schematic diagram of a clinical waste incinerator.
Mathematics 11 00912 g004
Figure 5. A FACS clinical waste incineration process [10].
Mathematics 11 00912 g005
Figure 6. An example of multidigraph G   with seven vertices.
Mathematics 11 00912 g006
Figure 7. Multidigraph (a) Autocatalytic set (b) Non-autocatalytic set.
Mathematics 11 00912 g007
Figure 8. A multidigraph autocatalytic set G ( V , A ) .
Mathematics 11 00912 g008
Figure 9. The MACS graph of human movements within the 8 macro-districts.
Mathematics 11 00912 g009
Figure 10. The dynamic of graph of the 8 macro-districts.
Mathematics 11 00912 g010
Table 1. Development of autocatalytic set theory.
ResearchersYearContribution
Kauffman, 1971 [1]1971The concept of ACS as a possible tool to model the catalytic interaction of chemical compounds is introduced.
Rosenfeld, 1975 [2]1975Fuzzy graph theory was defined.
Jain and Krishna, 1998 [3]1998Introduction of ACS as a graph.
Ahmad et al., 2010 [4]2010A fuzzy autocatalytic set (FACS) was introduced. Each edge of an ACS carries its respective fuzzy membership value.
Liew and Ahmad, 2010 [5]2010Algebraic structure FACS (Ω-FACS) was generated.
Liew and Ahmad, 2011 [6]2011Category FACS was presented.
Ashaari et al., 2016 [7]2016Modelling Pressurized Water Reactor (PWR) system using a dynamic graph of FACS.
Bakar et al., 2016 [8]2016Coordinated FACS is introduced.
Qasim and Ahmad, 2016 [9]2016Proved FACS as a normed space of fuzzy graph Type-3.
Mamat et al., 2019 [10]2019Weak autocatalytic set (WACS) and fuzzy weak autocatalytic set (FWACS) were introduced.
Hassan et al., 2020 [11]2020Chemometrics FACS (c-FACS) was developed for gelatin authentication purposes.
Ashaari et al., 2021 [12]2021Modelling of palm oil refining process using FACS.
Table 2. The R 0 readings for the eight districts in Rio.
DistrictBasic Reproduction Number
Centro0.948
Sul0.760
Norte0.681
Oeste0.487
Baixada0.616
Niteroi1.149
Mage2.618
Itaguaii1.991
Table 3. The dynamic of MACS graph.
ParameterPFEDescription
( Centro Sul Norte Oeste Baixada N i t e r o i Mage Itaguai ) ( 0.4302 0.2983 0.3738 0.3738 0.3738 0.2792 0.3738 0.2983 ) Niteroi is removed.
( Centro S u l Norte Oeste Baixada Mage Itaguai ) ( 0.3999 0.3165 0.3999 0.3999 0.3999 0.3999 0.3165 ) Sul is removed.
( Centro Norte O e s t e Baixada Mage Itaguai ) ( 0.4082 0.4082 0.4082 0.4082 0.4082 0.4082 ) Oeste is removed.
( Centro Norte Baixada Mage Itaguai ) ( 0.4000 0.4000 0.4000 0.6000 0.4000 ) Centro is removed.
( N o r t e Baixada Mage Itaguai ) ( 0.3780 0.3780 0.7559 0.3780 ) Norte is removed
( B a i x a d a Mage Itaguai ) ( 0 0 1 ) Baixada is removed
( Mage Itaguai ) Mage and Itaguai are identified as the two culprit districts that caused the outbreak.
Table 4. Comparison of obtained computed results using MACSGA against published results by Iggidr et al. [30].
MACSGABailey-Dietz Model
District that caused the endemic.Mage, ItaguaiMage, R 0 = 2.618
Itaguai, R 0 = 1.991
Disclaimer/Publisher’s Note: The statements, opinions and data contained in all publications are solely those of the individual author(s) and contributor(s) and not of MDPI and/or the editor(s). MDPI and/or the editor(s) disclaim responsibility for any injury to people or property resulting from any ideas, methods, instructions or products referred to in the content.