Article

Intelligent Image Super-Resolution for Vehicle License Plate in Surveillance Applications

1
Faculty of Computers and Information Technology, University of Tabuk, Tabuk 47711, Saudi Arabia
2
Digital Image Processing Laboratory, Department of Computer Science, Islamia College Peshawar, Peshawar 25000, Pakistan
3
The Software, Data and Digital Ecosystems (SDDE) Research Group, Department of Computer Science, Norwegian University of Science and Technology (NTNU), 2815 Gjøvik, Norway
4
Visual Analytics for Knowledge Laboratory (VIS2KNOW Lab), Department of Applied Artificial Intelligence, School of Convergence, College of Computing and Informatics, Sungkyunkwan University, Seoul 03063, Republic of Korea
*
Authors to whom correspondence should be addressed.
These authors contributed equally to this work and are co-first authors.
Mathematics 2023, 11(4), 892; https://doi.org/10.3390/math11040892
Submission received: 15 December 2022 / Revised: 29 January 2023 / Accepted: 4 February 2023 / Published: 9 February 2023
(This article belongs to the Section E1: Mathematics and Computer Science)

Abstract

:
Vehicle license plate images are often low resolution and blurry because of the large distance and relative motion between the vision sensor and vehicle, making license plate identification arduous. The extensive use of expensive, high-quality vision sensors is uneconomical in most cases; thus, images are initially captured and then translated from low resolution to high resolution. For this purpose, several traditional techniques such as bilinear, bicubic, super-resolution convolutional neural network, and super-resolution generative adversarial network (SRGAN) have been developed over time to upgrade low-quality images. However, most studies in this area pertain to the conversion of low-resolution images to super-resolution images, and little attention has been paid to motion de-blurring. This work extends SRGAN by adding an intelligent motion-deblurring method (termed SRGAN-LP), which helps to enhance the image resolution and remove motion blur from the given images. A comprehensive and new domain-specific dataset was developed to achieve improved results. Moreover, maintaining higher quantitative and qualitative results in comparison to the ground truth images, this study upscales the provided low-resolution image four times and removes the motion blur to a reasonable extent, making it suitable for surveillance applications.

1. Introduction

Navigant research [1] suggests that the number of vehicles in the world will grow to two billion by 2035. This huge increase in the number of vehicles poses a significant challenge to humans in managing them manually. In this regard, smart cities require a significant focus to manage the flow of vehicles intelligently [2]. Different vision sensors, position identification sensors, and many more applications are used to ensure the concept of vehicles communicating autonomously, that is, the flow of traffic or smart parking management. Several identification tags are used to achieve this; however, vehicle license plates are the most traditional and unique elements used for the correct identification of the vehicle type and model year.
Vehicles are uniquely identified based on an important component known as the license plate. Finding a stolen car, tracking a trouble-making vehicle, smart parking management, and automatic toll collection all use vehicle license plates to perform these tasks. For the smooth execution of such tasks, the correct identification of the vehicle license plate is indispensable. However, in some cases, the captured license plate images develop some sort of perturbation, owing to low lightning conditions, low resolution, and motion blur, making this process difficult. Therefore, several image super resolution (SR) techniques have been developed over time to overcome these challenges.
Image SR is a technique used to reconstruct high resolution (HR) images based on provided low resolution (LR) counterparts. The application domain of super resolution (SR) is vast, and it can be used in remote sensing [3], hyperspectral SR [4,5], and medical imaging [6,7,8]. However, in some cases the images acquired by different imaging devices such as surveillance cameras, cell phones, X-rays, MRI, and CT-scans are of low-resolution. These images are mostly blurred and contain noise due to relative motion, lamination variation, distance variation, and low-quality imaging devices. Applications such as restoration [9], surveillance, and medical imaging systems [10,11] require HR images for recognition and diagnosis, respectively. Although some applications such as Blu-ray movies, video conferencing, and web videos are often in HR, to preserve server storage and bandwidth, they are often stored in LR.
To transform an LR image into an HR image, several techniques are available, that can be classified into two broad categories: traditional image processing techniques and convolutional neural networks (CNNs)-based SR algorithms [12]. Traditional methods, such as bi-linear and bi-cubic methods, are computationally inexpensive and easy to deploy; however, these methods have a few limitations that make them inefficient to deploy in certain circumstances. One of the basic limitations of these methods is that they generate overly smooth textures in reconstructed images. In addition, these methods typically fail to reconstruct the original content of an image. However, the modern techniques available are usually based on deep learning techniques, specifically CNNs. These techniques iteratively enhance image quality by minimizing the loss between the original image and the reconstructed image. Numerous optimization techniques are available to help CNN models reduce the loss between the original image and the reconstructed image.
The proposed super-resolution generative adversarial network for license plates (SRGAN-LP) was based on one of the most promising techniques for image SR resolution, known as a super-resolution generative adversarial network (SRGAN) [13]. The original architecture of SRGAN utilizes three models, that is, a deep generator, a discriminator consisting of several residual blocks, and a novel function called perceptual loss, for realistic image reconstruction. However, our solution is largely based on the identification of digits on the license plate of a vehicle, rather than realistic image generation. Therefore, we reduced the size of the actual SRGAN generator to a minimum, to reduce computational cost. In addition, we incorporated the motion deblurring method into the original SRGAN so that the digits and letters were correctly identified. Our extensive experimental results justify the changes to the original architecture.
Our proposed SRGAN-LP method is compared with traditional techniques such as the bilinear, bicubic, and single image-based super resolution method SRCNN [8]. The experimental results show the promising performance of our method. Similarly, the results were compared with the SRGAN trained on the ImageNet dataset. To justify the effectiveness of the SRGAN-LP, we conducted comprehensive experiments on two different testing sets. First, we used the same testing set of images as the training images, and in the second phase, we performed experiments on independent images, that is, images independently collected from vehicles. Considering all these experiments and comparisons, we concluded our contributions to vehicle license plate image SR as follows:
  • In light of the usefulness of SRGAN in the current literature, we incorporated motion deblurring in its architecture, thus achieving good-quality HR and deblurred images.
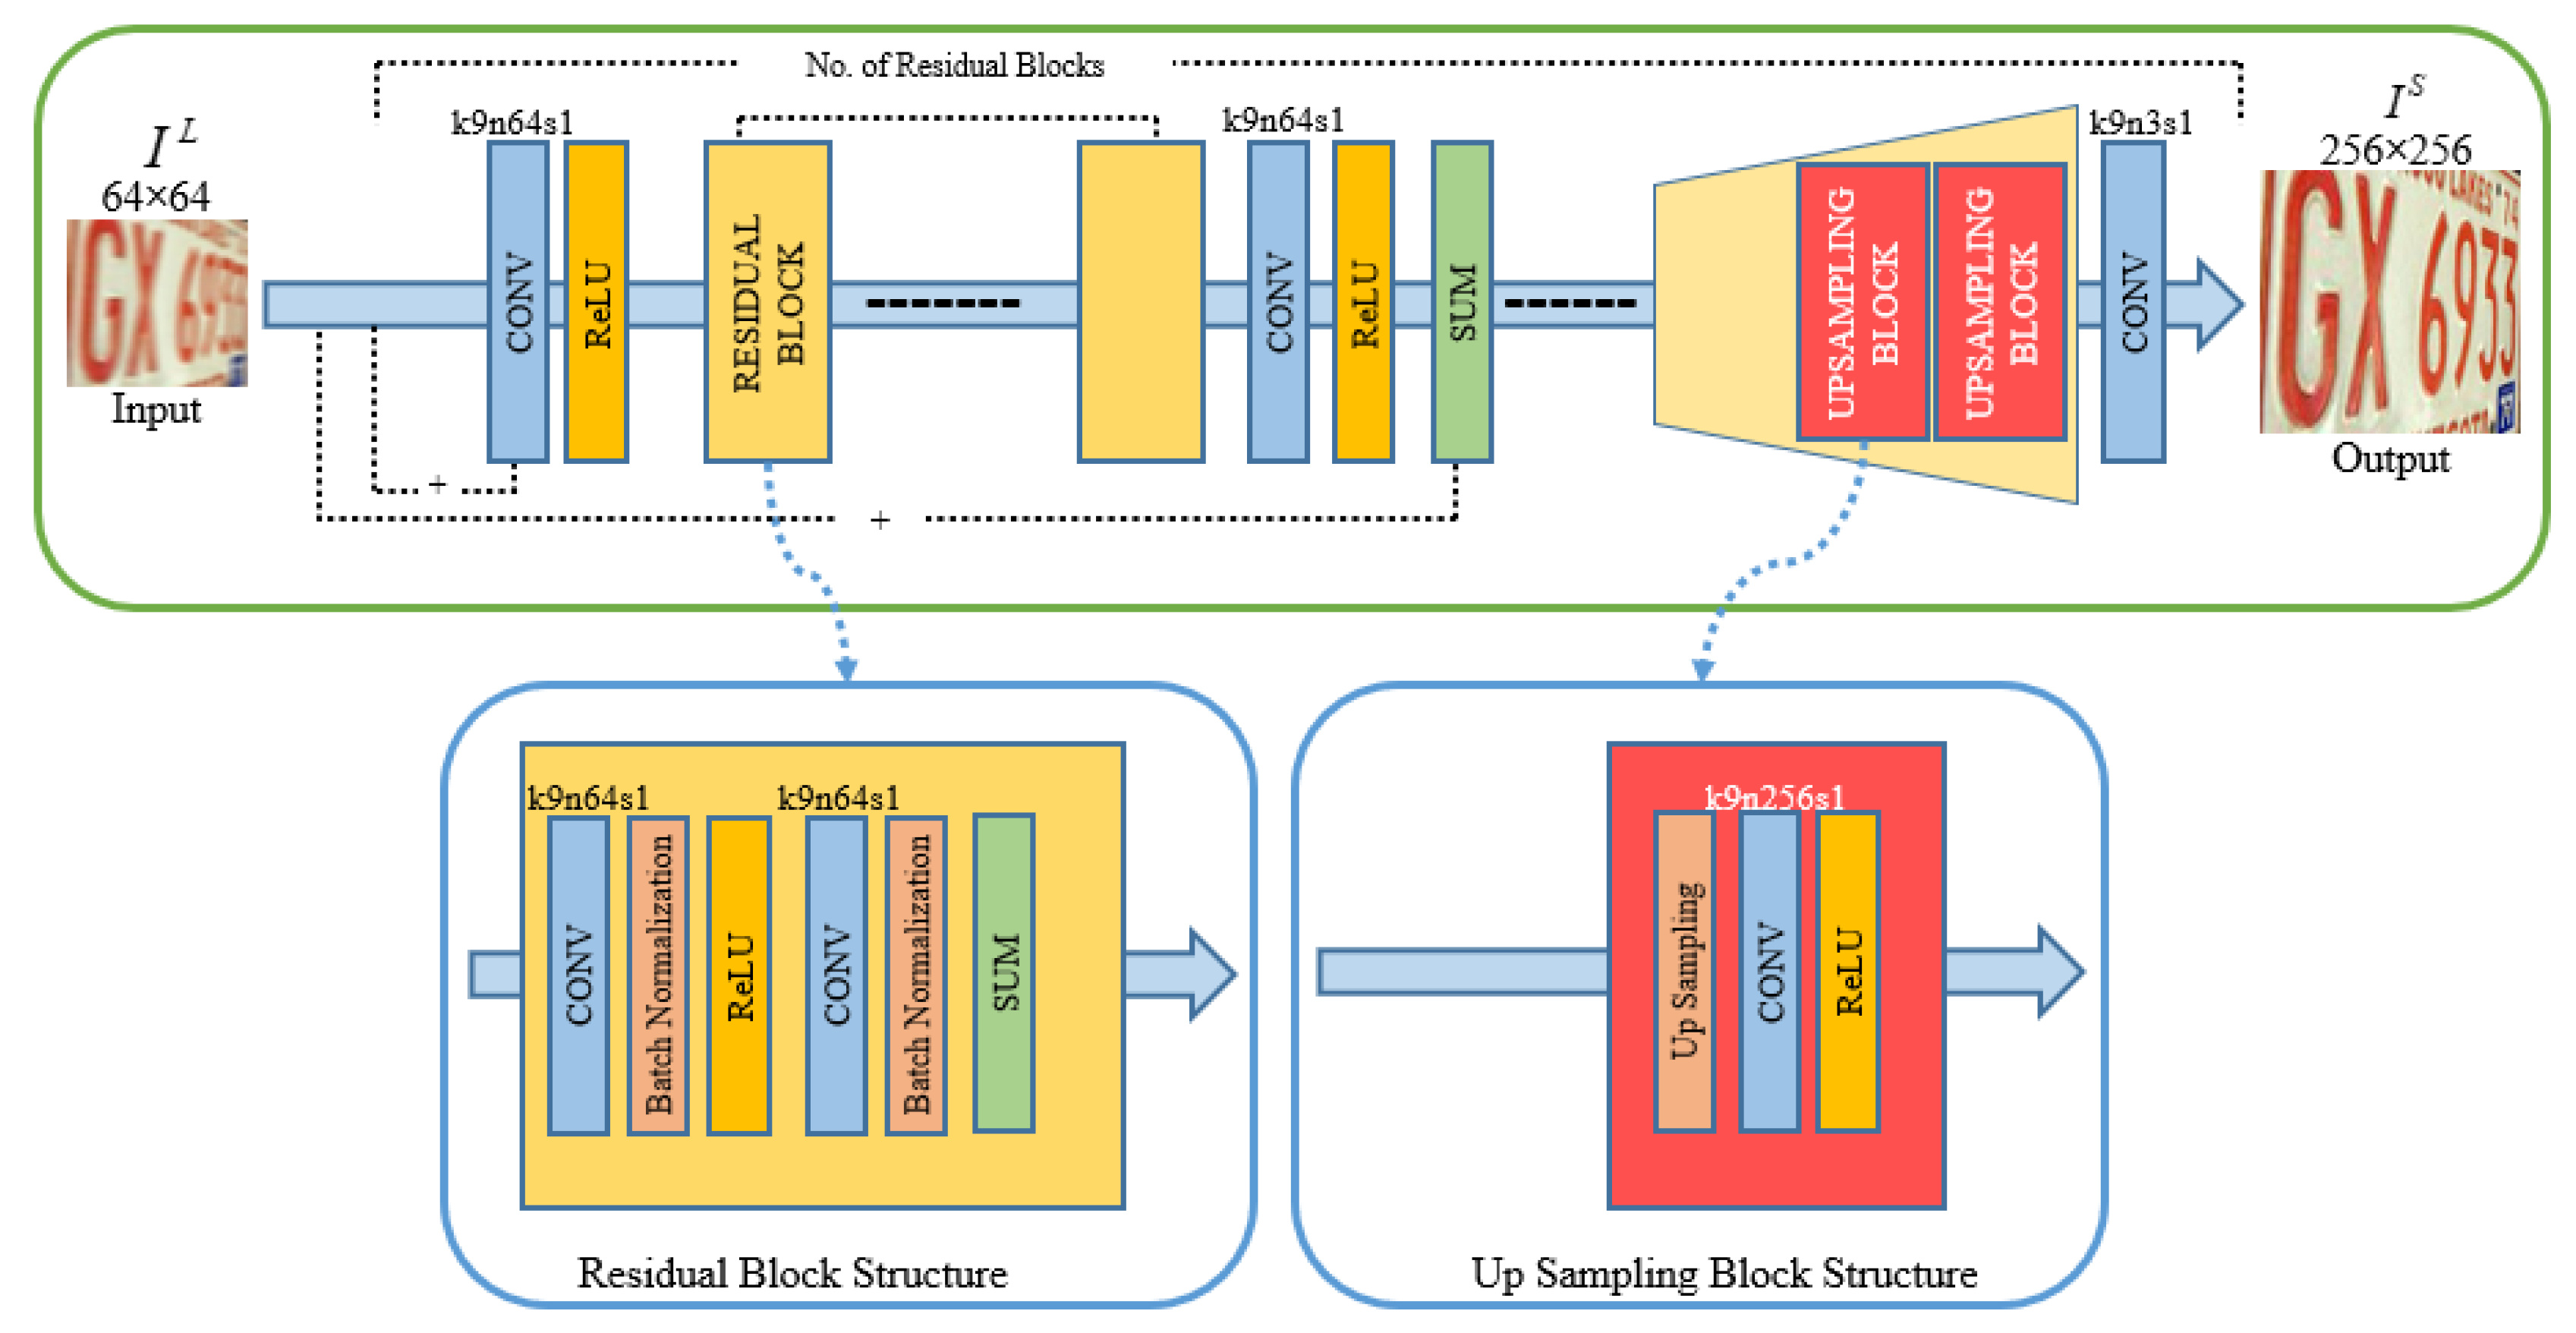
  • We reduced the size of the original SRGAN by reducing the number of residual blocks in the generator network from 16 to 8, consequently achieving less inference time while preserving the same performance.
  • We developed a comprehensive and new domain-specific dataset that originally contains 3112 images of different regions and color patterns. Furthermore, we diversified the angles of the images and increased the size of the dataset to 12,388 using different augmentation techniques.
The remainder of this paper is organized as follows. Section 2 and Section 3 present related work and the proposed methodology, respectively. The experimental results and evaluations are presented in Section 4. Section 5 concludes the paper with a discussion of future work.

2. Related Work

As image SR and deblurring are applied to tackle various challenges in real-world scenarios, the related work is divided into two parts, where 2.1 focuses on the topic of super resolution and deblurring, and 2.2 specifies existing literature related to intelligent vehicle license plate recognition.

2.1. Image Super Resolution and Deblurring

Image SR and deblurring [14] has remained a hot research area among the computer vision research community. Earlier approaches relied on pure image processing techniques by applying sharpening filters followed by interpolation-based methods, such as bicubic and bilinear interpolations [15]. These methods have remained benchmarks for a reasonable period of time, however, they exhibit a persistent problem of generating overly smooth textures in the reconstructed images. With the emergence of CNNs, and their promising results in other fields, researchers have applied them in the SR domain as well. In this regard, a breakthrough approach, SRCNN [8], applied convolutional layers to enhance an LR image, and the results were very impressive when it was first published. Succeeding SRCNN, a very deep convolutional network named VDSR was proposed in [16], where 16 convolutional layers were added with the implementation of residual learning. The output of the VDSR produced a better result than the one in the SRCNN. Both SRCNN and VDSR aimed to increase the peak signal to noise ratio (PSNR) between the recovered image SR image and the HR image, by reducing the mean square error (MSE) between the SR and HR images. Although CNN-based methods performed much higher than the traditional methods, however, with the invention of generative adversarial networks (GAN), and its incredible results, the domain of SR largely shifted to GAN-based methods.
The idea of GAN was first coined by Goodfellow et al. [17], who trained a generative model and discriminative model simultaneously through an adversarial process. Based on GAN, Ledig et al. proposed a method called SRGAN [13]. The SRGAN framework is capable of inferring photorealistic natural images for 4x up-scaling factors. A new methodology using GAN was proposed by Mao et al. [18], generating least squares GANs (LSGANs) in which the least squares loss function is calculated for the discriminator, and it was found that LSGANs can generate higher quality images than regular GANs. In addition, LSGANs remain more stable during the learning process than regular GANs. Lim et al. [19] developed an enhanced deep SR network called EDSR. This improvement was achieved by removing unnecessary modules from the conventional residual networks. They found that the proposed EDSR was more optimized in terms of generating SR images than the original GAN. A novel approach for synthesizing HR photorealistic images from semantic label maps, using conditional generative adversarial networks (conditional GANs), was proposed by Wang et al. [20], which generated 2048 × 1024 visually appealing results with a novel adversarial loss along with new multi-scale generator and discriminator architectures.
However, less attention has been paid to deblurring in the SR arena. The former works relied primarily on using Laplacian filters for sharpening; however, sharpening the image alone does not usually guarantee the reconstruction of the original content of the image. A comparatively recent work by Kupyn et al. [21] proposed the idea of DeblurGAN, which is an end-to-end learned method for motion deblurring. The DeblurGAN training process involves conditional GAN and content loss. They showed that the proposed DeblurGAN was five times faster than the DeepDeblur [22] model in terms of the structural similarity measure and visual appearance. Similarly, Nah et al. [23] presented an averaging-based technique; however, it lacks generalization capability owing to the lack of diversity in datasets generated using averaging.

2.2. License Plate Super Resolution and Deblurring

There are two different methods for license plate recognition (LPR): segmentation-based [24] and non-segmentation-based [25]. Segmentation-based techniques mainly trace back to the traditional machine learning techniques, whereas non-segmentation-based techniques largely subsume recent deep learning-based approaches, including CNNs, for the identification or reconstruction of license plate images. Segmentation-based methods first divide the license plate into segments of characters, which are then recognized using a projection-based classifier [26] and connected-component-based classifiers [27]. In contrast, a non-segmentation-based method was first proposed by Shi et al. [28], where a deep CNN was applied for feature extraction directly without a sliding window, and a bidirectional long short-term memory network was used for sequence labeling. The literature reveals that non-segmentation-based methods are promising for license plate image-quality enhancement.

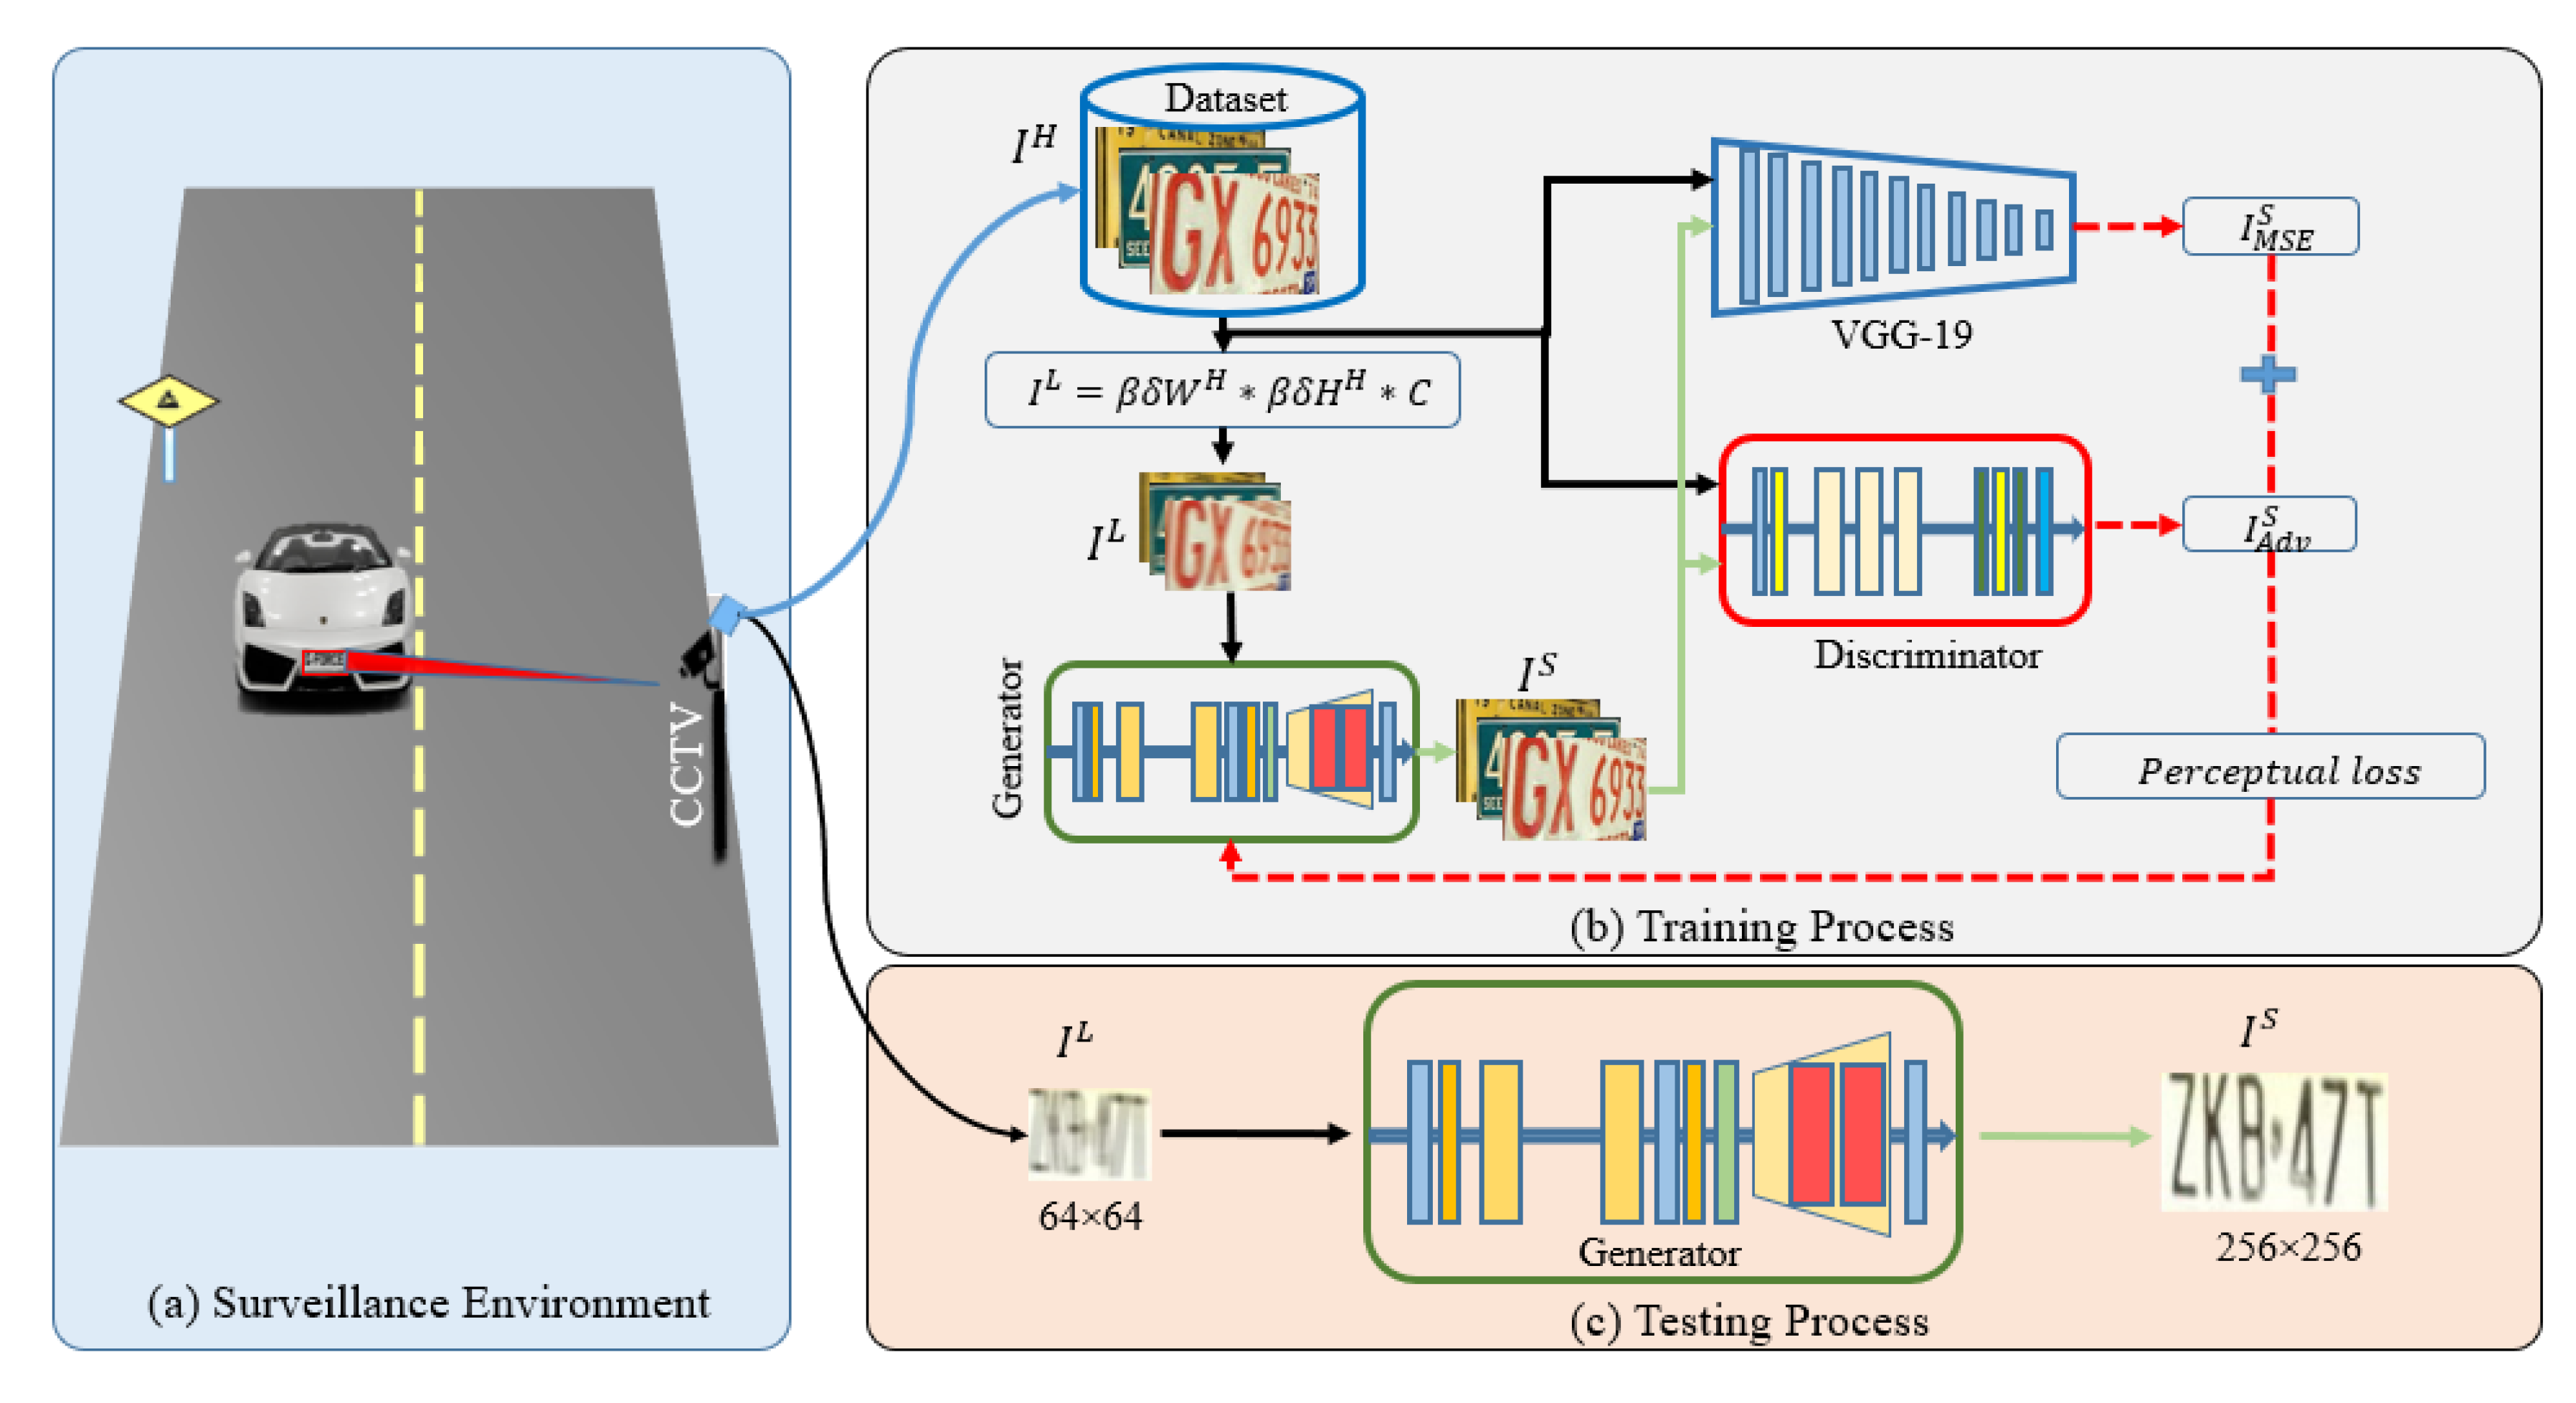
3. Proposed Methodology

The goal of image SR is to obtain an HR image from the provided LR image, as shown in Figure 1, depicting the proposed SRGAN-LP. Our aim is to train a generator that predicts a high-resolution IH image from the provided low-resolution IL image with minimum loss. To perform this process, we construct a generator network G, which is a deep CNN model with parameter θG. For all training images N, we optimize θG as given in Equation (1). A visual overview of the generator network G is depicted in Figure 2 and details of the input and output parameters of the proposed method are given in Table 1.
θ ^ G = arg min θ G n = 1 N l S ( G θ G ( I n L ) , I n H )
I H = W H H H C
Equation (1) is used to convert IL to its IH counterpart. Similarly, in Equation (2), IH represents the HR image. WH and HH represent the width and height of the HR images, respectively. Similarly, C (BGR, C = 3) represents the number of channels in the image. HR images were available only during training. IH images are converted to LR IL images by applying motion blur (β = 16) and a down sampling operation with a specified scale of δ. For an image with C color channels, we describe IL by a real-valued tensor of size W × H × C and IH and IS by rW × rH × C.
I L = β δ W H β δ H H C
The IL images are obtained by down sampling using a bicubic kernel with a factor size of δ = 4, and applying motion blur β to the IH images with the number of channels C as shown in Equation (3). After the images are converted into IL, they are input to G.

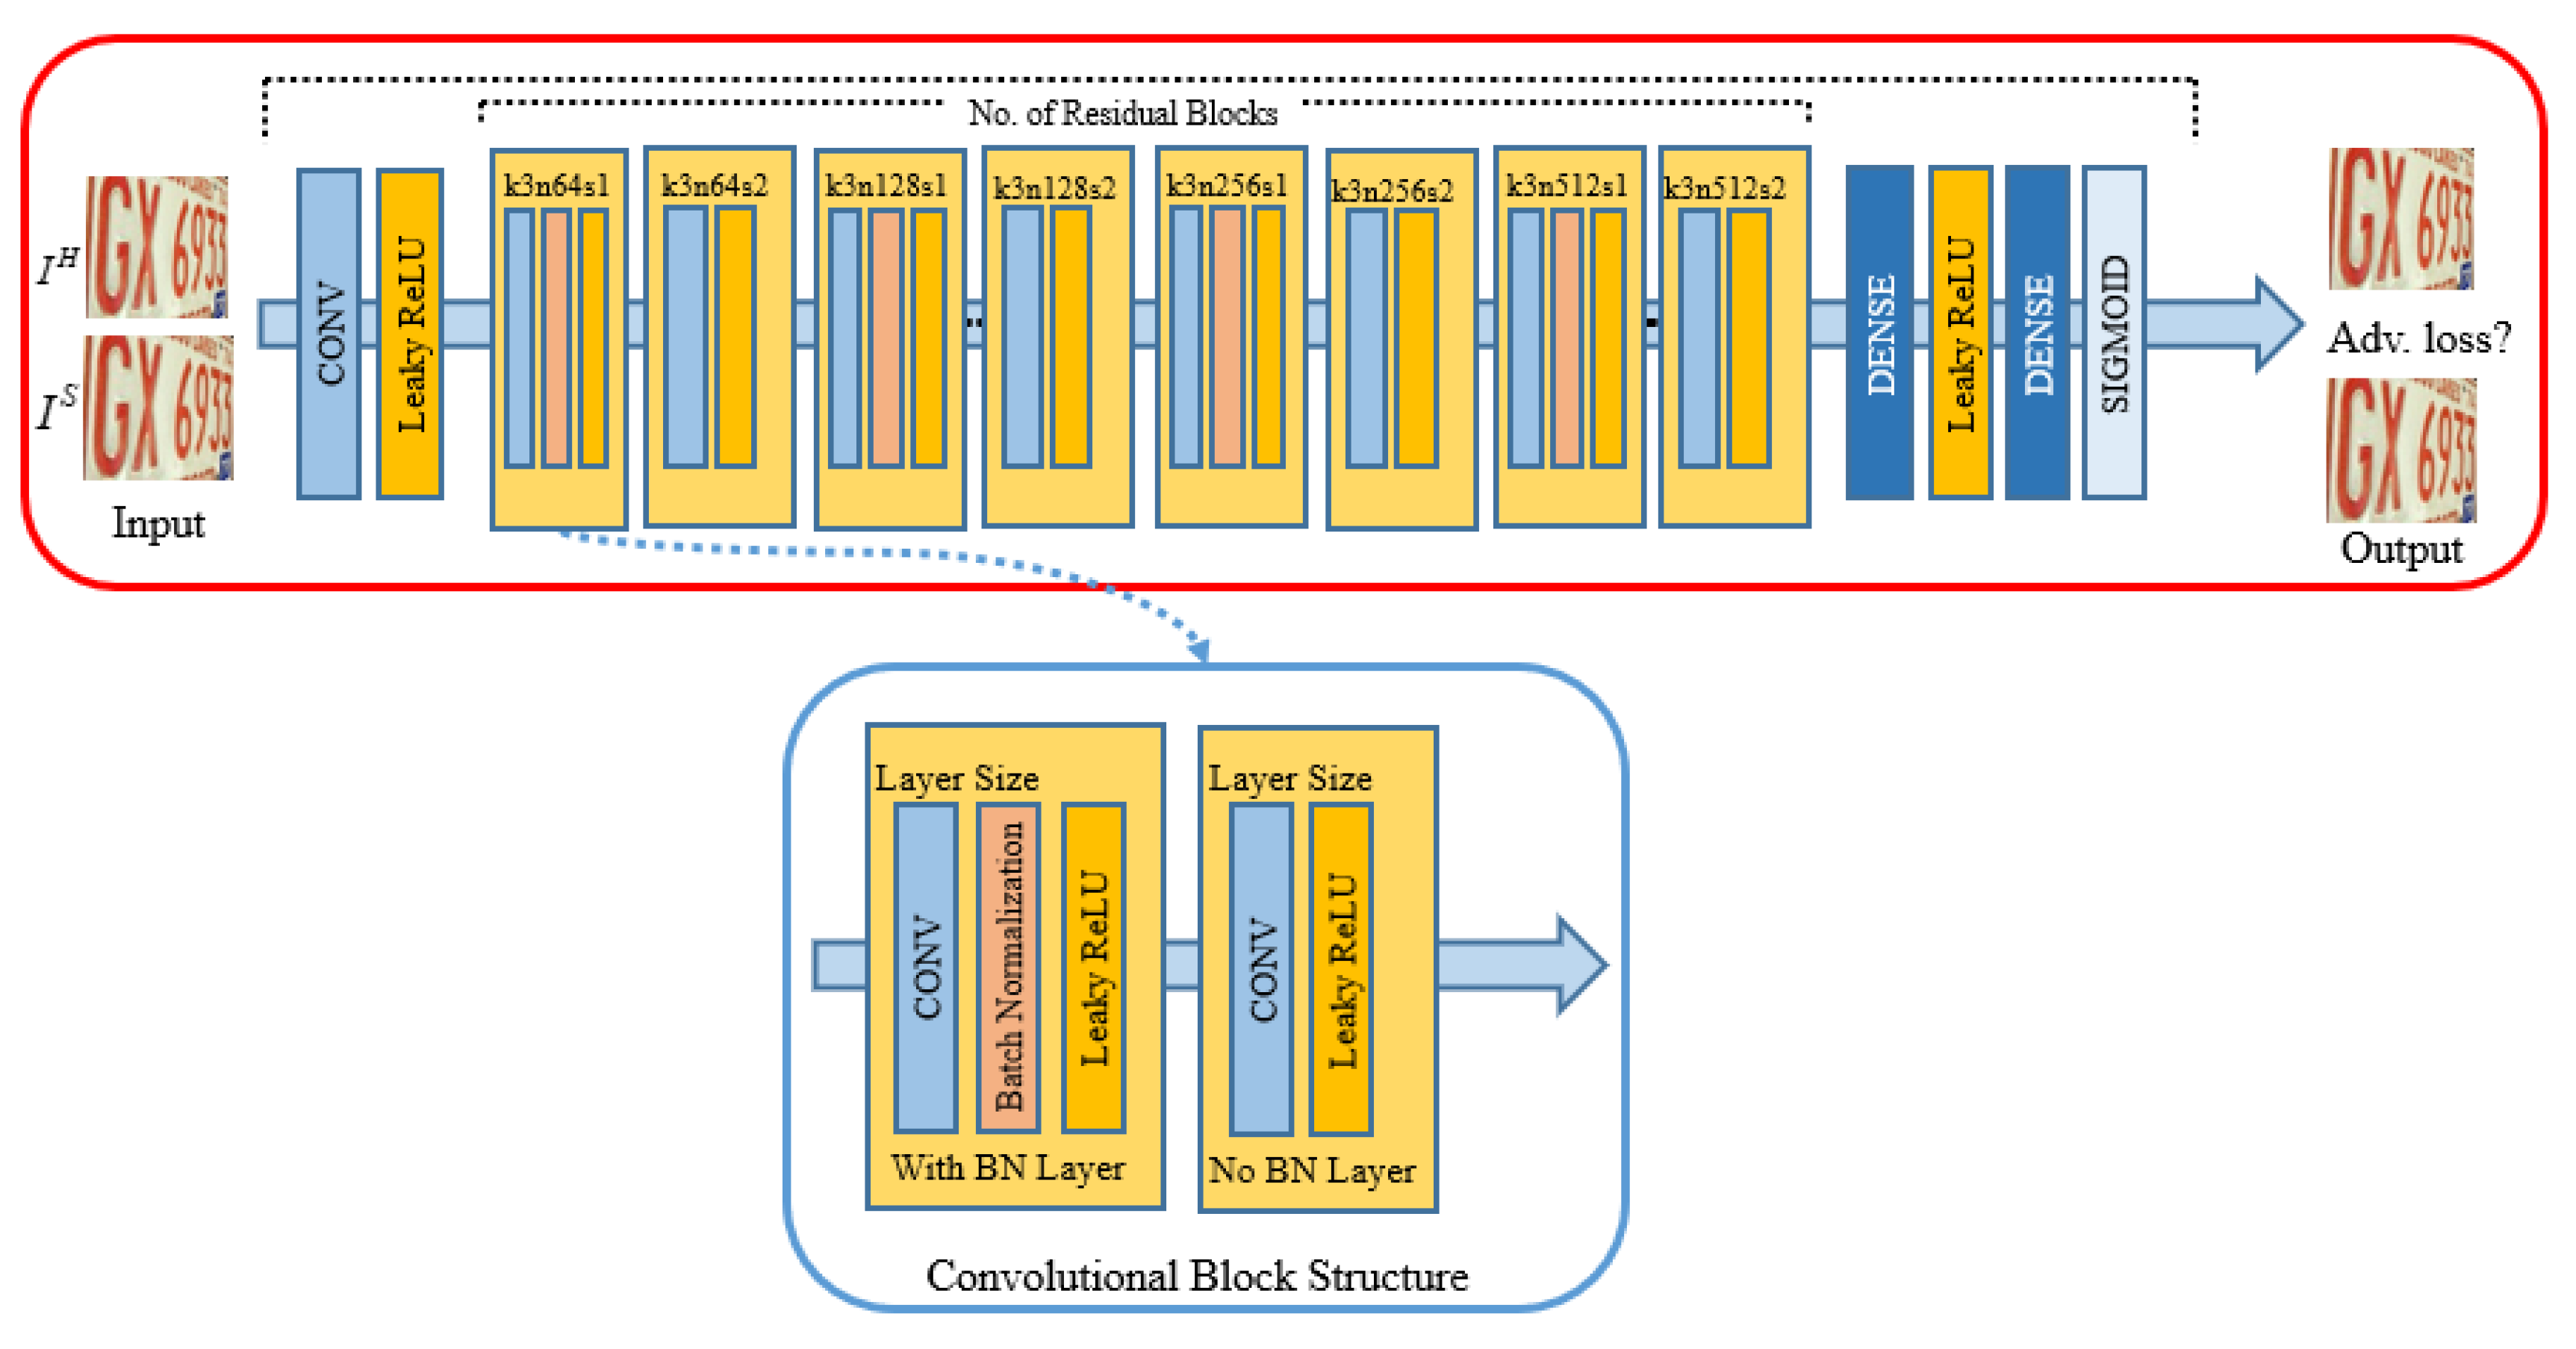
3.1. Adversarial Loss Function

In adversarial loss, the variable IH is an input to the discriminator (D), which is used to compare the IS and IH images to discriminate between them. For this reason, IH images are also given to D from the dataset.
D θ d = 1 q i = 1 q [ log D ( I H ) + ( 1 log D ( I S ) ) ]
The aim of D is to calculate the adversarial loss. Equation (4) represents D and shows how it is parameterized by θD: In Equation (4), the adversarial loss is calculated, which later contributes to the perceptual loss calculation. The architecture of the discriminator D network is illustrated in Figure 3.
Equation (5) is used to calculate the adversarial loss in terms of the probabilities returned by D. This adversarial loss is then combined with another loss to obtain the final objective function of SRGAN.
I a d v S = 1 q i = 1 q ( log D θ d ( I S ) )

3.2. Content Loss Function

VGG19 was used to calculate the pixel-wise MSE as a content loss in this architecture. The content loss used in the MSE is the pixel-wise difference between the generated image IS and the original high-resolution image IH of the dataset, which can be calculated using Equation (6).
I M S E S = 1 δ 2 W H x = 1 δ W x = 1 δ H ( I x , y H G θ G ( I L ) x , y ) 2

3.3. Perceptual Loss Function

Perceptual loss is a weighted combination of content loss and adversarial loss, which tends to reconstruct the original content of an image. Previously, SR problems were commonly based on the MSE loss function; however, in the proposed SRGAN-LP, MSE combined with adversarial loss was used to push the G to reconstruct the original content of the image.
S = l X S c o n t e n t l o s s + 10 3 l G e n S a d v e r s a r i a l l o s s p e r c e p t u a l l o s s
The weighted sum of content loss ( l X S ) and an adversarial loss component are used according to Equation (7). After the perceptual loss calculation, backpropagation occurs and optimizes the G network to learn the distribution more efficiently. The process shown in Figure 1 continues until the G network starts generating images that are more realistic and have recognizable digits.

4. Results and Discussion

We conducted extensive experimentation and testing to evaluate the performance of the proposed SRGAN-LP using various evaluation techniques. For this purpose, we collected a large-scale dataset as discussed in Section 4.1. Similarly, Section 4.2 briefly describes the experimental setup, followed by a comprehensive evaluation of the results in Section 4.3.

4.1. Dataset Acquisition

Data works as the fuel for deep learning models; however, collecting large amounts of vehicle license plate data with a uniform spatial resolution and almost the same lightning conditions is a challenging task. For this purpose, we accessed a license plate repository [11], and downloaded 3700 images with various backgrounds and digit colors as a raw dataset. To increase the number of images and diversify the angle of images, we used the data augmentation library “Augmentor” [12]. Using “Augmentor” we incorporated diversity into the images by changing their angles with the standard techniques such as tilt, skew, and rotate. Subsequently, we synthesized a dataset of 12,388 HR images from this raw dataset. The model was trained on the HR images using a standard spatial resolution of 256 × 256 pixels. We maintained a scale factor (δ) of four for the training. For testing purposes, we segregated 100 images from the synthesized dataset (synthetic test set) and downloaded another set of 100 images from Google, which is referred to as the real test set in this section.

4.2. Experimental Setup

We trained our proposed SRGAN-LP network on an NVIDIA GTX 1070 GPU with 12 GB memory and 24 GB RAM. For training G, we obtained low-resolution IL images by applying a motion blur β of size 16 and a down sampling factor δ of four, thus reducing the sizes of the images from 256 × 256 to 64 × 64. For D, we used the original high-resolution images. Our generator network consists of eight identical residual blocks Λ and two transposed convolution layers. We used the Adam optimization algorithm [29] for our network. For G and D, we maintained learning rates of 10−5 and 10−6, respectively. To train a composite model, that is, SRGAN-LP, we used a learning rate of 10−3. We used the deep learning library Keras [13], with TensorFlow [14] as the backend for the implementation of this network.

4.3. Performance Evaluation

Qualitative evaluation often involves human ratings, whereas quantitative evaluation comprises standard evaluation metrics in image processing, such as the PSNR and the structural similarity index metric (SSIM) [30]. In addition to qualitative and quantitative evaluations, the proposed SRGAN-LP was analyzed using optical character recognition (OCR) results.

4.3.1. Quantitative Evaluation

We conducted a quantitative evaluation for both of our test sets, that is, synthetic and real test sets, using the PSNR and SSIM [23,31].
PSNR (f, g) = 10log 10(255 2/MSE(f, g))
Equation (8) shows the formula for calculating the PSNR between the original and the reconstructed images. f is the original image and g is the reconstructed image obtained using a certain technique. A higher PSNR value indicates better results for SR.
S S I M   ( f , g ) = l ( f , g ) c ( f , g ) s ( f , g )
Similarly, Equation (9) represents the SSIM between the original and reconstructed images. The SSIM is the product of the differences in luminance l, contrast c, and structural similarity s between the original and generated images. The range of the SSIM is from 0 to 1, and a score closer to 1 is considered the best in the case of SR.
Table 2 shows the average PSNR and SSIM values for the results of the evaluation conducted on the synthetic test set. The higher values of PSNR and SSIM show the effectiveness of the proposed SRGAN-LP on the synthetic test set.
Table 3 shows the average PSNR and SSIM scores for the results of the evaluation conducted on the real test set. The above tables reveal the effectiveness of the proposed method in comparison to baseline techniques such as bilinear, bicubic, and SRCNN [32]. Moreover, the results are also compared with SRGAN trained on the ImageNet dataset. For further assessment, qualitative results are discussed in the next subsection.

4.3.2. Evaluation Using Inference Time

Deep learning inference time is the time consumed by a deep learning model for a single prediction. In the context of image reconstruction, that is the time required for a model to reconstruct a new image. The inference time depends on the number of model parameters. In Figure 4a,b, the size of the bubbles represents the number of parameters of the models. In the experiments, it was evident that the models with a larger parameter space had a higher inference time, whereas the models with a smaller number of parameters had a lower inference time. However, traditional models, without parameters, have remarkably low inference times. Low-parameter models with higher reconstruction scores can be deployed easily on resource-constrained devices.

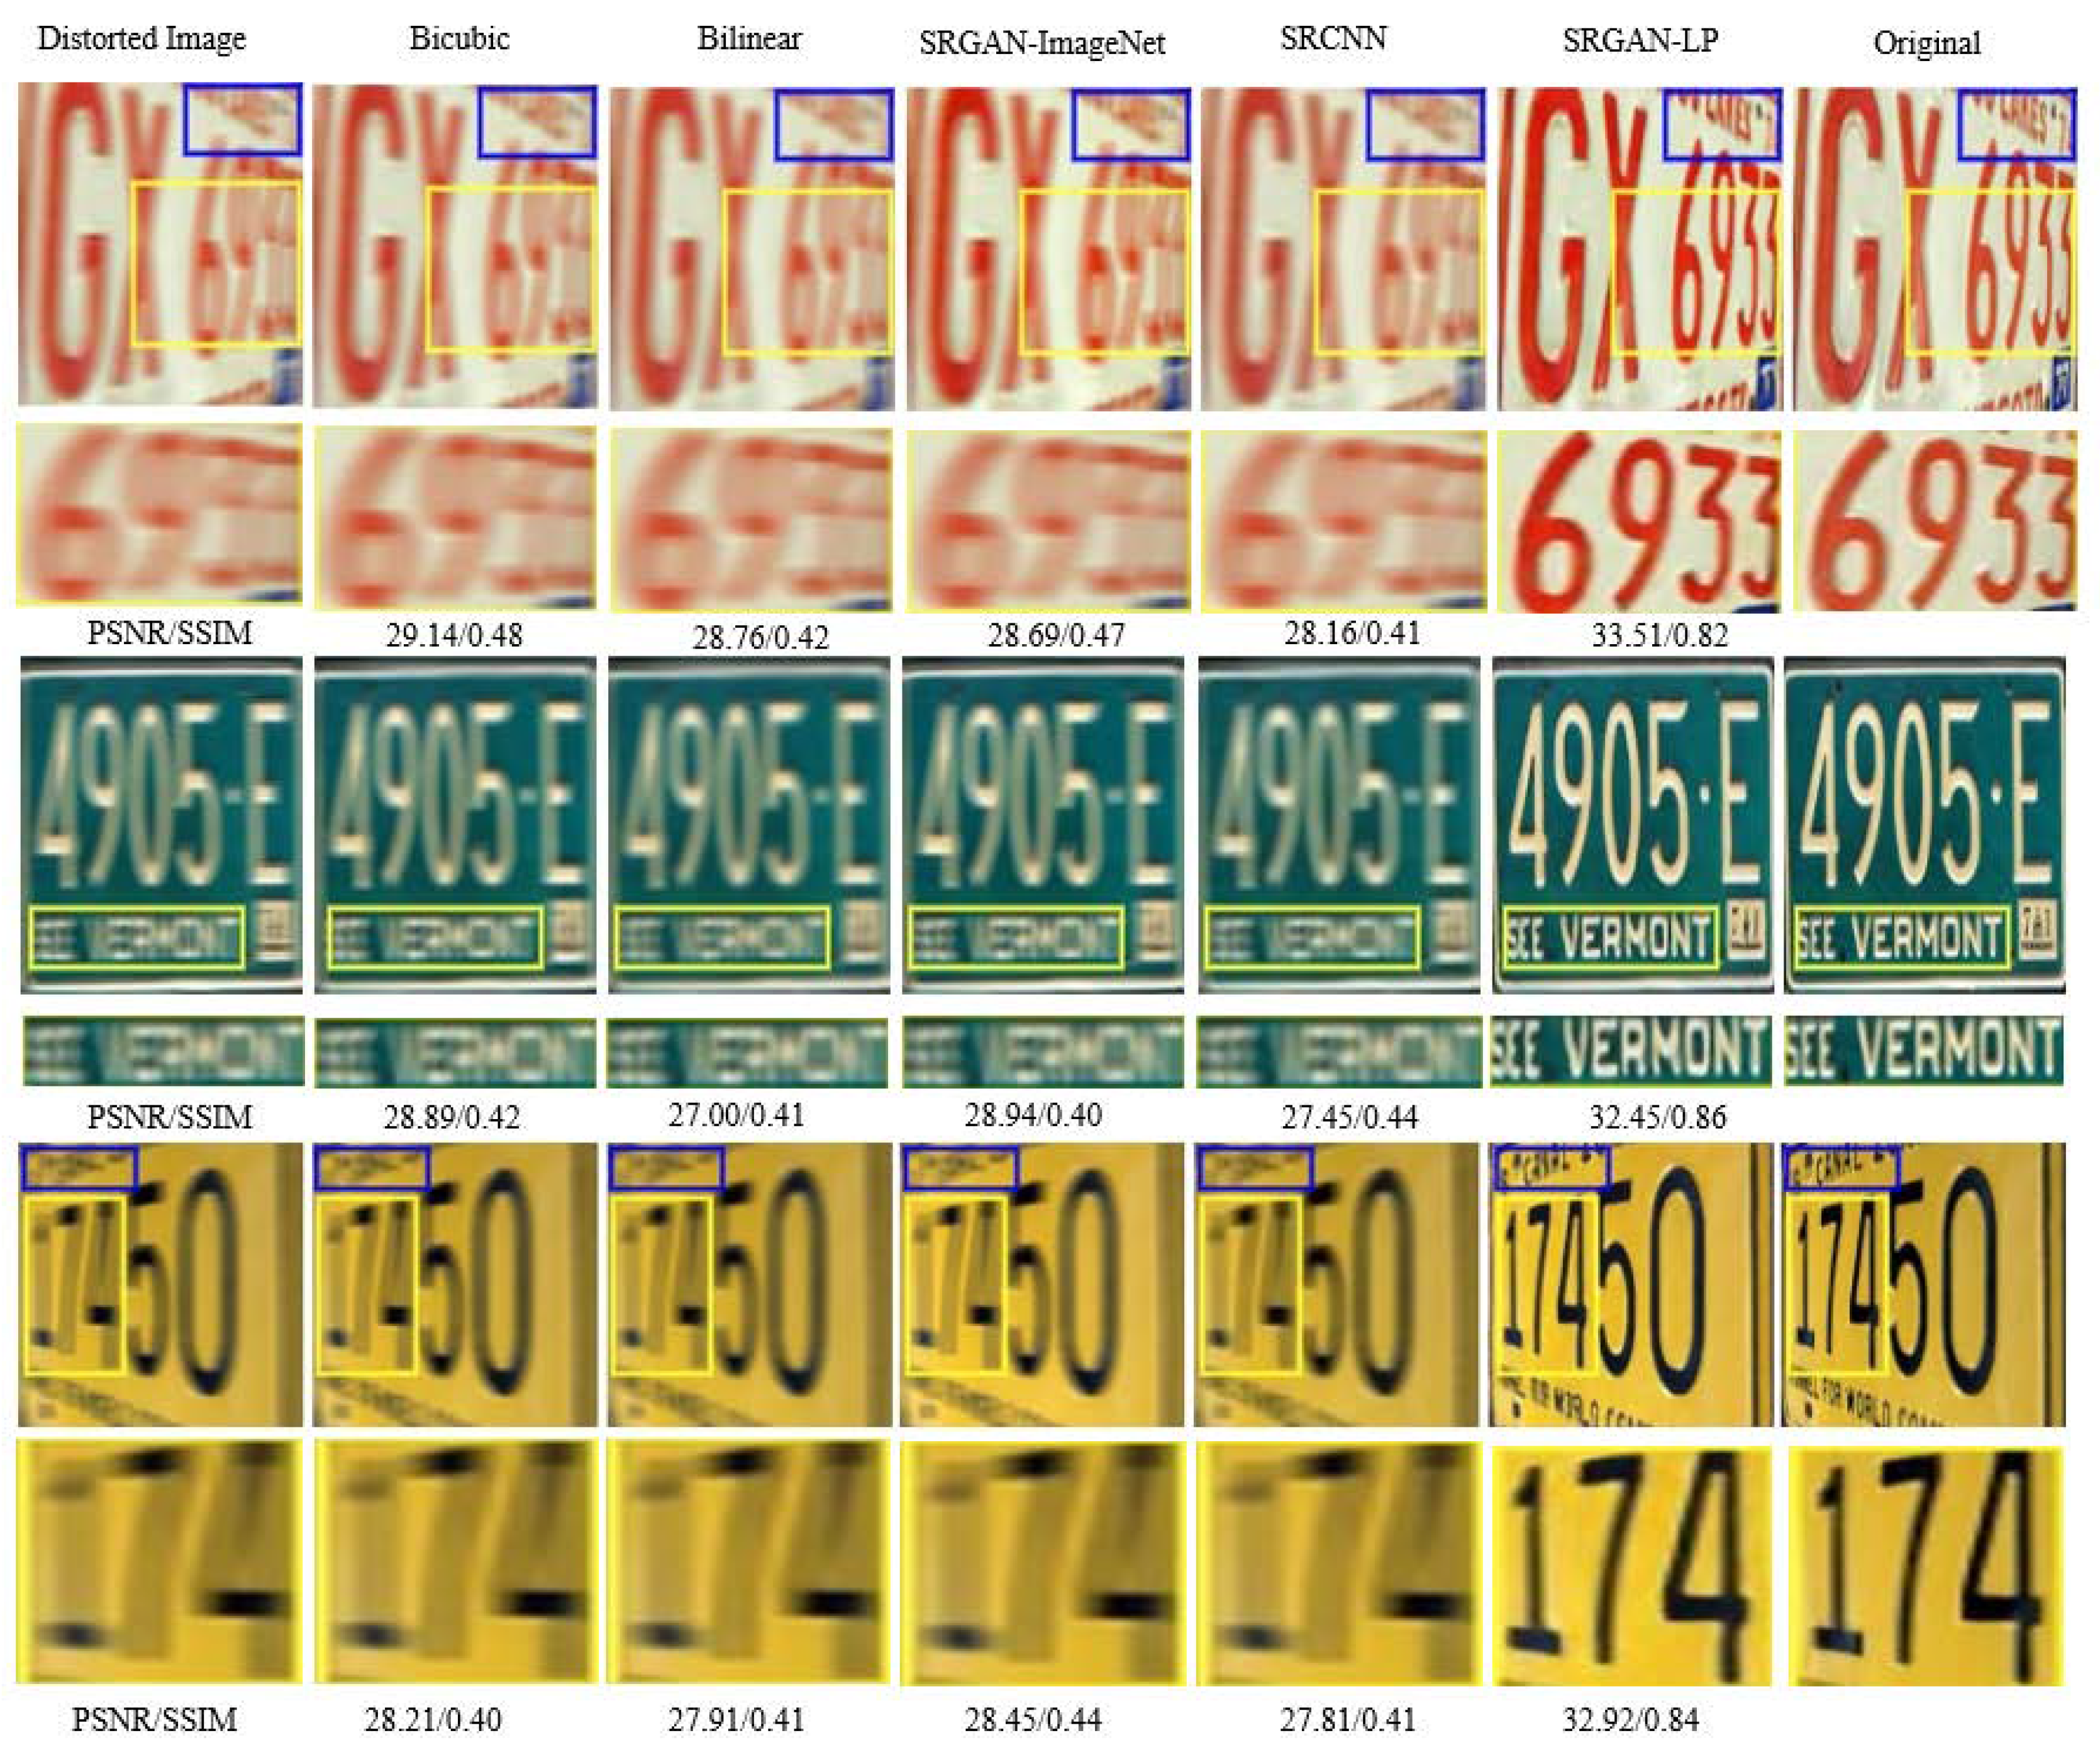
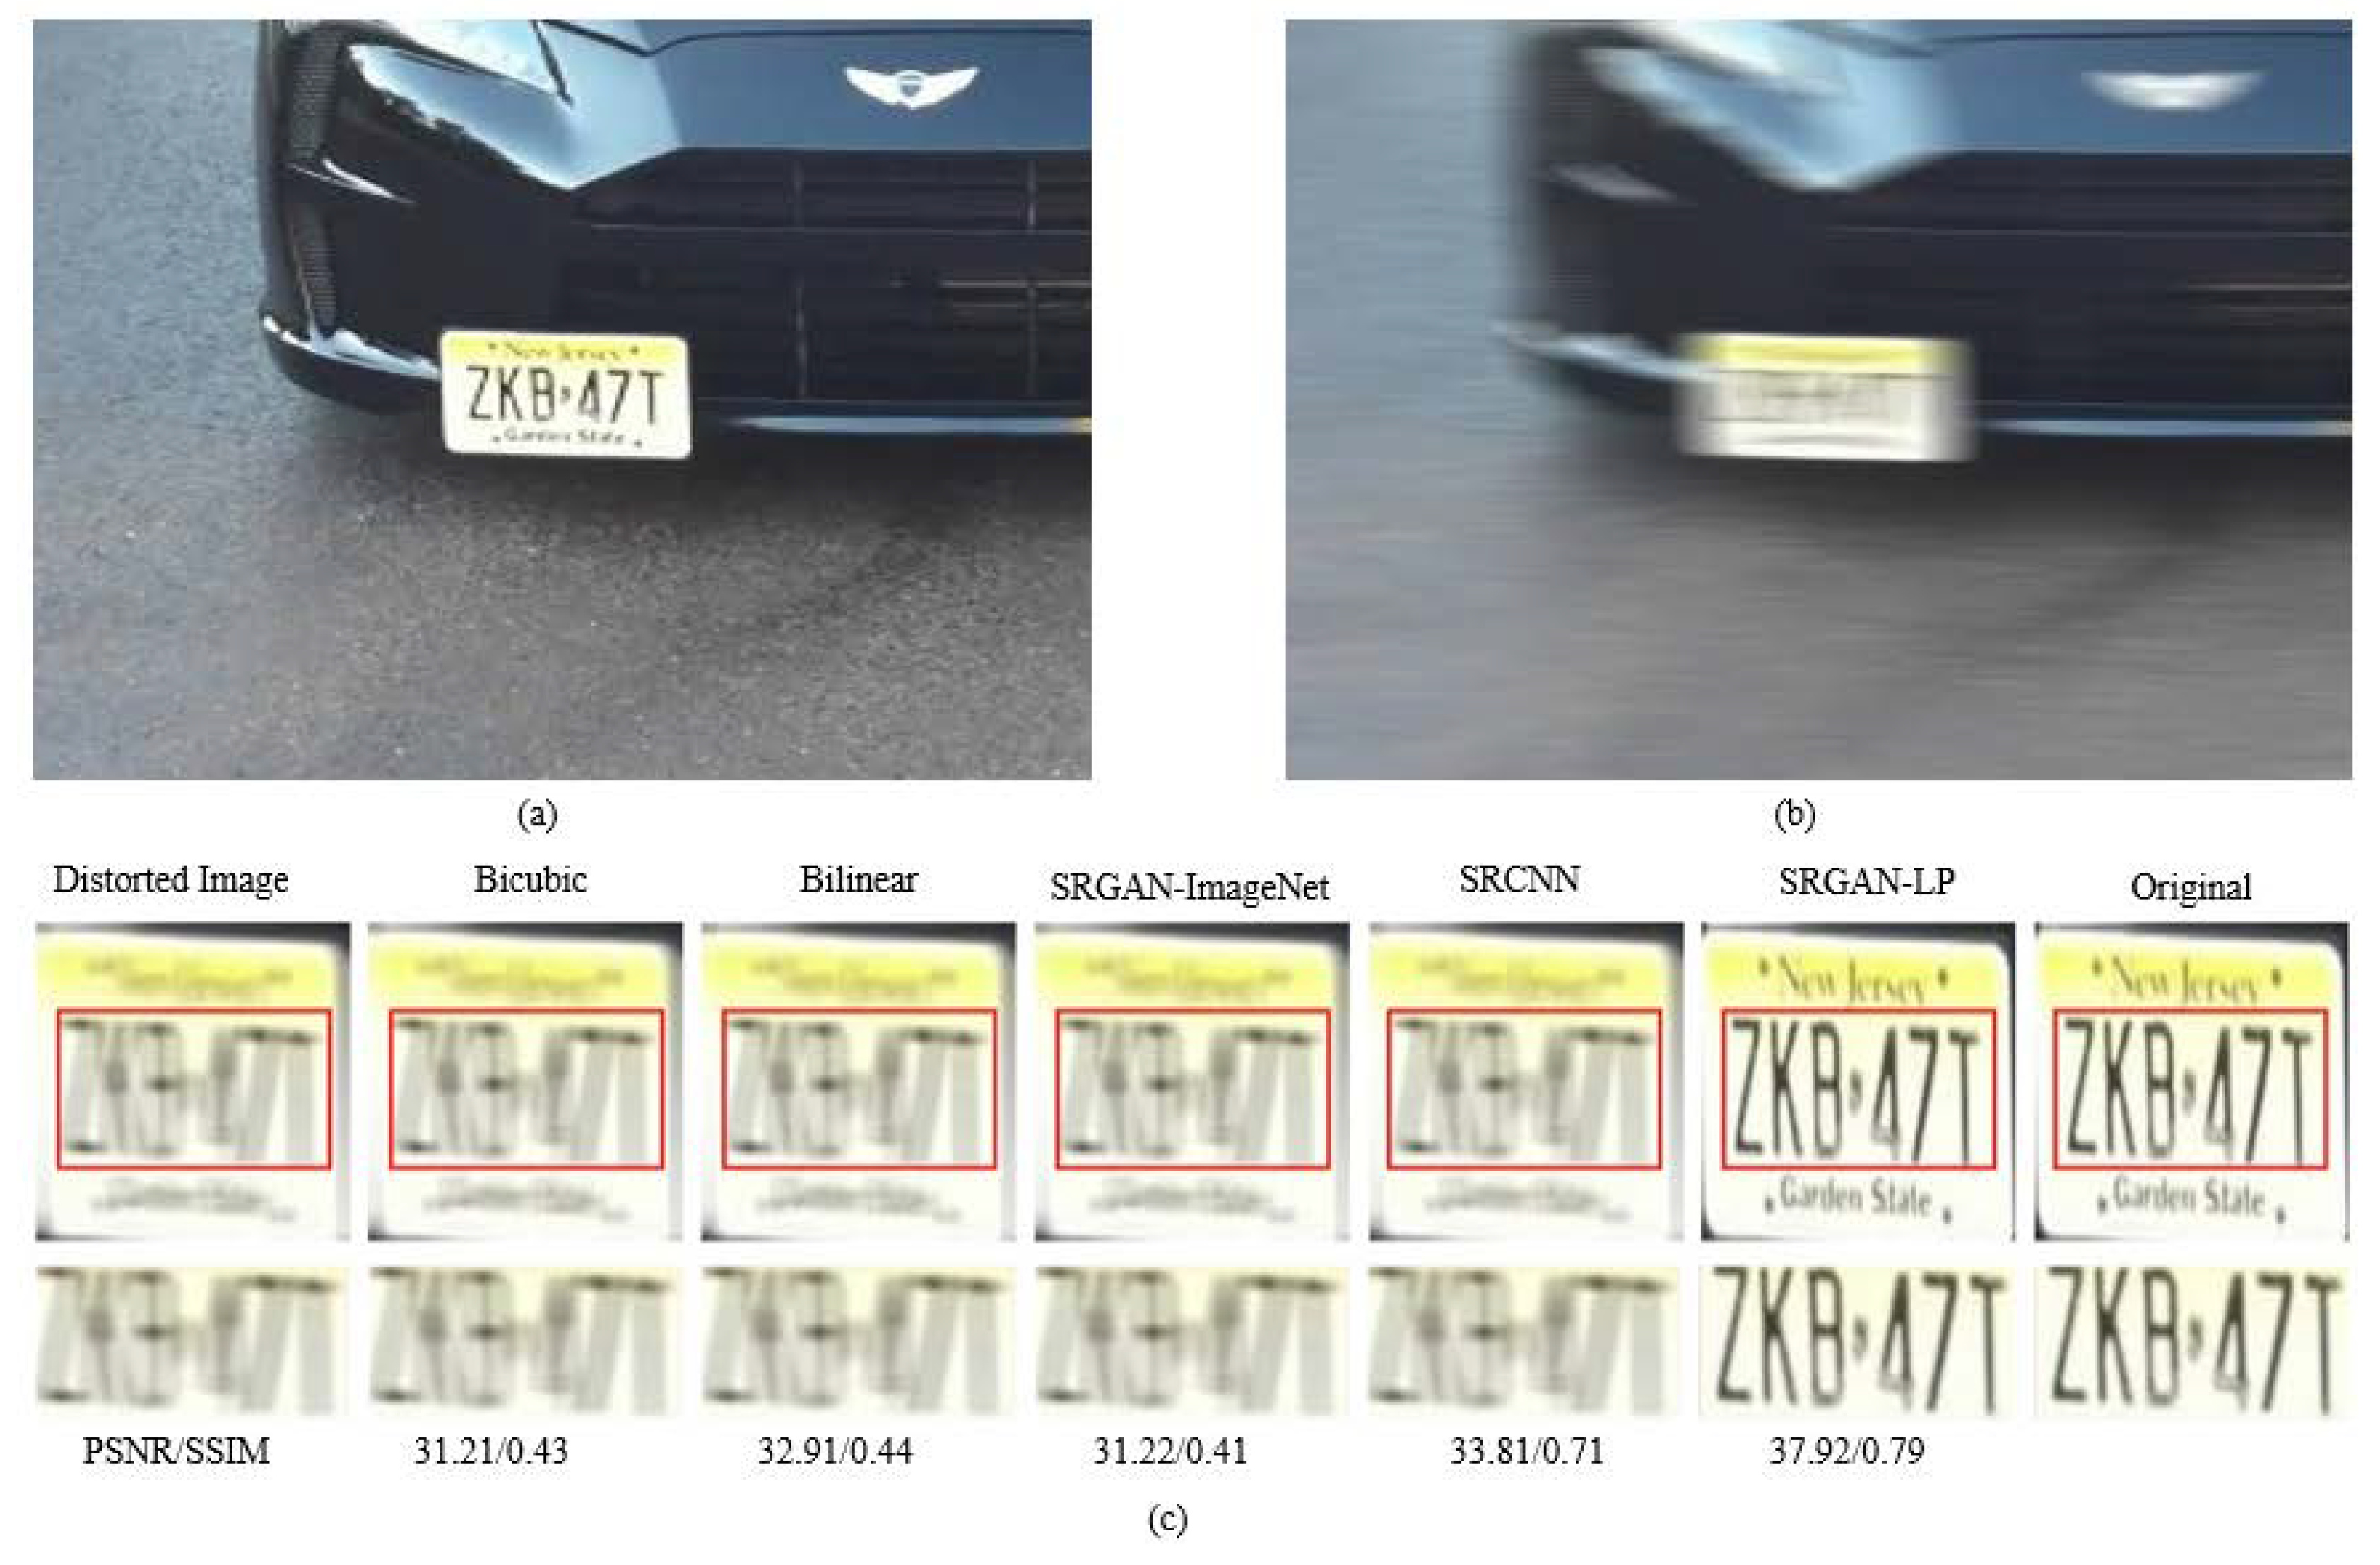
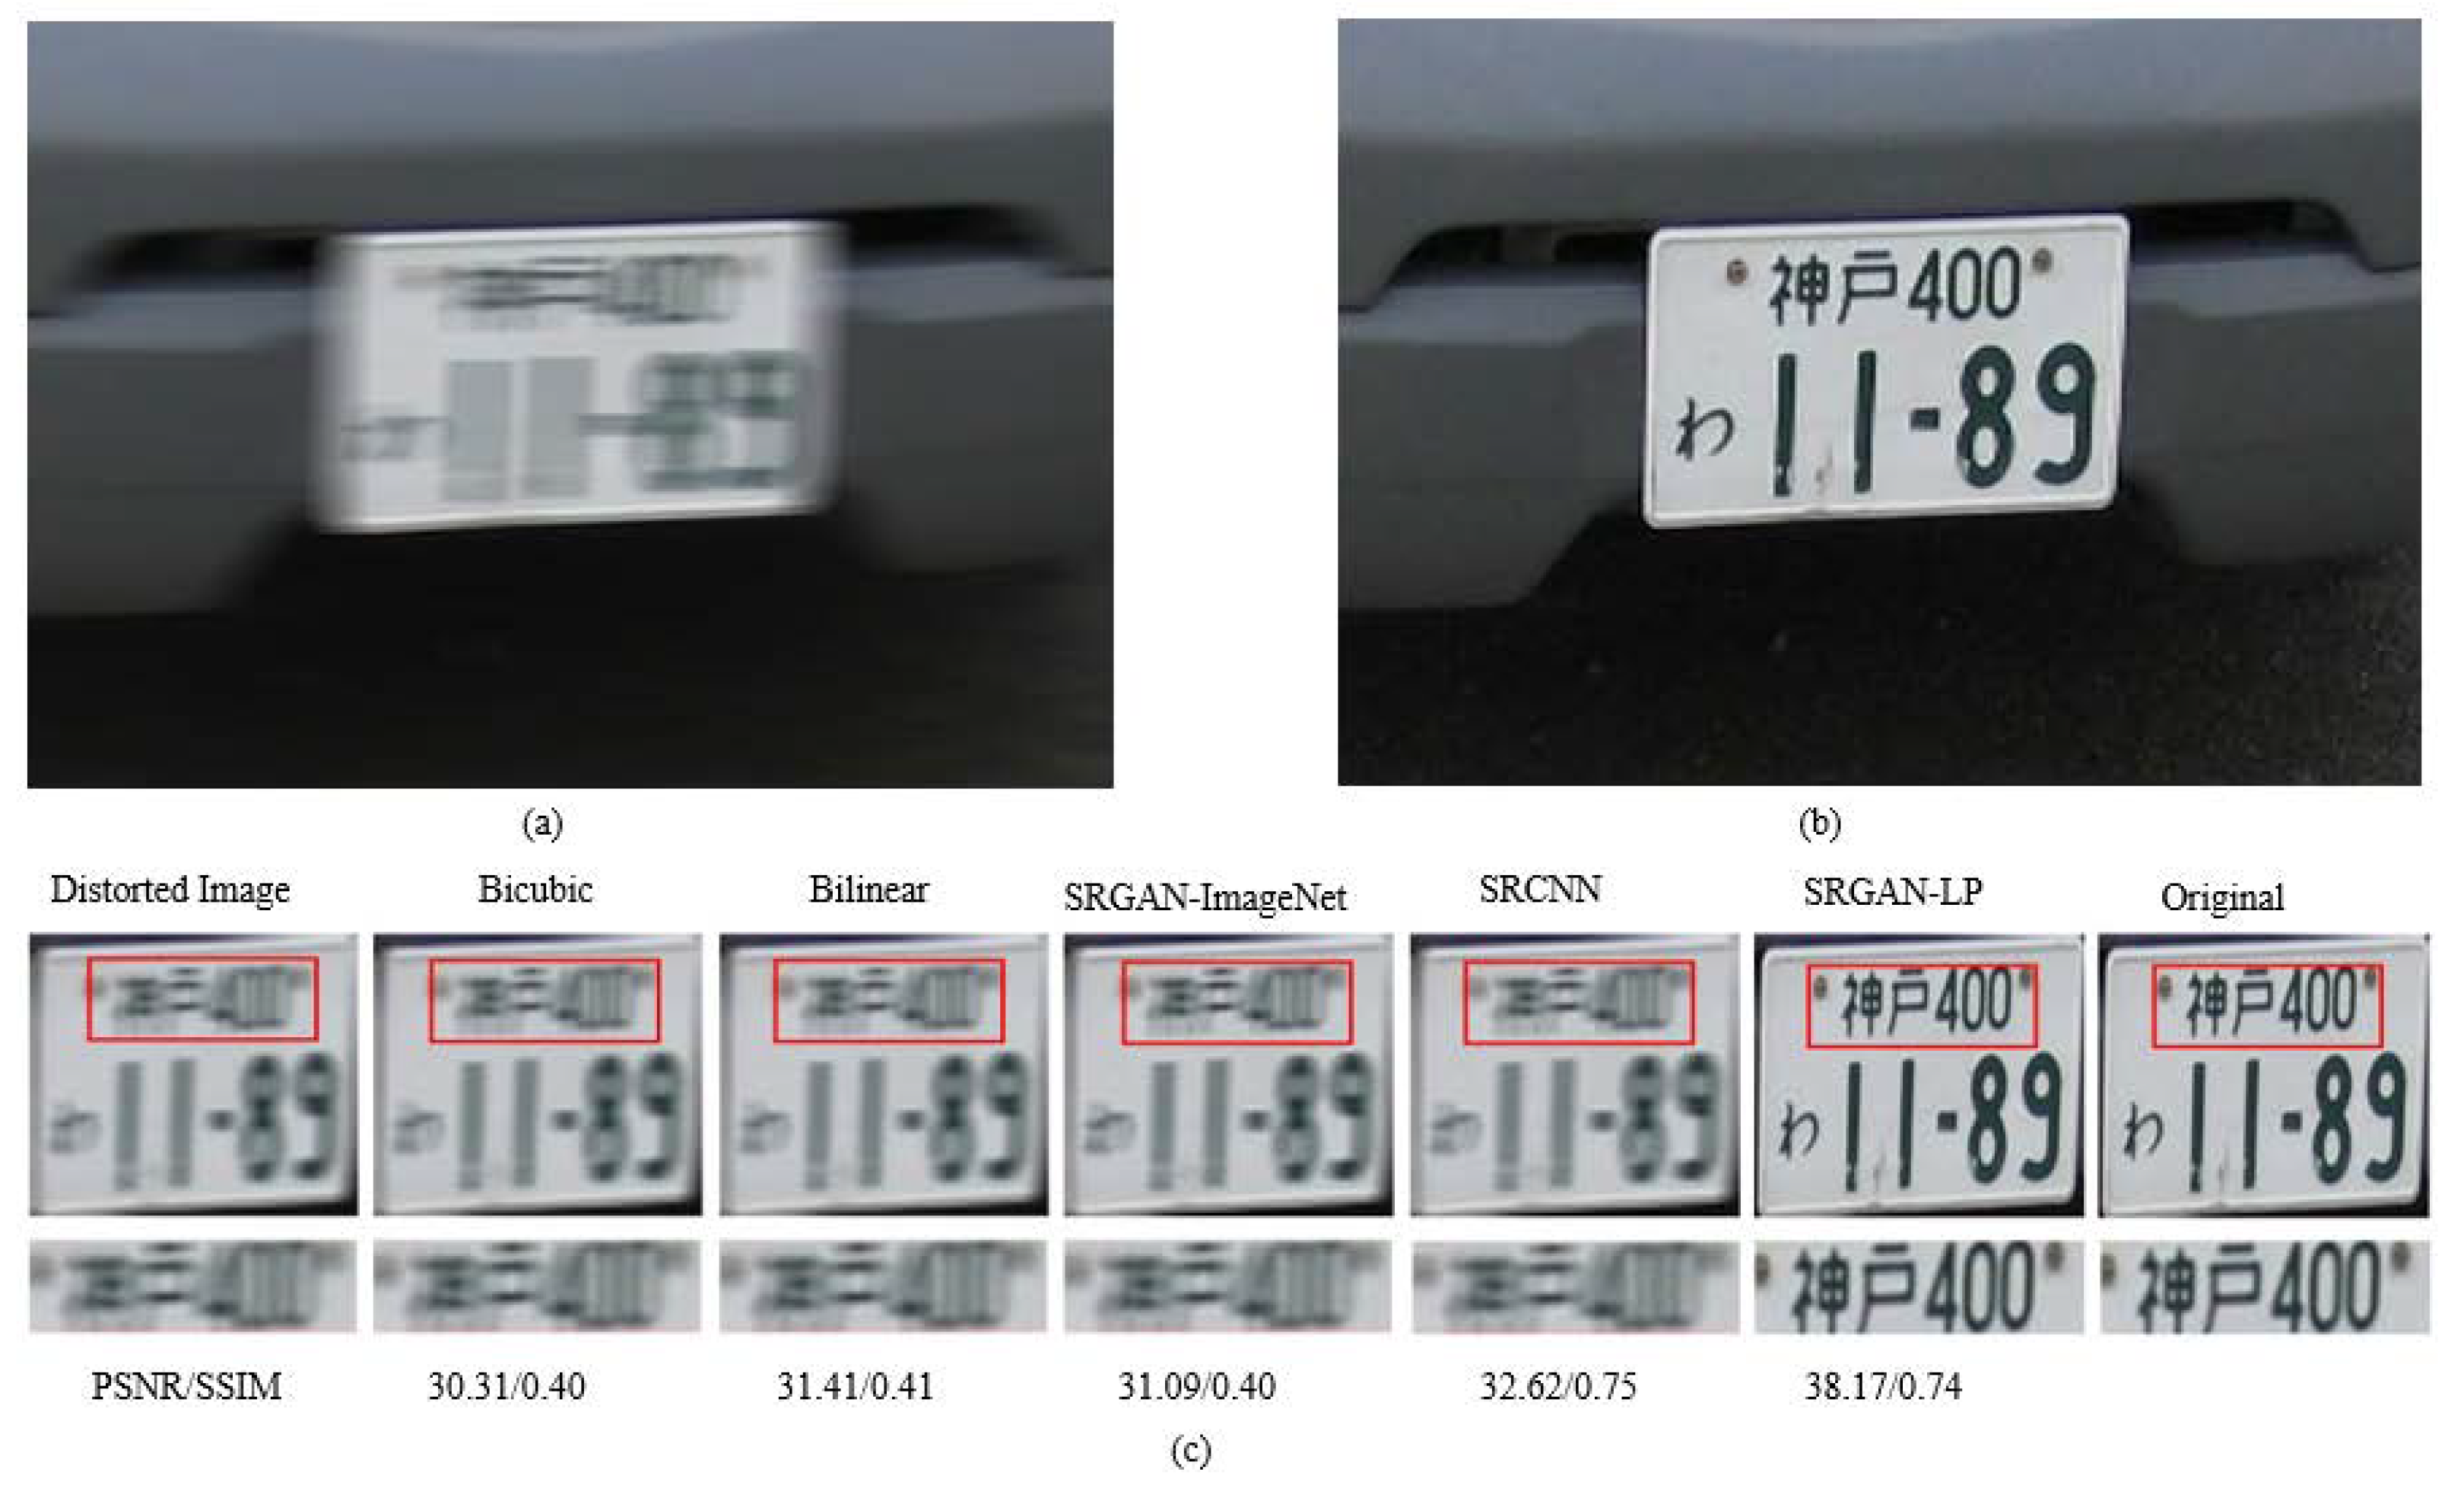
4.3.3. Qualitative Evaluation

In contrast to quantitative image assessment, which tends to assess image quality more technically, qualitative analysis involves human expertise. In qualitative analysis, the reconstructed images are subjected to human raters, who provide their opinions and assess the quality of the reconstructed images. The MOS score is one of the most widely used techniques for qualitative image assessments.
Figure 5 shows the visual quality of the reconstructed images of the synthetic test set. These images were presented to human raters to identify the quality of the images and, more importantly, to identify the digits that were highlighted using the yellow bounding box.
Similarly, Figure 6 and Figure 7 show the visual quality of the reconstructed images of the real test set. The same images of the real test set were presented to the human raters, and their opinions on the quality of the reconstructed images are presented in Figure 4.

4.3.4. Evaluation Using OCR

To further consolidate our experimental results, we subjected both testing sets (synthetic and real) to OCR. For this purpose, we used an OCR “platerecognizer”, publicly available in [33]. The accuracy of OCR is based on the number of characters present in an image versus the number of correctly recognized images. For instance, we have an image in the test set originally consisting of the characters GX6933; however, the OCR predicts different values, such as GX693, as shown in Figure 8. This misrecognition negatively contributes to the average accuracy of the OCR in recognizing license plate digits. The formula devised for calculating accuracy is as follows:
G e r r = 100 n e n c
Equation (10) represents the global error calculation rate of OCR for a given image. In the Equation, ne is the number of errors committed and nc is the number of all characters present in an image. Using this Equation, we present the following table to illustrate the performance of the OCR on different reconstruction techniques used in the experiments.
Table 4 shows the average accuracy of all the images present in both the test sets. The OCR’s accuracy depends significantly on the image’s position. Both test sets contained images that posed difficulties to the OCR in achieving accurate character recognition. However, the higher accuracy of the proposed method compared with the other methods verifies the effectiveness of our work, demonstrating its superiority.

5. Conclusions

This study aimed to enhance the quality of images of vehicle license plates by increasing the resolution and removing motion blurriness. Manual management of vehicles in a smart surveillance environment is an arduous task. Therefore, more attention has been paid to the intelligent management of vehicles in smart surveillance environments. In this regard, license plates are considered unique identification tags for vehicles. However, owing to the high-speed motion of vehicles, motion blur is the most common phenomenon occurring in surveillance environments. To tackle this challenge, we proposed SRGAN-LP, which intelligently performs deblurring as compared to other methods. Extensive experimental results indicate that the proposed method outperforms the existing methods in terms of achieving a high-resolution deblurred image.
The results obtained by the proposed method were better both in terms of qualitative and quantitative evaluations compared to the existing methods. However, the inference time was relatively high. Achieving real-time performance, by reducing the inference time of the proposed SRGAN-LP, is suggested as future work. In addition, the evaluation can be extended using other metrics, and more modules can be added to the system, such as vehicle recognition [34], vehicle logo recognition [35], and make/model recognition [36], for better vehicular analysis.

Author Contributions

All authors contributed to conceptualization, methodology, software, validation, formal analysis, investigation, data curation, writing—original draft preparation, writing—review and editing, visualization, supervision, project administration, and funding acquisition. All authors have read and agreed to the published version of the manuscript.

Funding

This work was supported by the Deanship of Scientific Research at the University of Tabuk through Research No. 0254-1443-S.

Data Availability Statement

Not applicable.

Acknowledgments

The authors extend their appreciation to the Deanship of Scientific Research at the University of Tabuk for funding this work through Research No. 0254-1443-S.

Conflicts of Interest

The authors declare no conflict of interest.

References

  1. Abuelsamid, S.; Alexander, D.; Jerram, L. Navigant Research Leaderboard Report: Automated Driving; Navigant: Chicago, IL, USA, 2017. [Google Scholar]
  2. Aung, N.; Zhang, W.; Sultan, K.; Dhelim, S.; Ai, Y. Dynamic traffic congestion pricing and electric vehicle charging management system for the internet of vehicles in smart cities. Digit. Commun. Netw. 2021, 7, 492–504. [Google Scholar] [CrossRef]
  3. Dong, R.; Zhang, L.; Fu, H. RRSGAN: Reference-based super-resolution for remote sensing image. IEEE Trans. Geosci. Remote Sens. 2021, 60, 5601117. [Google Scholar] [CrossRef]
  4. Qu, L.; Zhu, X.; Zheng, J.; Zou, L. Triple-attention-based parallel network for hyperspectral image classification. Remote Sens. 2021, 13, 324. [Google Scholar]
  5. Xue, J.; Zhao, Y.-Q.; Bu, Y.; Liao, W.; Chan, J.C.-W.; Philips, W. Spatial-spectral structured sparse low-rank representation for hyperspectral image super-resolution. IEEE Trans. Image Process. 2021, 30, 3084–3097. [Google Scholar]
  6. Lei, M.; Li, J.; Li, M.; Zou, L.; Yu, H. An Improved UNet++ Model for Congestive Heart Failure Diagnosis Using Short-Term RR Intervals. Diagnostics 2021, 11, 534. [Google Scholar] [CrossRef]
  7. Yan, J.; Zhang, T.; Broughton-Venner, J.; Huang, P.; Tang, M.-X. Super-resolution ultrasound through sparsity-based deconvolution and multi-feature tracking. IEEE Trans. Med. Imaging 2022, 41, 1938–1947. [Google Scholar] [PubMed]
  8. Li, Y.; Sixou, B.; Peyrin, F. A review of the deep learning methods for medical images super resolution problems. Irbm 2021, 42, 120–133. [Google Scholar] [CrossRef]
  9. Zamir, S.W.; Arora, A.; Khan, S.; Hayat, M.; Khan, F.S.; Yang, M.-H. Restormer: Efficient transformer for high-resolution image restoration. In Proceedings of the IEEE/CVF Conference on Computer Vision and Pattern Recognition, New Orleans, LA, USA, 18–24 June 2022; pp. 5728–5739. [Google Scholar]
  10. Christensen-Jeffries, K.; Couture, O.; Dayton, P.A.; Eldar, Y.C.; Hynynen, K.; Kiessling, F.; O’Reilly, M.; Pinton, G.F.; Schmitz, G.; Tang, M.-X. Super-resolution ultrasound imaging. Ultrasound Med. Biol. 2020, 46, 865–891. [Google Scholar] [CrossRef]
  11. Afrakhteh, S.; Jalilian, H.; Iacca, G.; Demi, L. Temporal super-resolution of echocardiography using a novel high-precision non-polynomial interpolation. Biomed. Signal Process. Control 2022, 78, 104003. [Google Scholar]
  12. Li, J.; Pei, Z.; Zeng, T. From beginner to master: A survey for deep learning-based single-image super-resolution. arXiv 2021, arXiv:2109.14335. [Google Scholar]
  13. Ledig, C.; Theis, L.; Huszár, F.; Caballero, J.; Cunningham, A.; Acosta, A.; Aitken, A.; Tejani, A.; Totz, J.; Wang, Z. Photo-realistic single image super-resolution using a generative adversarial network. In Proceedings of the IEEE Conference on Computer Vision and Pattern Recognition, Honolulu, HI, USA, 21–26 July 2017; pp. 4681–4690. [Google Scholar]
  14. Cho, S.-J.; Ji, S.-W.; Hong, J.-P.; Jung, S.-W.; Ko, S.-J. Rethinking coarse-to-fine approach in single image deblurring. In Proceedings of the IEEE/CVF International Conference on Computer Vision, Montreal, BC, Canada, 11–17 October 2021; pp. 4641–4650. [Google Scholar]
  15. Hwang, J.W.; Lee, H.S. Adaptive image interpolation based on local gradient features. IEEE Signal Process. Lett. 2004, 11, 359–362. [Google Scholar]
  16. Simonyan, K.; Zisserman, A. Very deep convolutional networks for large-scale image recognition. arXiv 2014, arXiv:1409.1556. [Google Scholar]
  17. Goodfellow, I.; Pouget-Abadie, J.; Mirza, M.; Xu, B.; Warde-Farley, D.; Ozair, S.; Courville, A.; Bengio, Y. Generative adversarial nets. In Proceedings of the Advances in Neural Information Processing Systems 27 (NIPS 2014), Montreal, BC, Canada, 8–13 December 2014; Volume 7. [Google Scholar]
  18. Mao, X.; Li, Q.; Xie, H.; Lau, R.Y.; Wang, Z.; Paul Smolley, S. Least squares generative adversarial networks. In Proceedings of the IEEE International Conference on Computer Vision, Venice, Italy, 22–29 October 2017; pp. 2794–2802. [Google Scholar]
  19. Lim, B.; Son, S.; Kim, H.; Nah, S.; Mu Lee, K. Enhanced deep residual networks for single image super-resolution. In Proceedings of the IEEE Conference on Computer Vision and Pattern Recognition Workshops, Honolulu, HI, USA, 21–26 July 2017; pp. 136–144. [Google Scholar]
  20. Wang, T.-C.; Liu, M.-Y.; Zhu, J.-Y.; Tao, A.; Kautz, J.; Catanzaro, B. High-resolution image synthesis and semantic manipulation with conditional gans. In Proceedings of the IEEE Conference on Computer Vision and Pattern Recognition, Salt Lake City, UT, USA, 18–23 June 2018; pp. 8798–8807. [Google Scholar]
  21. Kupyn, O.; Budzan, V.; Mykhailych, M.; Mishkin, D.; Matas, J. Deblurgan: Blind motion deblurring using conditional adversarial networks. In Proceedings of the IEEE Conference on Computer Vision and Pattern Recognition, Salt Lake City, UT, USA, 18–23 June 2018; pp. 8183–8192. [Google Scholar]
  22. Wang, L.; Li, Y.; Wang, S. DeepDeblur: Fast one-step blurry face images restoration. arXiv 2017, arXiv:1711.09515. [Google Scholar]
  23. Nah, S.; Hyun Kim, T.; Mu Lee, K. Deep multi-scale convolutional neural network for dynamic scene deblurring. In Proceedings of the IEEE Conference on Computer Vision and Pattern Recognition, Honolulu, HI, USA, 21–26 July 2017; pp. 3883–3891. [Google Scholar]
  24. Gou, C.; Wang, K.; Yao, Y.; Li, Z. Vehicle license plate recognition based on extremal regions and restricted Boltzmann machines. IEEE Trans. Intell. Transp. Syst. 2015, 17, 1096–1107. [Google Scholar]
  25. Li, H.; Shen, C. Reading car license plates using deep convolutional neural networks and LSTMs. arXiv 2016, arXiv:1601.05610. [Google Scholar]
  26. Guo, J.-M.; Liu, Y.-F. License plate localization and character segmentation with feedback self-learning and hybrid binarization techniques. IEEE Trans. Veh. Technol. 2008, 57, 1417–1424. [Google Scholar]
  27. Jiao, J.; Ye, Q.; Huang, Q. A configurable method for multi-style license plate recognition. Pattern Recognit. 2009, 42, 358–369. [Google Scholar] [CrossRef]
  28. Shi, B.; Bai, X.; Yao, C. An end-to-end trainable neural network for image-based sequence recognition and its application to scene text recognition. IEEE Trans. Pattern Anal. Mach. Intell. 2016, 39, 2298–2304. [Google Scholar] [CrossRef]
  29. Kingma, D.P.; Ba, J. Adam: A method for stochastic optimization. arXiv 2014, arXiv:1412.6980. [Google Scholar]
  30. Hore, A.; Ziou, D. Image quality metrics: PSNR vs. SSIM. In Proceedings of 2010 20th International Conference on Pattern Recognition, Istanbul, Turkey, 23–26 August 2010; pp. 2366–2369. [Google Scholar]
  31. Bakurov, I.; Buzzelli, M.; Schettini, R.; Castelli, M.; Vanneschi, L. Structural similarity index (SSIM) revisited: A data-driven approach. Expert Syst. Appl. 2022, 189, 116087. [Google Scholar] [CrossRef]
  32. Dong, C.; Loy, C.C.; He, K.; Tang, X. Learning a deep convolutional network for image super-resolution. In Proceedings of the European Conference on Computer Vision, Zurich, Switzerland, 6–12 September 2014; pp. 184–199. [Google Scholar]
  33. Plate Recognizer, Version 1.26.0; ParkPow, Inc.: Budapest, Hungary, 2021. Available online: https://platerecognizer.com/(accessed on 25 January 2023).
  34. Jiang, C.; Zhang, B. Weakly-supervised vehicle detection and classification by convolutional neural network. In Proceedings of the 2016 9th International Congress on Image and Signal Processing, BioMedical Engineering and Informatics (CISP-BMEI), Datong, China, 15–17 October 2016; pp. 570–575. [Google Scholar]
  35. Lu, W.; Zhao, H.; He, Q.; Huang, H.; Jin, X. Category-consistent deep network learning for accurate vehicle logo recognition. Neurocomputing 2021, 463, 623–636. [Google Scholar]
  36. Tafazzoli, F.; Frigui, H.; Nishiyama, K. A large and diverse dataset for improved vehicle make and model recognition. In Proceedings of the IEEE Conference on Computer Vision and Pattern Recognition Workshops, Nashville, TN, USA, 15–19 June 2021; pp. 1–8. [Google Scholar]
Figure 1. Overview of the proposed methodology. IH and IL are acquired from the (a) Surveillance environment. In the (b) Training process, the generator receives IL and removes blur and upscales the IL to IS. The discriminator and VGG-19 calculate adversarial loss and content loss between the original IH and generated IS. Finally, both losses are added proportionately to form perceptual loss lS. Subsequently, lS updates the generator weights. For (c) Testing process, IL is directly inputted to the generator trained in the training process and IS is acquired as the resultant HR image.
Mathematics 11 00892 g001
Figure 2. Architecture of the generator network. “k” represents filter size, “n” is the number of filters, and “s” is the stride value used in a particular layer. Two types of convolutional blocks are used in the generator. A residual block is used for feature extraction, whereas the “UpSampling” block is used for converting an image from IS to IH.
Mathematics 11 00892 g002
Figure 3. Architecture of the discriminator network. “k” represents filter size, “n” is the number of filters, and “s” is the stride value used in a particular layer. Two types of convolutional blocks are used in the discriminator. One type of convolutional block comprises a convolution, batch normalization, and leaky ReLU layers. The other type of convolutional block lacks the batch normalization layer.
Mathematics 11 00892 g003
Figure 4. (a) Represents inference time of each reconstruction method on x-axis and mean opinion score (MOS) on y-axis for real-test set. Similarly, (b) illustrates the same for the synthetic test set. The results shown in both (a) and (b) suggest that the proposed SRGAN-LP is the most convincing to the human raters, achieving 4.5 MOS on the real test set and 5.0 on the synthetic test set.
Mathematics 11 00892 g004
Figure 5. Visual quality along with corresponding PSNR/SSIM of the reconstructed images using different techniques used in the experiments.
Mathematics 11 00892 g005
Figure 6. (a) Ground truth image (original image), (b) Motion blur applied on whole image (distorted image), (c) Visual quality of the reconstructed images along with the corresponding PSNR/SSIM scores.
Mathematics 11 00892 g006
Figure 7. (a) Ground truth image (original image), (b) Motion blur applied on whole image (distorted image), (c) Visual quality of the reconstructed images along with the corresponding PSNR/SSIM scores.
Mathematics 11 00892 g007
Figure 8. (a) Illustrates the visual results of OCR for the real test set, whereas (b) visualizes the results for the synthetic test set. Similarly, the green and red dots indicate the correct and incorrect predictions respectively.
Mathematics 11 00892 g008
Table 1. Description of input and output parameters used in the proposed model.
SymbolDescriptionSymbolDescription
DDiscriminator modelGGenerator model
D θ D Discriminator parameterized by θ D G θ G Generator parameterized by θ G
AA variable parameter in leaky ReLU used in DθModel parameters
IHHigh-resolution imageISSuper-resolution image
CColor channelsILLow-resolution image
wWeights of layersbBiases of layers
δScaling factorβMotion blur
ΛNumber of residual blocksQBatch size
kNumber of filters in a layersStride of a convolution filter
lSPerceptual lossNTotal number of images in dataset
Table 2. Average PSNR (dB) and SSIM of 100 reconstructed test images for the synthetic test set. Bold scores show the best results, and underlined values represent the second best results.
Bilinear [15]Bicubic [15]SRCNN [8]SRGAN-ImageNet [13]SRGAN-LP
PSNR29.1628.0329.3830.1141.24
SSIM0.390.420.520.400.81
Table 3. Average PSNR (dB) and SSIM of 100 reconstructed test images for the real test set. Bold scores show the best results and underlined values represent the second best results.
Bilinear [15] Bicubic [15]SRCNN [8]SRGAN-ImageNet [13]SRGAN-LP
PSNR34.7435.6533.5831.1138.76
SSIM0.430.430.890.420.72
Table 4. Average accuracy calculated for synthetic test set and real test set.
Recognition
Accuracy
Distorted ImageBicubic [15]Bilinear [15]SRGAN-ImageNet [13]SRCNN [8]SRGAN-LPOriginal
Synthetic Test Set (%)82838084859297
Real Test Set (%)79787980819395
Disclaimer/Publisher’s Note: The statements, opinions and data contained in all publications are solely those of the individual author(s) and contributor(s) and not of MDPI and/or the editor(s). MDPI and/or the editor(s) disclaim responsibility for any injury to people or property resulting from any ideas, methods, instructions or products referred to in the content.

