Article

Determining Unintentional Island Threshold to Enhance the Reliability in an Electrical Distribution Grid

by
Ahmed Amirul Arefin
1,
Md. Siddikur Rahman
1,
Molla Shahadat Hossain Lipu
2,
Mahidur R. Sarker
3,4,*,
Narinderjit Singh Sawaran Singh
5,* and
Sheikh Tanzim Meraj
1
1
Department of Electrical and Electronic Engineering, Universiti Teknologi PETRONAS, Seri Iskandar 32610, Malaysia
2
Department of Electrical and Electronic Engineering, Green University of Bangladesh, Dhaka 1207, Bangladesh
3
Institute of IR 4.0, Universiti Kebangsaan Malaysia, Bangi 43600, Malaysia
4
Industrial Engineering and Automotive, Nebrija University, Campus Princesa, C. de Sta. Cruz de Marcenado, 27, 28015 Madrid, Spain
5
Faculty of Data Science and Information Technology, INTI International University, Persiaran Perdana BBN Putra Nilai, Nilai 71800, Malaysia
*
Authors to whom correspondence should be addressed.
Mathematics 2023, 11(4), 886; https://doi.org/10.3390/math11040886
Submission received: 13 January 2023 / Revised: 2 February 2023 / Accepted: 7 February 2023 / Published: 9 February 2023
(This article belongs to the Special Issue Modeling, Simulation, and Analysis of Electrical Power Systems)

Abstract

:
Due to the significant number of distributed generators in the electric power system, islanding detection requirements are becoming an increasingly prominent aspect of the power system. The island detection system depends on accurate threshold determination since an incorrect threshold might result in a hazardous situation. To evaluate the proposed method’s capacity to discriminate between different events, this study examined different unintentional islanding conditions such as under frequency and over frequency. The purpose of this study is to establish the threshold of the under and over frequency island conditions. The under frequency island condition happens when the distributed generator (DG) capacity exceeds the amount of connected load; on the other hand, the over frequency island condition happens during a higher connected load compared to the capacity of the DG. The contribution of this research is to propose an unintentional island threshold setting technique based on bus voltage angle difference data of the phasor measurement unit (PMU). In the PowerWorld simulator, the Utility Kerteh (location: Terengganu, Malaysia) bus system has been designed and simulated in this work. The test system has four distinct islanding scenarios under two conditions, and the performance of the proposed methods demonstrates that for the under frequency islanding conditions the scenario’s threshold can be taken at a minimum of 40 milliseconds (ms) and a maximum of 60 ms, while the over frequency condition island threshold can be placed at a minimum of 60 ms and a maximum of 80 ms depending on the scenarios. Therefore, the proposed technique will be contributed to increase the reliability of the overall distribution grid so the unintentional island can be detected faster in terms of time.

1. Introduction

The transition from a conventional grid to a microgrid employing a combination of distributed generator (DG) units is accelerating globally [1]. A renewable DG has its own disadvantages despite the significant economic and environmental benefits it offers, such as challenges with electrical system management [2]. Voltage variations, power swing, and quality of power issues brought together by the intermittent nature of renewable energy sources are non-disputable [3]. Although, when the microgrid is electrically isolated from its connected utility side, its DG components are nonetheless powered to meet the local load requirement during the islanding situation [4]. Therefore, island detection in a microgrid is necessary for it to perform its function. The fault current of a synchronous generator-based DG is substantially higher than that of an inverter-based DG. However, to protect the power electronics components, the fault current should be lower. There are two operational modes for the microgrid and they are connected by the grid mode and mode of islanding. The level of the fault current in the islanding mode is significantly lower compared to the mode of the grid connection. The level of the fault current is difficult to detect when the level is comparative during faulted circumstances and interferes with relay coordination [5]. In addition, to fulfill the energy demand, the microgrid’s network structure and operating circumstances may alter. The fault current fluctuates dramatically when the mode of the microgrid changes. A relay must be able to detect flaws in these topological deviations. Microgrids have also been proposed with traditional fault detection techniques depending on the rule of overcurrent [6], current distortion [7], and relaying scheme which is based on length [8]. However, the majority of those systems are only applicable for regional distance and power flow, which is non-directional. An improved length-based fault direction approach for protecting the microgrid was proposed in [9] to address the intermittent difficulties of protection systems in DGs. This strategy, however, is limited to microgrids with inverter-based DGs. In [10], a scheme for primary and backup protection has been proposed depending on a fault current deviation approach. However, when the resistance fault is high, the performance of the mentioned technique is insufficient for under frequency and over frequency island networks. A defect detection system based on a transient monitoring function obtained from inverter current data was proposed in [11]. The length of the detection time affects the accuracy of defect detection in this technique. Wide-area measuring might be challenging for creating trustworthy measures to relieve the aforementioned challenges in microgrid protection [12]. Phasor measurement units (PMUs) are gaining popularity for detecting and protecting the microgrid from transient faults and islands [13]. A real-time defect detection system based on a PMU state estimator was suggested in [14]. The test bed consisted of 18 buses where PMUs are installed in each one of a distribution system equipped with a DG in the Netherlands. However, this method has a relatively slow reaction time. Similar methods for defect detection using PMU data were used in [15]. The authors of [16] propose a sequence components-based differential fault detection technique, which is exclusively applicable to microgrids with an inverter-based DG. In [17], the authors introduced a nodal price compensation payment based on contingency assessment to decrease the energy consumption of nodal consumers. The IEEE_RTS 24 nodes system is employed to validate and execute the proposed method. In [18], the authors proposed a technique to examine the nodal price and nodal reliability of deregulated power systems based on an optimal power flow method and a probabilistic reliability assessment approach. A reliability test system (RBTS) is applied to verify and evaluate the proposed method. The cost of installation is one of the main barriers to integrating PMUs into distribution grids. The authors of [19] presented the PMU idea for creating a microgrid protection system. As a result, the suggested method broadens the use of PMUs in developing a microgrid protection strategy that is both effective and dependable. One significant change is that the integration of large-scale distributed renewable generation has resulted in active distribution grids with bi-directional power flows, as opposed to traditional electricity distribution grids, which assumed power flows from high voltage grids to low voltage grids for protection and control [20]. The falsified assumptions have prompted an extensive investigation into a variety of issues related to the preservation and control of distributed renewable power [21]. Among these, many power system operators believe that the increased likelihood of uncontrolled islanding operations is one of the most pressing concerns that must be addressed. Traditional islanding detection methods, such as rate of change of frequency (RoCoF) and vector shift [22], are, on the other hand, exceedingly sensitive and can result in a large number of unnecessary trips or false trips. In [23], the voltage angle of the PMU was used as a slip frequency and acceleration for detecting the match frequency island condition, but due to the higher threshold setting the detection occurred at 500 ms. In [24], an island threshold setting methodology was discussed using a PMU voltage angle and an extended work has been presented in this paper with an island detection algorithm to solve the island scenarios. This study set aimed to identify the island thresholds for the real islanding conditions of under and over frequency with different scenarios in a distribution system. However, figuring out a threshold for both islanding situations is the main challenge of this study as the voltage excursions are not the same in all scenarios. The frequency threshold of the system is very significant. However, during the islanding event, if the frequency lost its synchronization, then the generator would be turned off and unable to support the connected feeder load. Due to this specific reason, this research emphasizes not losing the synchronization during the islanding event. In this study, the under frequency and over frequency thresholds are set to 46.5~48 Hz and 51~52.5 Hz, respectively, according to the IEEE standard. Table 1 presents the overall view including objectives, contributions, and limitations of current island detection techniques.
To address the research gaps in the aforesaid papers, this paper offers the following contributions:
  • A distribution and utility bus voltage angle difference-based island threshold technique has been proposed;
  • The proposed technique has been evaluated under two different islanding conditions and those are under frequency and over frequency;
  • To assess the performance under different islanding scenarios there are four different islanding scenarios for the under frequency and over frequency islanding conditions;
  • All the islanding scenarios have been taken from the real-time problem of a distribution system named Utility Kerteh which is located in the Terengganu state in Malaysia.
  • The proposed technique is able to detect island thresholds within 40 ms to 80 ms depending on the scenarios which state that it can contribute to increasing the distribution system reliability or security in terms of detection time.
The rest of the paper is organized as follows. Section 2 elaborates on the methodology and test system. Section 3 presents the results and discussion, and Section 4 describes the conclusion of the paper.

2. Methodology and Test System

2.1. Proposed Methodology

Setting the threshold precisely to identify islands and distinguish transient faults is a significant aspect of quickly detecting island occurrences. In most cases, if the threshold is not set correctly, the system is unable to identify islanding occurrences or may take longer. The proposed island threshold-setting approach for the unintentional islanding event is depicted in Figure 1.
The proposed technique (Figure 1) consists of five units: the bus, the load threshold determination, the inception of the island, the value of the island threshold computation, and figuring out the threshold value for each scenario. The following are the details of Figure 1:
(a)
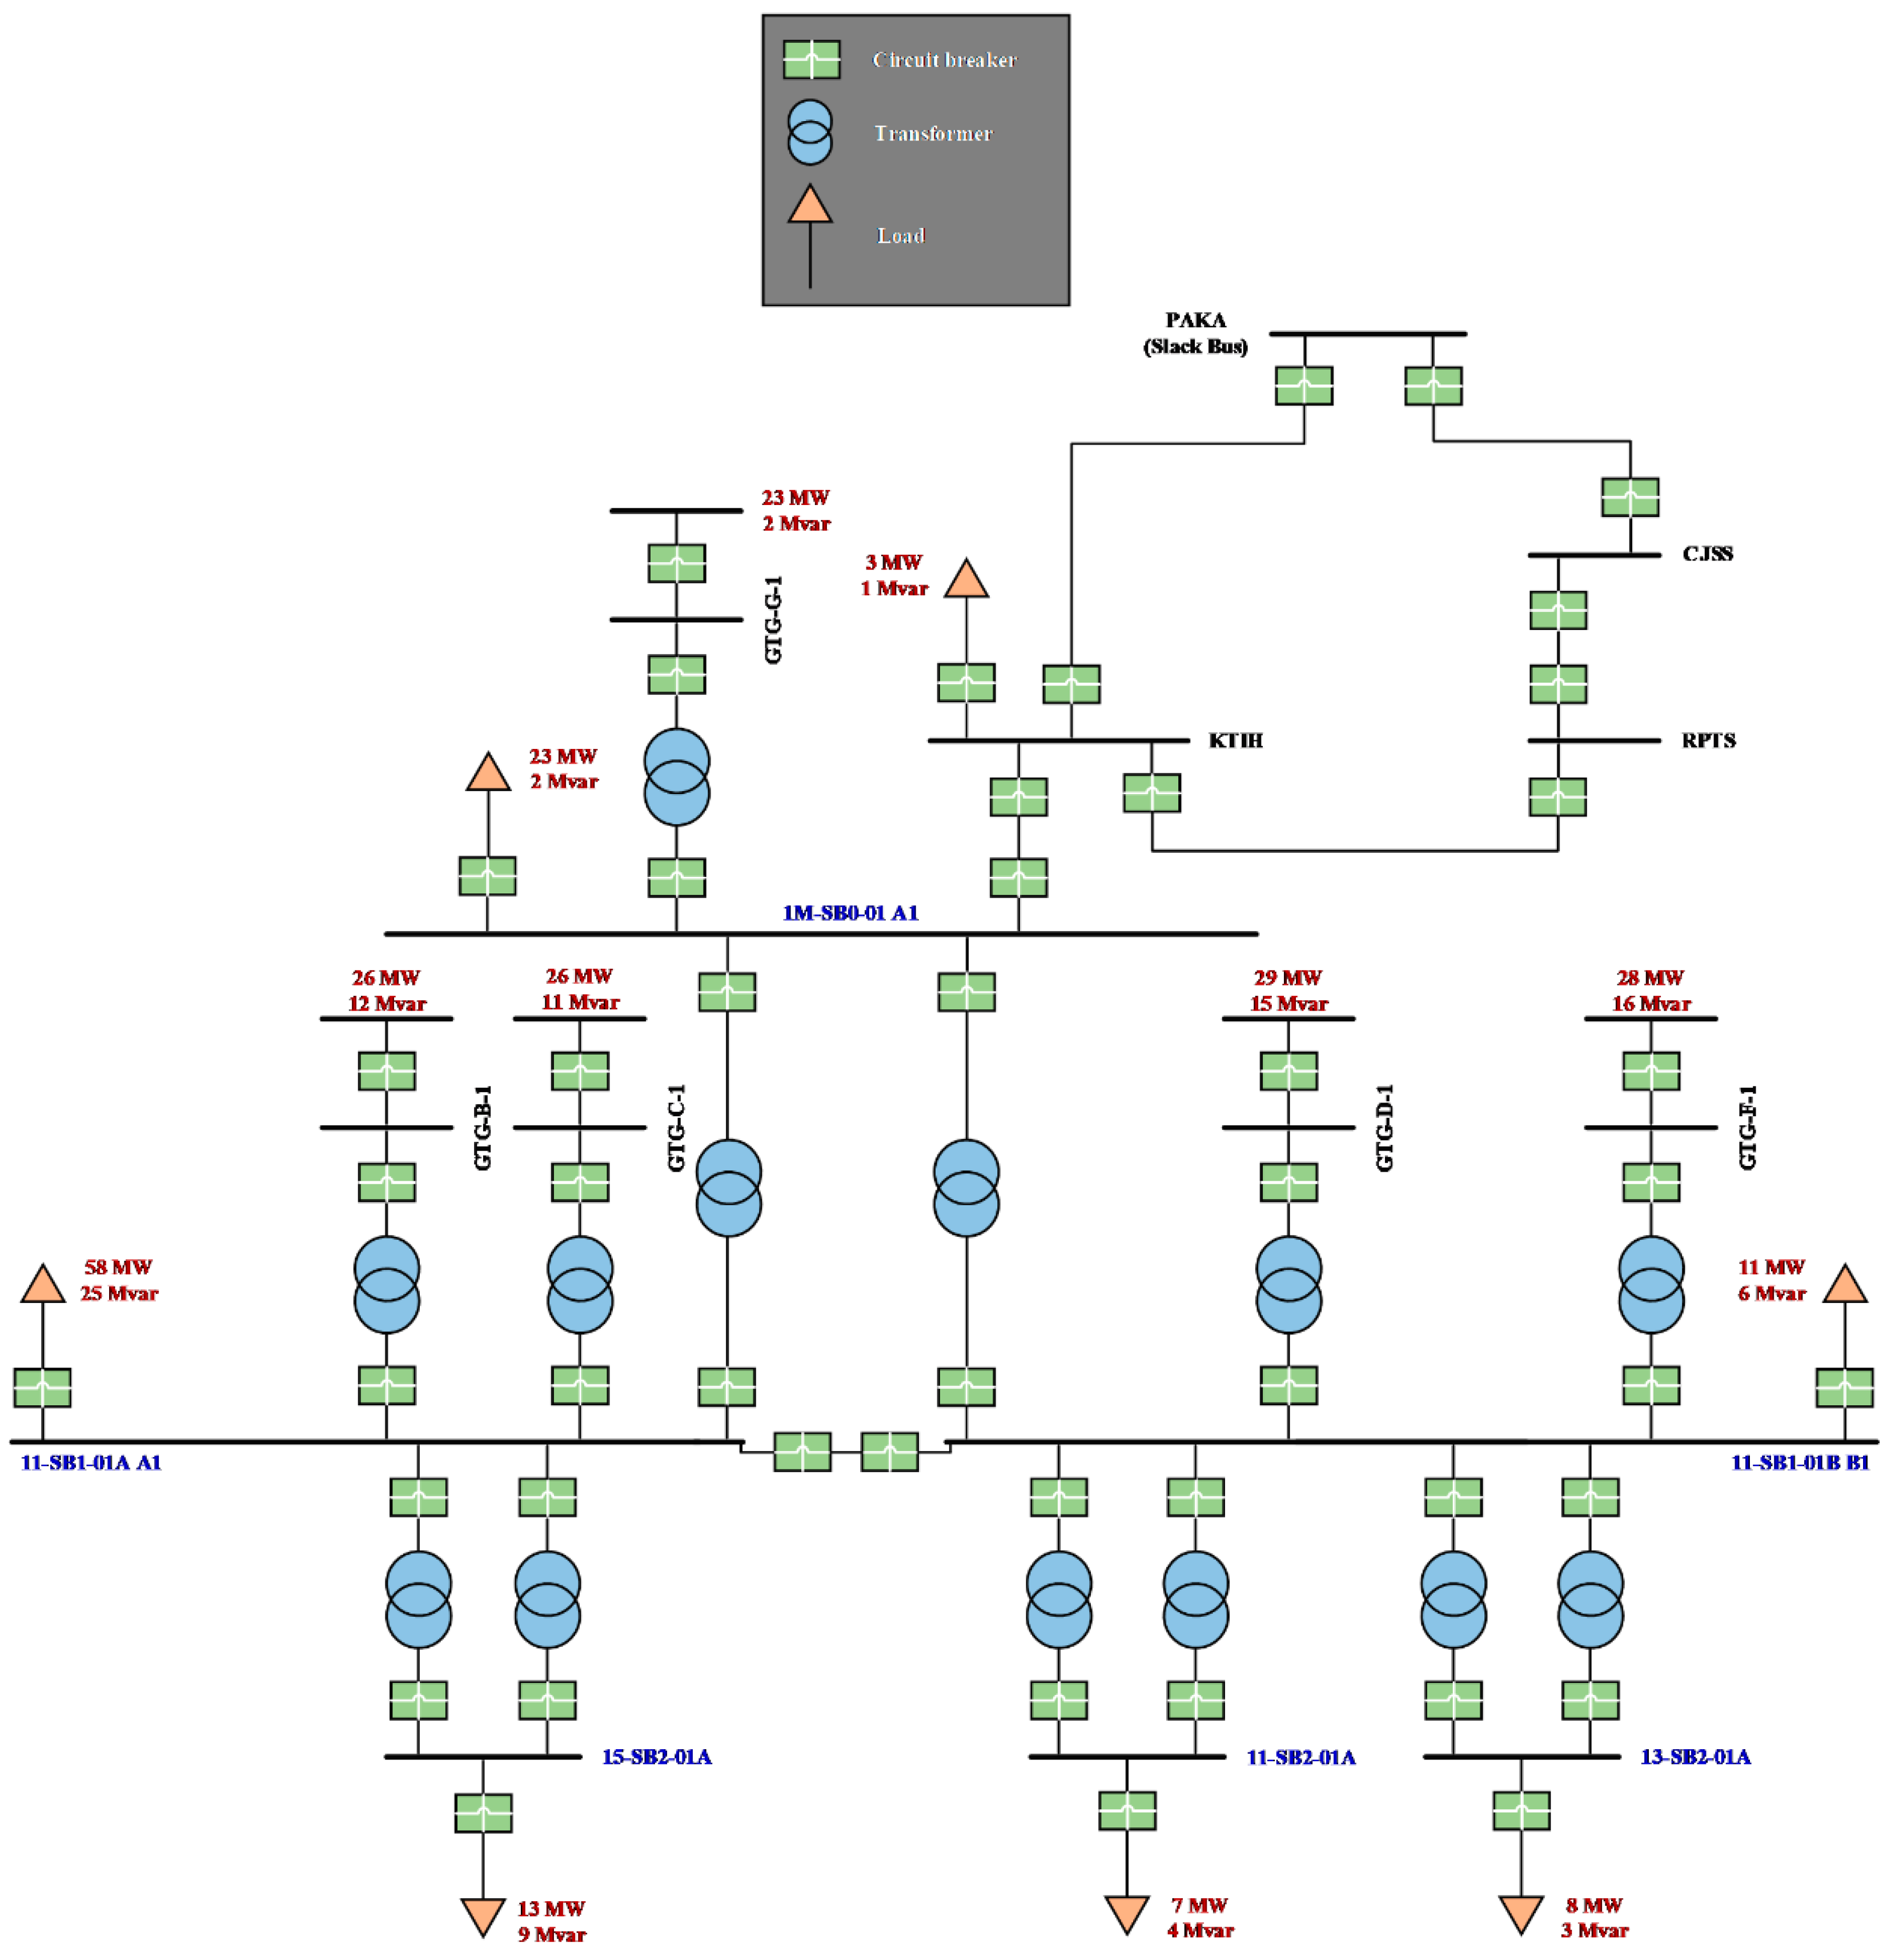
It is necessary to understand those buses we may utilize in calculations during establishing the threshold of the under frequency and over frequency island conditions. Two buses are shown in Figure 1, one of which is a utility bus and the other is a DG bus. In this study, we employed the Utility Kerteh system, which has five DG buses. In this study, Bus GTG-G-1 (11 KV) was considered a DG bus;
(b)
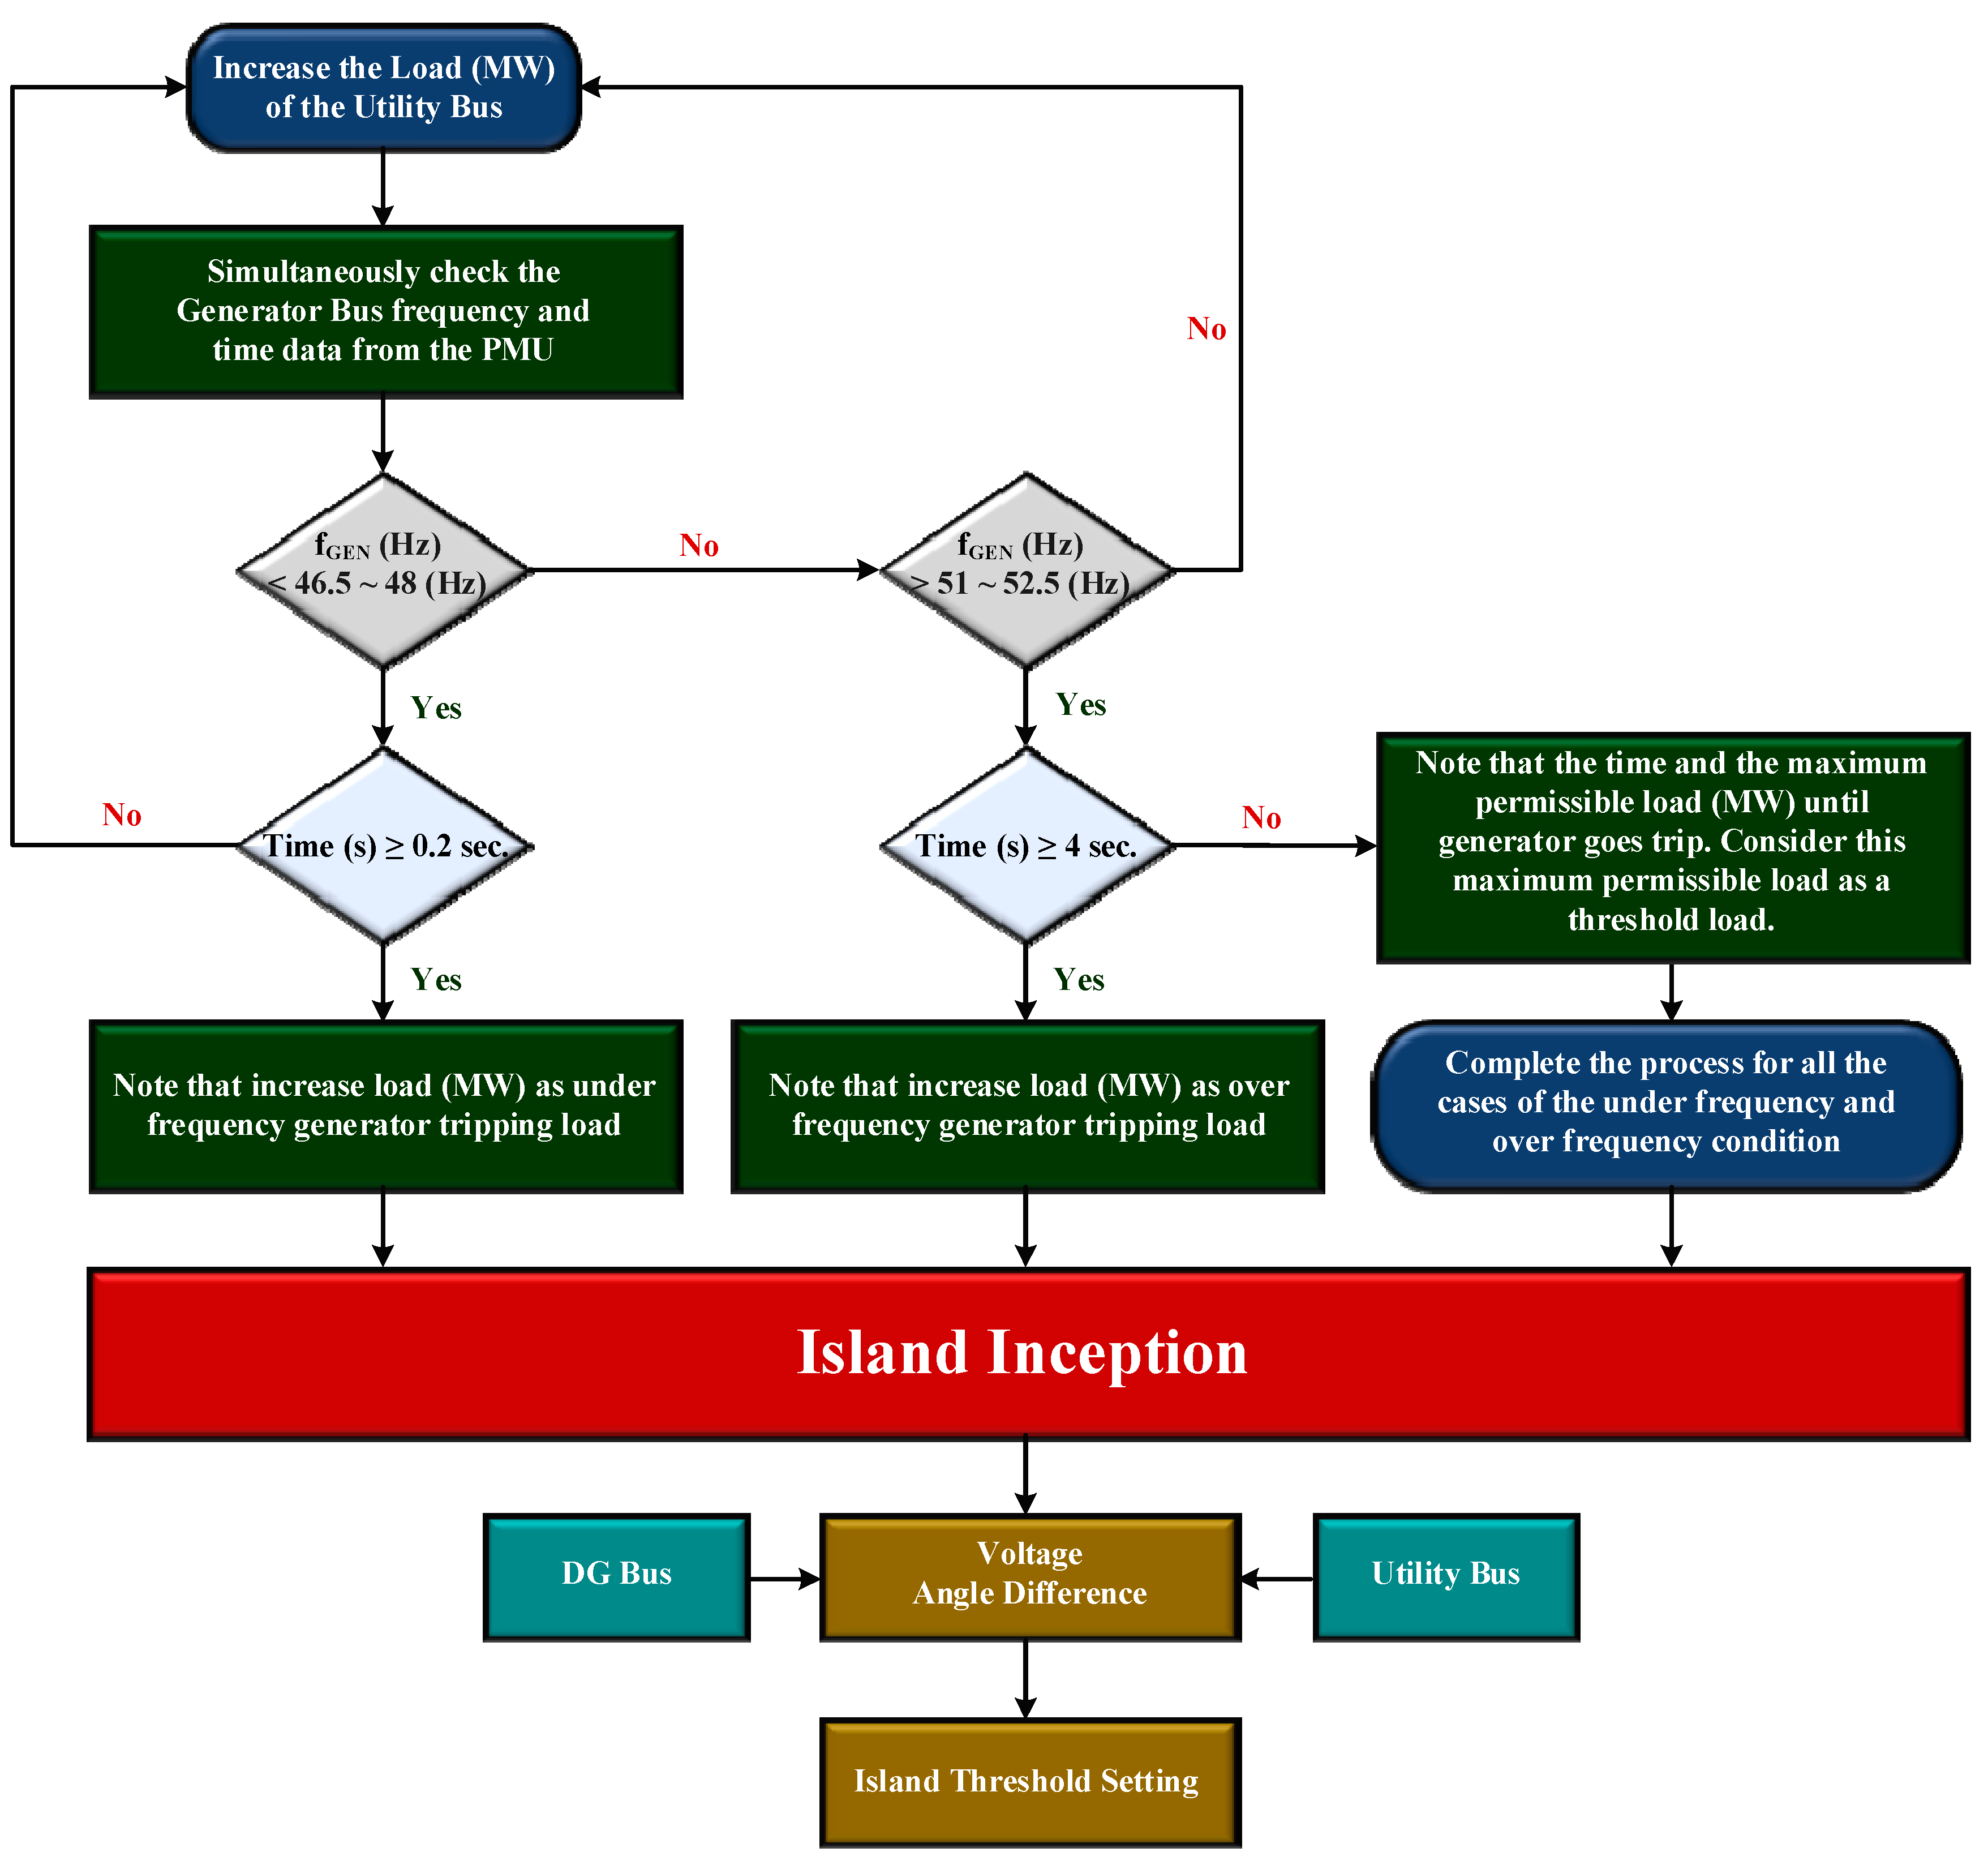
Different load levels lead to various network configurations and the load needs to be raised until the generator is unable to synchronize anymore, as shown in Figure 1. However, the over frequency tripping time of the generator is 4 s when the frequency is greater than 51~52.5 Hz, while the condition of under frequency permits the generator to trip 0.2 s at a frequency below 46.5~48 Hz [24]. From there, only an acceptable load may be established for under and over frequency situations.
(c)
Islanding happens when loads and generators are cut off outside of the utility system but still have power [4]. Voltage and frequency variations lead to declining power quality and synchronization difficulties on the electric grid.
(d)
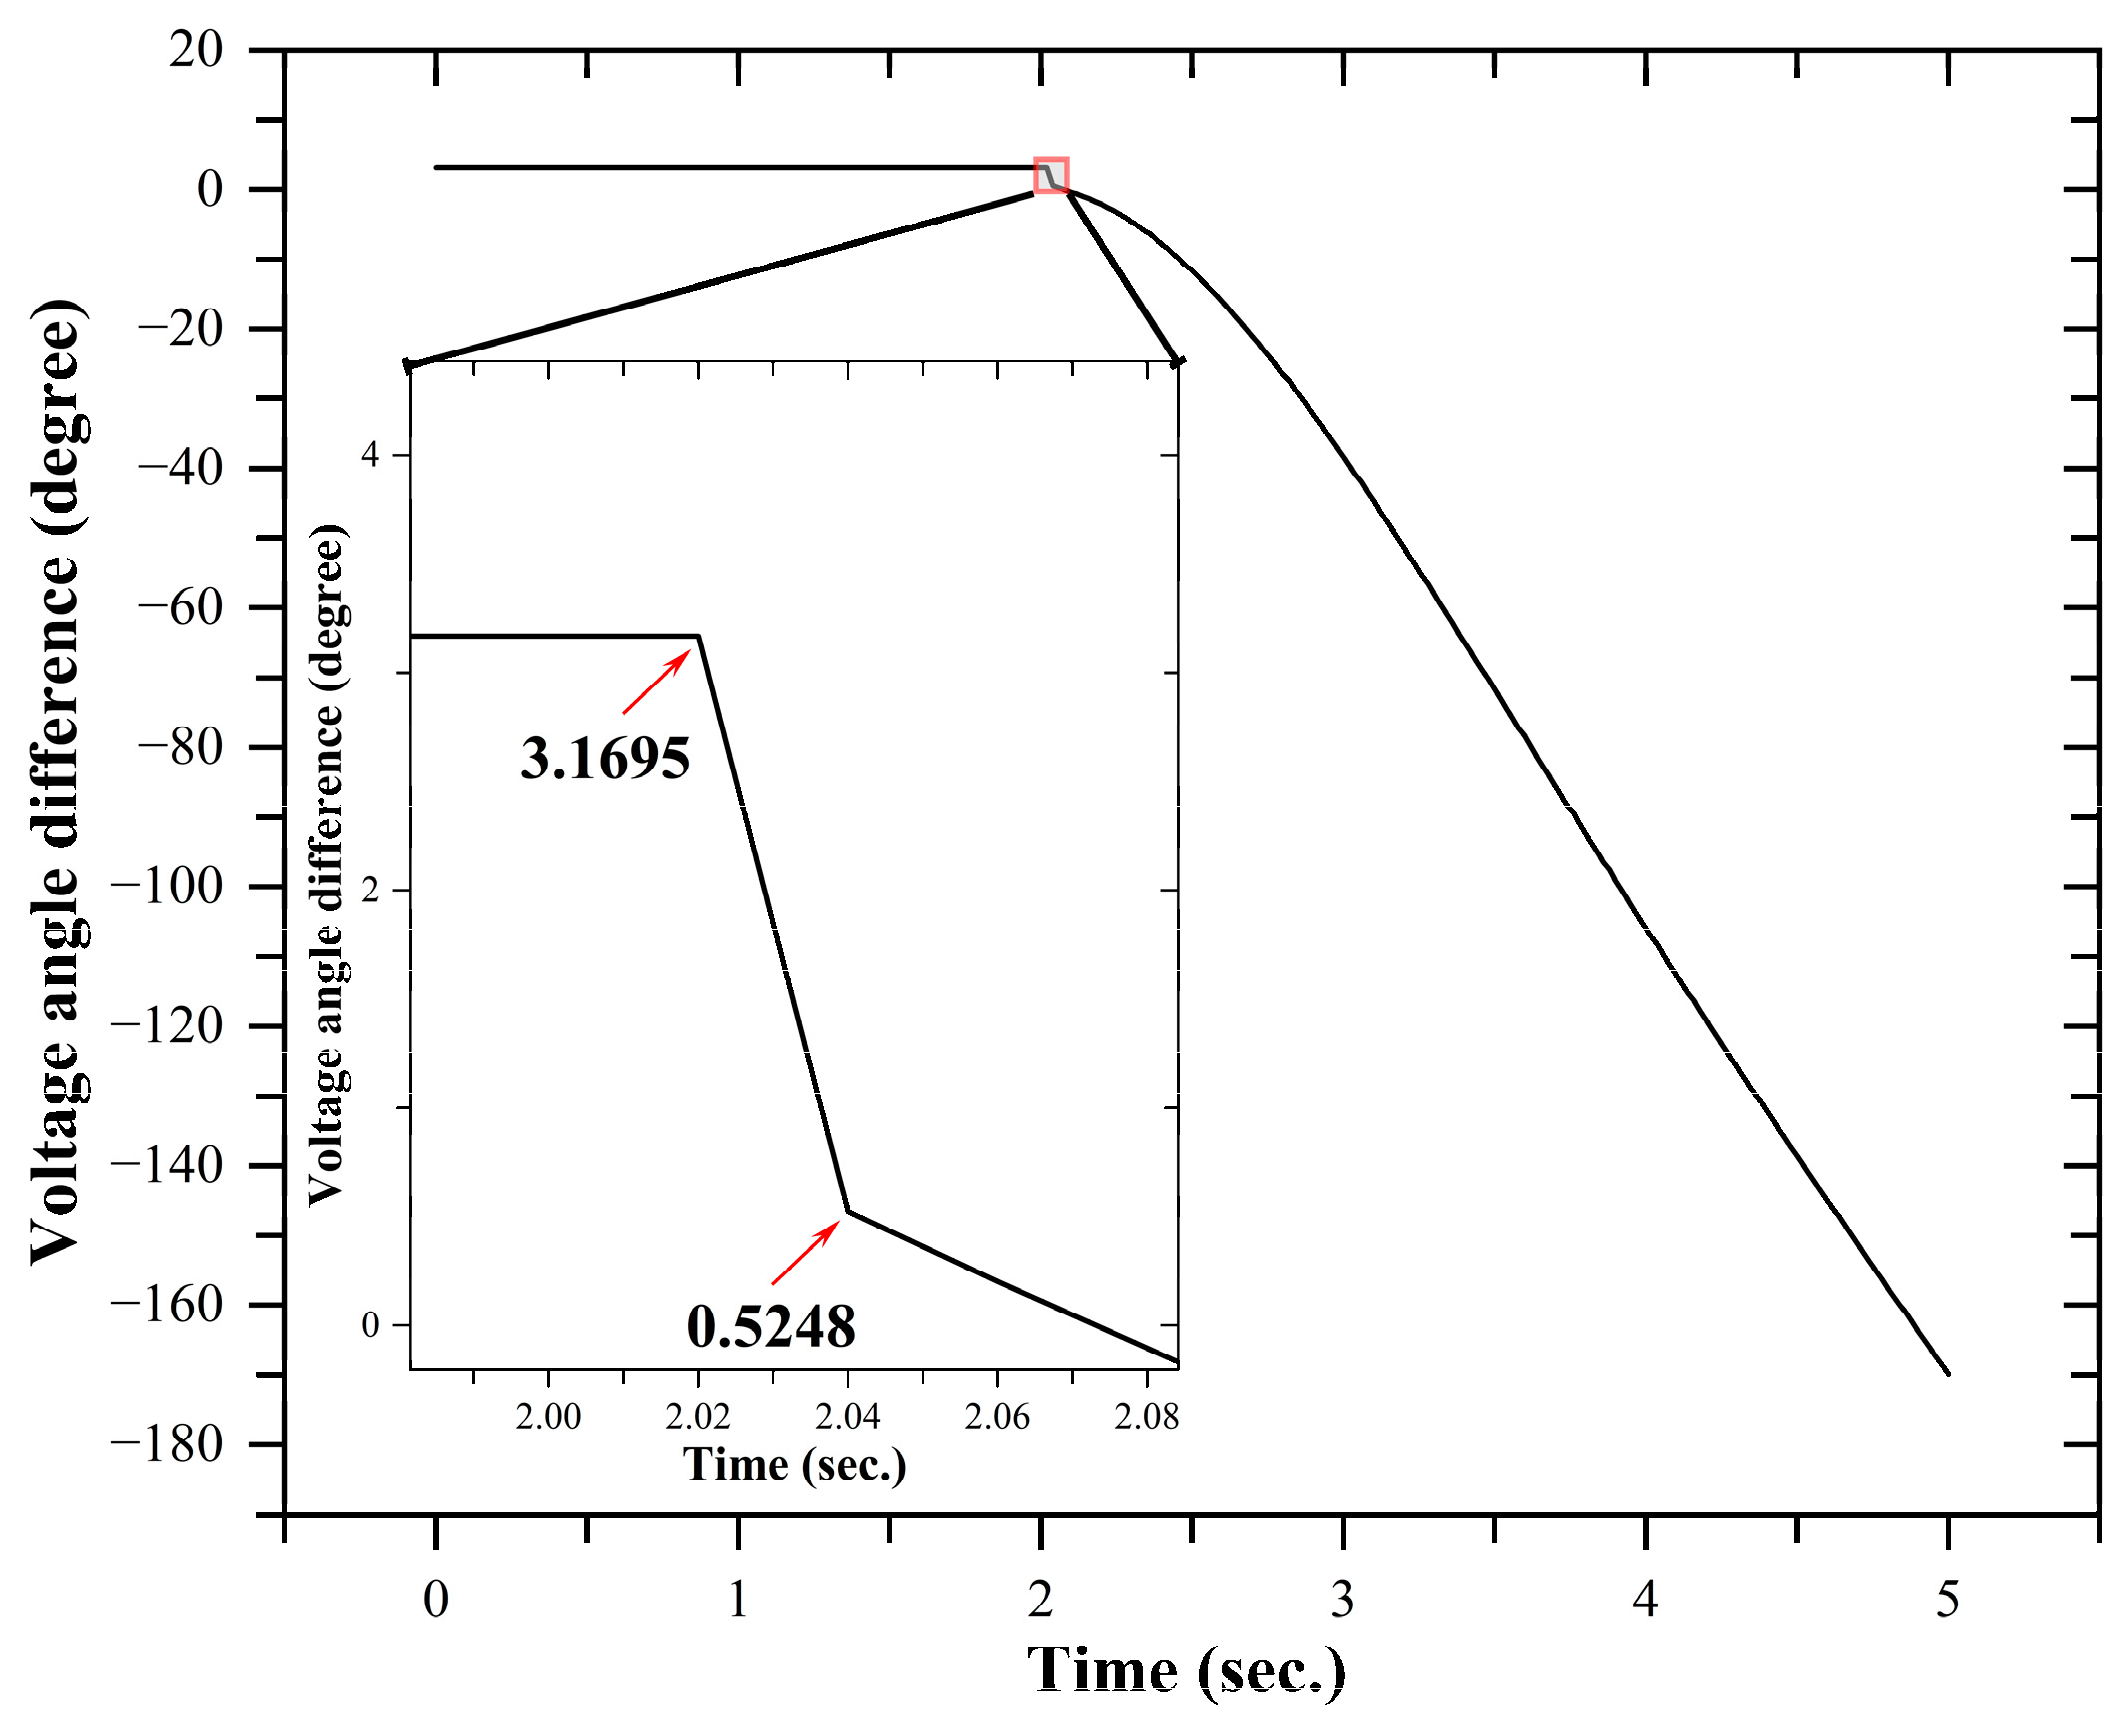
Voltage angle difference should be calculated from the DG bus and utility bus voltage angle.
(e)
A threshold value for every scenario of the island that will be able to operate in both island conditions may be defined once all of the PMU voltage angle differences have been determined from step (d).

2.2. Voltage Angle Formulation of the DG and Utility Bus
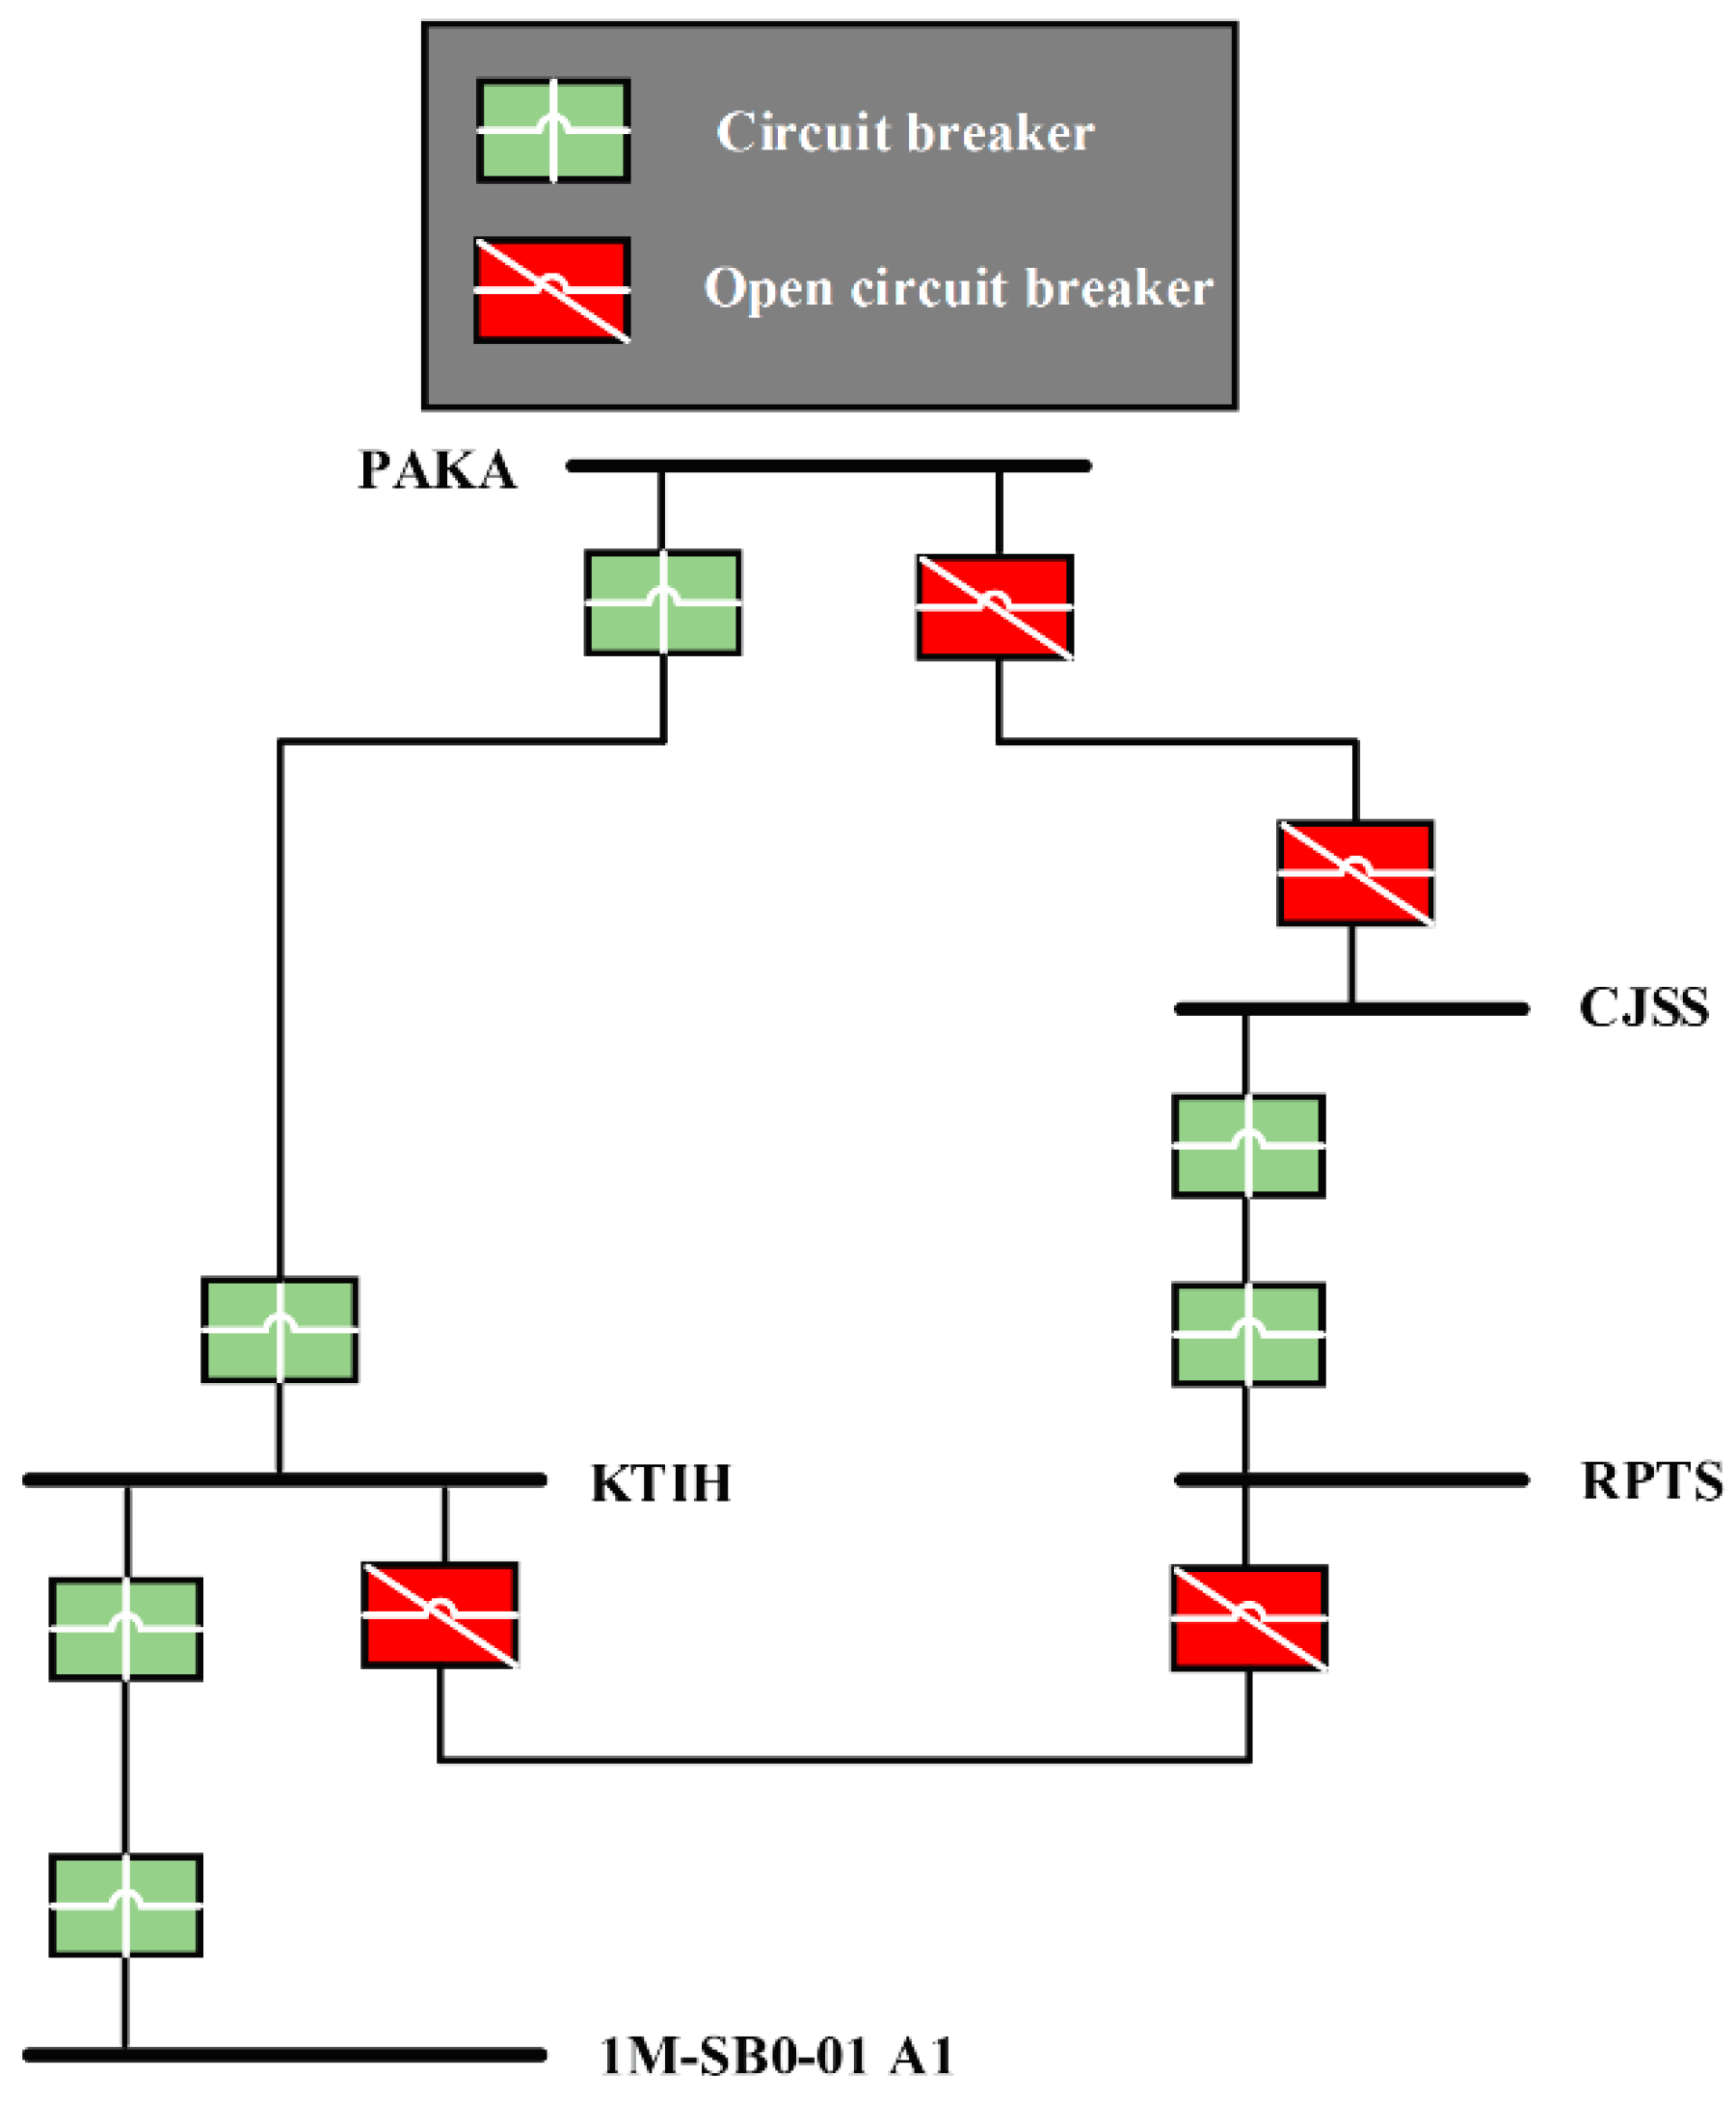
This sub-section will present the mathematical formulation of the proposed unintentional island threshold technique. Equation (1) presents the transformation matrix which is used to perform the Fortescue transform based on the PMU voltage angle “M”. The Fortescue matrix equation is provided for every M-voltage sequence component.
[ X 0 X 1 X 2 X ( M 1 ) ] = 1 M [ 1 1 1 1 1 p M p M 2 p M ( M 1 ) 1 p M 2 p M 4 p M 2 ( M 1 ) 1 p M ( M 1 ) p M 2 ( M 2 ) p M ( M 1 ) ( M 1 ) ] [ X a X b X c X M ]
X r y b = X r y b + + X r y b
X r y b = ω X r + 0
[ X r y b + X r y b X r y b ] = [ 1 1 1 p 2 p 1 p p 2 1 ] [ X r y b + X r y b X r y b ]
X r y b = ω 1 X r y b
[ X r y b + X r y b X r y b ] = 1 3   [ 1 1 1 p p 2 1 p 2 p 1 ]   [ X r y b + p X r y b p 2 X r y b ]
Xryb stands for the normal operating system voltage matrix of size 3 × 1 for the two voltage angles, Xryb+ represents the DG voltage angle matrix of size 3 × 1, and Xryb represents the utility voltage angle matrix of size 3 × 1. The above-mentioned system produces the same magnitude for the DG voltage angle component as well as the utility voltage angle component for all phases but has a phase difference of 120 degrees, whereas ‘r’ in the matrix and expanded form is achieved as provided by Equations (4)–(6).
x U F = p 2 x r y b + = p x U F
x O F = p x r y b = p x O F
x S M = x r y b
The inverse FTT matrix is denoted by   ω 1 . Similarly, the system bus voltage angle component for both islanding conditions (under and over frequency) is analyzed as shown in Equations (7)–(9), where xUF represents the under frequency bus voltage angle for phase voltage y, xOV represents the over frequency islanding condition for phase voltage y, and xSM represents the normal condition system frequency.
[ X U F X O F X S M ] = 1 3   [ 1 1 1 p p 2 1 p 2 p 1 ]   [ X r y b + p X r y b p 2 X r y b ] = [ X r y b + 0 0 ]
X r φ = 1 3   ( p X r y b + φ y + p 2 X r y b φ b + X r y b φ r )
According to Equations (10) and (11), both the under frequency and over frequency components will be kept under typical system conditions and will be equal to the phase voltage angle (11).
φ =   [ 1 3   ( p X r y b + φ y + p 2 X r y b φ b p 2 X r y b φ y   ) ]
The suggested approach employs the phase angle of the DG and utility at the spot of the connection, as shown in Equation (12)
x r y b + I I A Κ ( I I A Ι Ι ) Κ = 0
x r y b + I I Κ ( I I A Ι Ι ) Κ = 0
Ι Ι A = x A   ( Κ + Κ ) ( Κ + Κ )   ( Κ + Κ ) ( Κ ) 2 x   Κ ( Κ + Κ )   ( Κ + Κ ) ( Κ ) 2
Ι Ι A = x A   ( Κ + Κ ) Κ x   Κ Κ
The distribution grid is linked to the DG during normal operation by turning on the switch S. The analogous circuit voltage equation is given as Equations (13) and (14), where ΚP = ΚA + ΚAB and Κ   =   Κ C   +   Κ B C . Currents Ι Ι A and   Ι Ι in the loop are computed as per Equations (15) and (14) by solving Equations (13) and (14) and, respectively, Equation (16).
Ι Ι = Ι Ι A   ( Κ + Κ ) x A Κ
x D G = ( Κ A Β + Κ   | |   Κ )   Ι Ι A
x u t i l i t y = ( Κ + Κ Κ ) x A ( Κ Κ ) x
As a result, the current IIC flowing via the utility bus is denoted by Equation (17), where Κ A Β = (KP + KL)(KQ + KL)(KL)2. KVL is used to calculate the DG bus voltage A, which is expressed as in (18). When the value of Ι Ι A in Equation (18) is substituted, x D G is written as in Equation (19).
x D G I I A Κ ( I I A Ι Ι ) Κ = 0
Ι Β ( Κ + Κ ) + Ι Ε Κ + Ι Κ = 0
Ι H   Κ + x + Ι Β   Κ = 0
Ι A = [ ( Κ + Κ ) g + Κ   Κ Κ ]   x A + [ Κ   Κ Κ ]
x u t i l i t y = ( Κ + Κ | | ( Κ Β + ( Κ   | | Κ ) ) )   Ι A
x D G = [ ( Κ + Κ )   Κ + Κ   Κ Κ ]   x D G + [ Κ   Κ Κ ]   x D G
The voltage equations for a Line-Ground, Line-Line, Line-Line-Ground, Line-Line-Line fault at point F with impedance Κ may be stated as in Equations (20)–(22), where   Ι Ι A = Ι Ι A + Ι Ι A F + Κ and Κ = Κ + Κ Β . In this example, Ι A is written as in Equation (23) and x A is written as in Equation (24), where Κ = Κ ( Κ + Κ ) + Κ ( Κ )2 − ( Κ )2 ( Κ + g). The DG bus voltage may be calculated by substituting the value of   Ι A from Equation (23) into Equations (24) and (25).

2.3. Test System

Figure 2 is the single-line diagram (SLD) of the test system. Table 2 presents the setting of the test system parameters. Figure 3, Figure 4, Figure 5 and Figure 6 show the actual islanding scenarios of the assessment system.
In this research, the actual Utility Kerteh system island formation can occur in two scenarios and those are:
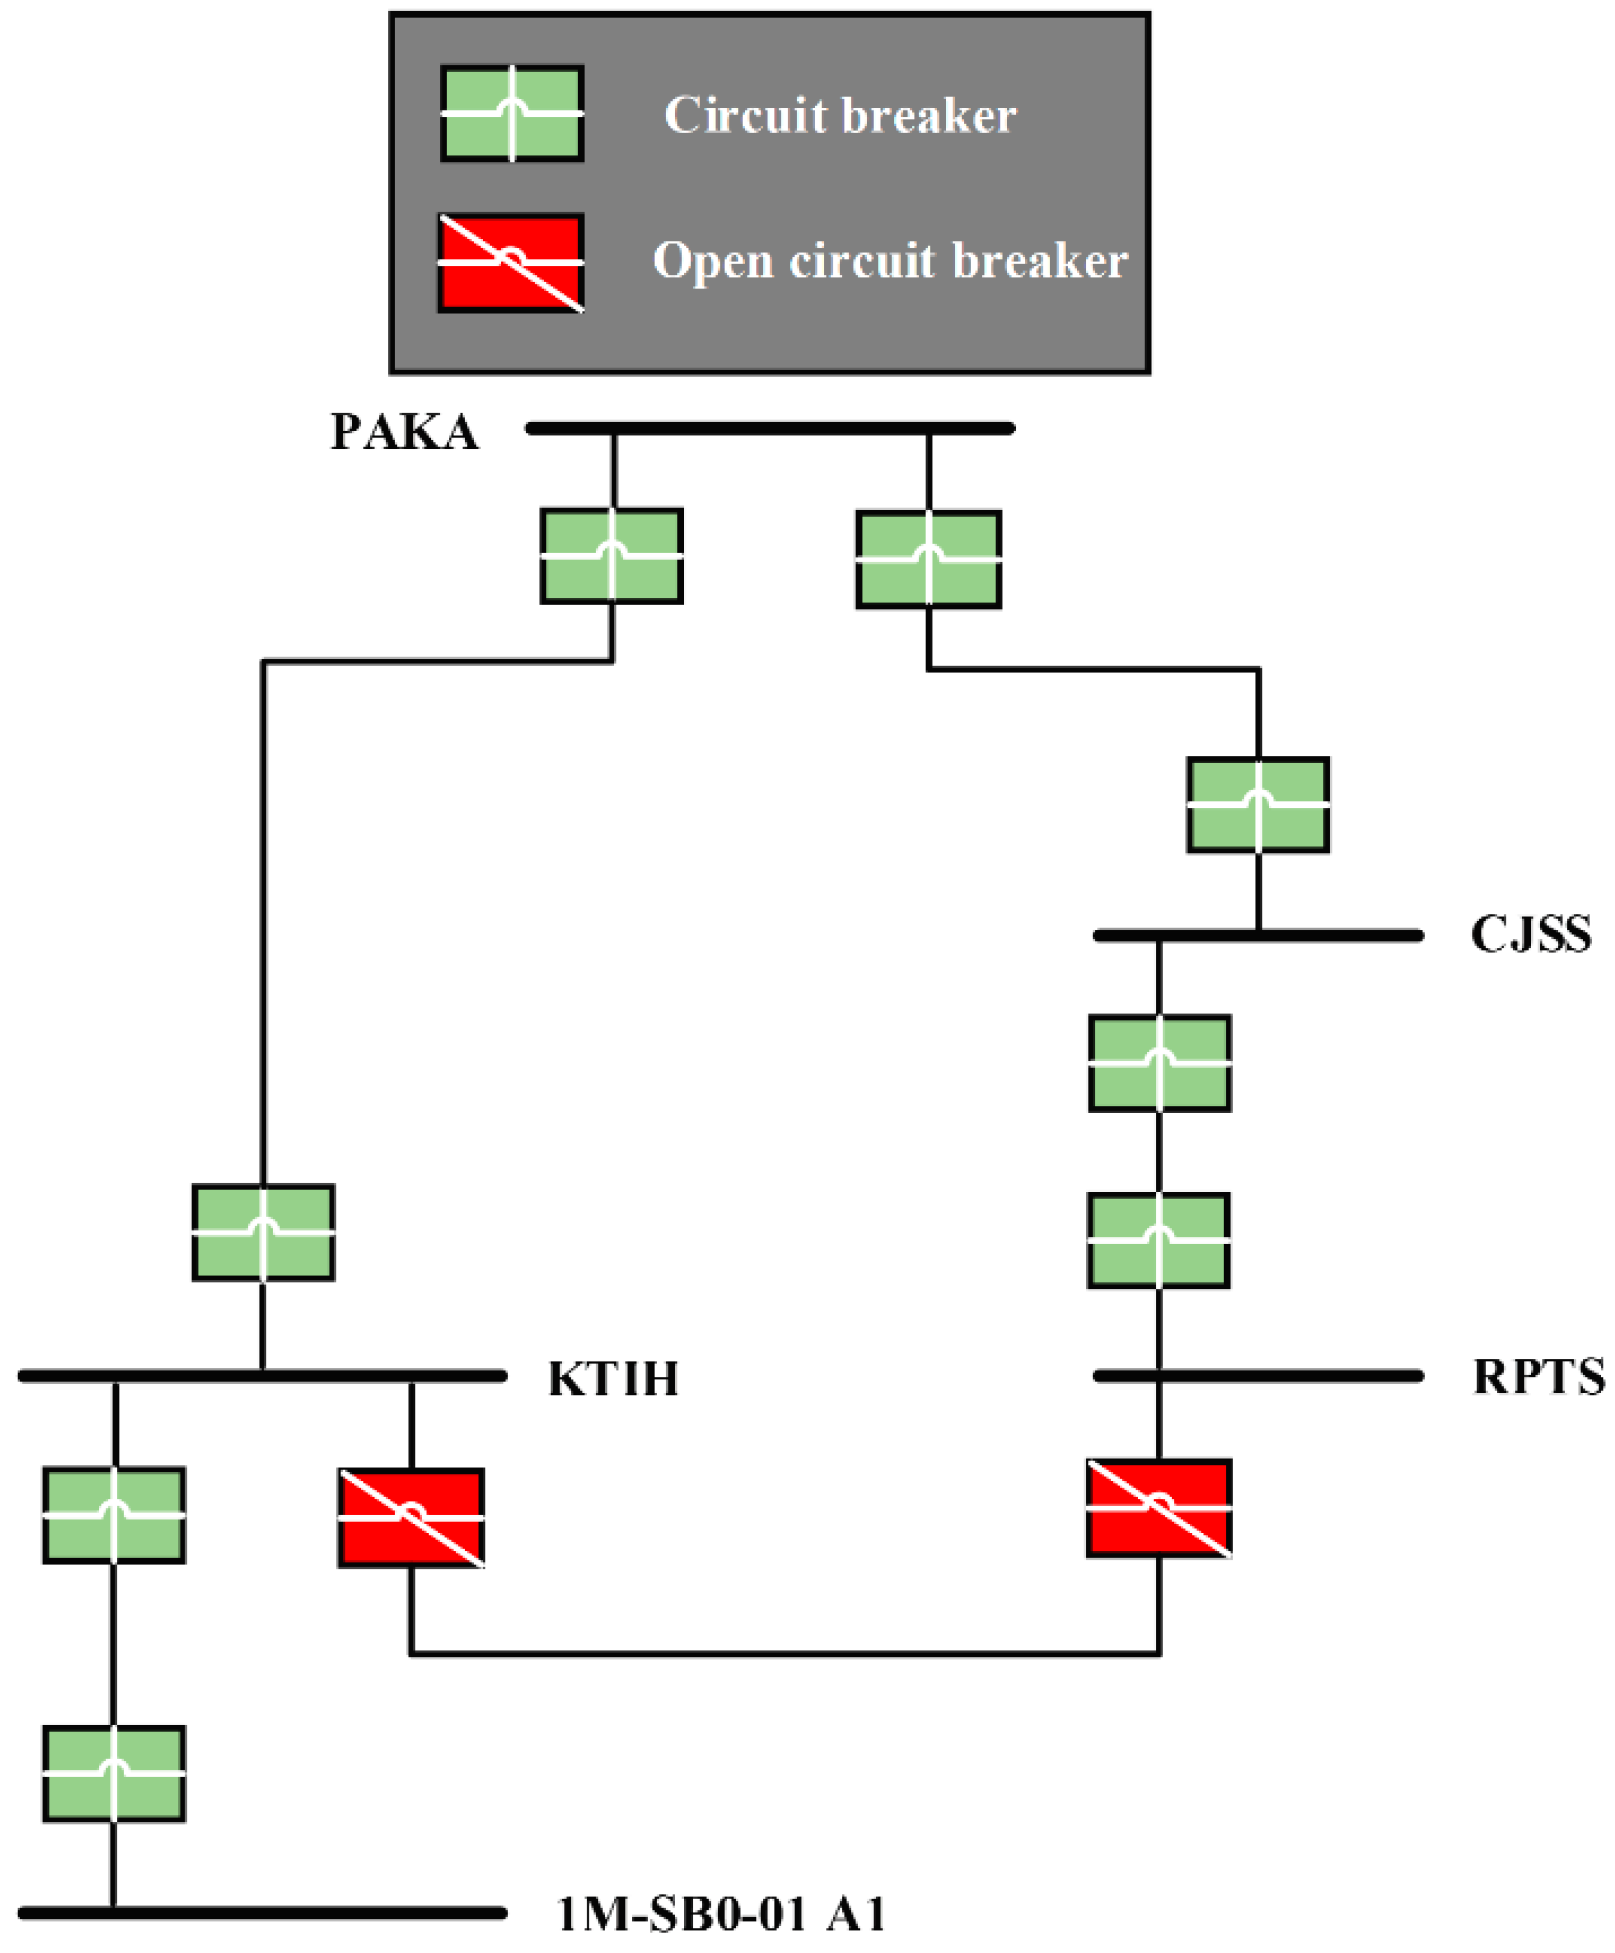
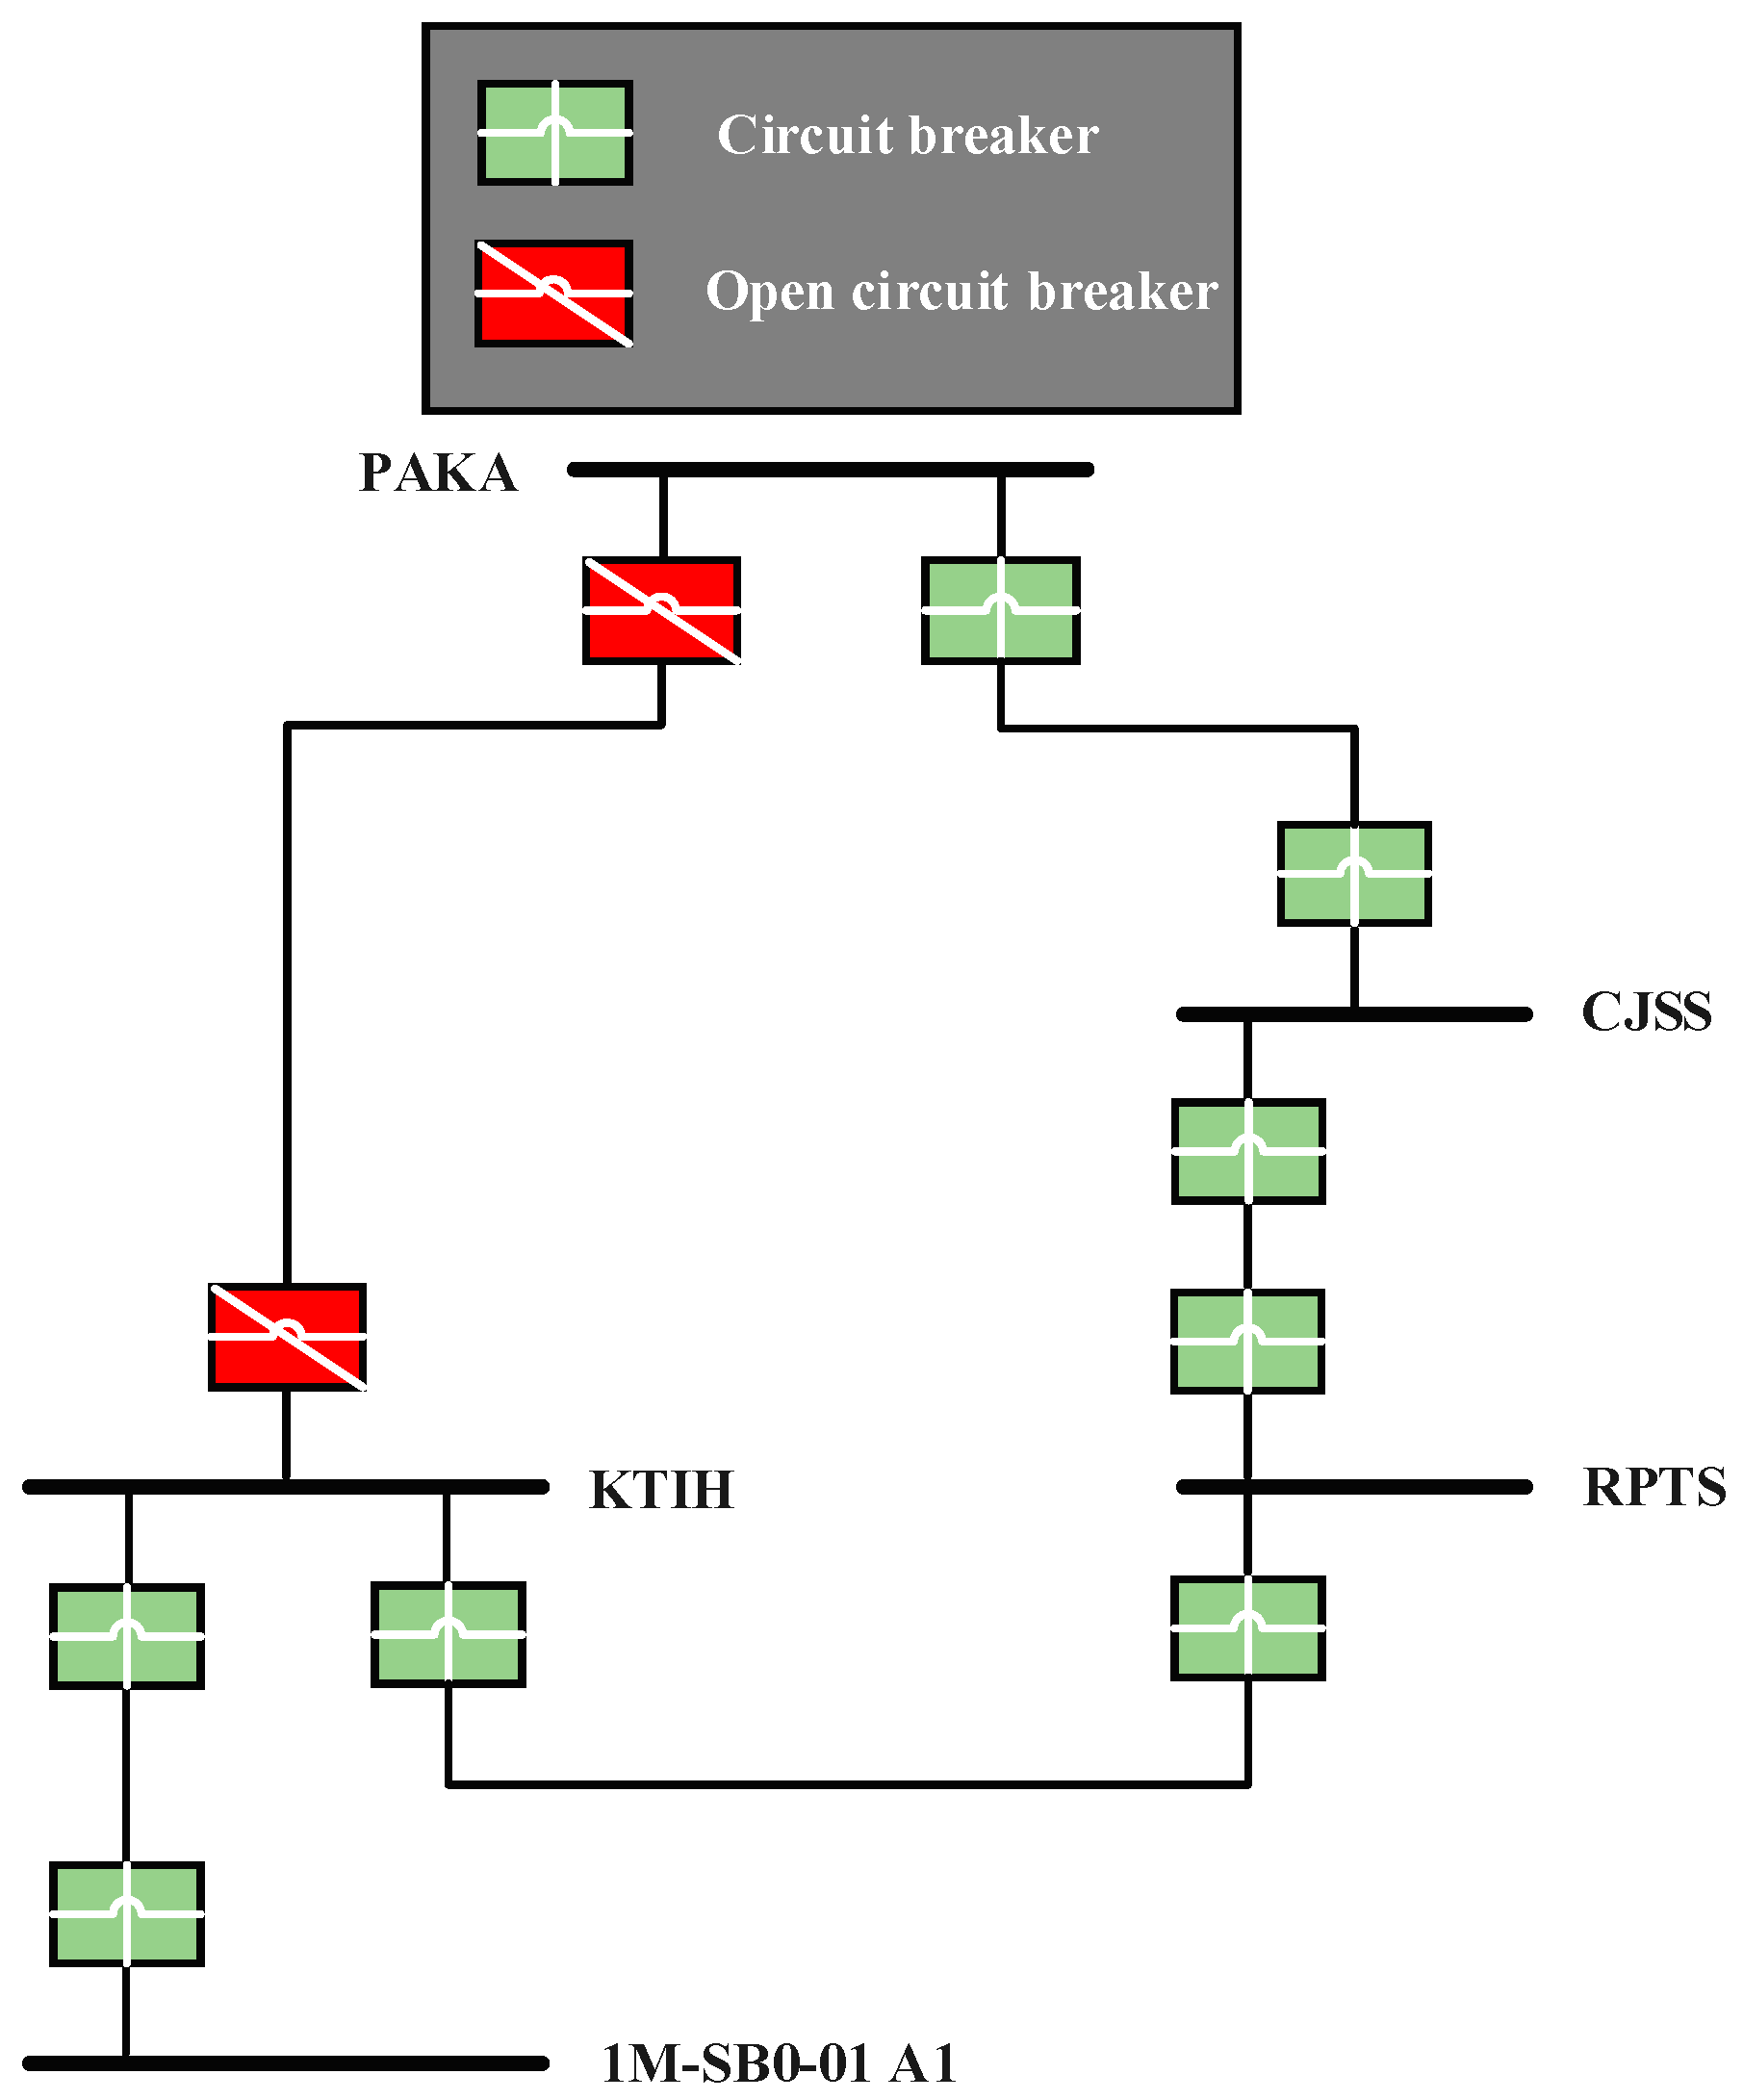
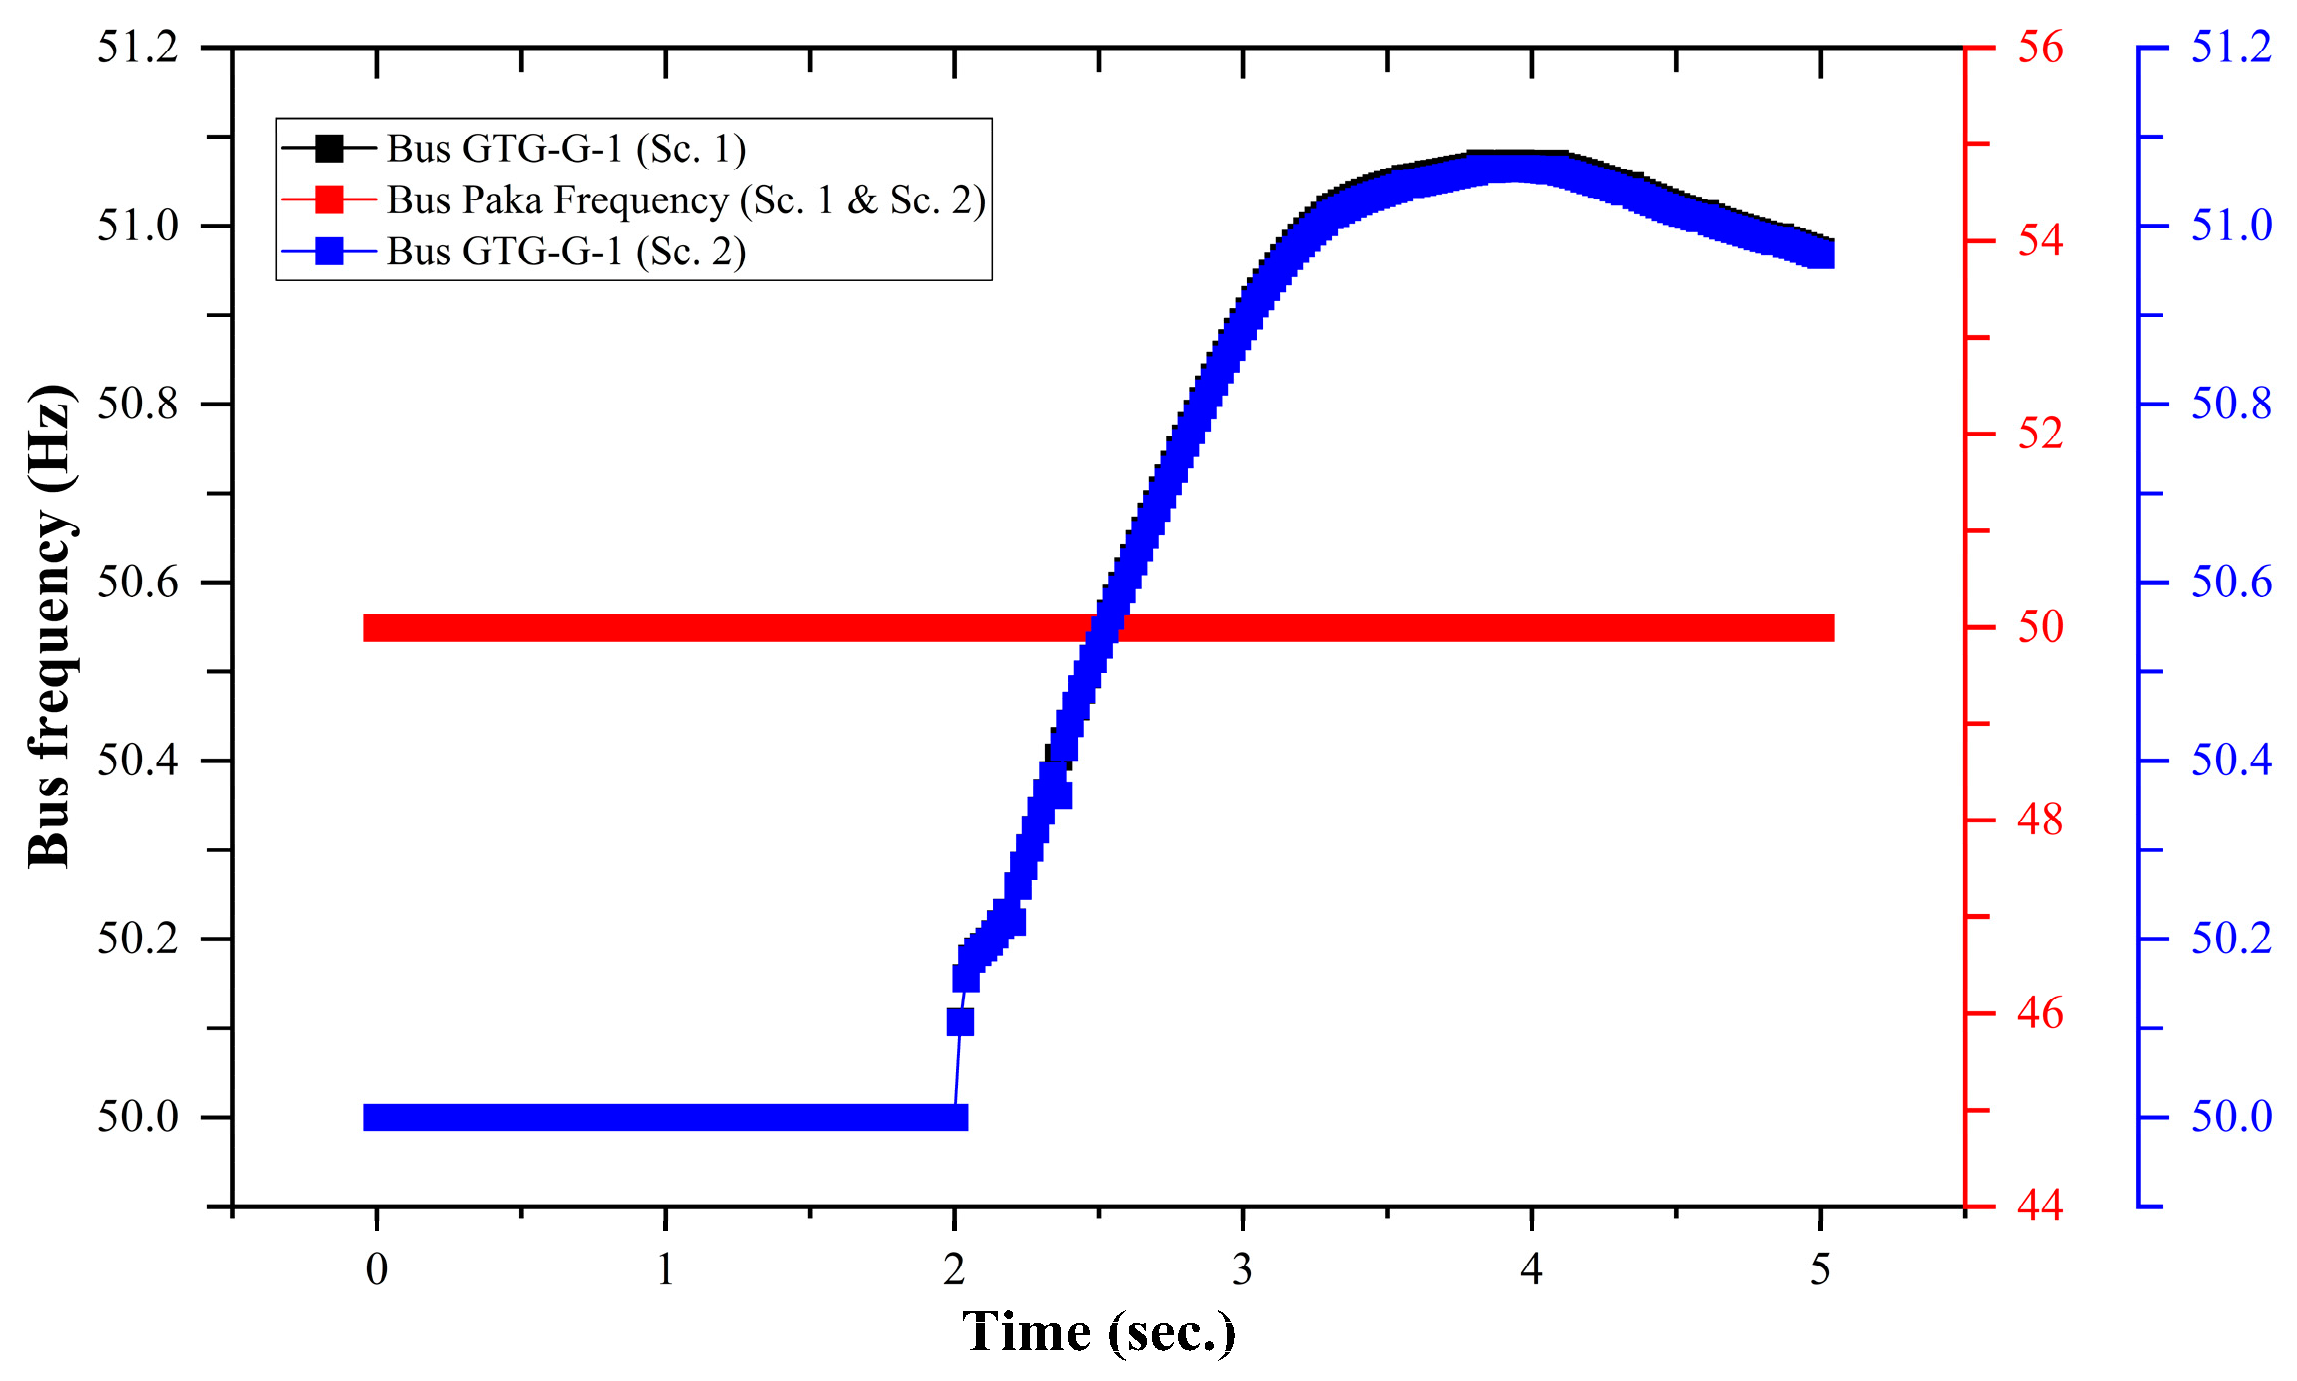
  • Scenario 1 (Sc. 1): the transmission line between PAKA and KTIH is open while the RPTS to KTIH line is on outage (Figure 3).
  • Scenario 2 (Sc. 2): the transmission line between RPTS and KTIH is open while the PAKA to KTIH transmission line is on outage (Figure 4).
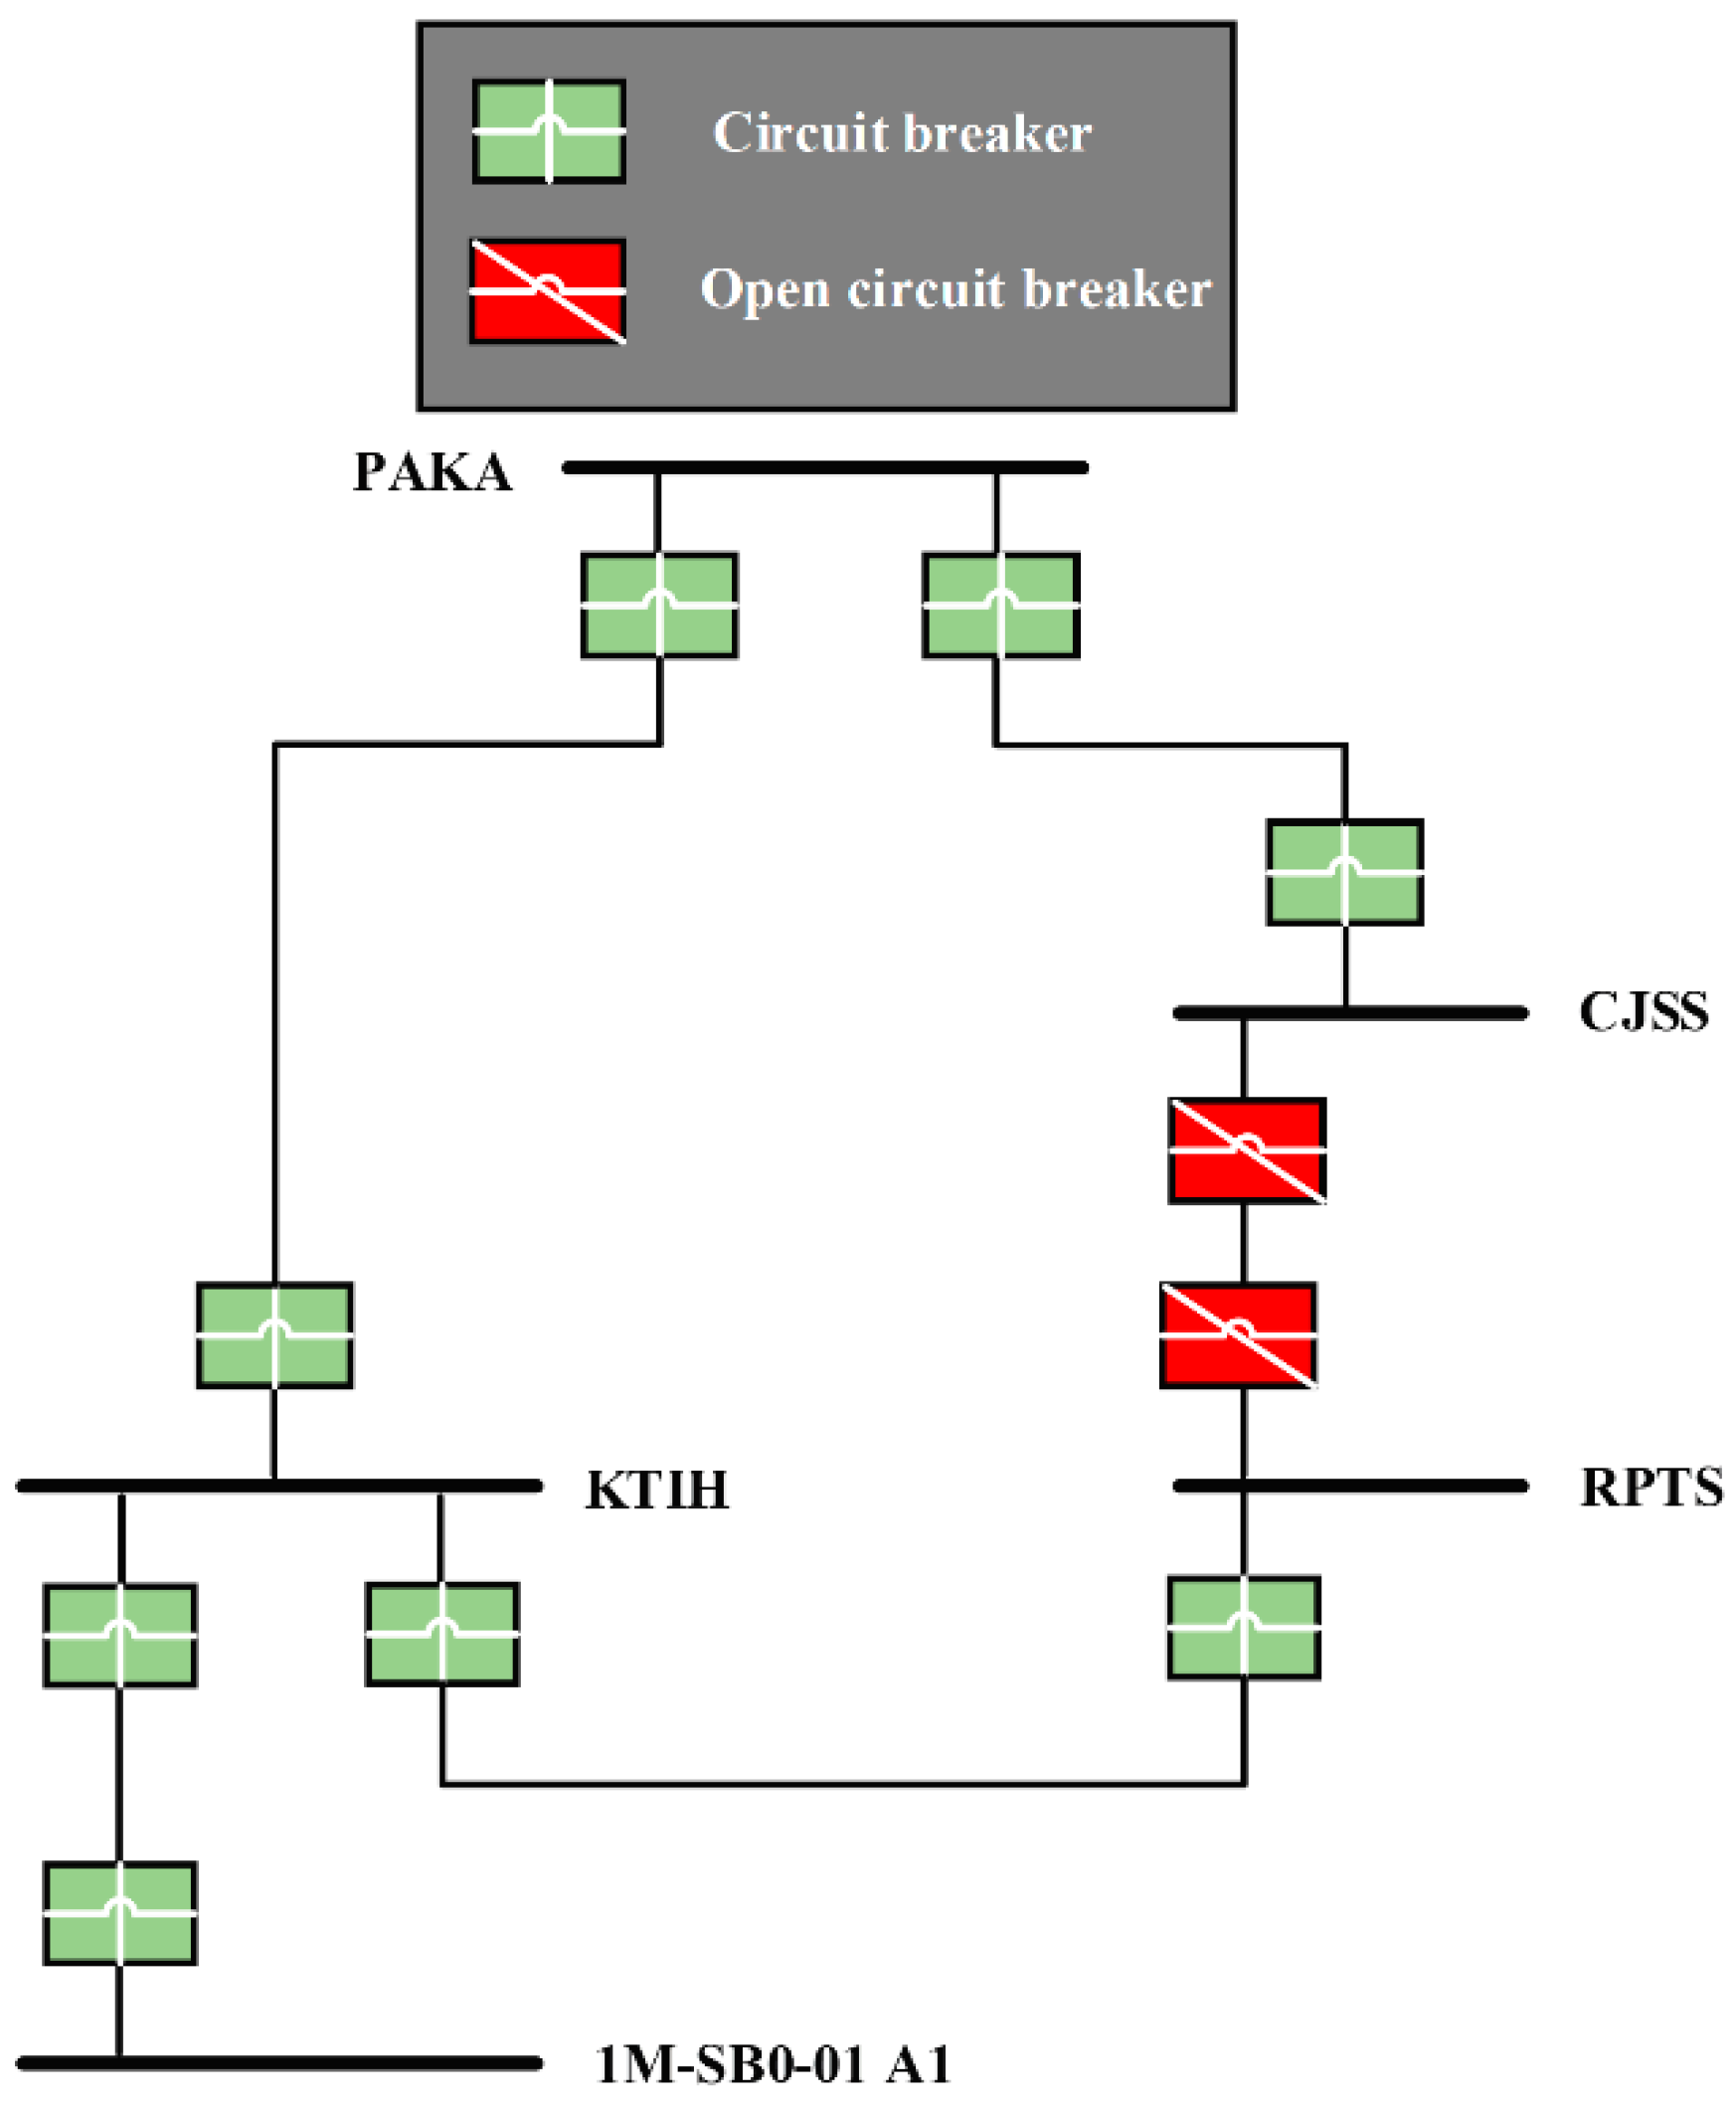
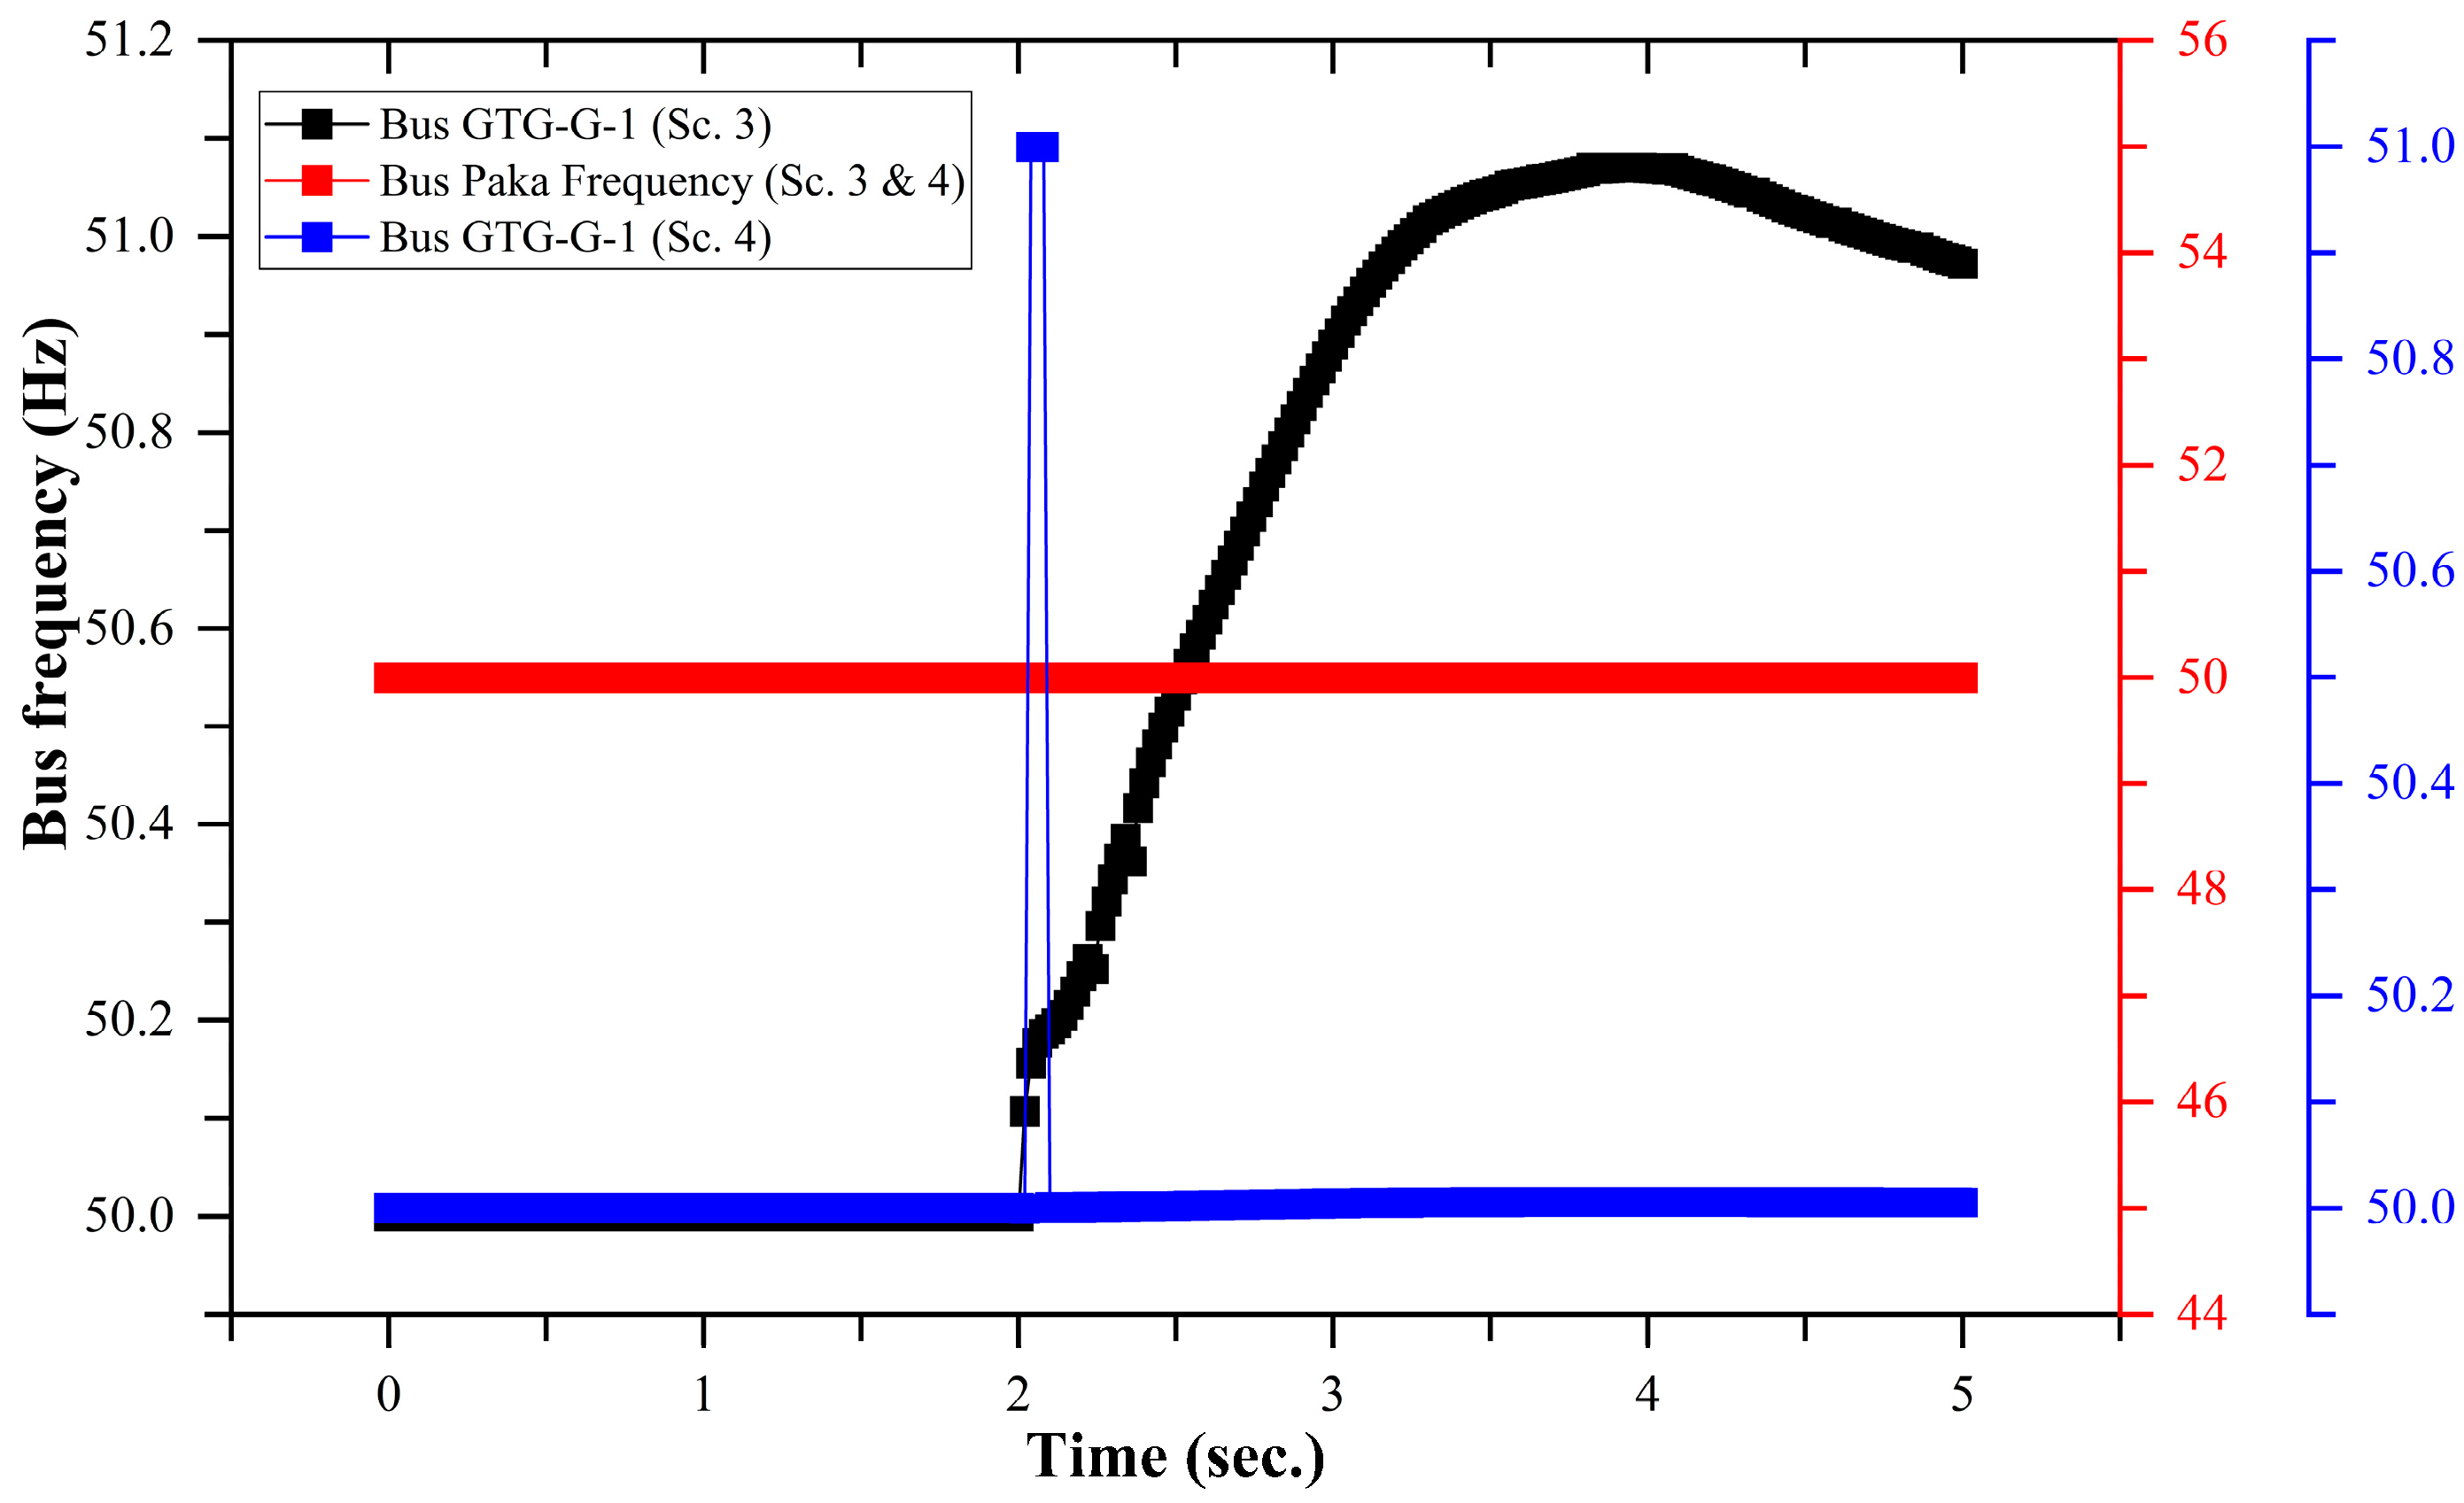
  • Scenario 3 (Sc. 3): the transmission line between CJSS and RPTH is open while the PAKA to KTIH transmission line is on outage (Figure 5).
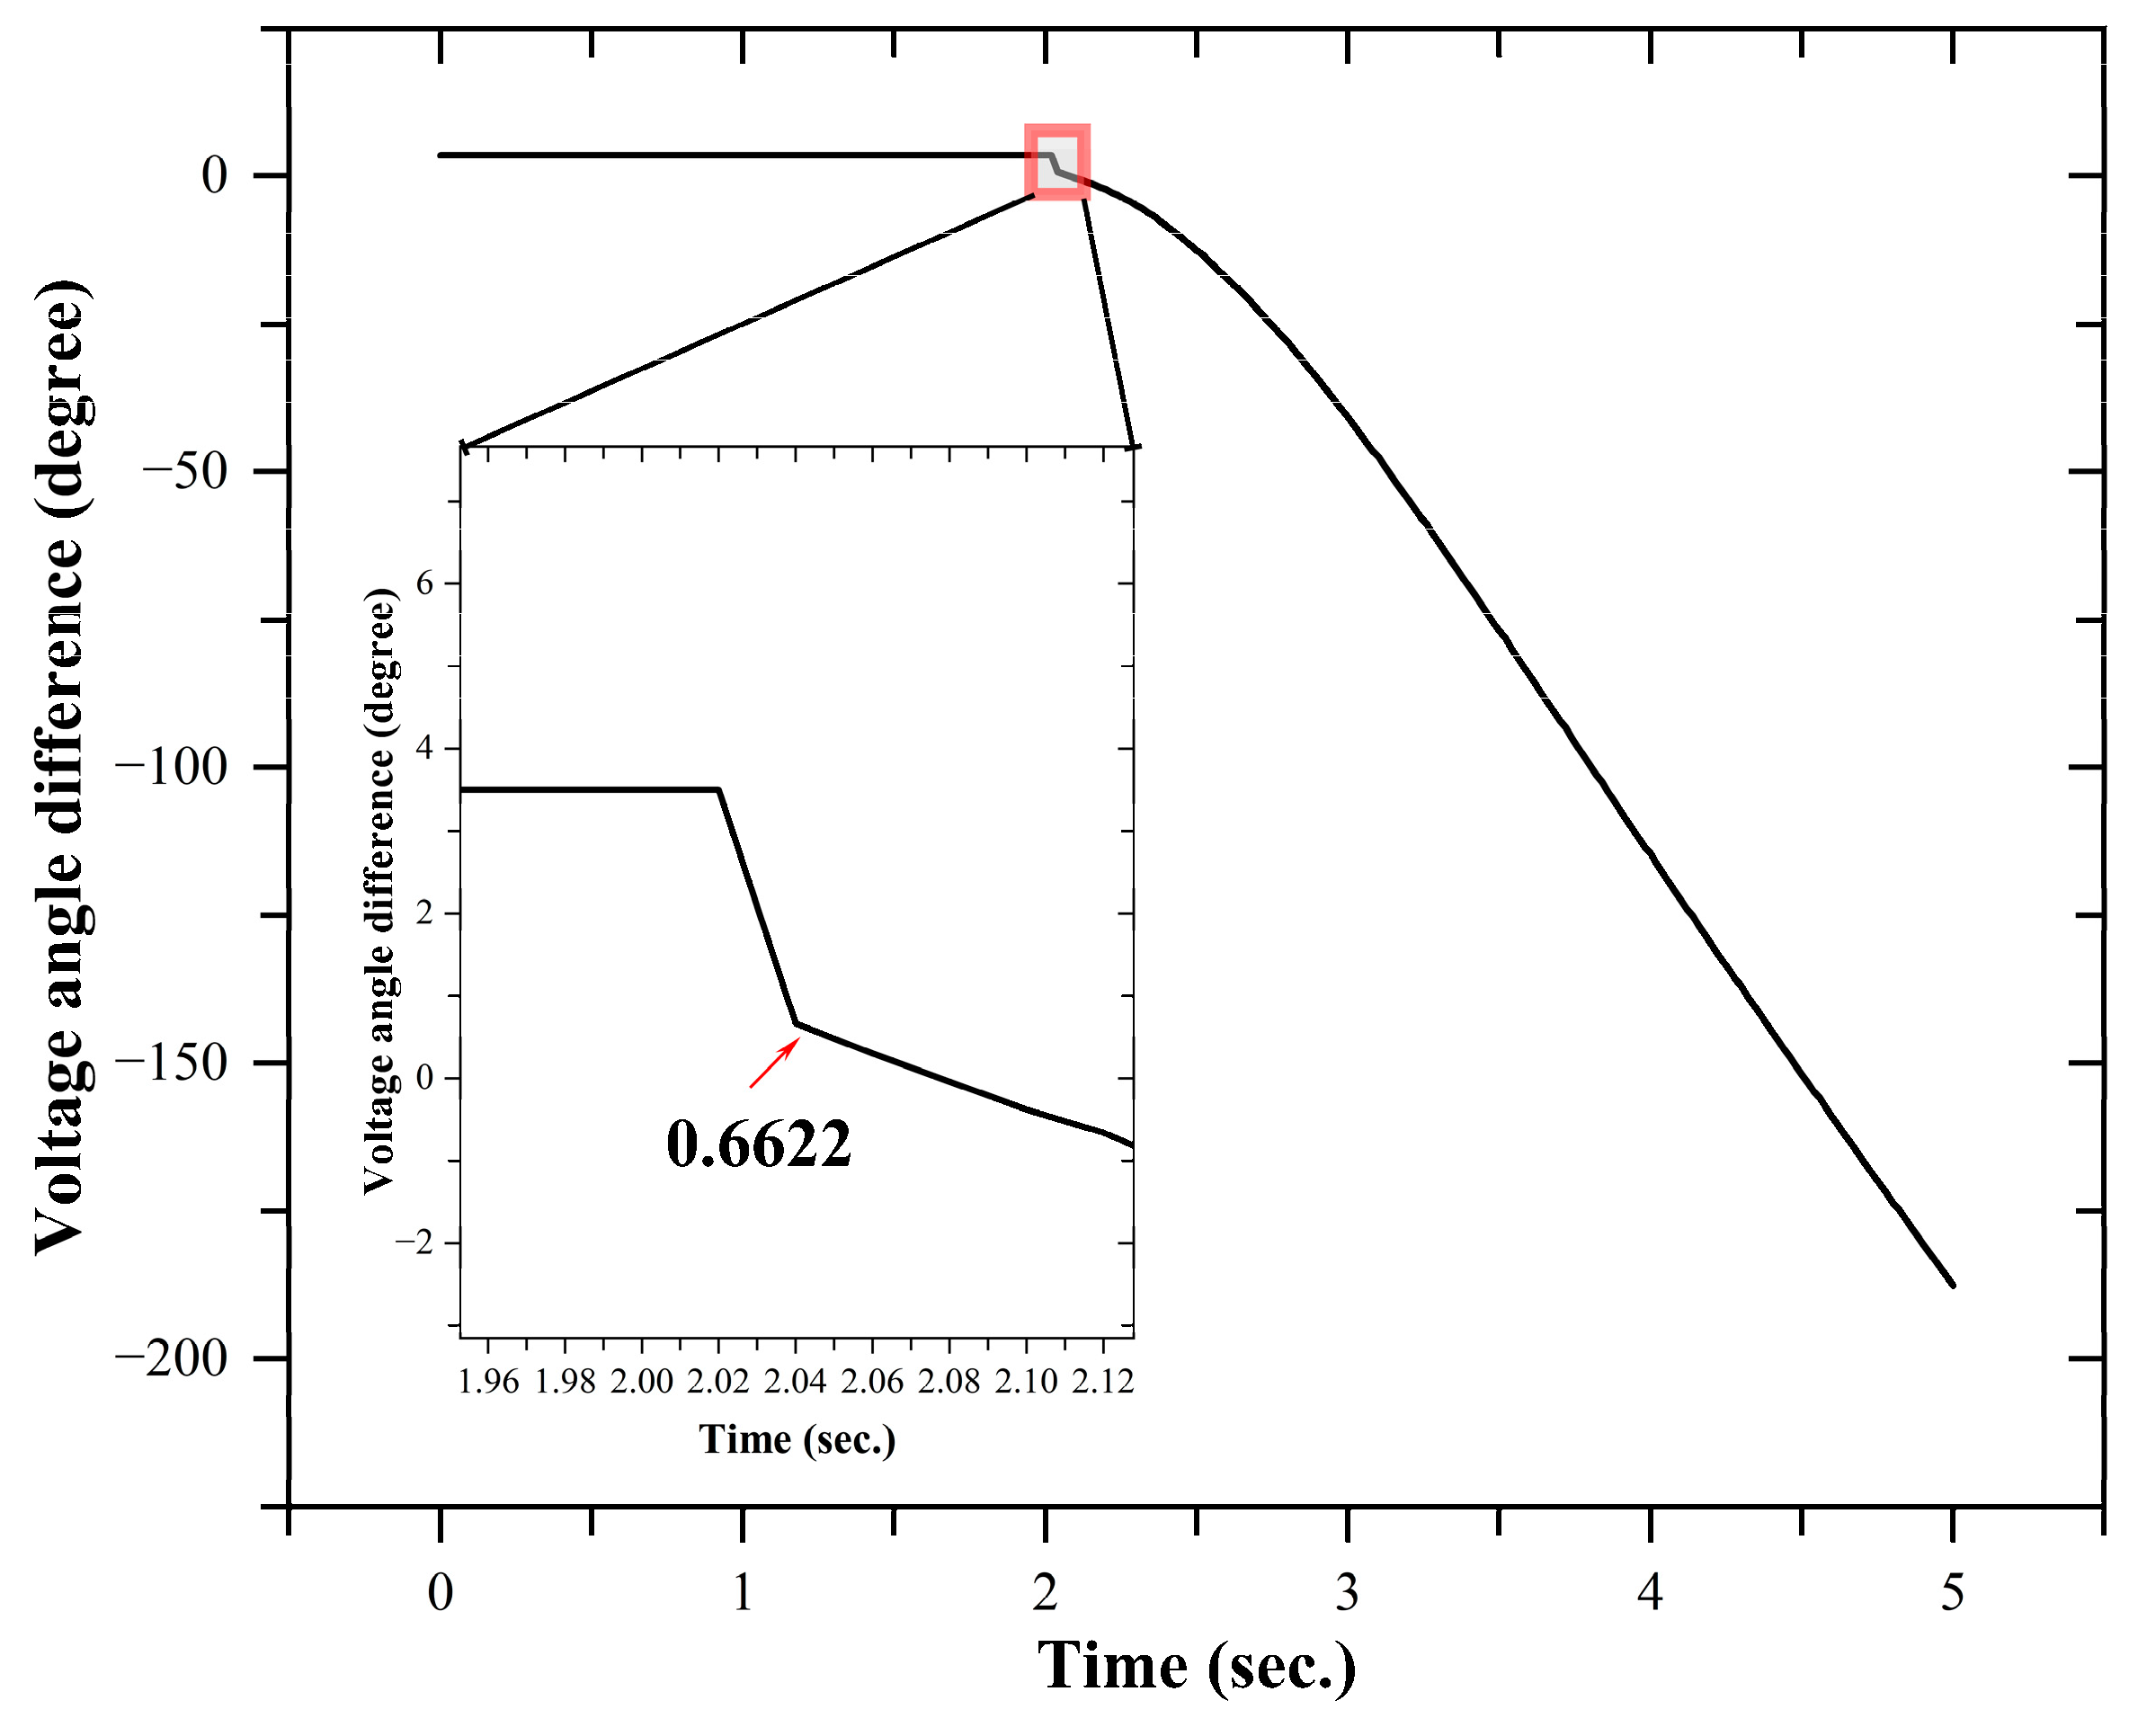
  • Scenario 4 (Sc. 4): the transmission line between PAKA and CJSS is open and RPTS to KTIH is open while the PAKA to KTIH transmission line is on outage (Figure 6).

3. Results Analysis and Discussions

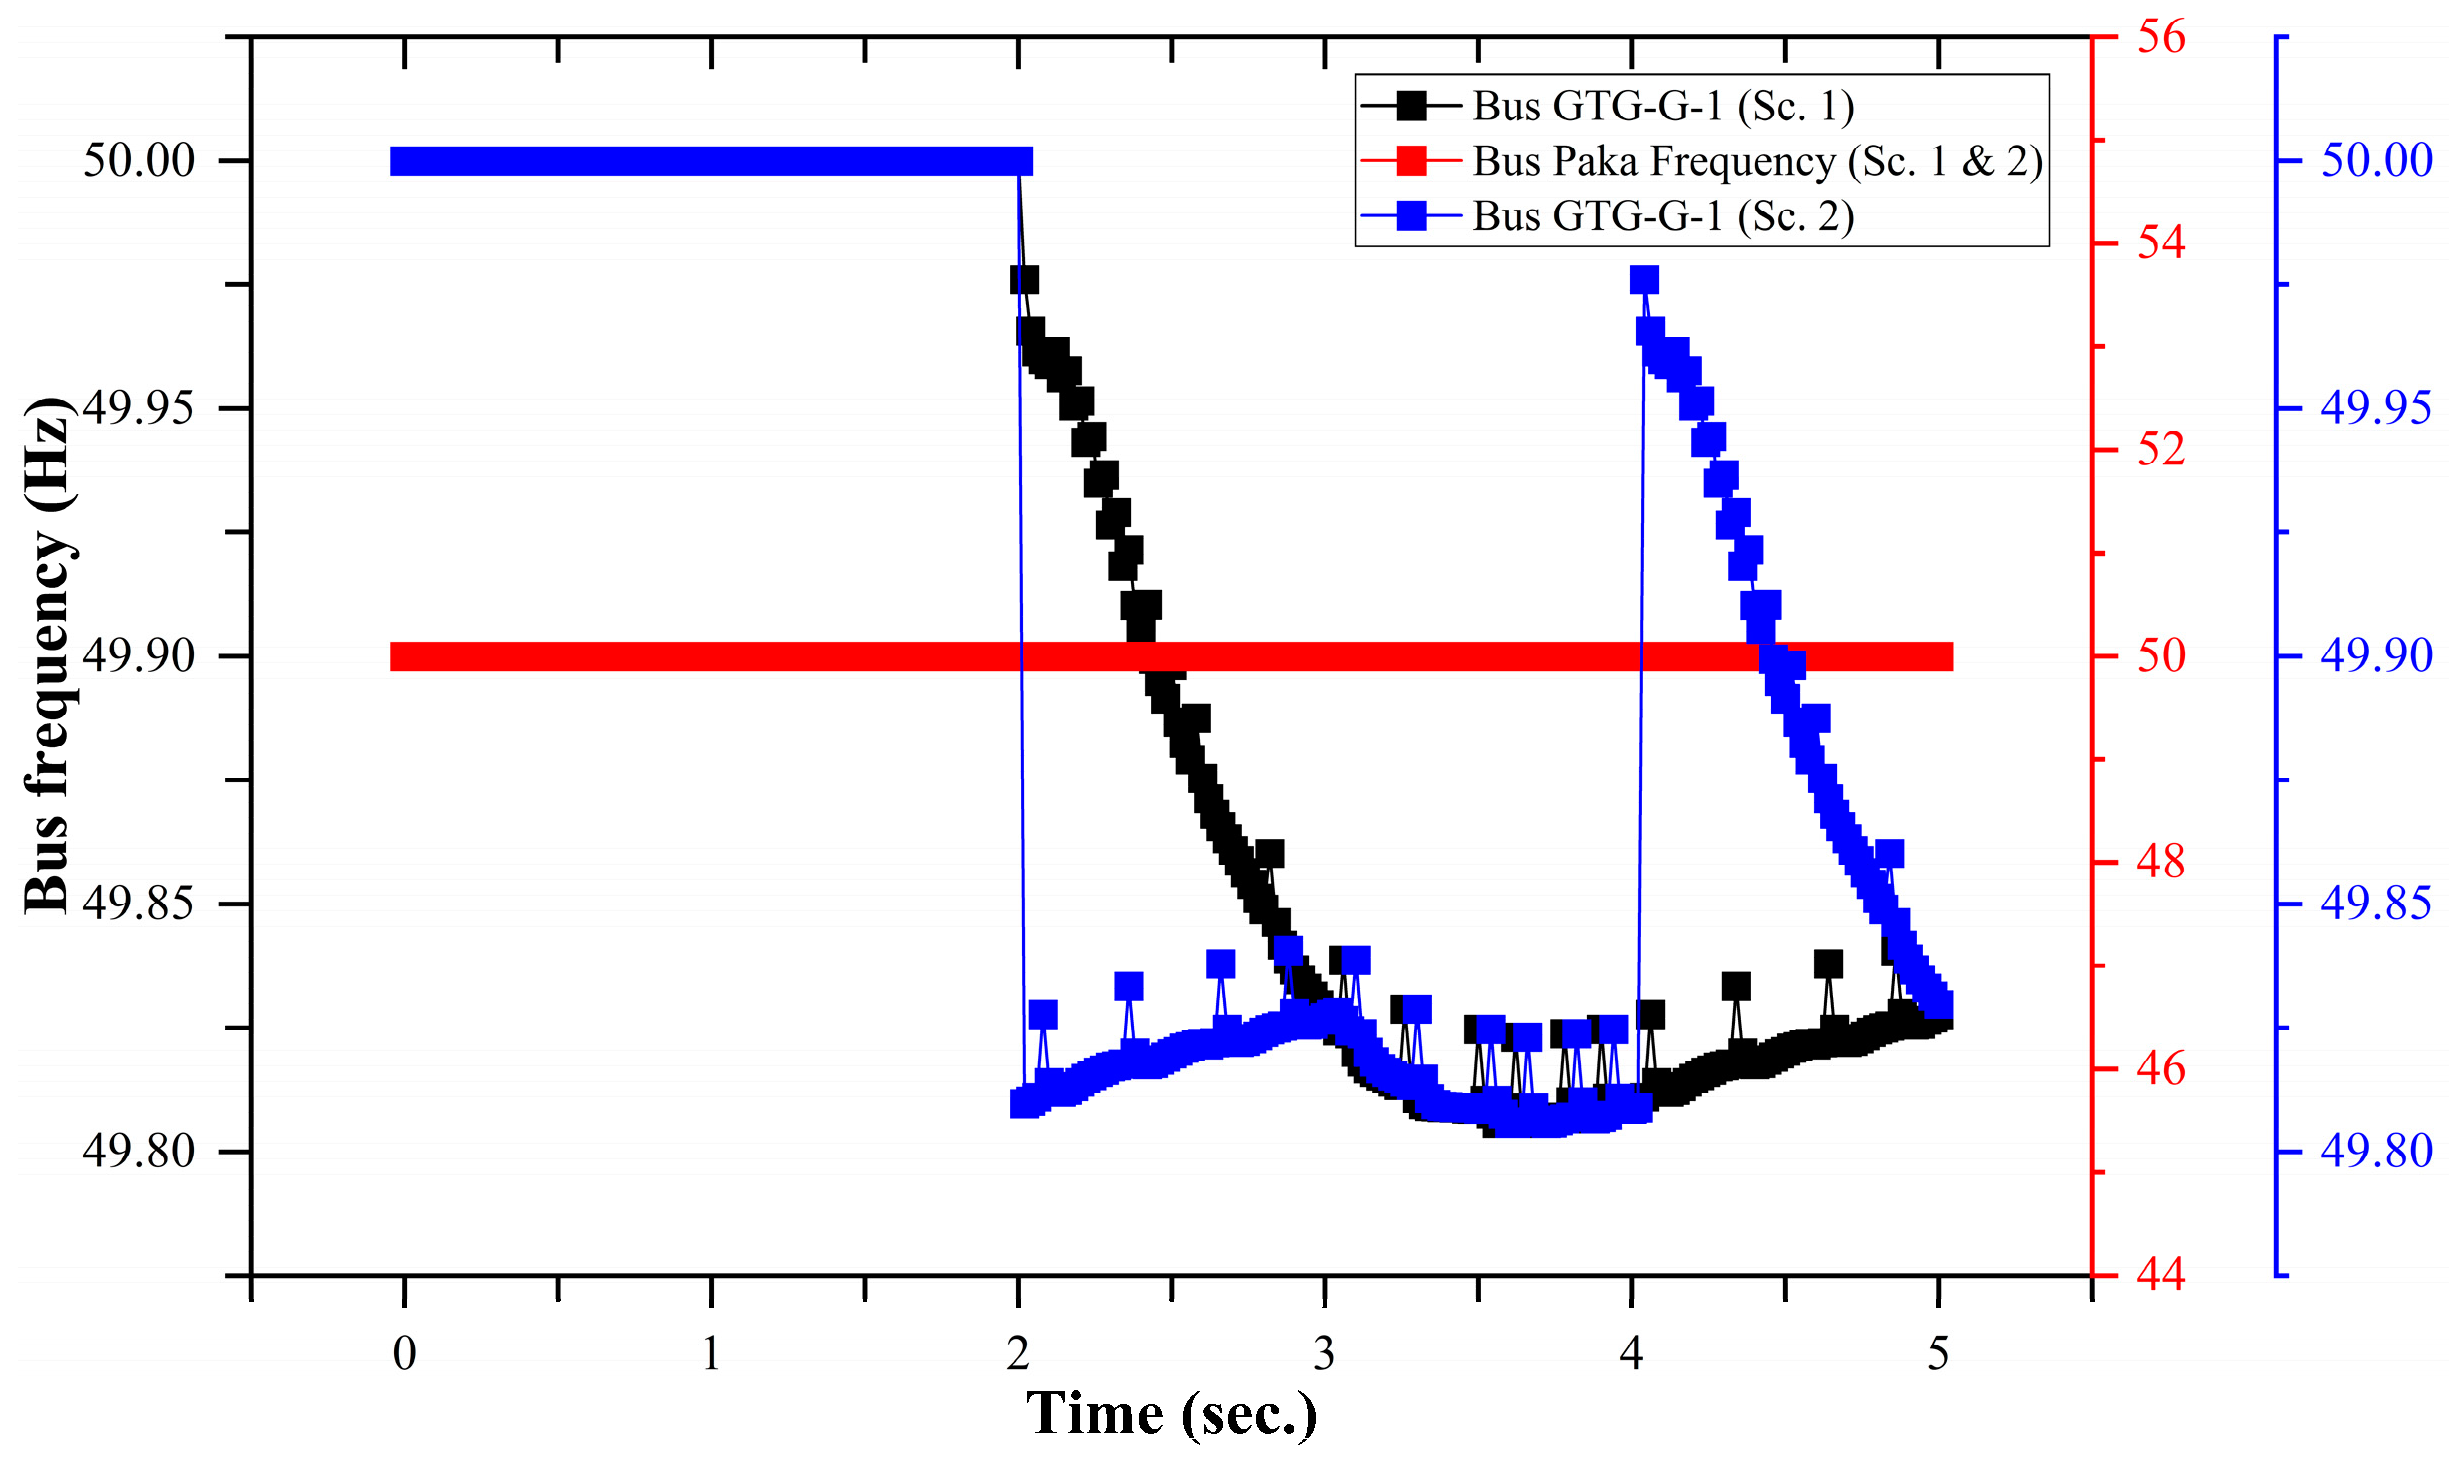
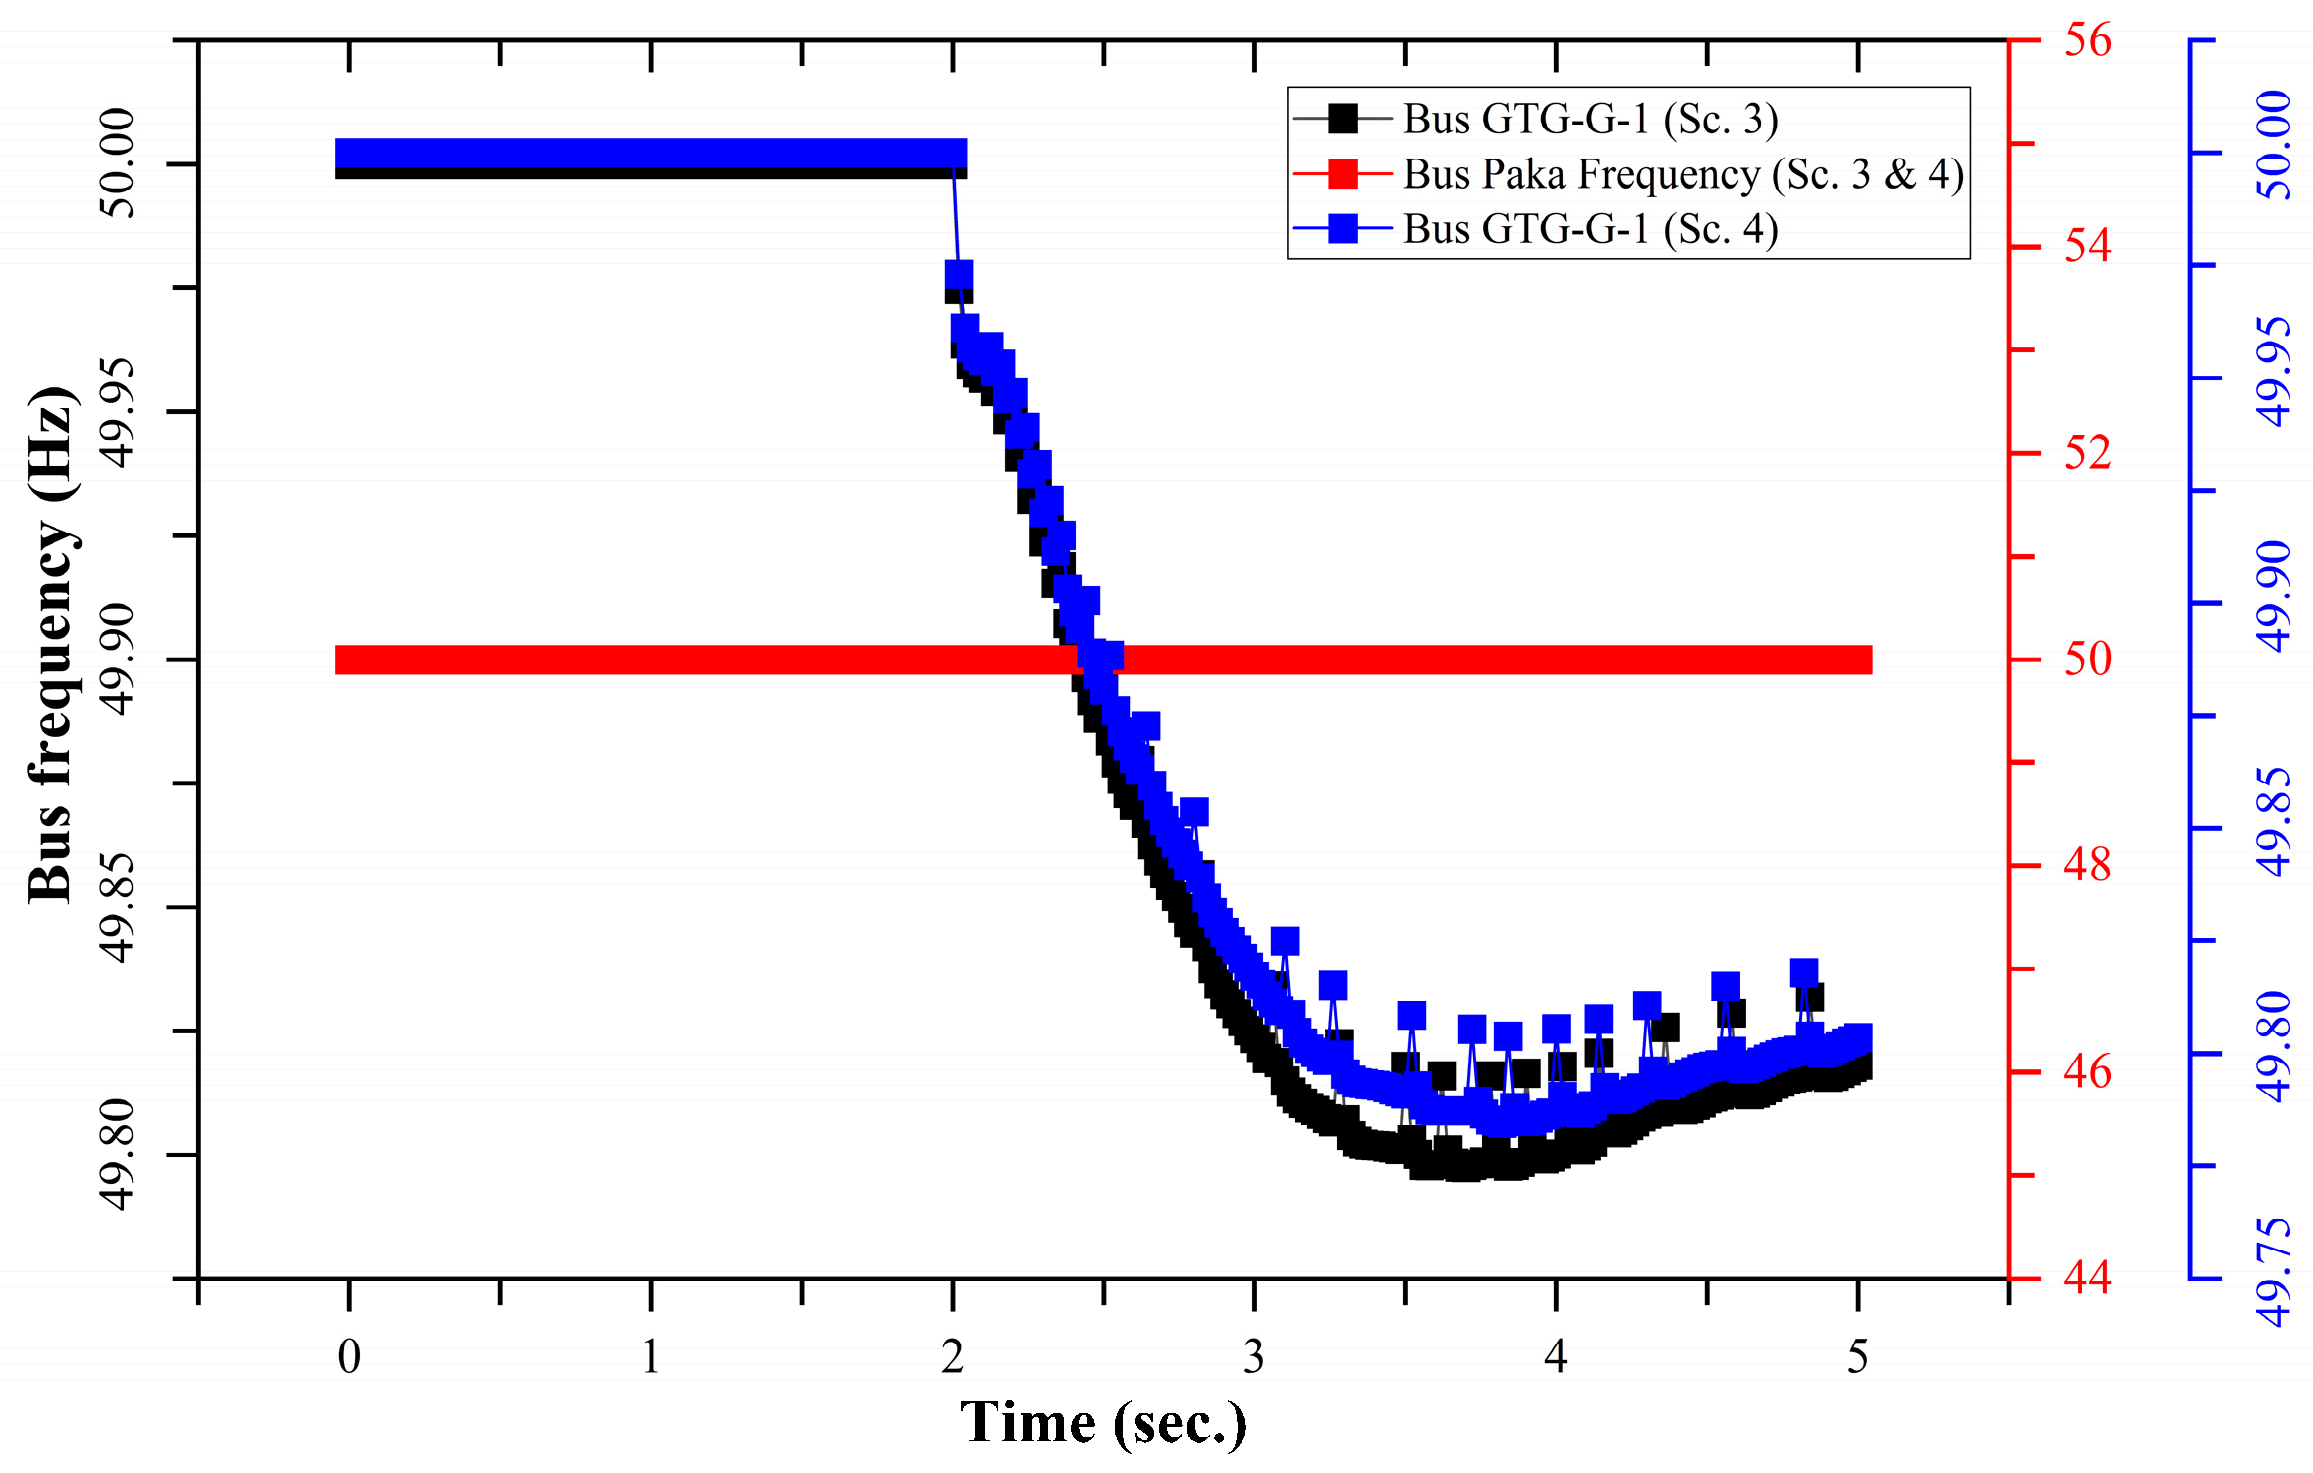
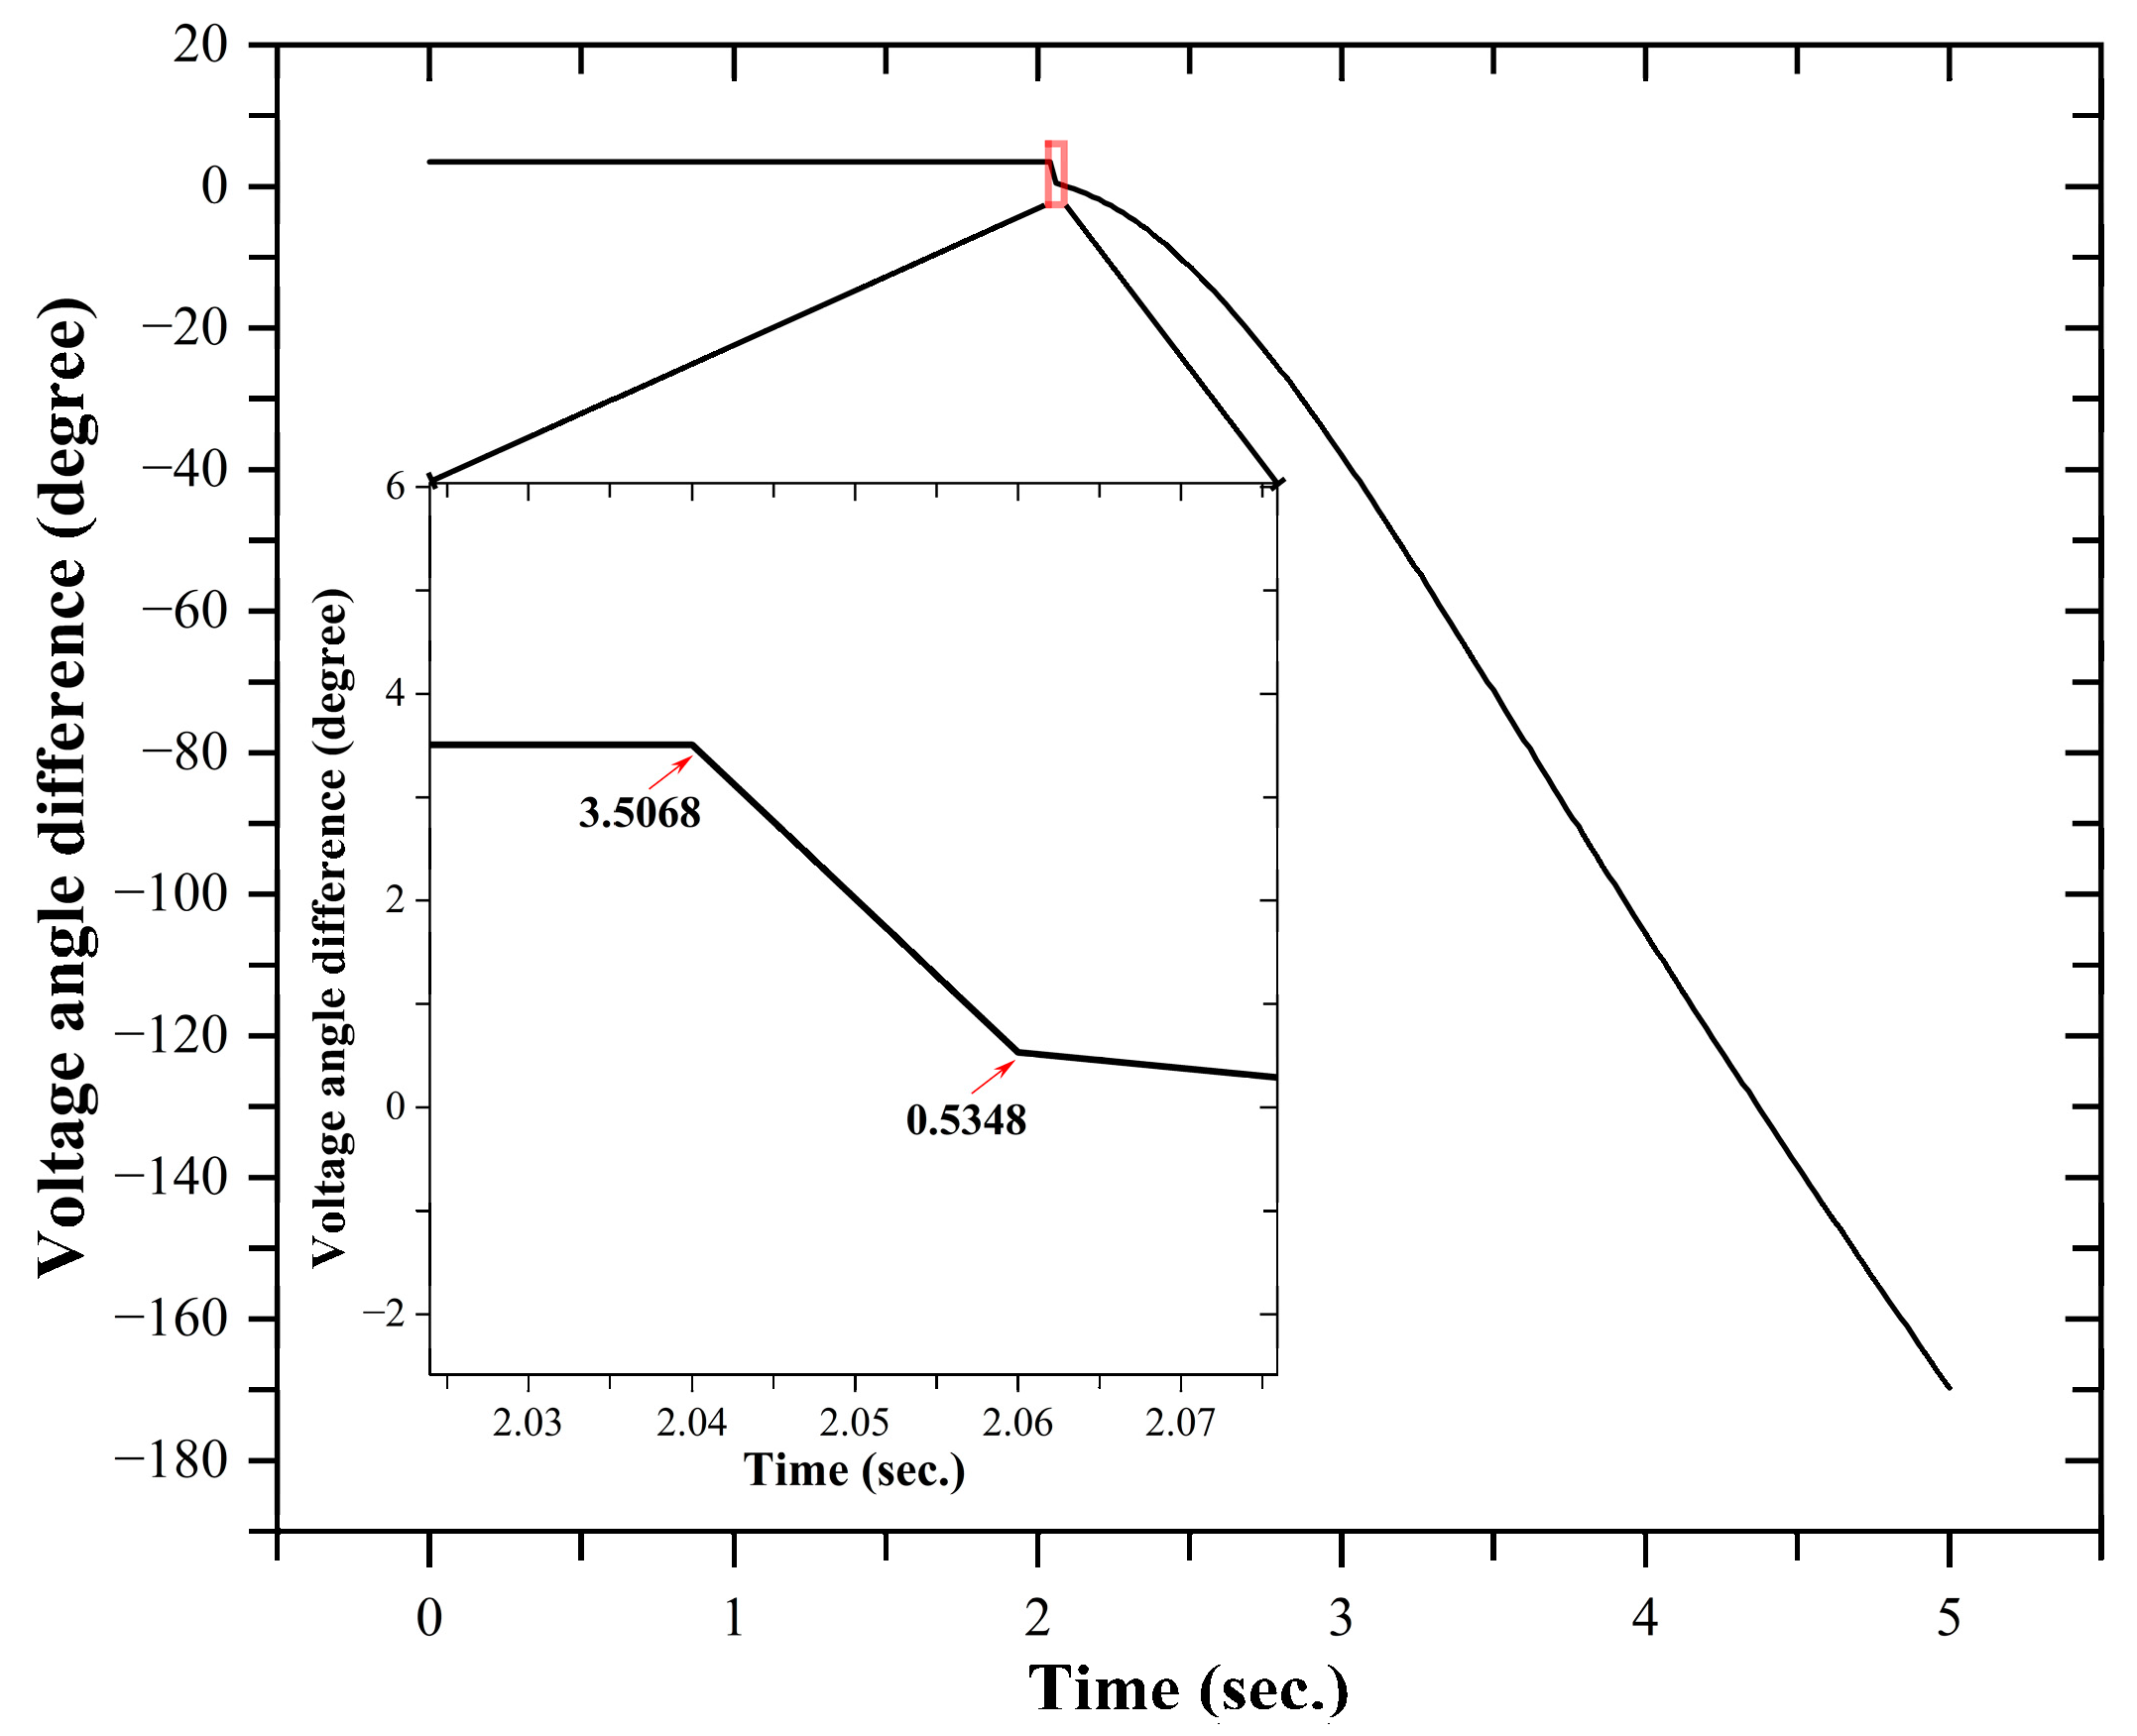
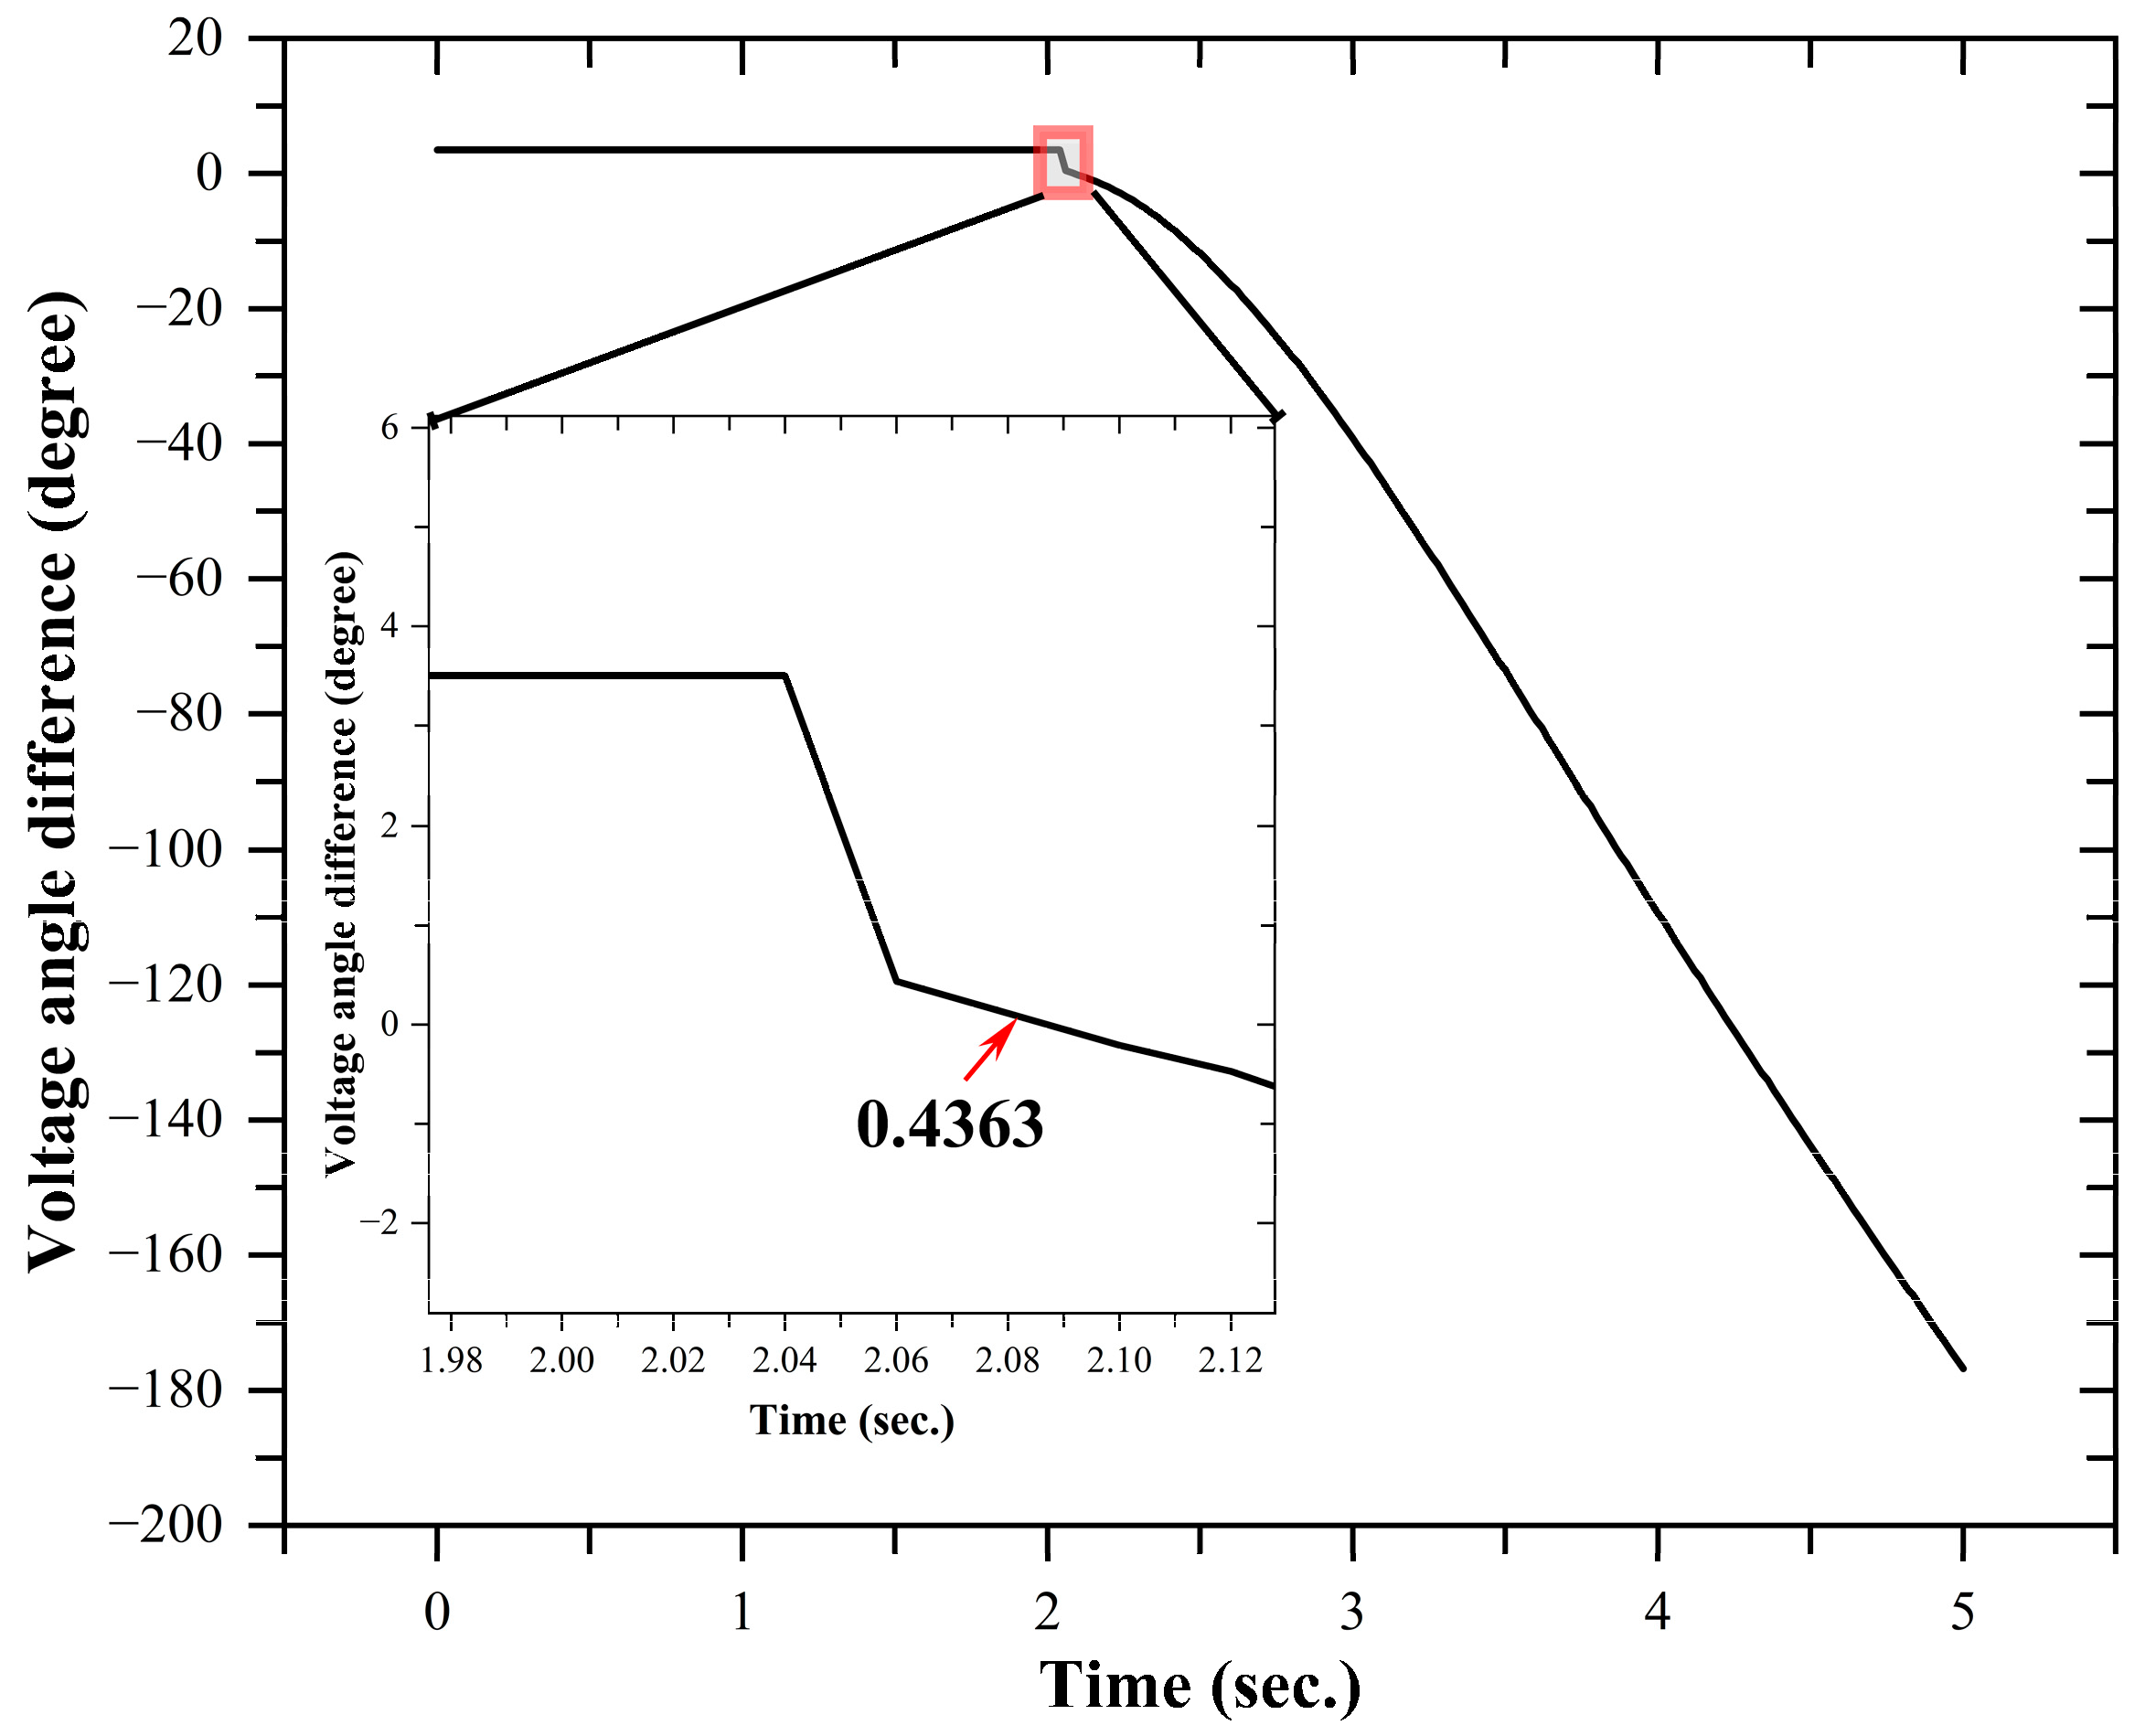
3.1. Under Frequency
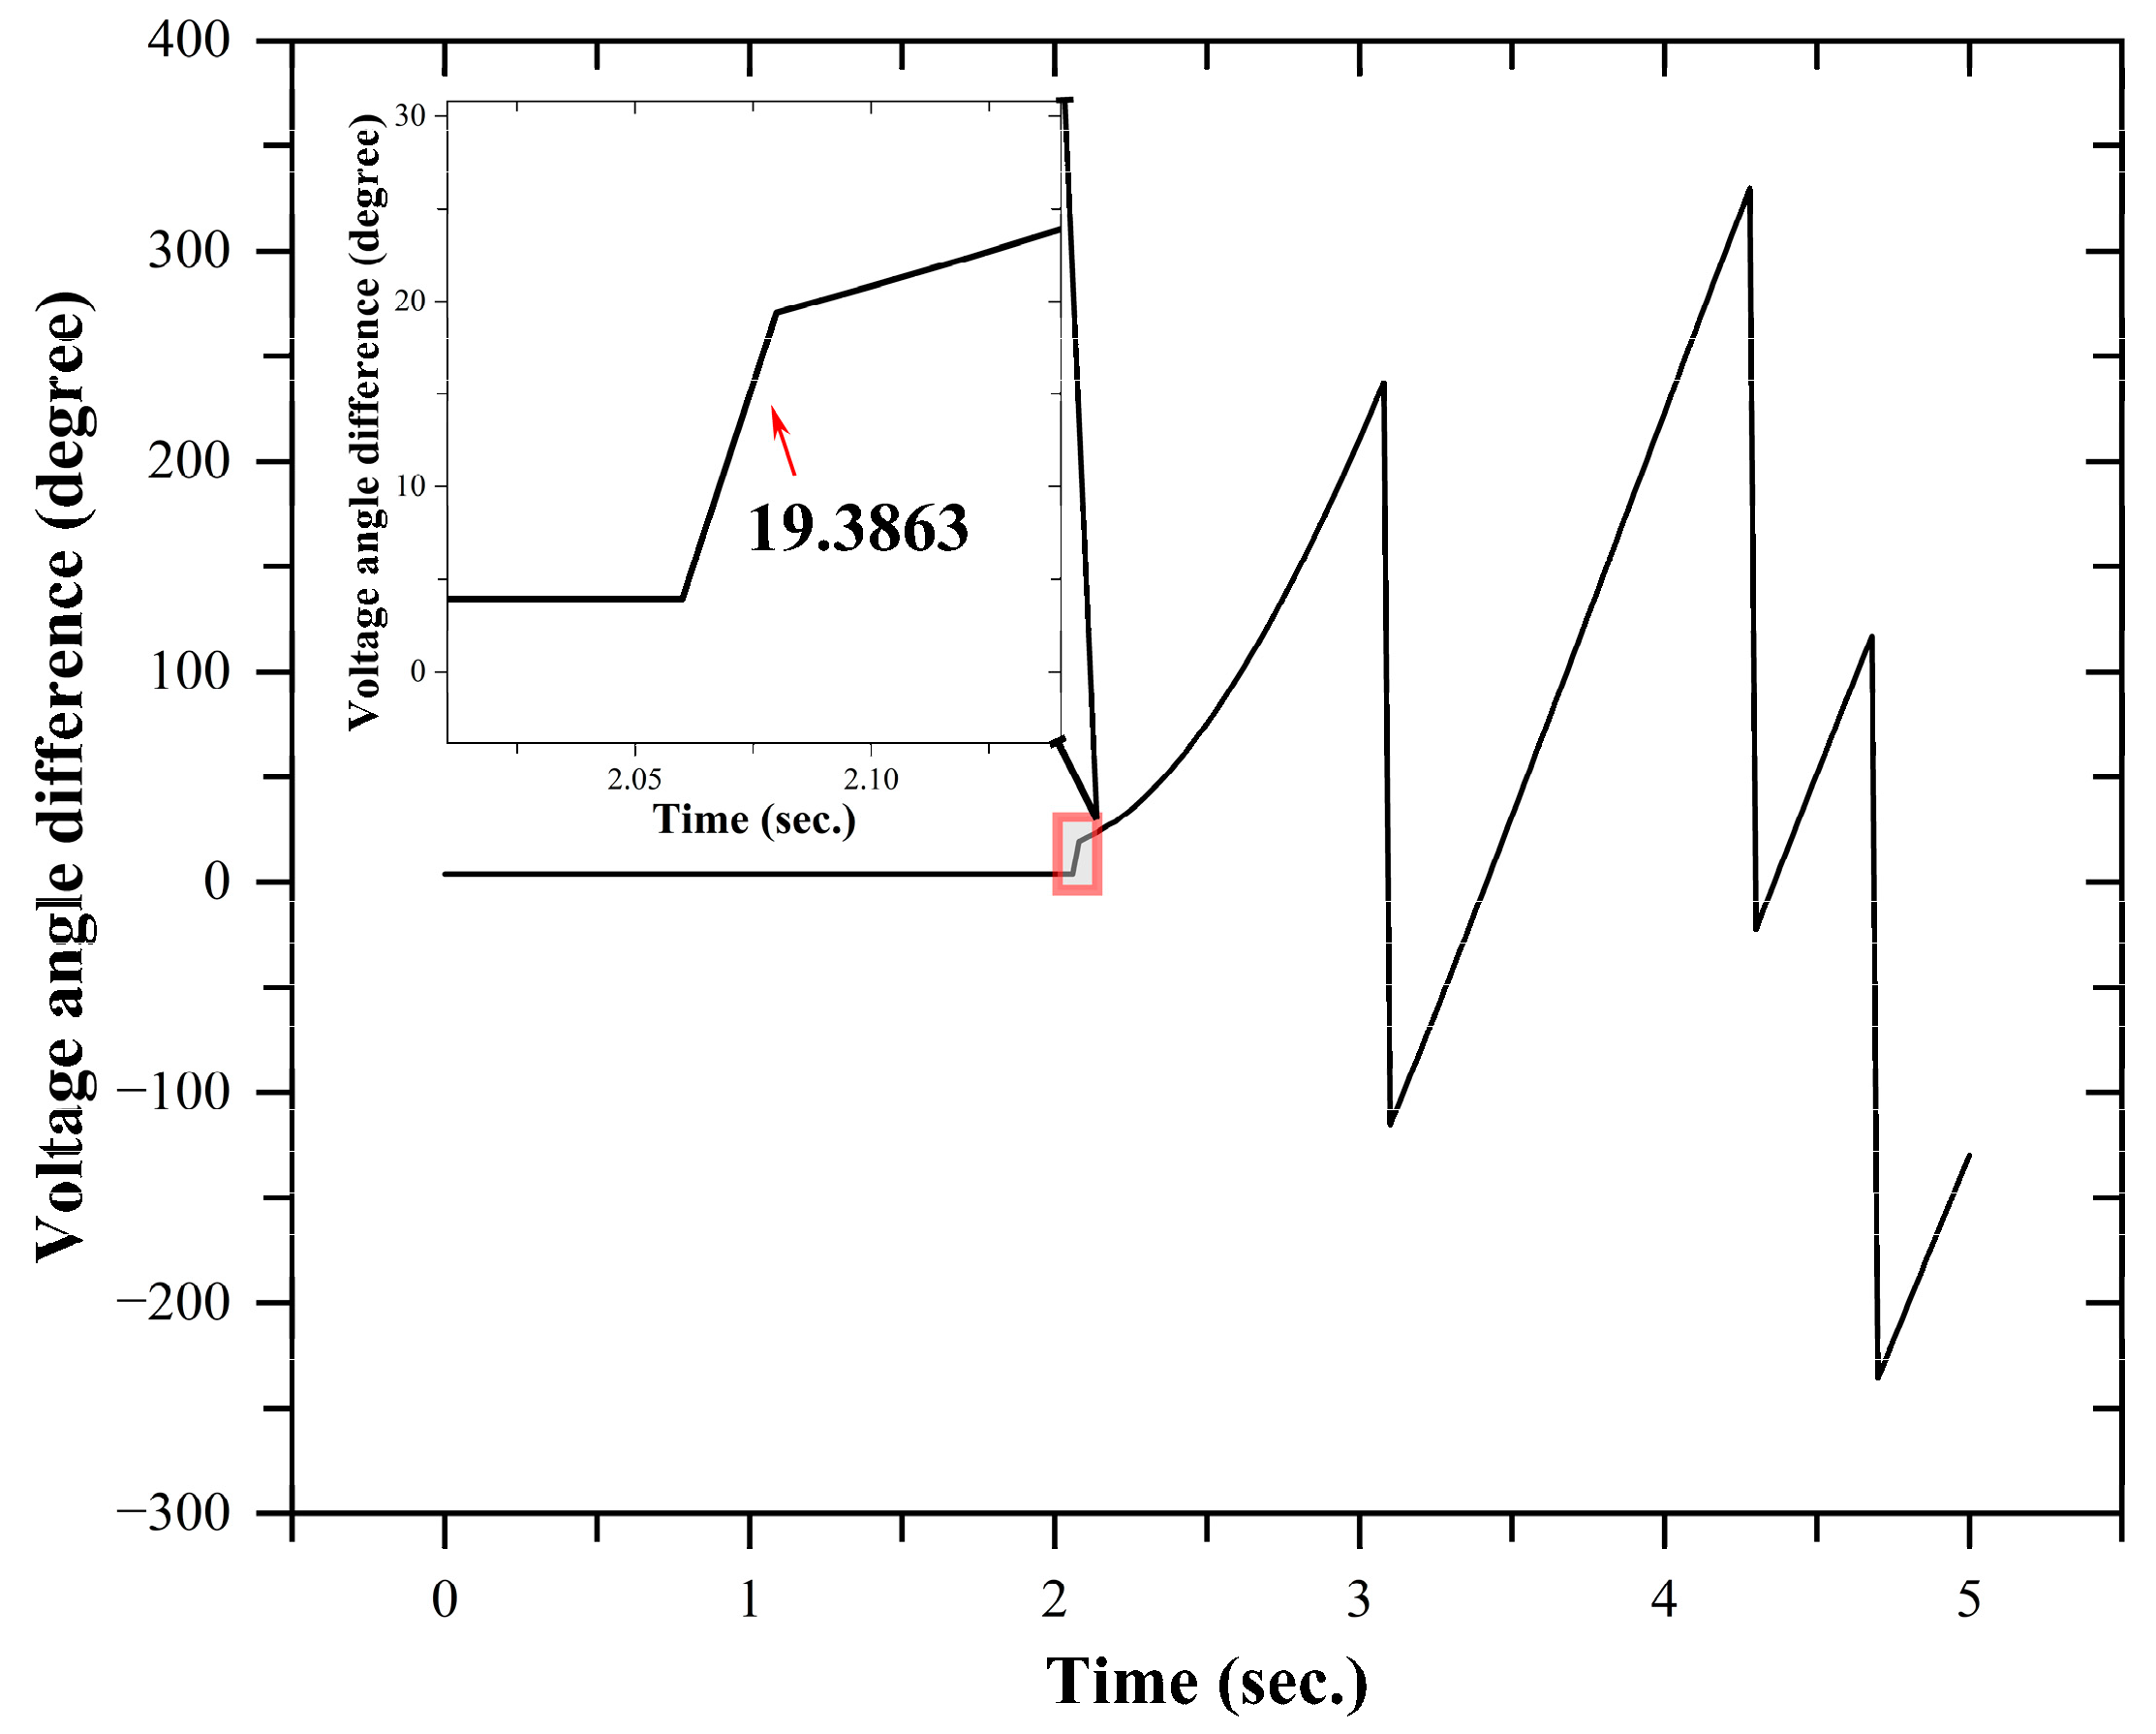
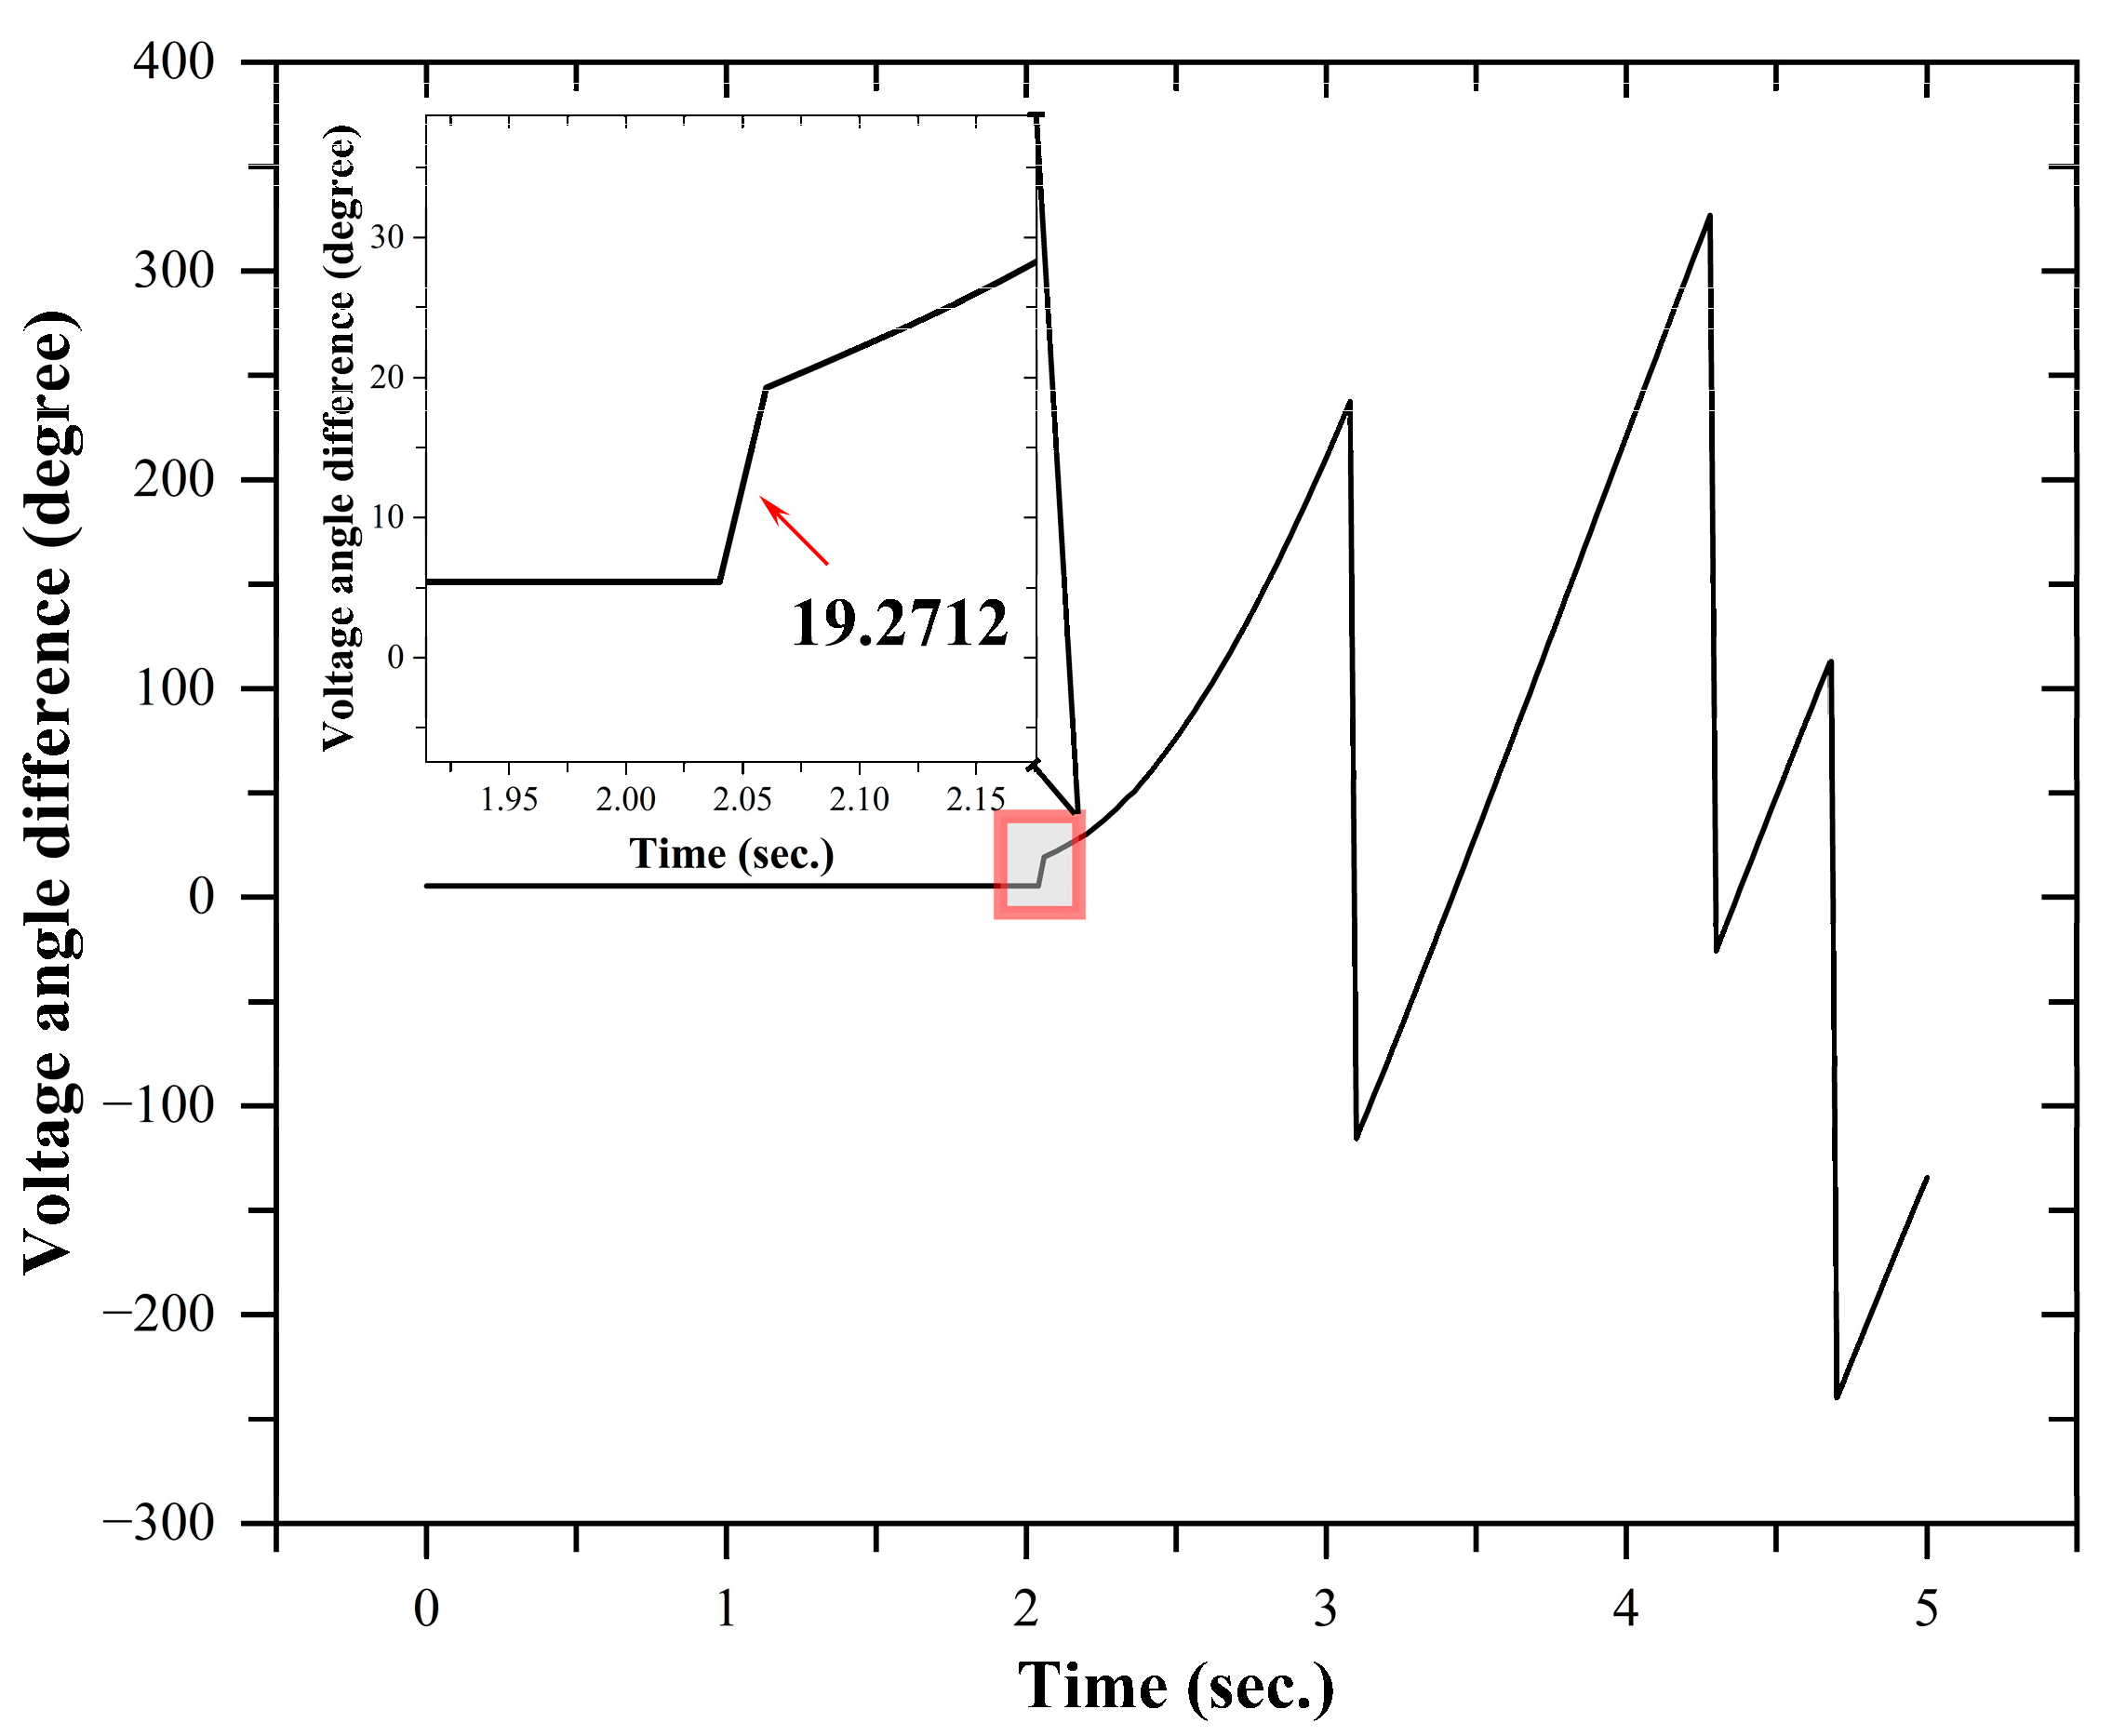
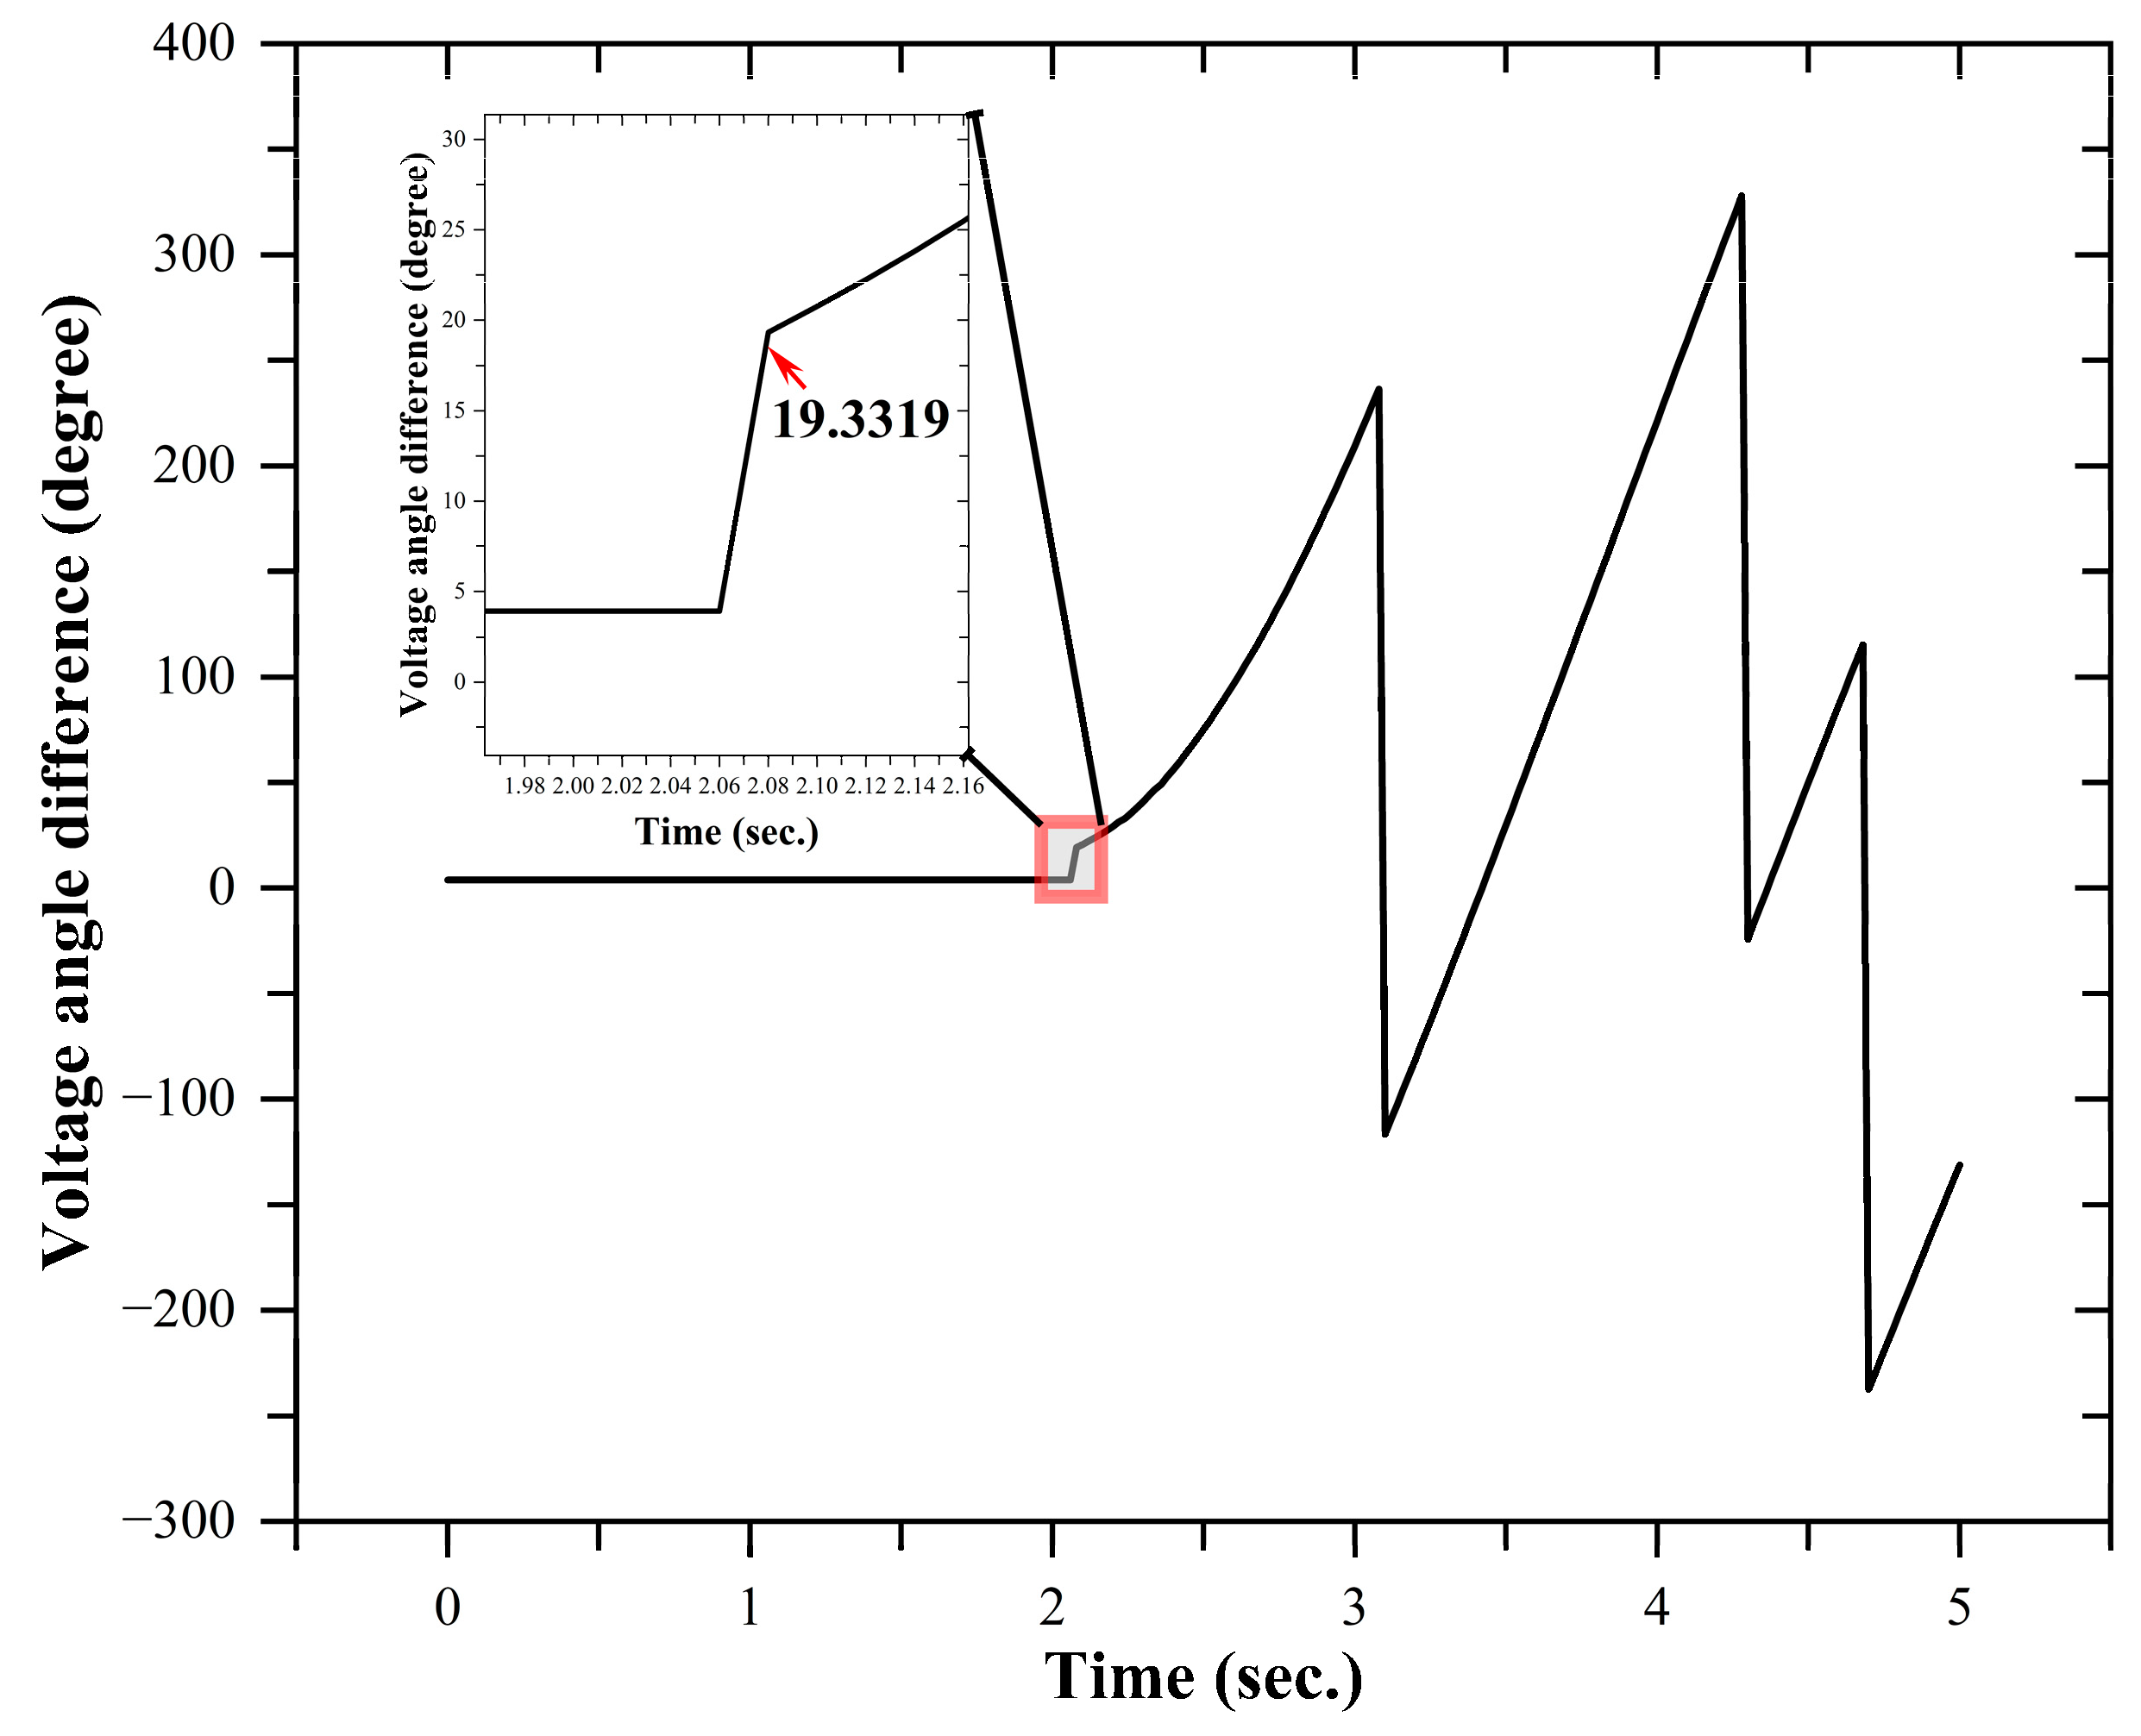
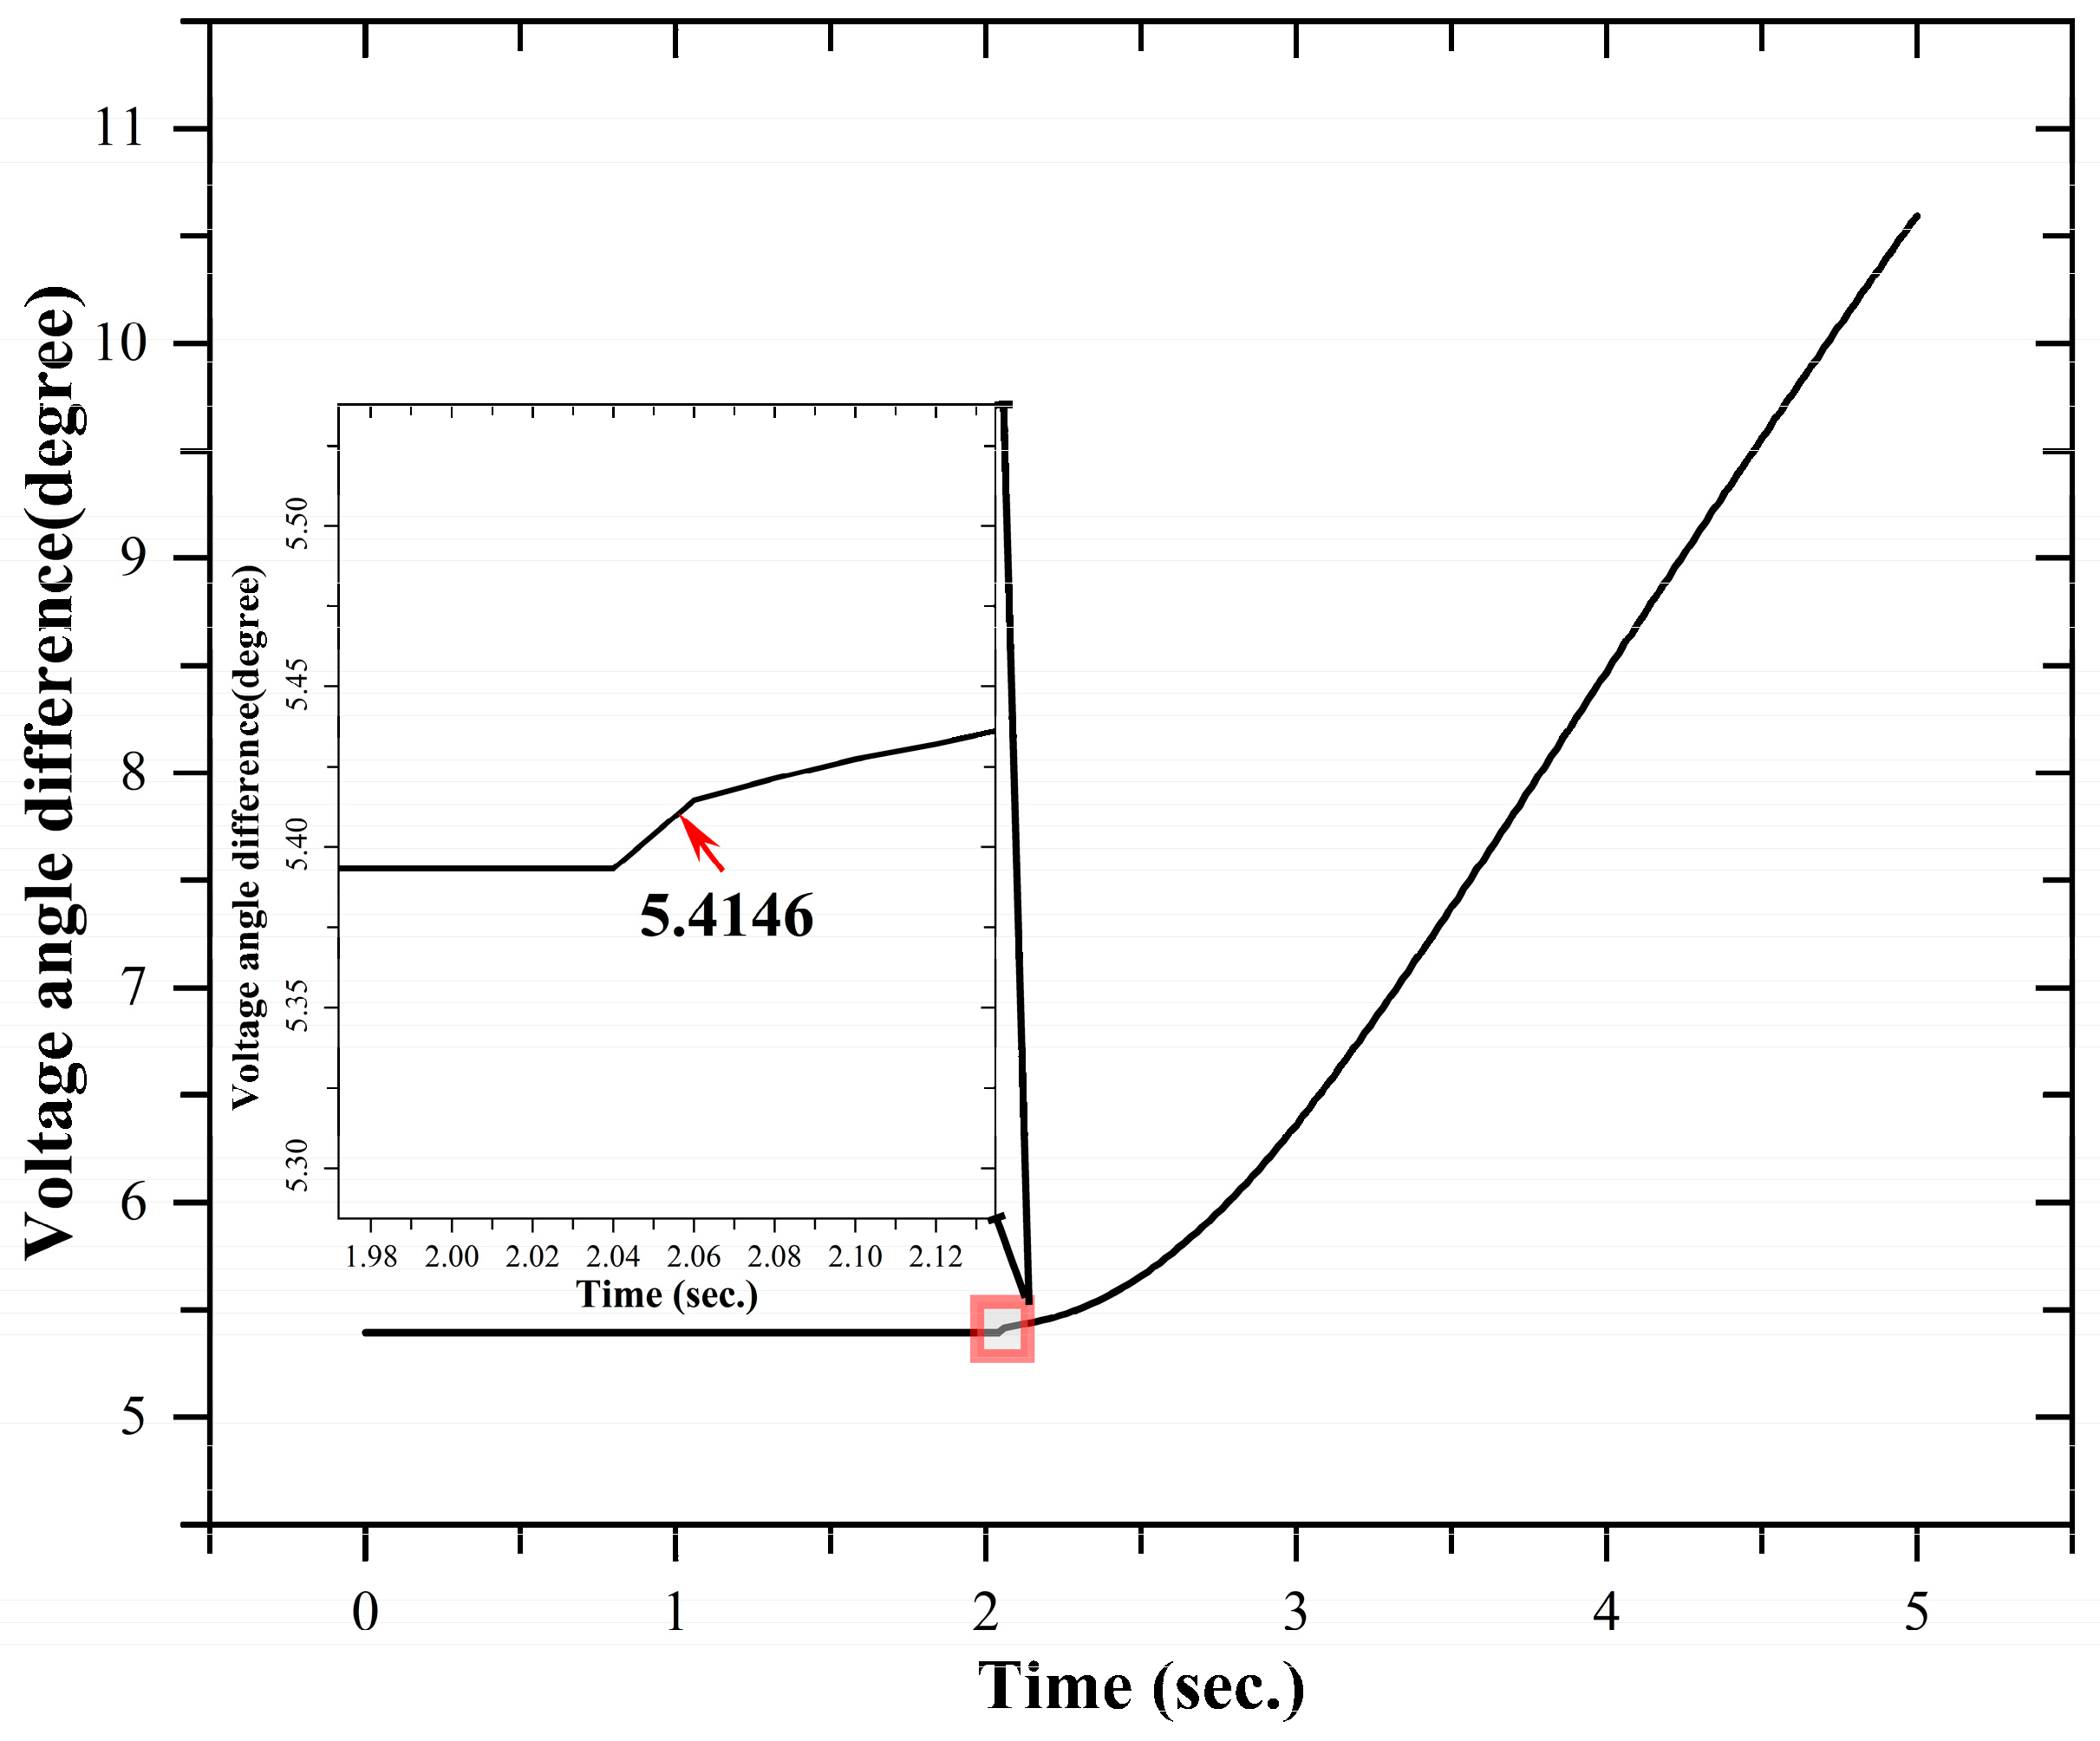
Figure 7 represents the under frequency island condition for Scenario 1 and Scenario 2 and Figure 8 represents the under frequency island condition for Scenario 3 and Scenario 4, respectively, where the capacity is lower than the load of the Utility Kerteh system. It can be shown that after an island inception at 2 s in the test system, the Bus GTG-G-1 frequency for Scenario 1, Scenario 3, and Scenario 4 show a downward trend; on the other hand, Bus GTG-G-1 for Scenario 2 shows a downward trend until 4 s and after that, it rises suddenly and then again goes down eventually. This happens due to the geographical distance between the PAKA and KTIH grids. However, the PAKA bus frequency for all scenarios remains constant as this is the slack bus.
Figure 9, Figure 10, Figure 11 and Figure 12 represent the implementation of the proposed unintentional island threshold setting technique for the under frequency Scenarios 1 to 4, respectively. Here, the plot is between voltage angle difference and time. Figure 9, Figure 10, Figure 11 and Figure 12 show an unchanged voltage angle difference until an island inception at 2 s. However, once the island is placed in the distribution system, the voltage angle difference values go down. Therefore, according to the proposed threshold technique, the under frequency island threshold for Scenario 1 (Figure 9) and Scenario 2 (Figure 10) should be 0.5348 degrees (2.06 s) and 0.5248 (2.04 s) degrees, respectively, which means that according to this proposed technique the island can be detected at 60 milliseconds and 40 milliseconds after an island inception in the system. On the other hand, Scenario 3 (Figure 11) and Scenario 4 (Figure 12) should be 0.4363 degrees (2.06 s) and 0.6622 (2.04 s) degrees, respectively, which states that according to this proposed technique the island can be detected at 60 milliseconds and 40 milliseconds.

3.2. Over Frequency

Figure 13 and Figure 14 represent the unintentional over frequency island condition for Scenario 1, Scenario 2, Scenario 3, and Scenario 4, respectively, where the capacity of the DG capacity is higher than the load of the Utility Kerteh system. It can be shown that after an island inception at 2 s in the test system, the Bus GTG-G-1 frequency for Scenario 1 and Scenarios 2 and 3 shows an upward trend while Scenario 4 shows a sudden jump after island inception and then remains in a steady state towards a constant frequency due to the threshold load of the KTIH bus. Notably, in Scenario 1 and Scenario 2, the Bus GTG-G-1 frequency data are closely similar due to the bus distance between PAKA and KTIH and RPTS and KTIH. However, the PAKA bus frequency for Scenarios 1 to 4 remains unchanged as this is the utility or slack bus.
Figure 15, Figure 16, Figure 17 and Figure 18 present the implementation of the proposed unintentional island threshold placing technique for the over frequency Scenario 1 to Scenario 4, respectively. Here, the plot is between voltage angle difference and time. Figure 15, Figure 16, Figure 17 and Figure 18 show an unchanged voltage angle difference until an island inception at 2 s. However, once the island occurred in the system voltage, the angle difference values were scattered through the way of time.
Therefore, according to the proposed threshold technique, the over frequency island threshold for Scenario 1 (Figure 15) and Scenario 2 (Figure 16) should be 19.3863 degrees (2.08 s) and 19.2712 (2.06 s) degrees, respectively, which means that according to this proposed technique, the island can be detected at 80 milliseconds and 60 milliseconds after the island inception in the system at 2 s.
On the other hand, Scenario 3 (Figure 17) and Scenario 4 (Figure 18) should be 19.3319 degrees (2.08 s) and 5.4146 (2.06 s) degrees, respectively, which states that according to this proposed technique, the island can be detected at 80 milliseconds and 60 milliseconds, respectively. However, Scenario 1 and Scenario 3 have the highest island threshold time of 80 ms due to the minimum voltage excursion between the DG and the utility side.

3.3. Result Summary

Table 3 shows the results of the proposed unintentional island threshold technique. From Table 3, the lowest threshold time is for Scenario 2 and Scenario 4 in the under frequency island condition due to the maximum voltage excursion between the DG and utility. However, the lowest threshold value is from the under frequency Scenario 3 due to the minimum geographical bus distance between CJSS and RPTS.
On the other hand, the highest island threshold time is 80 ms, which is found from the over frequency Scenario 1 and Scenario 3 due to the minimum voltage excursion between the DG and utility. Notably, the lowest threshold of the over frequency scenarios can be found in Scenario 4 and this happens due to the bus distance between PAKA and CJSS. According to the IEEE standard, all island cases should be detected within 2 s to reduce hazardous situations. However, from the proposed island threshold technique we will be able to detect unintentional islands in 40 ms (minimum) to 80 ms (maximum) depending on the scenarios. Notably, when the island takes place, there is a minimal voltage excursion in a bidirectional way between the DG and the utility end. This rate of bidirectional power flow between the DG and the utility side can be varied according to the islanding scenarios. Since the proposed method operates using the voltage angle difference between the DG and the utility side, it can detect the islanding for different scenarios considering bidirectional power flow. In addition, for all the islanding scenarios’ under frequency and over frequency conditions, the island inception can occur at 2 s and the fluctuation (upward and downward trend) in frequency occurs due to the value of the KTIH bus load or the utility load. Therefore, the changes in the frequency plots over time after island inceptions can occur due to the utility load. The island inception time has not been assigned in this research. The proposed technique can only start its operation after the island inception in the network. However, the proposed technique is also contributing to increasing the distribution system reliability since it is able to decrease the hazardous situation as well as damages to power electronics equipment by its faster detection time.

4. Conclusions

This research work demonstrates the steps of developing an island threshold technique which is very important to protect the electrical distribution grid from a hazardous situation during islanding. The proposed island threshold technique is able to figure out the actual unintentional islanding scenarios of a real Malaysian distribution system named Utility Kerteh. This study utilizes voltage angle difference which comes from the DG bus voltage angle and utility bus voltage angle. This voltage angle difference differs from power swing since data are collected from different buses in a time synchro phasor device. This allows the change in frequency as well as other characteristics to be pinpointed when an islanding occurs in the system. Therefore, the proposed technique can be useful for the real-time implementation of the distribution system. Results of Scenario 1 for both the under and over frequency unintentional island detection threshold times are 60 ms and 80 ms, respectively, and for Scenario 2 the threshold times are 40ms and 60 ms, respectively. In addition, Scenario 3 for both the under and over frequency unintentional island detection threshold times are 60 ms and 80 ms, respectively, and the Scenario 4 threshold times are 40 ms and 60 ms, respectively, which states that the proposed technique follows the IEEE standards.
Since customers usually prefer power continuity even in an island context, the proposed technique can be used with adaptive load shedding during hurricanes, bushfires, floods, or any other climate extremes for future work. Power systems are frequently kept operational when an island is occupied. Therefore, the power delivery during the islanding state may be optimized by tripping only the necessary load to maintain system stability. For instance, we may integrate the chance constraint optimization for assessing the transmission line and loads to meet the day-ahead unit commitment of a distribution system.

Author Contributions

A.A.A. developed and designed the methodology, executed the literature study, prepared the data inputs, provided technical support, and wrote and reviewed the entire manuscript. M.S.R. drew the figures and reviewed and edited the manuscript. M.S.H.L., S.T.M. and M.R.S. reviewed the manuscript and advised on appropriate inputs to improve the quality of the manuscript. N.S.S.S. reviewed the paper and arranged the funding on this topic. All authors have read and agreed to the published version of the manuscript.

Funding

This research was funded by the Universiti Kebangsaan Malaysia under Grant Codes GGPM-2021-050, GP-2021-K023619 and Universidad Antonio de Nebrija under Grant Code the Comunidad de Madrid [grant SEGVAUTO 4.0-CM-P2018EEMT-4362] and the Agencia Estatal de Investigación [grant RETOS 2018-RTI2018-095923-B-C22].

Data Availability Statement

Not applicable.

Acknowledgments

The author wishes to extend his sincere thanks to the support of the Faculty of Data Science and Information Technology, INTI International University, Malaysia, for providing state-of-the-art research support to carry on this work.

Conflicts of Interest

The authors declare no conflict of interest.

Nomenclatures

X r y b Normal operating voltage angle
X r y b + DG voltage angle
X r y b Utility voltage angle
ω Fortescue transformation matrix
XUFVoltage angle of the under frequency island conditions
x O F Voltage angle of the over frequency island conditions
XSMVoltage angle of the system frequency island conditions
Ι Ι D G Current through DG bus
Ι Ι U t i l i t y Current through utility bus
Ι A Line-line fault current
Ι H Line-ground fault current
Ι Β Line-line-ground fault current
Κ A Β Line-line fault impedance
KPLine-line fault impedance at point p
KQLine-line fault impedance at point Q
KLLine-line fault impedance at point L
Κ Line-ground fault impedance
Κ Line-line-ground fault impedance
Κ Line-line-line impedance
Κ DG bus impedance
Κ Utility bus impedance
φ System phase angle
φ y System phase angle in y sequence
φ b System phase angle in b sequence

References

  1. Bashir, J.; Jena, P. A Novel Islanding Detection Method in a Distributed Generation Using Change in Phase Angle Difference Between Positive Sequence Current and Voltage. Trans. Indian Natl. Acad. Eng. 2023, 1–11. [Google Scholar] [CrossRef]
  2. Kumar, P.; Kumar, V.V.; Tyagi, B. Islanding detection for reconfigurable microgrid with RES. IET Gener. Transm. Distrib. 2021, 15, 1187–1202. [Google Scholar]
  3. Seong-Cheol, K.; Ray, P.; Salkuti, S.R. Islanding detection in a distribution network with distributed generators using signal processing techniques. Int. J. Power Electron. Drive Syst. 2020, 11, 2099–2106. [Google Scholar]
  4. Motter, D.; Vieira, J.C. Improving the islanding detection performance of passive protection by using the undervoltage block function. Electr. Power Syst. Res. 2020, 184, 106293. [Google Scholar]
  5. Abdelsalam, A.A.; Salem, A.A.; Oda, E.S.; Eldesouky, A.A. Islanding detection of microgrid incorporating inverter based DGs using long short-term memory network. IEEE Access 2020, 8, 106471–106486. [Google Scholar]
  6. Khichar, S.; Lalwani, M. An analytical survey of the islanding detection techniques of distributed generation systems. Technol. Econ. Smart Grids Sustain. Energy 2018, 3, 1–10. [Google Scholar]
  7. Manikonda, S.K.G.; Gaonkar, D.N. Islanding detection method based on image classification technique using histogram of oriented gradient features. IET Gener. Transm. Distrib. 2020, 14, 2790–2799. [Google Scholar]
  8. Zamani, R.; Golshan, M.E.H.; Alhelou, H.H.; Hatziargyriou, N. A novel hybrid islanding detection method using dynamic characteristics of synchronous generator and signal processing technique. Electr. Power Syst. Res. 2019, 175, 10591. [Google Scholar]
  9. Babakmehr, M.; Dehghanian, F.H.P.; Enslin, J. Artificial intelligence-based cyber-physical events classification for islanding detection in power inverters. IEEE J. Emerg. Sel. Top. Power Electron. 2020, 9, 5282–5293. [Google Scholar]
  10. Reddy, C.R.; Goud, B.S.; Reddy, B.N.; Pratyusha, M.; Kumar, C.V.; Rekha, R. Review of Islanding Detection Parameters in Smart Grids. In Proceedings of the 2020 8th IEEE International Conference on Smart Grid (icSmartGrid), Oshawa, ON, Canada, 17–19 June 2020; pp. 78–89. [Google Scholar]
  11. Wang, X.; Dinavahi, W.F.V.; Xu, W. Investigation of positive feedback anti-islanding control for multiple inverter-based distributed generators. IEEE Trans. Power Syst. 2009, 24, 785–795. [Google Scholar]
  12. Lopes, L.A.; Zhang, Y. Islanding detection assessment of multi-inverter systems with active frequency drifting methods. IEEE Trans. Power Deliv. 2007, 23, 480–486. [Google Scholar]
  13. Zhou, B.; Cao, C.; Li, C.; Cao, Y.; Chen, C.; Li, Y.; Zeng, L. Hybrid islanding detection method based on decision tree and positive feedback for distributed generations. IET Gener. Transm. Distrib. 2018, 9, 1819–1825. [Google Scholar]
  14. Khodaparastan, M.; Vahedi, H.; Khazaeli, F.; Oraee, H. A novel hybrid islanding detection method for inverter-based DGs using SFS and ROCOF. IEEE Trans. Power Deliv. 2015, 32, 2162–2170. [Google Scholar]
  15. Chandak, S.; Mishra, M.; Rout, P.K. Hybrid islanding detection with optimum feature selection and minimum NDZ. Int. Trans. Electr. Energy Syst. 2018, 28, e2602. [Google Scholar]
  16. Faqhruldin, O.N.; El-Saadany, E.F.; Zeineldin, H.H. A universal islanding detection technique for distributed generation using pattern recognition. IEEE Trans. Smart Grid 2014, 5, 1985–1992. [Google Scholar]
  17. Gonzalez-Cabrera, N.; Gutierrez-Alcaraz, G. Nodal user’s demand response based on incentive based programs. J. Mod. Power Syst. Clean Energy 2017, 5, 79–90. [Google Scholar]
  18. Wang, P.; Ding, Y.; Xiao, Y. Technique to evaluate nodal reliability indices and nodal prices of restructured power systems. IEE Proc. Gener. Transm. Distrib. 2005, 152, 390–396. [Google Scholar]
  19. Arefin, A.A.; Hasan, K.N.M.; Romlie, M.F.; Abdullah, M.F.; Ali, M.L.; Othman, M.L. Determining Islanding Operation Using Micro Grid Phasor Measurement Unit Parameters. Int. J. Emerg. Trends Eng. Res. 2020, 8, 97–101. [Google Scholar]
  20. Lidula, N.W.A.; Rajapakse, A.D. A pattern-recognition approach for detecting power islands using transient signals—Part II: Performance evaluation. IEEE Trans. Power Deliv. 2012, 27, 1071–1080. [Google Scholar]
  21. Galvan, F.; Wells, C.H. Detecting and managing the electrical island created in the aftermath of Hurricane Gustav using Phasor Measurement Unit (PMUs). In Proceedings of the IEEE PES T & D, New Orleans, LA, USA, 19–22 April 2010; pp. 1–5. [Google Scholar]
  22. Arefin, A.A.; Baba, M.; Singh, N.S.S.; Nor, N.B.M.; Sheikh, M.A.; Kanan, R.; Abro, G.E.M.; Mathur, N. Review of the Techniques of the Data Analytics and Islanding Detection of Distribution Systems Using Phasor Measurement Unit Data. Electronics 2022, 11, 2967. [Google Scholar]
  23. Ravikumar, K.G.; Upreti, A.; Nagarajan, A. State-of-the-Art Islanding Detection and Decoupling Systems for Utility and Industrial Power Systems. In Proceedings of the 69th Annual Georgia Tech Protective Relaying Conference, Atlanta, GA, USA, 29 April–1 May 2015. [Google Scholar]
  24. Arefin, A.A.; Hasan, K.N.B.M.; Othman, M.L.; Romlie, M.F.; Saad, N.; Nor, N.B.M.; Abdullah, M.F. A Novel Island Detection Threshold Setting Using Phasor Measurement Unit Voltage Angle in a Distribution Network. Energies 2021, 14, 4877. [Google Scholar]
  25. Liu, X.A.; Laverty, D.; Best, R. Islanding detection based on probabilistic PCA with missing values in PMU data. In Proceedings of the IEEE PES General Meeting Conference & Exposition, National Harbor, MD, USA, 27–31 July 2014. [Google Scholar]
  26. Liu, X.; Kennedy, J.M.; Laverty, D.M.; Morrow, D.J.; McLoone, S. Wide-area phase-angle measurements for islanding detection—An adaptive nonlinear approach. IEEE Trans. Power Deliv. 2017, 31, 1901–1911. [Google Scholar]
  27. Kumar, D.; Bhowmik, P.S. Wide area islanding detection using phasor measurement unit. In Proceedings of the IEEE 11th International Conference on Intelligent Systems and Control (ISCO), Coimbatore, India, 5–6 January 2017; pp. 49–54. [Google Scholar]
  28. Chen, H.; Martin, K.; Bhargava, B.; Budhraja, V.; Balance, J. On-line islanding detection application in the ActualTime dynamics monitoring system. In Proceedings of the IEEE PES T & D Conference and Exposition, Chicago, IL, USA, 14–17 April 2014; pp. 1–4. [Google Scholar]
  29. Ebrahim, M.A.; Wadie, F.; Abd-Allah, M.A. An Algorithm for Detection of Fault, Islanding, and Power Swings in DG-Equipped Radial Distribution Networks. IEEE Systtem J. 2019, 14, 3893–3903. [Google Scholar]
  30. Ebrahim, M.A.; Wadie, F.; Abd-Allah, M.A. Integrated fault detection algorithm for transmission, distribution, and microgrid networks. IET Energy Syst. Integr. 2019, 1, 104–113. [Google Scholar]
  31. Lin, Z.; Xia, T.; Ye, Y.; Zhang, Y.; Chen, L.; Liu Wen, F. Application of wide area measurement systems to islanding detection of bulk power systems. IEEE Trans. Power Syst. 2013, 28, 2006–2015. [Google Scholar]
  32. Narayanan, K.; Siddiqui, S.A.; Fozdar, M. Hybrid islanding detection method and priority-based load shedding for distribution networks in the presence of DG units. IET Gener. Transm. Distrib. 2017, 11, 586–595. [Google Scholar]
  33. Admasie, S.; Bukhari, S.B.A.; Haider, R.; Gush, T.; Kim, C.-H. A passive islanding detection scheme using variational mode decomposition based mode singular entropy for integrated microgrids. Elect. Power Syst. Res. 2019, 177, 105983. [Google Scholar]
Figure 1. Proposed flow diagram of the island threshold technique.
Mathematics 11 00886 g001
Figure 2. SLD of a Malaysian distribution system named Utility Kerteh.
Mathematics 11 00886 g002
Figure 3. Islanding Scenario 1 of the test system.
Mathematics 11 00886 g003
Figure 4. Islanding Scenario 2 of the test system.
Mathematics 11 00886 g004
Figure 5. Islanding Scenario 3 of the test system.
Mathematics 11 00886 g005
Figure 6. Islanding Scenario 4 of the test system.
Mathematics 11 00886 g006
Figure 7. Bus frequency of the test system for under frequency (Scenario 1 and Scenario 2).
Mathematics 11 00886 g007
Figure 8. Bus frequency of the test system for under frequency (Scenario 3 and Scenario 4).
Mathematics 11 00886 g008
Figure 9. Proposed unintentional island threshold technique for under frequency Scenario 1.
Mathematics 11 00886 g009
Figure 10. Proposed unintentional island threshold technique for under frequency Scenario 2.
Mathematics 11 00886 g010
Figure 11. Proposed unintentional island threshold technique for under frequency Scenario 3.
Mathematics 11 00886 g011
Figure 12. Proposed unintentional island threshold technique for under frequency Scenario 4.
Mathematics 11 00886 g012
Figure 13. Bus frequency of the test system for over frequency (Scenario 1 and Scenario 2).
Mathematics 11 00886 g013
Figure 14. Bus frequency of the test system for over frequency (Scenario 3 and Scenario 4).
Mathematics 11 00886 g014
Figure 15. Proposed unintentional island threshold technique for over frequency Scenario 1.
Mathematics 11 00886 g015
Figure 16. Proposed unintentional island threshold technique for over frequency Scenario 2.
Mathematics 11 00886 g016
Figure 17. Proposed unintentional island threshold technique for over frequency Scenario 3.
Mathematics 11 00886 g017
Figure 18. Proposed unintentional island threshold technique for over frequency Scenario 4.
Mathematics 11 00886 g018
Table 1. Existing island detection techniques, contributions, and limitations.
Refs.GoalsMeasurement ComponentsContributionsLimitations
[25]To detect the island in a match frequency condition using slip frequency and acceleration.Frequency The proposed algorithm requires 500 ms for the detection after the island inception in the system. It can detect frequency islanding conditions or match frequency islanding conditions.Under frequency and over frequency islanding conditions are absent. Therefore, it is hard to know how this algorithm may respond to these frequent islanding conditions (under and over frequency).
[25,26]To detect the islanding event using probabilistic principal component analysis. Voltage angle Achieves faster detection time without having false triggered and ensures higher reliability by accommodating the missing PMU’s data.During the over frequency detection, the technique failed. Therefore, when the DG capacity is higher than the connected load, this proposed algorithm may collapse and can create a hazardous situation.
[27,28]To detect the islanding event using the voltage angle and current angle.Voltage angleThe number of false triggers is less.The performance of the under frequency was absent. Therefore, there is a high chance that this algorithm may collapse when there is a significant decline in changes in the connected load.
[29,30]To detect the islanding event using power magnitude.Voltage and current magnitudeThe detection time improved without triggering any false alarms.Since this method is based on local detection, over frequency islanding conditions cannot be detected by their proposed scheme.
[31]To detect the island event using voltage and current angle.Voltage and current angle The algorithm can detect the island in a shorter amount of time.Unable to distinguish between different island scenarios during under frequency and over frequency island conditions, which indicates that this proposed algorithm is appropriate for certain islanding scenarios.
[32]To propose a scheme based on phasor and frequency data from a PMU under frequency islanding.Phasor data and frequency The proposed scheme reduces the number of false alarms during the island event.The real-time islanding scenarios of the distribution system are not considered to evaluate the approach. On the other hand, a repeating trigger means false tripping which decreases the performance of the algorithm.
[33]To detect the island during under frequency conditions using slip frequency and acceleration.FrequencyIslanding can be detected by the algorithm even when power exchange is minimal.The detection time scale is not present and the performance in the different island scenarios are absent. However, without a time scale, it is unclear to know the feasibility of the algorithm in a real time since a faster islanding detection algorithm is required in terms of time.
Table 2. Setting of parameters of the test system.
BusParametersValues
DG Bus (GTG-G-1)MW setpoint25.893 MW
Maximum MW output45.20 MW
Power factor0.8980
MVAR output12.054 MVAR
Minimum MVARs12.054 MVAR
Maximum MVARs23.00 MVAR
Generator MVA Base56.50 MVA
Fuel typeNatural gas
Internal sequence impedancePositive: resistance: 0.01, reactance: 0.20
Negative: resistance: 0.01, reactance: 0.20
Zero: resistance: 0.01, reactance: 0.20
Machine modelsGENSAL
Exciters Active-DC2C
Governors Active-GGOV3
KTIH BusLoadUnder frequency: 16MW (Scenario 1~4)
Over frequency: 58 MW (Scenario 1~4)
Table 3. Results of the proposed unintentional island threshold technique.
ConditionsScenariosThreshold Time (ms)Threshold Value (Deg)
Under frequency1600.5348
2400.5248
3600.4363
4400.6622
Over frequency18019.3863
26019.2712
38019.3319
4605.4146
Disclaimer/Publisher’s Note: The statements, opinions and data contained in all publications are solely those of the individual author(s) and contributor(s) and not of MDPI and/or the editor(s). MDPI and/or the editor(s) disclaim responsibility for any injury to people or property resulting from any ideas, methods, instructions or products referred to in the content.

