Abstract
This paper presents a two-dimensional simplified Hodgkin–Huxley model under exposure to electric fields. The Hopf bifurcations of the simplified Hodgkin–Huxley model are investigated through qualitative analysis and numerical simulations. A necessary and sufficient condition for the existence of Hopf bifurcations is derived, and the conditions for supercritical and subcritical Hopf bifurcations are obtained. Finally, bifurcation diagrams are given for two parameters, and numerical examples are presented to illustrate the effectiveness of the theoretical results.
MSC:
37C75; 93D99
1. Introduction
The outstanding work of Hodgkin and Huxley on nerve conduction contains many significant results [1]. The Hodgkin–Huxley (H-H) model can be used to determine the action potential in terms of the membrane current, membrane potential, membrane conductance, and the activation and inactivation of certain ions. So far, fruitful results were obtained related to the H-H model [2,3,4,5,6,7,8,9]. The H-H mathematical model describes how action potentials are initiated and propagated in neurons. This set of nonlinear differential equations approximates the electrical characteristics of excitable cells such as neurons and cardiac myocytes. The probability of action potential phase changes can also be calculated. However, as a set of four coupled, highly nonlinear ordinary differential equations, it is difficult to apply detailed mathematical analysis to the H-H model, so it is necessary to impose certain simplifications.
Based on the H-H model, many scholars have used simplified versions to characterize the electrical activity of neurons. FitzHugh et al. simplified the H-H model of spike generation in squid giant axons to a two-dimensional model, called the FitzHugh–Nagumo model [10,11]. Although the H-H model is realistic and biophysically sound, only projections of its four-dimensional phase trajectories can be observed. The FitzHugh–Nagumo model permits the entire solution to be viewed at once. This allows a geometrical explanation of important biological phenomena related to neuronal excitability and spike-generating mechanisms. Morris and Lecar developed a two-dimensional system to reproduce a variety of oscillatory behavior in relation to and conductance in the muscle fiber of giant barnacles [12]. The Morris–Lecar model describes the complex relationship between membrane potential and the activation of ion channels within the membrane, showing that the potential depends on the activity of the ion channels, and the activity of the ion channels depends on the voltage. Chay considered three main ion channels across the cell membrane, and identified three variables that describe electrical activity in a nerve model [13]. The Chay model shows that the plasma membrane currents are associated with burst and spike oscillations. Hindmarsh and Rose proposed a phenomenological neuron model as a simplified H-H model. This is capable of mimicking almost all behaviors exhibited by real biological neurons, such as spiking, bursting, and irregular behaviors [14]. Using an algebraic relationship, Moehlis constructed a simplified H-H model as a set of two coupled ordinary differential equations. This allowed the so-called canards (rapid transitions from a small-amplitude limit cycle to a large-amplitude relaxation cycle) that exist in the simplified and original H-H model to be identified [15].
Many simplified H-H models can be divided into two categories. One category includes two or three polynomial differential systems. These simplified H-H models are good at reflecting the dynamic properties of a system, but lose the original H-H structure and biological significance of the neuron model [10,11,14]. The second category of simplified H-H models retains the biological significance of the H-H neuron model, but are still very complicated, making it hard to study their dynamic properties [12,13,15]. A bifurcation is a qualitative change in the dynamical behavior of a nonlinear system as its parameters pass through some critical values [16]. The study of bifurcations in neural models is key to understanding the dynamical origin of many single-neuron and circuit phenomena involved in neural information processing and the organization of behavior [17]. There are many results on the bifurcation analysis of the original H-H model [18,19,20,21,22,23].
The interaction between electric fields and biological tissues has long been of interest. This is primarily because the electric fields can alter neuronal excitability in normal physiological conditions, changing the neuronal ensemble activity of epileptiform behavior [24,25,26,27,28,29,30]. Electric field stimulation has become a powerful form of physiotherapy, so it is important to study the H-H model under exposure to external electric fields. Given the importance of the H-H model, a detailed bifurcation analysis has been applied in the case of external electric fields. Wang and Che studied the Hopf bifurcation of a two-parameter H-H model exposed to external electric fields [31,32,33], but did not give the conditions of supercritical and subcritical bifurcation.
The theory of Hopf bifurcation control may have potential applications in the diagnosis and therapy of dynamical diseases in the H-H model [34,35,36]. The analysis of Hopf bifurcation is significant for the H-H model. An interesting situation that the inhibitory autapse with time delay can induce the resting state change to stable spiking pattern is identified near the subcritical Hopf bifurcation of the Hodgkin–Huxley model in [37]. The generation of double coherence resonances due to white noise is discussed in a three-dimensional reduced H-H model with multiple-timescale feature. In addition, the additive white noise can induce double coherence resonances from the resting state near a subcritical Hopf bifurcation in [38]. Using “the Edge of Chaos” calculation technique, a saddle-node subcritical Hopf bifurcation is a solution of Galvani’s allor-none enigma presented in [5]. So, the conditions for supercritical and subcritical Hopf bifurcations are important and meaningful for the H-H model. As we all know, there are few results about the conditions of supercritical and subcritical Hopf bifurcations for the H-H model. In addition, most existing relevant results about the conditions of supercritical and subcritical Hopf bifurcations are given based on the numerical method, not the analytic method. It is really challenging and important to make a theoretical analysis for the conditions of supercritical and subcritical Hopf bifurcations on the H-H model. Based on the above discussion, this paper presents a simplified H-H model that retains the essential original structure and the biological significance of the neuron model, and reproduces good dynamical properties. The simplified H-H model provides a good approximation of the original H-H model, producing broadly consistent dynamical behaviors. We discuss the Hopf bifurcation in the simplified H-H model under exposure to external electric fields. In addition, we derive a necessary and sufficient condition for the existence of Hopf bifurcations, as well as the conditions for supercritical and subcritical Hopf bifurcations. Bifurcation diagrams are obtained for two parameters, and numerical examples are presented to illustrate the effectiveness of the theoretical results. Our results will be of great assistance in the further investigations of Hopf bifurcations that may occur in the original H-H model.
The remainder of this paper considers the Hopf bifurcations created by two parameters in a simplified H-H model. In Section 2, the simplified two-parameter H-H model is introduced. Section 3 derives the necessary and sufficient condition for the existence of Hopf bifurcations in this model. The conditions for supercritical and subcritical Hopf bifurcations are then obtained. The bifurcation diagrams for the two parameters are presented in Section 4, and numerical examples are conducted to illustrate the effectiveness of the theoretical results. Finally, the conclusions to this study are summarized in Section 5.
2. Simplified H-H Model
In this section, the original H-H model exposed to an external electric field is introduced. The H-H model comprises four coupled nonlinear differential equations, which are difficult to examine by detailed mathematical analysis. So, the original H-H model is simplified as a set of two coupled ordinary differential equations.
2.1. Modified H-H Model Exposed to External Electric Field
The original H-H model [1,3] comprises four coupled nonlinear differential equations describing the temporal evolution of the membrane voltage V under an externally injected current I in a spatially localized axonal compartment. At the cellular level, an exposure of a cell to an external electric field may result in that the induced membrane potential is superimposed on the ionic membrane potential V. Then, the overall membrane potential becomes . The original H-H model exposed to external electric field is described as follows:
where is the trans-membrane voltage in muscle cells, m, h, are the sodium activation, the sodium inactivation, and the potassium activation variables, respectively, and is the time variable. is the membrane capacitance; , and are the maximal conductance of the corresponding ionic currents. In addition, , , and are the equilibrium potentials of sodium, potassium, and leak current, respectively. are functions of V and satisfy the following conditions:
The circuit description of the original H-H model (1) is shown in Figure 1. More information on mathematical issues associated with the original H-H model (1) is given in [3].
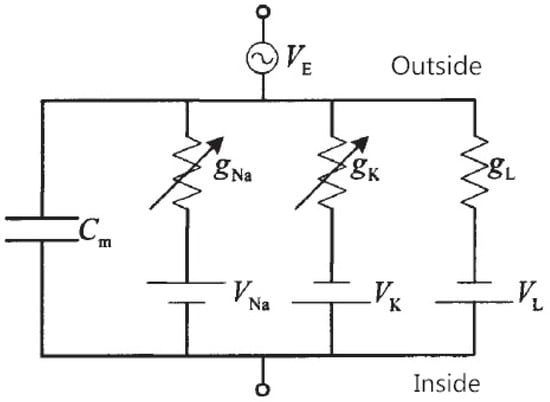
Figure 1.
Circuit description of the H-H model.
2.2. Reduction of the H-H Model
In this paper, we reduce the original H-H model (1) to a set of two coupled ordinary differential equations. Note that Equation (2) for the gating variables m, h, and n can be written in the form:
where
with . The time constant is much smaller than and over the entire relevant range of V. Thus, m evolves faster than n and h. This implies that we could replace in Equation (1) by . Next, when the solution of Equation (1) corresponds to a periodic action potential, the following equation approximately holds [15]:
According to [15], we choose the gating variable h by taking . Considering a linear form for and , Equation (1) can be simplified to
where , , , , and
Remark 1.
The reason for the replacement of by is explained in [3]. The gating variable h by taking is chosen in the simplified H-H model (4), and the rationality of this relationship is given in [15]. Note that the different linear forms of and lead to the different dynamical behaviors of model (4). The detailed affects of the linear forms of and are discussed in [39]. Moreover, the linear forms of and (, , and ) are chosen, and the simplified model (4) approximates the original H-H model (1) reasonably well. Specifically, the dynamical behaviors of the simplified model (4) are consistent with that of the original H-H model (1) [39,40]. Obviously, model (4) is a reasonable and effective simplification for the original H-H model (1).
3. Hopf Bifurcation Analysis
The Hopf bifurcation analysis of the simplified H-H model (4) is discussed in this section. A necessary and sufficient condition for the existence of Hopf bifurcations about the parameters is derived in Theorem 1. In addition, the conditions for supercritical and subcritical Hopf bifurcations of the simplified H-H model (4) are obtained in Theorem 2.
Theorem 1.
Model (4) has Hopf bifurcation points if and only if the equilibrium point and parameters satisfy the quadratic inequality
and the quadratic equation
where
- , , ,
- , ,
- , , , ,
- , , , ,
- , ,
Proof.
Details of the proof can be found in [39,40], therefore the proof is omitted here. □
According to Theorem 1, model (4) has a Hopf bifurcation if and only if and parameters satisfy the following conditions:
Thus, we can use a cubic polynomial of V to discuss the bifurcations in the simplified H-H model.
Remark 2.
According to Theorem 1, we use a cubic polynomial of V to discuss the bifurcations in the simplified H-H model (4). Note that the FitzHugh–Nagumo model [10,11] also uses a cubic polynomial of V to reduce the H-H model. However, the proposed model (4) retains the essential original structure and the biological significance of the H-H model, and reproduces good dynamical properties.
According to the method in [41,42], we give conditions for the supercritical and subcritical Hopf bifurcations of model (4) as follows.
Theorem 2.
Model (4) has a Hopf bifurcation when ω() passes through , and
- (1)
- if , the direction of the bifurcation is supercritical (subcritical),
- (2)
- if , the bifurcating periodic solutions are orbitally stable (unstable),
- (3)
- if , the periods of the bifurcating periodic solutions increase (decrease).
Proof.
Model (4) has the an equilibrium point at , under the bifurcation parameters . Based on the following linear transformation of ,
Model (4) becomes
The second equation of model (6) can then be expressed as
where .
The function in the first equation of model (6) can be described as
Then, can be written in the following form
where . When , has infinite-order continuous partial derivatives. The Taylor expansion of at point is
With , and , we obtain
where
Let , we can derive
where
Presuming that
Equation (6) can be simplified as
where , , .
When , , the solutions of Equation (15) are .
The characteristic value is , . From Equation (15), we obtain
Therefore,
where . From Equation (17), we have that , . Therefore, model (6) has a Hopf bifurcation.
The eigenvector of is
Define
and
= T.
Then, we have
= from which we obtain
where
and , , , .
From Equation (19), we can derive
Taking , , then (19) can become
Setting , we obtain
Thus, we can compute the following quantities:
Remark 3.
It is a challenging and meaningful problem to obtain the conditions for the supercritical and subcritical Hopf bifurcations of the original H-H model (1) as a set of four coupled, highly nonlinear ordinary differential equations. The dynamical behaviors of the simplified H-H model (4) are consistent with that of the original H-H model (1). In addition, Theorem 2 presents conditions for the supercritical and subcritical Hopf bifurcations of model (4). Thus, we can gain a better insight into the direction of Hopf bifurcations in the original H-H model (1) by Theorem 2.
Remark 4.
Generally, the biological significance of the coefficients , , , , , , and need to be considered in the numerical value choices. If we choose different values for these coefficients, the equilibrium points of model (4) may change, and the Hopf bifurcations about the bifurcation parameters may also alter. As long as the coefficients and bifurcation parameters satisfy the conditions of Theorems 1 and 2, we can get the corresponding conclusions on Hopf bifurcation. Theorems 1 and 2 are general results for the Hopf bifurcations of model (4) with the parameters .
4. Numerical Analysis and Discussion
In this section, some numerical results for the conditions of supercritical and subcritical Hopf bifurcations of model (4) are given to illustrate the above theoretical results.
According to [3,15,33,39,40], we choose the coefficients F/cm, ms/cm, ms/cm, ms/cm, mV, mV, mV, , , and . Submitting these coefficients into model (4), we can obtain a more specific model as follows:
where
The solutions of model (28) are solved by the fourth-order Runge–Kutta algorithm. In addition, the bifurcation diagrams for the parameters I and are given by MATCONT which is a MATLAB continuation package for research of parameterized ODE systems [43]. Then, the dynamical behaviors of model (28) are analyzed with respect to the parameters I and .
4.1. Numerical Analysis
The eigenvalues of the Jacobian of model (28), quadratic inequality, and T can be computed from the root of the equilibrium point equation which is obtained with particular values of the background stimulus I and . All the values are listed in Table 1. In addition, the last column in Table 1 describes the stability of the fixed points with S (denoting stable) and U (denoting unstable).

Table 1.
Eigenvalues of the Jacobian, quadratic inequality, and T.
Examining Table 1, model (28) has a Hopf bifurcation as the parameter I () increases through . The equilibrium point is . We compute , , , , , , , , , , , , , , , , , , , , , , , . In light of Theorem 2, the fact that implies that the Hopf bifurcation is subcritical. This means that the equilibrium point of model (28) is stable when , and the equilibrium loses its stability. A Hopf bifurcation occurs when I increases past .
For , the equilibrium point of model (28) is stable as shown in Figure 2a,b. When , there is a center in model (28) as shown in Figure 2c,d. For , the equilibrium points of model (28) are unstable, and the phase trajectory converges to the stable limit cycle, as shown in Figure 2d,e. Overall, Figure 2 shows that the stable equilibrium solutions of model (28) come from the unstable equilibrium solutions and the stable limit cycles after a Hopf bifurcation about the parameter I. According to [44], the direction of the Hopf bifurcation is subcritical near .
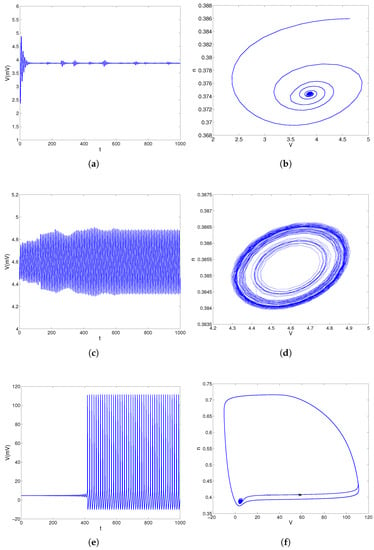
Figure 2.
The convergent behaviors of model (28) about parameter I. (a) Response curve of trans-membrane voltage V for . (b) Trajectories in phase plane for . (c) Response curve of trans-membrane voltage V for . (d) Trajectories in phase plane for . (e) Response curve of trans-membrane voltage V for . (f) Trajectories in phase plane for .
Similarly, examining Table 1, model (28) has a Hopf bifurcation as the parameter () increases through . We obtain the equilibrium point , and compute , , , , , , , , , , , , , , , , . We have , , . Because , the Hopf bifurcation is supercritical, which means that the equilibrium point of model (28) is stable when and loses its stability through a Hopf bifurcation as decreases past .
For , the phase plane trajectories are shown in Figure 3a,b. From Figure 3a,b, the equilibrium point is unstable, and the limit cycle is stable. When , model (28) has a center as shown in Figure 3c,d. When , the equilibrium point of model (28) is stable, as shown in Figure 3e,f. Overall, Figure 3 shows that the unstable equilibrium solution and stable limit cycles of the model (28) come from the stable equilibrium following a Hopf bifurcation near . According to [44], the direction of this Hopf bifurcation is supercritical near .
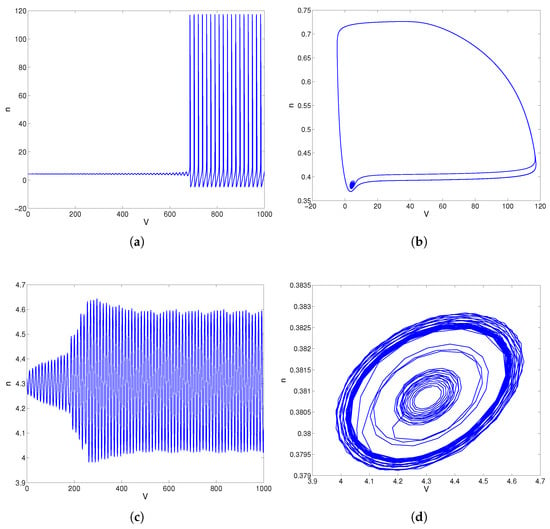
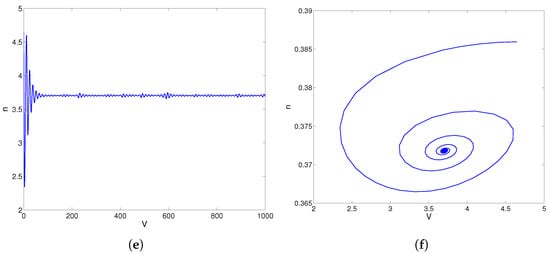
Figure 3.
The convergent behaviors of model (28) about parameter . (a) Response curve of trans-membrane voltage V for . (b) Trajectories in phase plane for . (c) Response curve of trans-membrane voltage V for . (d) Trajectories in phase plane for . (e) Response curve of trans-membrane voltage V for . (f) Trajectories in phase plane for .
4.2. Discussion
In this subsection, we mainly discuss the bifurcation diagram for the parameters I and , respectively. Moreover, we analyze the dynamical behaviors of model (28) about the parameters I and . Especially, we focus on the Hopf bifurcation.
The bifurcation diagram for the parameter I is shown in Figure 4. The , curves and equilibrium points of model (28) are shown in Figure 4a. A locally enlarged view of Figure 4a is shown in Figure 4b. The three points in Figure 4a are explained now. Point is a canard point (for details of the canards in model (28), see [39,40]). Points and are Hopf bifurcation points. As these two points exhibit similar behavior, we only consider the point B. In Figure 4b, there are stable equilibrium points, unstable limit cycles, and stable limit cycles between points A and B.
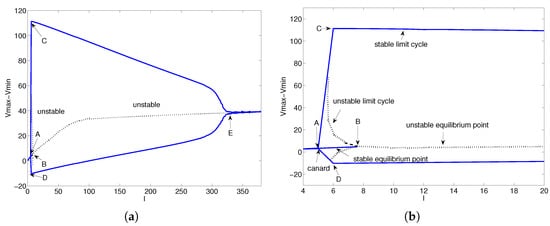
Figure 4.
Bifurcation diagram for parameter I. (a) The I–Vmax, I–Vmin curves and equilibrium points of model (28). (b) A locally enlarged view of (a) near Hopf point B.
To facilitate analysis of the Hopf bifurcation at point B, we take and . When , the equilibrium points of model (28) are stable. When , the equilibrium points of model (28) are stable, and the limit cycles near the equilibrium points are unstable. However, model (28) has stable limit cycles that are totally different from the limit cycles near the equilibrium points. The reason is that model (28) has canard points. When , model (28) has unstable equilibrium points and stable limit cycles. The stable equilibrium points become unstable equilibrium points, and the unstable limit vanishes when model (28) passes a Hopf bifurcation near . This dynamic behavior is totally consistent with the original H-H model.
Take , , and , respectively, then they lie in . Choose the initial condition near the equilibrium points, the solutions of model (28) have converged to the equilibrium points that are shown in Figure 5a. When we choose the initial condition near the stable limit cycles, the solutions of model (28) have converged to the equilibrium points. The stable equilibrium points and stable limit cycles are shown in Figure 5b. Because the dynamic behaviors of model (28) about the parameters , , and are uniform, we choose to show the unstable limit cycles in model (28). The stable equilibrium points, unstable limit cycles and stable limit cycles are shown in Figure 5c for . A locally enlarged view of Figure 5c is shown in Figure 5d. According to Figure 5c,d, the stable equilibrium points, unstable limit cycles, and stable limit cycles coexist in model (28). So, the model (28) has stable equilibrium points, unstable limit cycles, and stable limit cycles for .
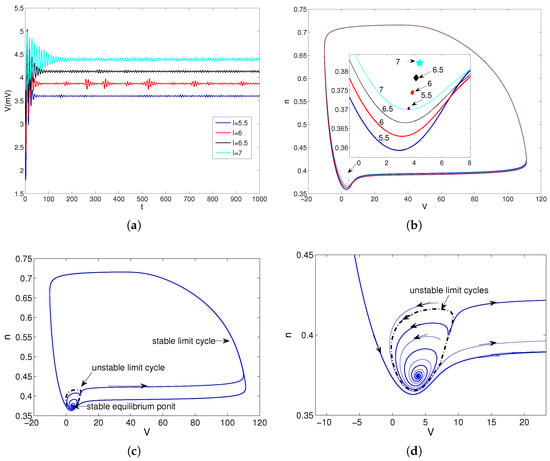
Figure 5.
The convergent behaviors of model (28) about parameter I. (a) Response curve of trans-membrane voltage V for , , and . (b) Trajectories in phase plane for , , and . (c) Trajectories in phase plane for . (d) A locally enlarged view of (c) for .
Similarly, the bifurcation diagram for parameter is shown in Figure 6. The , curves, and equilibrium points of model (28) are shown in Figure 6a. A locally enlarged view of Figure 6a is shown in Figure 6b. The point in Figure 6a is a canard point. Points and are Hopf bifurcation points. Again, we only consider the point B here. In Figure 6b, there are stable equilibrium points, unstable limit cycles, and stable limit cycles in the region between points A and B.
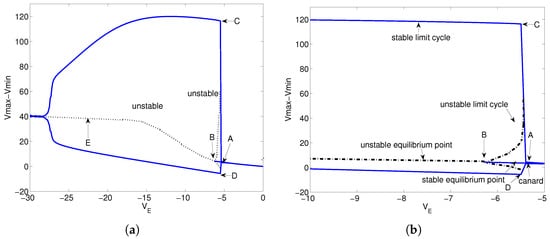
Figure 6.
Bifurcation diagram for parameter . (a) The –Vmax, –Vmin curves and equilibrium points of model (28). (b) A locally enlarged view of (a) near Hopf point B.
Consider and , respectively. When , the equilibrium points of model (28) are stable. When , the equilibrium points of model (28) are stable, and the limit cycles near the equilibrium points are unstable. However, model (28) has stable limit cycles that are totally different from the limit cycles near the equilibrium points. The reason is that model (28) has canard points. When , model (28) has unstable equilibrium points and stable limit cycles. The stable equilibrium points become unstable equilibrium points, and the unstable limit vanish when model (28) passes a Hopf bifurcation near . The dynamic behaviors of model (28) about the parameters I and are summarized in Table 2.

Table 2.
The dynamic behaviors of model (28) about the parameters I and .
5. Conclusions
This paper has examined the Hopf bifurcation of a two-dimensional simplified H-H model with two parameters. Based on theoretical analysis and numerical simulations, a sufficient and necessary condition for the existence of Hopf bifurcations was derived. The Hopf bifurcations of the two-dimensional simplified H-H model were discussed using normal form theory. The direction of the Hopf bifurcations and the stability of bifurcating periodic solutions were also analyzed. It is significant and meaningful to obtain the conditions for supercritical and subcritical Hopf bifurcations of the original H-H model as a set of four coupled and highly nonlinear ordinary differential equations. The dynamical behavior of the considered two-dimensional simplified H-H model is consistent with that of the original H-H model, so the direction of the Hopf bifurcations in the original H-H model is better interpreted by the obtained results. In future, the conditions of supercritical and subcritical Hopf bifurcations in the H-H model with multiple parameters will be discussed, and codimension-two bifurcations in the H-H model will be investigated.
Author Contributions
Conceptualization, methodology, software, H.W.; writing original draft preparation, validation, S.W.; writing review and editing, Y.G.; methodology, supervision, Y.Y. All authors have read and agreed to the published version of the manuscript.
Funding
This work was funded by the National Natural Science Foundation of China under Grant Nos. 61903386 and 62173027, Beijing Municipal Natural Science Foundation under Grant No. Z180005, the Research Fund of Beijing Information Science & Technology University under Grant No. 2021XJJ64, and Qin Xin Talents Cultivation Program, Beijing Information Science & Technology University under Grant No. QXTCP C202119. The Fund of Beijing Wuzi University under Grant No. 2019XJQN06, and the Disciplinary Foundation of Central University of Finance and Economics.
Institutional Review Board Statement
Not applicable.
Informed Consent Statement
Not applicable.
Data Availability Statement
Not applicable.
Acknowledgments
The authors would like to thank the respected reviewers for their kind comments and the editorial office for their advice. The authors also thank Stuart Jenkinson, for editing the English text of a draft of this paper.
Conflicts of Interest
The authors declare no conflict of interest.
References
- Hodgkin, A.L.; Huxley, A.F. A quantitative description of membrane and its application to conduction and excitation in nerve. J. Physiol. 1952, 117, 500–544. [Google Scholar] [CrossRef] [PubMed]
- Izhikevich, E.M. Which model to use for cortical spiking neurons? IEEE Trans. Neural Netw. 2004, 15, 1063–1070. [Google Scholar] [CrossRef] [PubMed]
- Izhikevich, E.M. Dynamical Systems in Neuroscience: The Geometry of Excitability and Bursting; The MIT Press: Cambridge, MA, USA, 2010. [Google Scholar]
- Liu, Y.; Iu, H.H.C.; Qian, Y.H. Implementation of Hodgkin-Huxley neuron model with the novel memristive oscillator. IEEE Trans. Circuits Syst. II Express Briefs 2021, 68, 2982–2986. [Google Scholar] [CrossRef]
- Chua, L. Hodgkin-Huxley equations implies edge of chaos kernel. Jpn. J. Appl. Phys. 2022, 61, SM0805. [Google Scholar] [CrossRef]
- Valle, J.; Madureira, A.L. Parameter identification problem in the Hodgkin-Huxley model. Neural Comput. 2022, 34, 939–970. [Google Scholar] [CrossRef]
- Baysal, V.; Yilmaz, E. Chaotic signal induced delay decay in Hodgkin-Huxley neuron. Appl. Math. Comput. 2021, 411, 126540. [Google Scholar] [CrossRef]
- Haghiri, S.; Naderi, A.; Ghanbari, B.; Ahmadi, A. High speed and low digital resources implementation of Hodgkin-Huxley neuronal model using base-2 functions. IEEE Trans. Circuits Syst. I Regul. Pap. 2021, 68, 275–287. [Google Scholar] [CrossRef]
- Chen, Z.D.; Raman, B.; Stern, A. Structure-preserving numerical integrators for Hodgkin-Huxley-Type systems. SIAM J. Sci. Comput. 2020, 42, 273–298. [Google Scholar] [CrossRef]
- FitzHugh, R. Impulses and physiological states in theoretical models of nerve membrane. J. Biophys. 1961, 1, 445–466. [Google Scholar] [CrossRef]
- Nagumo, J.; Arimoto, S.; Yoshizawa, S. An active pulse transmission line simulating nerve axon. Proc. IRE 1962, 50, 2061–2070. [Google Scholar] [CrossRef]
- Morris, C.; Lecar, H. Voltage Oscillations in the barnacle giant muscle fiber. J. Biophys. 1981, 35, 193–213. [Google Scholar] [CrossRef]
- Chay, T.R. Electrical bursting and luminal calcium oscillation in excitable cell models. Biol. Cybern. 1996, 75, 419–431. [Google Scholar] [CrossRef]
- Hindmarsh, J.L.; Rose, R.M. A model of neuronal bursting using three coupled first order differential equations. Proc. R. Soc. Lond. Ser. B 1984, 221, 87–102. [Google Scholar]
- Moehlis, J. Canards for a reduction of the Hodgkin-Huxley equations. J. Math. Biol. 2006, 52, 141–153. [Google Scholar] [CrossRef]
- Guckenheimer, J.; Holmes, P. Nonlinear Oscillations, Dynamical Systems, and Bifurcation of Vector Fields; Springer: Berlin/Heidelberg, Germany, 1983. [Google Scholar]
- Rabinovich, M.I.; Varona, P.; Selverston, A.I.; Abarbanel, H.D.I. Dynamical principles in neuroscience. Rev. Mod. Phys. 2006, 78, 1213–1265. [Google Scholar] [CrossRef]
- Fukai, H.; Doi, S.; Nomura, T.; Sato, S. Hopf bifurcations in multiple parameter space of the Hodgkin-Huxley equations. I. Global organization of bistable periodic solutions. Biol. Cybern. 2000, 82, 215–222. [Google Scholar] [CrossRef]
- Fukai, H.; Doi, S.; Nomura, T.; Sato, S. Hopf bifurcations in multiple parameter space of the Hodgkin-Huxley equations. II. Singularity theoretic approach and highly degenerate bifurcations. Biol. Cybern. 2000, 82, 223–229. [Google Scholar] [CrossRef]
- Guckenheimer, J.; Oliva, A. Chaos in the Hodgkin-Huxley model. SIAM J. Appl. Dyn. Syst. 2002, 1, 105–114. [Google Scholar] [CrossRef]
- Drover, J.; Rubin, J.; Su, J.; Ermentrout, B. Analysis of a canard mechanism by which excitatory synaptic coupling can synchronize neurons at low firing frequencies. SIAM J. Appl. Math. 2005, 65, 69–92. [Google Scholar] [CrossRef]
- Calitoiu, D.; Oommen, B.J.; Nussbaum, D. Spikes annihilation in the Hodgkin-Huxley neuron. Biol. Cybern. 2008, 98, 239–257. [Google Scholar] [CrossRef]
- Kang, Y.M.; Chen, Y.Q.; Fu, Y.X.; Wang, Z.L.; Chen, G.R. Formation of spiral wave in Hodgkin-Huxley neuron networks with Gamma-distributed synaptic input. Commun. Nonlinear Sci. Numer. Simul. 2020, 83, 105112. [Google Scholar] [CrossRef]
- Erhardt, A.H. Bifurcation analysis of a certain Hodgkin-Huxley model depending on multiple bifurcation parameters. Mathematics 2018, 6, 103. [Google Scholar] [CrossRef]
- Li, S.L.; Lv, W.P.; Chen, Z.Y.; Xue, M.; Bi, Q.S. Slow-fast dynamics behaviors under the comprehensive effect of rest spike bistability and timescale difference in a Filippov slow-fast modified Chua’s circuit Model. Mathematics 2022, 10, 4606. [Google Scholar] [CrossRef]
- Berzhanskaya, J.; Gorchetchnikov, A.; Schiff, S.J. Switching between gamma and theta: Dynamic network control using subthreshold electric fields. Neurocomputing 2007, 70, 2091–2095. [Google Scholar] [CrossRef]
- Park, E.H.; So, P.; Barreto, E.; Gluckman, B.J.; Schiff, S.J. Electric field modulation of synchronization in neuronal networks. Neurocomputing 2002, 52–54, 169–175. [Google Scholar] [CrossRef]
- Bikson, M.; Inoue, M.; Akiyama, H.; Deans, J.K.; Fox, J.E.; Miyakawa, H.; Jefferys, G.R. Effects of uniform extracellular DC electric fields on excitability in rat hippocampal slices in vitro. J. Physiol. 2004, 557, 175–190. [Google Scholar] [CrossRef] [PubMed]
- Bujan, A.F.; Aertsen, A.; Kumar, A. Role of input correlations in shaping the variability and noise correlations of evoked activity in the neocortex. J. Neurosci. 2015, 35, 8611–8625. [Google Scholar] [CrossRef] [PubMed]
- Yu, H.; Guo, X.; Wang, J. Stochastic resonance enhancement of small-world neural networks by hybrid synapses and time delay. Commun. Nonlinear Sci. Numer. Simul. 2017, 42, 532–544. [Google Scholar] [CrossRef]
- Wang, J.; Chen, L.Q.; Fei, X.Y. Bifurcation control of the Hodgkin-Huxley equations. Chaos Solitons Fractals 2007, 33, 217–224. [Google Scholar] [CrossRef]
- Che, Y.Q.; Wang, J.; Si, W.J.; Fei, X.Y. Phase-locking and chaos in a silent Hodgkin-Huxley neuron exposed to sinusoidal electric field. Chaos Solitons Fractals 2009, 39, 454–462. [Google Scholar] [CrossRef]
- Che, Y.Q.; Wang, J.; Deng, B.; Wei, X.L.; Han, C.X. Bifurcations in the Hodgkin-Huxley model exposed to DC electric fields. Neurocomputing 2012, 81, 41–48. [Google Scholar] [CrossRef]
- Xie, Y.; Chen, L.; Kang, Y.M.; Aihara, K. Controlling the onset of Hopf bifurcation in the Hodgkin-Huxley model. Phys. Rev. E 2008, 77, 061921. [Google Scholar] [CrossRef] [PubMed]
- Ding, L.; Hou, C. Stabilizing control of Hopf bifurcation in the Hodgkin-Huxley model via washout filter with linear control term. Nonlinear Dynam. 2010, 60, 131–139. [Google Scholar] [CrossRef]
- Doruk, R. Control of Hopf bifurcations in Hodgkin-Huxley neurons by automatic temperature manipulation. Neuroquantology 2018, 16, 59–74. [Google Scholar] [CrossRef]
- Zhao, Z.; Li, L.; Gu, H.; Gao, Y. Different dynamics of repetitive neural spiking induced by inhibitory and excitatory autapses near subcritical Hopf bifurcation. Nonlinear Dyn. 2020, 99, 1129–1154. [Google Scholar] [CrossRef]
- Li, L.; Zhao, Z. White-noise-induced double coherence resonances in reduced Hodgkin-Huxley neuron model near subcritical Hopf bifurcation. Phys. Rev. E 2022, 105, 034408. [Google Scholar] [CrossRef] [PubMed]
- Wang, H.; Yu, Y.G.; Wang, S.; Yu, J.Z. Bifurcation analysis of a two-dimensional simplified Hodgkin-Huxley model exposed to external electric fields. Neural Comput. Appl. 2014, 24, 37–44. [Google Scholar] [CrossRef]
- Wang, H.; Yu, Y.G.; Zhao, R.; Wang, S. Two-parameter bifurcation in a two-dimensional simplified Hodgkin-Huxley model. Commun. Nonlinear Sci. Numer. Simul. 2013, 18, 184–193. [Google Scholar] [CrossRef]
- Hassard, B.D.; Kazarinoff, N.D.; Wan, Y.H. Theory and Applications of Hopf Biufrcation; Cambridge University Press: Cambridge, UK, 1981. [Google Scholar]
- Yu, Y.G.; Zhang, S.C. Hopf bifurcation in the Lü system. Chaos Solitons Fractals 2003, 17, 901–906. [Google Scholar] [CrossRef]
- Dhooge, A.; Govaerts, W.; Kuznetsov, Y.A. MATCONT: A Matlab package for numerical bifurcation analysis of ODEs. ACM Trans. Math. Softw. 2003, 29, 141–164. [Google Scholar] [CrossRef]
- Kuznetsov, Y.A. Elements of Applied Bifurcation Theory, 3rd ed.; Springer: New York, NY, USA, 2004. [Google Scholar]
Disclaimer/Publisher’s Note: The statements, opinions and data contained in all publications are solely those of the individual author(s) and contributor(s) and not of MDPI and/or the editor(s). MDPI and/or the editor(s) disclaim responsibility for any injury to people or property resulting from any ideas, methods, instructions or products referred to in the content. |
© 2023 by the authors. Licensee MDPI, Basel, Switzerland. This article is an open access article distributed under the terms and conditions of the Creative Commons Attribution (CC BY) license (https://creativecommons.org/licenses/by/4.0/).