Are State-Owned Enterprises Really Ineffective? An Empirical Study Based on Stochastic Frontier Analysis
Abstract
1. Introduction
2. Literature Review
2.1. The Theory of SOE Inefficiency
2.2. The Theory of SOE Efficiency
3. Measurements and Decomposition
3.1. Stochastic Frontier Production Model
3.2. Decomposition of TFP Growth Rate
- (1)
- TEC: ;
- (2)
- TC:
- (3)
- SC: ;
- (4)
- AE: .
4. Estimation and Decomposition of TFP of Chinese Listed Companies
4.1. Model Specifications
4.2. Variables and Data
4.3. Industry Classification Method
4.4. Total Estimate Results of SFA
5. Comparison of TE and TFP Decompositions of Listed Enterprises
5.1. Comparison of TE
5.1.1. Comparison of TE by Industry
5.1.2. Comparison of TE by Region
5.2. Decomposition and Comparison of TFP
5.2.1. Comparison of TFP Decompositions
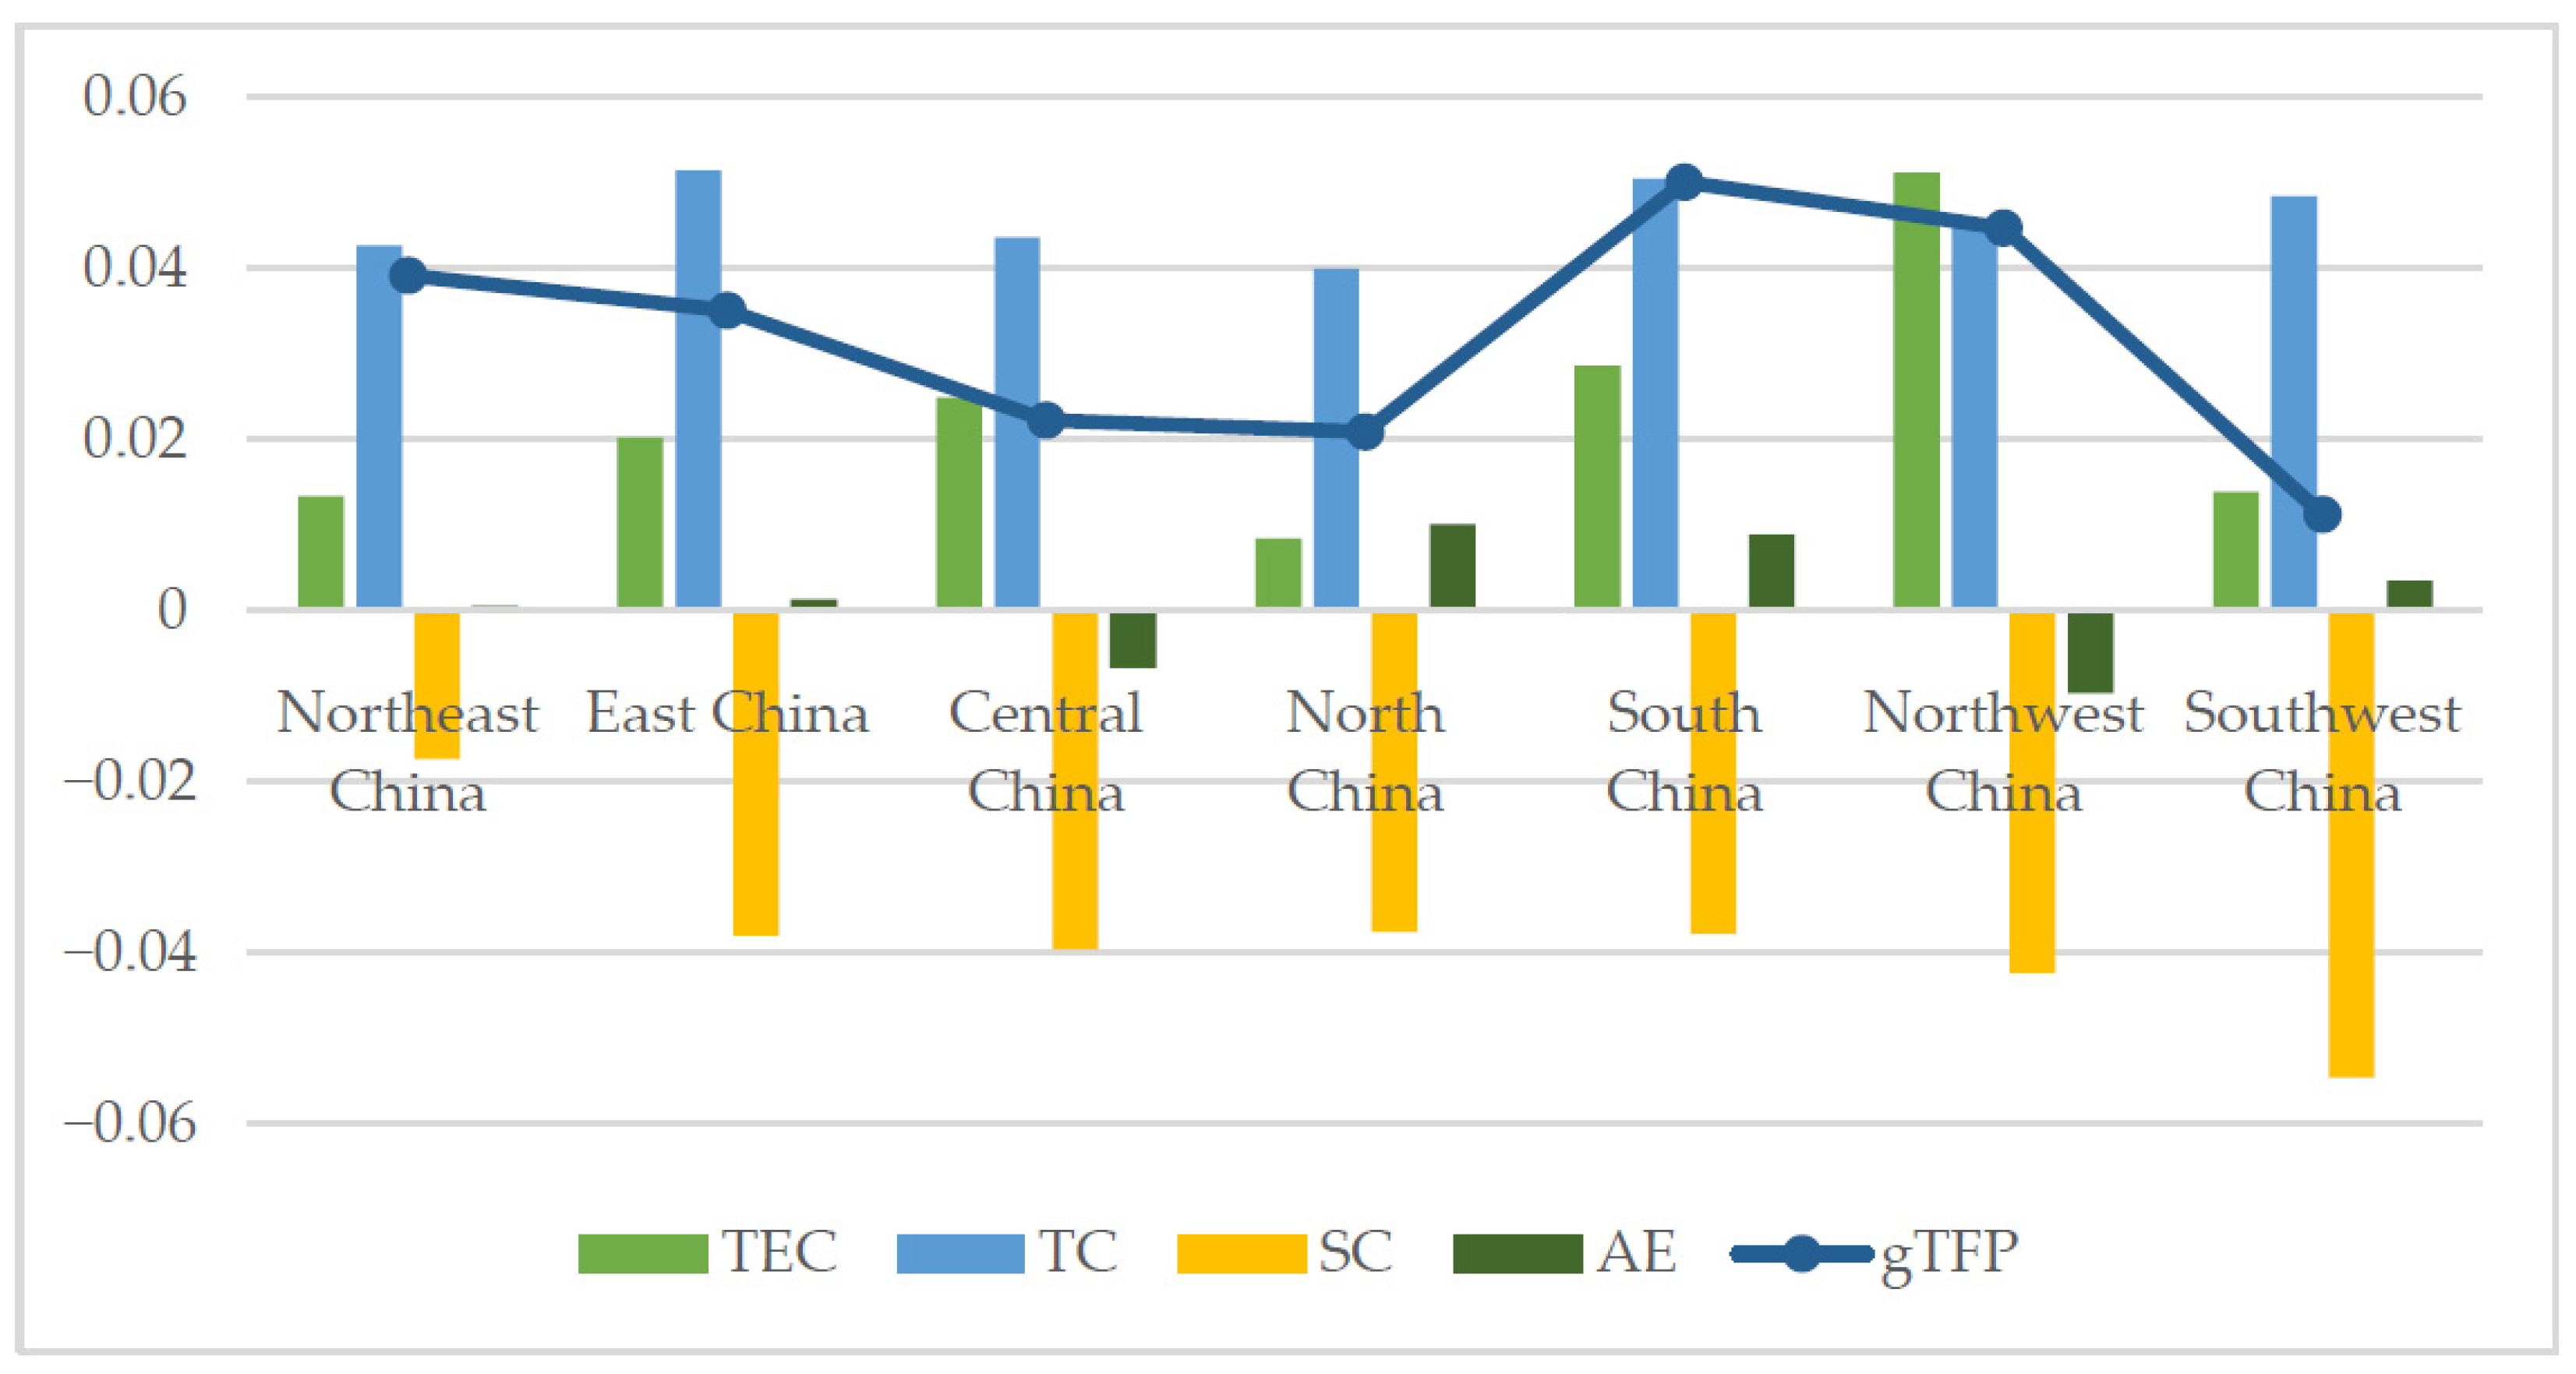
5.2.2. Decomposition and Comparison
6. Conclusions
Author Contributions
Funding
Data Availability Statement
Conflicts of Interest
Appendix A
| t | lny | lnk | lnl | t2 | lnk2 | lnl2 | lnklnl | tlnk | tlnl | |
|---|---|---|---|---|---|---|---|---|---|---|
| Mean | 8.529 | 10.850 | 11.570 | 8.221 | 89.000 | 136.800 | 69.210 | 96.610 | 100.100 | 71.310 |
| Median | 9.000 | 10.770 | 11.447 | 8.248 | 81.000 | 131.034 | 68.032 | 94.005 | 96.966 | 69.646 |
| Minimum | 2.000 | 4.460 | 4.696 | 2.708 | 4.000 | 22.050 | 7.334 | 21.280 | 11.720 | 5.416 |
| Maximum | 15.000 | 17.340 | 17.960 | 13.020 | 225.000 | 322.700 | 169.500 | 233.500 | 265.600 | 192.900 |
| Std. dev. | 4.033 | 1.431 | 1.696 | 1.274 | 70.150 | 40.150 | 20.950 | 26.790 | 52.030 | 37.240 |
| Skewness | −0.008 | 0.393 | 0.201 | −0.117 | 0.520 | 0.823 | 0.555 | 0.731 | 0.249 | 0.227 |
| Kurtosis | 1.787 | 3.923 | 3.995 | 3.987 | 2.000 | 4.600 | 4.254 | 4.796 | 2.101 | 2.090 |
| Jarque–Bera test | 416.8 *** | 416.4 *** | 326.3 *** | 291.6 *** | 589.7 *** | 1492 *** | 794 *** | 1518 *** | 298.9 *** | 292.6 *** |
| Observations | 6794 | 6794 | 6794 | 6794 | 6794 | 6794 | 6794 | 6794 | 6794 | 6794 |
| Variables | lny | t | lnk | lnl | t2 | lnk2 | lnl2 | lnklnl | tlnk | tlnl |
|---|---|---|---|---|---|---|---|---|---|---|
| lny | 1 | |||||||||
| t | 0.282 *** | 1 | ||||||||
| lnk | 0.711 *** | 0.202 *** | 1 | |||||||
| lnl | 0.631 *** | 0.232 *** | 0.678 *** | 1 | ||||||
| t2 | 0.273 *** | 0.979 *** | 0.195 *** | 0.217 *** | 1 | |||||
| lnk2 | 0.732 *** | 0.201 *** | 0.992 *** | 0.671 *** | 0.194 *** | 1 | ||||
| lnl2 | 0.657 *** | 0.225 *** | 0.691 *** | 0.991 *** | 0.212 *** | 0.692 *** | 1 | |||
| lnklnl | 0.747 *** | 0.234 *** | 0.903 *** | 0.916 *** | 0.222 *** | 0.907 *** | 0.929 *** | 1 | ||
| tlnk | 0.452 *** | 0.951 *** | 0.466 *** | 0.398 *** | 0.935 *** | 0.465 *** | 0.397 *** | 0.468 *** | 1 | |
| tlnl | 0.437 *** | 0.952 *** | 0.379 *** | 0.486 *** | 0.935 *** | 0.378 *** | 0.482 *** | 0.472 *** | 0.970 *** | 1 |
| Source of Variation | SS | df | MS | F | p-Value | F Crit |
|---|---|---|---|---|---|---|
| Between groups | 0.1065 | 2 | 0.0532 | 0.8550 | 0.4254 | 2.9987 |
| Within groups | 187.5677 | 3012 | 0.0623 | |||
| Total | 187.6742 | 3014 |
| Variable | Description |
|---|---|
| t | Time trends. |
| lnyit | Logarithms of the output of the listed company i (i = 1, 2, …, N; t = 1, 2, …, 10) in year t. |
| lnkit | Logarithms of the capital of the listed company i (i = 1, 2,…,N; t = 1, 2, …, 10) in year t. |
| lnlit | Logarithms of the labor of the listed company i (i = 1, 2, …, N; t = 1, 2, …, 10) in year t. |
| vit | Random error, reflecting the non-efficiency of the system. |
| uit | Technical loss error, reflecting technical inefficiency. |
| Number of dmu | Number of enterprises in each model. Each enterprise has 15 years of data, from 2006 to 2020, which is a balanced panel. |
| γ | , γ is the proportion of technical invalid rate in random disturbance term; when γ approaches 1, this shows that the error of SFA estimation is mainly due to the loss of technical efficiency, and SFA fits the production function model well. |
References
- Wang, Y.; Chen, C.; Gao, S. Estimation and Analysis of China’s Urban Total Factor Productivity: 2000–2013. Econ. Issues 2016, 1–8. [Google Scholar] [CrossRef]
- Douglass, C.N. Structure and Change in Economic History; Shanghai People’s Publishing House: Shanghai, China, 1994; p. 186. [Google Scholar]
- Sun, X.; Wang, Y. Firm nature, R & D efficiency and total factor productivity: An Empirical Test Based on micro data of Chinese industrial enterprises. J. Dalian Univ. Technol. (Soc. Sci. Ed.) 2014, 35, 35–41. [Google Scholar]
- Hsieh, C.T.; Klenow, J.P. Misallocation and Manufactuting TFP in China and India. Q. J. Econ. 2009, 124, 1403–1448. [Google Scholar] [CrossRef]
- Nie, H.; Jia, R. Productivity and Resource Misplacement of Chinese Manufacturing Enterprises. World Econ. 2011, 34, 27–42. [Google Scholar]
- The State Council of the People’s Republic of China. The 14th Five-Year Plan for the National Economic and Social Development of the People’s Republic of China and Outline of Long-Term Goals for 2035. Available online: http://www.gov.cn/xinwen/2021-03/13/content_5592681.htm (accessed on 16 June 2021).
- The State Council of the People’s Republic of China. Xi Jinping: Secure a Decisive Victory in Building a Moderately Prosperous Society in all Respects, Strive for the Great Success of Socialism with Chinese Characteristics for a New Era-Report at the 19th National Congress of the Communist Party of China. Available online: http://www.gov.cn/zhuanti/2017-10/27/content_5234876.htm (accessed on 16 June 2021).
- Djankov, S.; Murrell, P. Enterprise restructuring in transition: A quantitative survey. J. Econ. Lit. 2002, 40, 739–792. [Google Scholar] [CrossRef]
- Estrin, S.; Hanousek, J.; Kocenda, E.; Svejnar, J. The Effects of Privatization and Ownership in Transition Economies. J. Econ. Lit. 2009, 47, 699–728. [Google Scholar] [CrossRef]
- Brown, J.D.; Earle, J.S.; Telegdy, Á. The Productivity Effects of Privatization: Longitudinal Estimates from Hungary, Romania, Russia, and Ukraine. J. Political Econ. 2006, 114, 61–99. [Google Scholar] [CrossRef]
- Bogart, D.; Chaudhary, L. Off the rails: Is state ownership bad for productivity? J. Comp. Econ. 2015, 43, 997–1013. [Google Scholar] [CrossRef]
- Curtis, C. Economic Reforms and the Evolution of China’s total factor productivity. Rev. Econ. Dyn. 2016, 21, 225–245. [Google Scholar] [CrossRef]
- Coelli, T.; Rao, D.S.P.; Battese, G.E. An Introduction to Efficiency and Productivity Analysis; Kluwer Academic Publishers: Boston, MA, USA, 1998. [Google Scholar] [CrossRef]
- Shen, C.; Zhao, S. Research on the impact of market competition and non-interest business on the efficiency of commercial banks. J. Quant. Technol. Econ. 2017, 34, 145–161. [Google Scholar] [CrossRef]
- Tao, H.; Tian, J.; Hao, S. Time series analysis of operational efficiency of state-owned enterprises based on DEA method-Comparison with private enterprises. Theor. J. 2012, 48–52. [Google Scholar] [CrossRef]
- Wu, H.; Li, D. Total Factor Productivity Growth Comparison of Domestic and Foreign Enterprises in China’s Manufacturing Industry. Syst. Eng. 2012, 30, 92–97. [Google Scholar]
- Guo, C.; Chen, C. Research on the difference of total factor productivity in manufacturing industry-based on the distribution and change of manufacturing scale. Price Theory Pract. 2018, 143–146. [Google Scholar] [CrossRef]
- Xu, S.; Du, D.; Gui, Q.; Qin, X. Is the Technological Progress of Foreign Economy Better than that of Private Economy? Empirical Research on Total Factor Productivity in Shanghai. Res. Dev. Manag. 2019, 31, 115–125. [Google Scholar] [CrossRef]
- Aigner, D.; Lovell, C.A.K.; Schmidt, P. Formulation and Estimation of Stochastic Frontier Production Function Models. J. Econom. 1977, 6, 21–37. [Google Scholar] [CrossRef]
- Meeusen, W.; van den Broeck, J. Technical Efficiency and Dimension of the Firm: Some Results on the Use of Frontier Production Functions. Empir. Econ. 1977, 2, 109–122. [Google Scholar] [CrossRef]
- Kuang, Y. Technical Efficiency, Technical Progress, Factor Accumulation and China’s Agricultural Economic Growth—Empirical Analysis Based on SFA. Res. Quant. Econ. Tech. Econ. 2012, 29, 3–18. [Google Scholar] [CrossRef]
- Li, G.; Feng, Z.; Fan, L. Decomposition of technical efficiency of household operation and total factor productivity growth (1999–2003)—Based on stochastic frontier production function and micro evidence from farmers in Hubei Province. Res. Quant. Econ. Tech. Econ. 2007, 24, 25–34. [Google Scholar]
- Oh, S.-C.; Shin, J. The Assessment of Car Making Plants with an Integrated Stochastic Frontier Analysis Model. Mathematics 2021, 9, 1296. [Google Scholar] [CrossRef]
- Li, X.; Qin, J.; Sun, L. The dynamic changes of operating environment, governance structure and total factor productivity of commercial banks. China Ind. Econ. 2014, 57–68. [Google Scholar] [CrossRef]
- Zheng, S.; Yin, X. Diversification analysis of China’s commercial banks based on the perspective of X efficiency. Quant. Econ. Tech. Econ. Res. 2013, 30, 81–97. [Google Scholar] [CrossRef]
- Jiang, P.; Wang, Y. Research on the input-output efficiency of China’s cultural industry in full caliber-Analysis based on three-stage DEA model and super-efficiency DEA model. Quant. Econ. Tech. Econ. Res. 2011, 28, 69–81. [Google Scholar] [CrossRef]
- Wang, D.; Li, J. China’s tax collection efficiency and its influencing factors-Empirical research based on stochastic frontier analysis (SFA) technology. Quant. Econ. Tech. Econ. Res. 2009, 26, 152–161. [Google Scholar]
- Zhu, B.; Song, Z. Research on performance evaluation of open-end funds in China based on SFA efficiency value. Quant. Econ. Tech. Econ. Res. 2009, 26, 105–116. [Google Scholar]
- Gan, X. Empirical Analysis of the Efficiency Structure of China’s Insurance Industry. Quant. Econ. Tech. Econ. Res. 2008, 92–105. [Google Scholar]
- Yang, Q.; Su, Q.; Yin, L. China’s service industry productivity and its influencing factors-Empirical research based on stochastic frontier production function. Quant. Econ. Tech. Econ. Res. 2009, 26, 46–57. [Google Scholar]
- Gu, N. The impact and channels of producer services on industrial profitability-an empirical study based on urban panel data and SFA model. China Ind. Econ. 2010, 48–58. [Google Scholar] [CrossRef]
- Xing, H.; Gao, J.; Tan, H. International spatial spillover and total factor productivity of service industry-Measurement based on spatial stochastic frontier analysis method. Quant. Econ. Tech. Econ. Res. 2021, 38, 75–95. [Google Scholar] [CrossRef]
- Zhu, Y.; Xu, K. Empirical Study on R&D Efficiency of High-tech Industry in China. China Ind. Econ. 2006, 38–45. [Google Scholar] [CrossRef]
- Bai, J.; Bian, Y. Factor market distortions and efficiency loss of innovative production in China. China Ind. Econ. 2016, 39–55. [Google Scholar] [CrossRef]
- Sun, W.; Shen, K. Difference between Human Capital Accumulation and Technological Innovation Efficiency of Chinese Manufacturing Industry. China Ind. Econ. 2009, 81–91. [Google Scholar] [CrossRef]
- Han, Z.; Cheng, X. Measurement and Analysis of Provincial R&D Input and Innovation Efficiency in China. Quant. Econ. Tech. Econ. Res. 2020, 37, 98–117. [Google Scholar] [CrossRef]
- Shi, X.; Zhao, S.; Wu, F. China’s regional innovation efficiency and its spatial differences. Quant. Econ. Tech. Econ. Res. 2009, 26, 45–55. [Google Scholar]
- Dai, Y. China’s urbanization efficiency and its influencing factors-Analysis based on stochastic frontier production function. Quant. Econ. Tech. Econ. Res. 2010, 27, 103–117. [Google Scholar] [CrossRef]
- Zhang, G.; Xia, D. Ownership structure, environmental regulation and the efficiency of China’s power generation industry—Analysis based on 30 provincial panel data from 2003 to 2009. China Ind. Econ. 2011, 130–140. [Google Scholar] [CrossRef]
- Yuan, Y.; Guo, L.; Sun, J. Structure, Technology, Management and Energy Efficiency-An Analysis Based on China’s Provincial Panel Data from 2000 to 2010. China Ind. Econ. 2012, 18–30. [Google Scholar] [CrossRef]
- Zhang, S.; Jiang, W. Energy Efficiency Measurement Method: Evolution, Controversy and the Future. Quant. Econ. Tech. Econ. Res. 2016, 33, 3–24. [Google Scholar] [CrossRef]
- Lin, B.; Du, K. The impact of factor market distortions on energy efficiency. Econ. Res. 2013, 48, 125–136. [Google Scholar]
- Sun, C.; Lin, B. China’s industrial energy factor allocation efficiency and energy saving potential research. Quant. Econ. Tech. Econ. Res. 2014, 31, 86–99. [Google Scholar] [CrossRef]
- Jiang, Y.; Zhu, G. Technical inefficiency of energy use and its convergence analysis. Quant. Econ. Tech. Econ. Res. 2007, 24, 108–119. [Google Scholar]
- Duan, W.; Liu, D.; Yu, Y. Technical path and comparative advantage of energy saving and emission reduction in heterogeneous industries-theoretical model and empirical test. China Ind. Econ. 2013, 69–81. [Google Scholar] [CrossRef]
- Li, D.; Hu, X. Research on Relative Efficiency and Total Factor Productivity Growth of Chinese Manufacturing Enterprises-An Empirical Analysis Based on Industry Data from 1999 to 2005. Quant. Econ. Tech. Econ. Res. 2008, 25, 31–41. [Google Scholar]
- Zheng, S.; Kjetil, S.; Fabrizio, Z. Growing Like China. Am. Econ. Rev. 2011, 101, 196–233. [Google Scholar]
- Hao, S.; Tao, H.; Tian, J. A comparative study on the governance efficiency of state-owned enterprises with different ownership structures: A case study of Shandong Province. China Ind. Econ. 2011, 130–139. [Google Scholar]
- Fan, J.; Yu, X.; Zhao, L. A study on the regional efficiency differences among state-owned, private and foreign-funded industrial enterprises in China. Quant. Econ. Tech. Econ. Res. 2015, 32, 21–38. [Google Scholar]
- Xu, B. Analysis of efficiency loss of state-owned enterprises. Tech. Econ. Manag. 2017, 56–60. [Google Scholar]
- Berkowitz, D.; Ma, H.; Nishioka, S. Recasting the iron rice bowl: The reform of China’s state-owned enterprises. Rev. Econ. Stat. 2017, 99, 735–747. [Google Scholar] [CrossRef]
- Zhang, T.; Liu, K.; Xiong, X. A comparative study on the production efficiency of Chinese state-owned enterprises and private enterprises. Quant. Econ. Tech. Econ. Res. 2018, 35, 78–94. [Google Scholar]
- Li, Y.; Yang, R. Dependence of local state-owned enterprises, improvement of resource allocation efficiency and supply side Reform. Econ. Res. 2018, 53, 80–94. [Google Scholar]
- Wang, W.; Liu, X. Why zombie enterprises can survive for a long time. China Ind. Econ. 2018, 61–79. [Google Scholar]
- Yin, Z.; Liu, L.; Wang, H. Study on the ownership balance and the efficiency of mixed ownership enterprises from the perspective of heterogeneous shareholders. PLoS ONE 2018, 13, e0194433. [Google Scholar] [CrossRef]
- Liu, Z.; Spiegel, M.M.; Zhang, J. Optimal capital account liberalization in China. J. Monet. Econ. 2021, 117, 1041–1061. [Google Scholar] [CrossRef]
- Zhao, Q. Are state-owned enterprises really inefficient—From the perspective of regional innovation efficiency spillover effect. Sci. Sci. Manag. Sci. Technol. 2017, 38, 107–116. [Google Scholar]
- Zhao, T.; Fang, H. Empirical Study on OFDI and China’s innovation efficiency. Quant. Econ. Tech. Econ. Res. 2019, 36, 58–76. [Google Scholar]
- Tan, T.; Wu, J.; Wang, M.K.; Shen, W. Research on the efficiency of commercial banks in countries along the “21st century Maritime Silk Road”. Quant. Econ. Tech. Econ. Res. 2020, 37, 60–77. [Google Scholar]
- Kong, D.; Tang, Q.; Xiang, J. Labor protection and labor investment efficiency of enterprises. J. Huazhong Univ. Sci. Technol. (Soc. Sci. Ed.) 2020, 34, 36–47. [Google Scholar]
- Levinsohn, J.; Petrin, A. Estimating Production Functions using Inputs to Control for Unobservables. Rev. Econ. Stud. 2003, 70, 317–341. [Google Scholar] [CrossRef]
- Olley, G.S.; Pakes, A. The Dynamics of Productivity in the Telecommunications Equipment lndustry. Econometrica 1996, 64, 1263–1297. [Google Scholar] [CrossRef]
- Fu, X.; Wu, L. Applicability of frontier analysis method in China’s economic growth accounting. World Econ. 2007, 30, 56–66. [Google Scholar]
- Battese, G.E.; Coelli, T.J. A model for technical inefficiency effects in a stochastic frontier production function for panel data. Empir. Econ. 1995, 20, 325–332. [Google Scholar] [CrossRef]
- Kumbhakar, S.C. Estimation and Decomposition of Productivity Change When Production is not Efficient: A Panel Data Approach. Econom. Rev. 2000, 19, 425–460. [Google Scholar] [CrossRef]
- Tu, Z.; Xiao, G. Industrial Productivity Revolution in China—Decomposition and Analysis of Total Factor Productivity Growth of Large and Medium-sized Industrial Enterprises in China by Stochastic Frontier Production Model. Econ. Res. 2005, 40, 4–15. [Google Scholar]
- National Bureau of Statistics. China Statistical Yearbook. Available online: http://www.stats.gov.cn/tjsj/ndsj/ (accessed on 5 September 2021).
- Lu, T.; Dang, Y. Corporate governance and technological innovation: Comparison by industry. Econ. Res. 2014, 49, 115–128. [Google Scholar]
- Industry classification guidelines for listed companies. Available online: http://www.csrc.gov.cn/csrc/c100103/c1452025/content.shtml (accessed on 16 September 2021).
- Batrancea, L.; Rathnaswamy, M.K.; Batrancea, I. A Panel Data Analysis on Determinants of Economic Growth in Seven Non-BCBS Countries. J. Knowl. Econ. 2022, 13, 1651–1665. [Google Scholar] [CrossRef]
- Batrancea, L.M. An Econometric Approach on Performance, Assets, and Liabilities in a Sample of Banks from Europe, Israel, United States of America, and Canada. Mathematics 2021, 9, 3178. [Google Scholar] [CrossRef]
- Batrancea, L. The Influence of Liquidity and Solvency on Performance within the Healthcare Industry: Evidence from Publicly Listed Companies. Mathematics 2021, 9, 2231. [Google Scholar] [CrossRef]
- Zhou, S.; Zhu, W. Can Industrial Clustering Bring Economic Efficiency: Scale Effect and Congestion Effect. Res. Ind. Econ. 2013, 12–22. [Google Scholar] [CrossRef]
- Craig Petersen, H.; Cries Lewis, W. Managerial Economies, 3rd ed.; MacMillan Publishing Company: New York, NY, USA, 1994. [Google Scholar]
- DiLorenzo, T.J.; Robinson, R. Managerial objectives subject to political market constraints: Electric utilities in the US. Q. Rev. Bus. Econ. 1982, 22, 113–125. [Google Scholar]
- Atkinson, S.E.; Halvorsen, R. The relative efficiency of public and private firms in a regulated environment: The case of US electric utilities. J. Public Econ. 1986, 29, 281–294. [Google Scholar] [CrossRef]
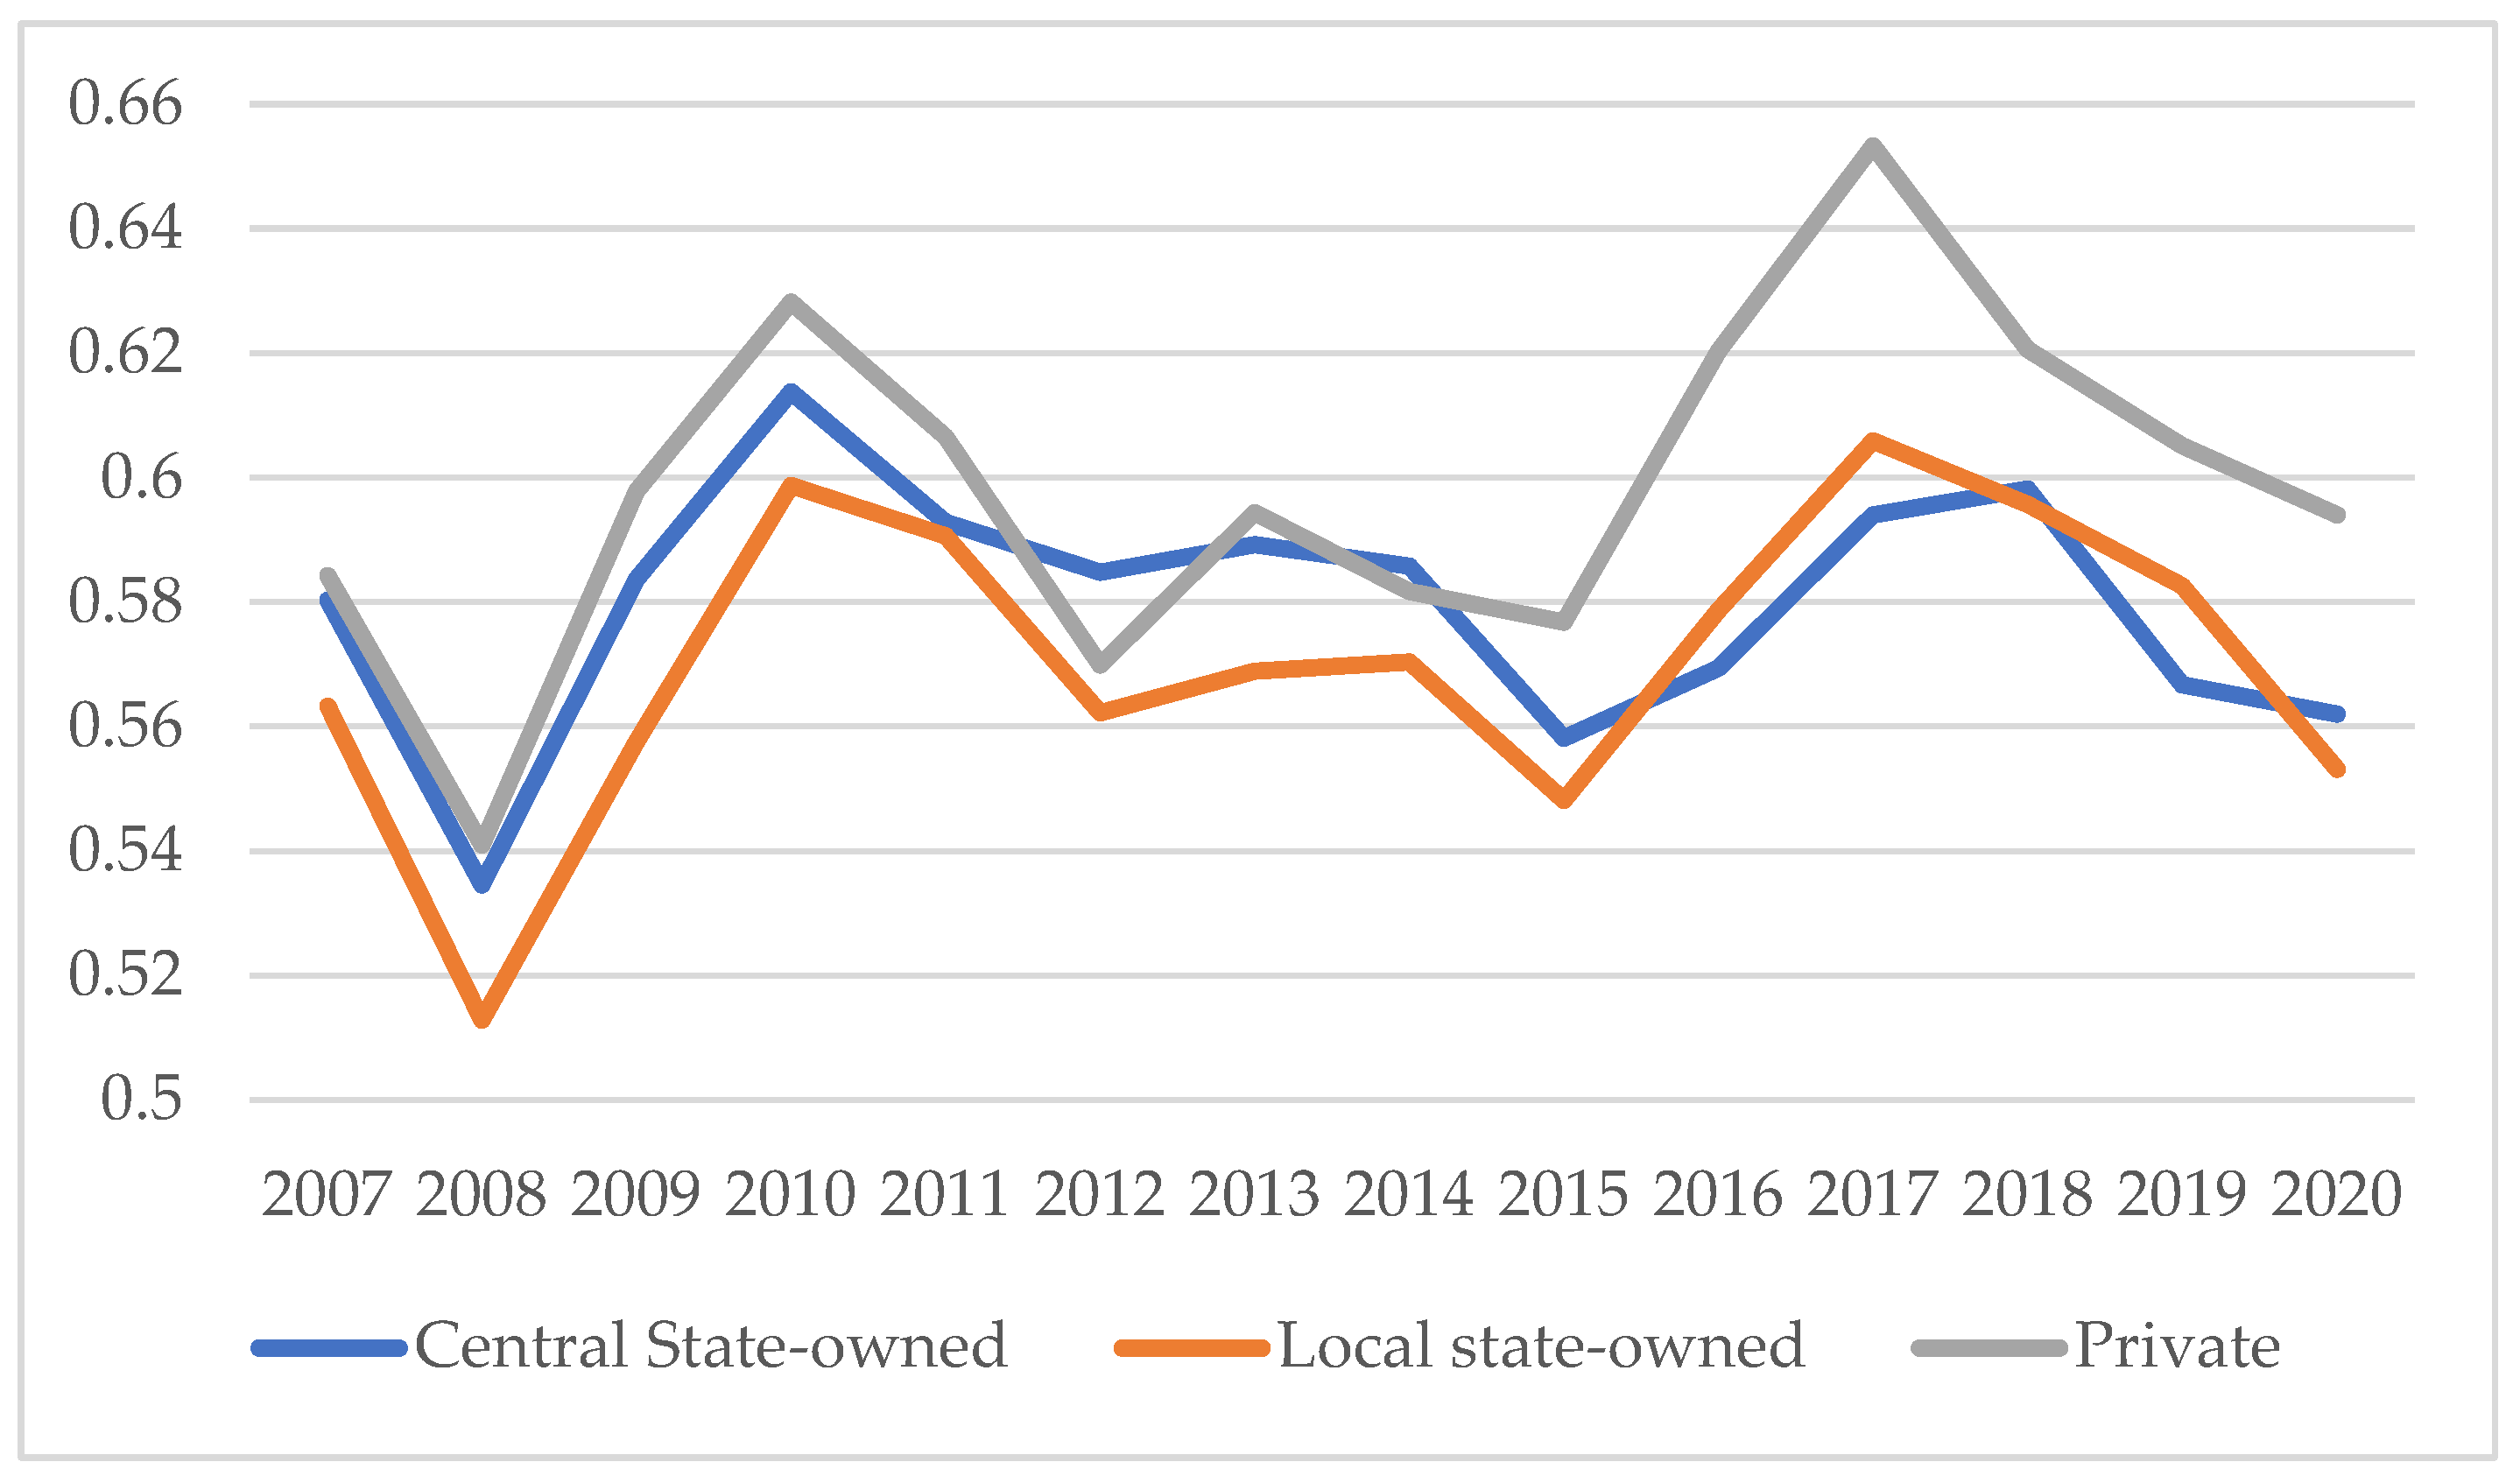
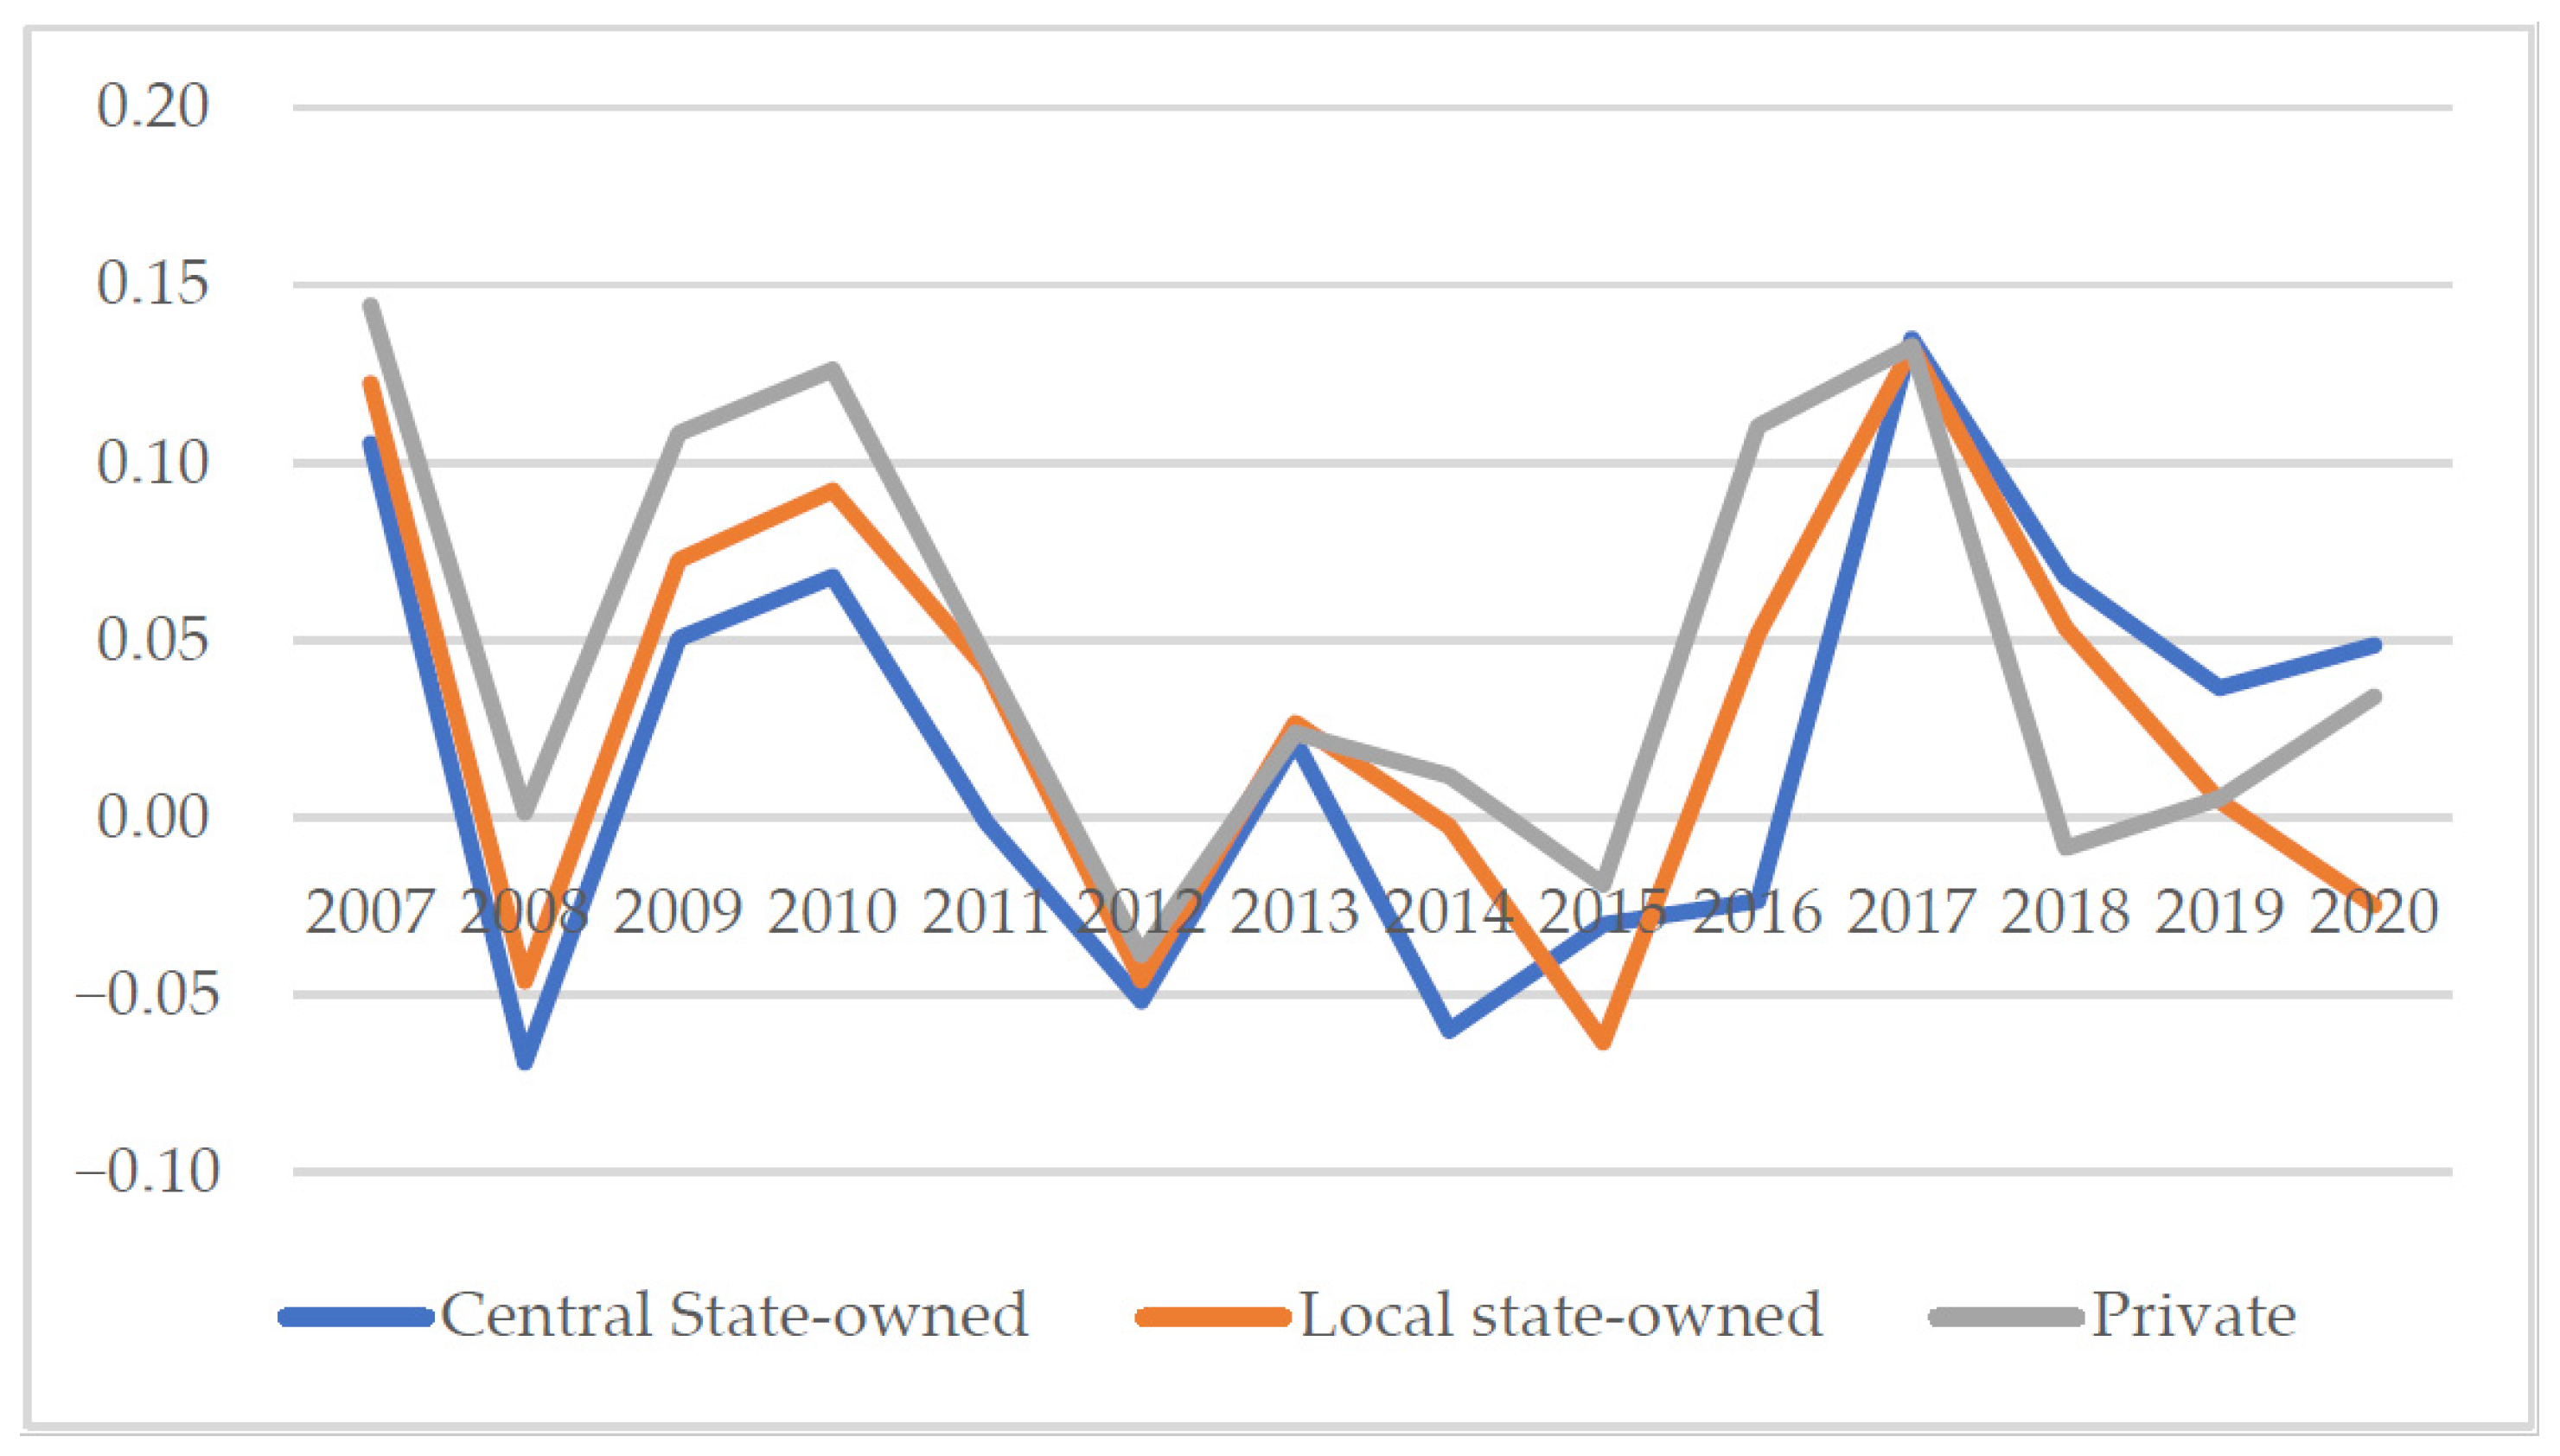
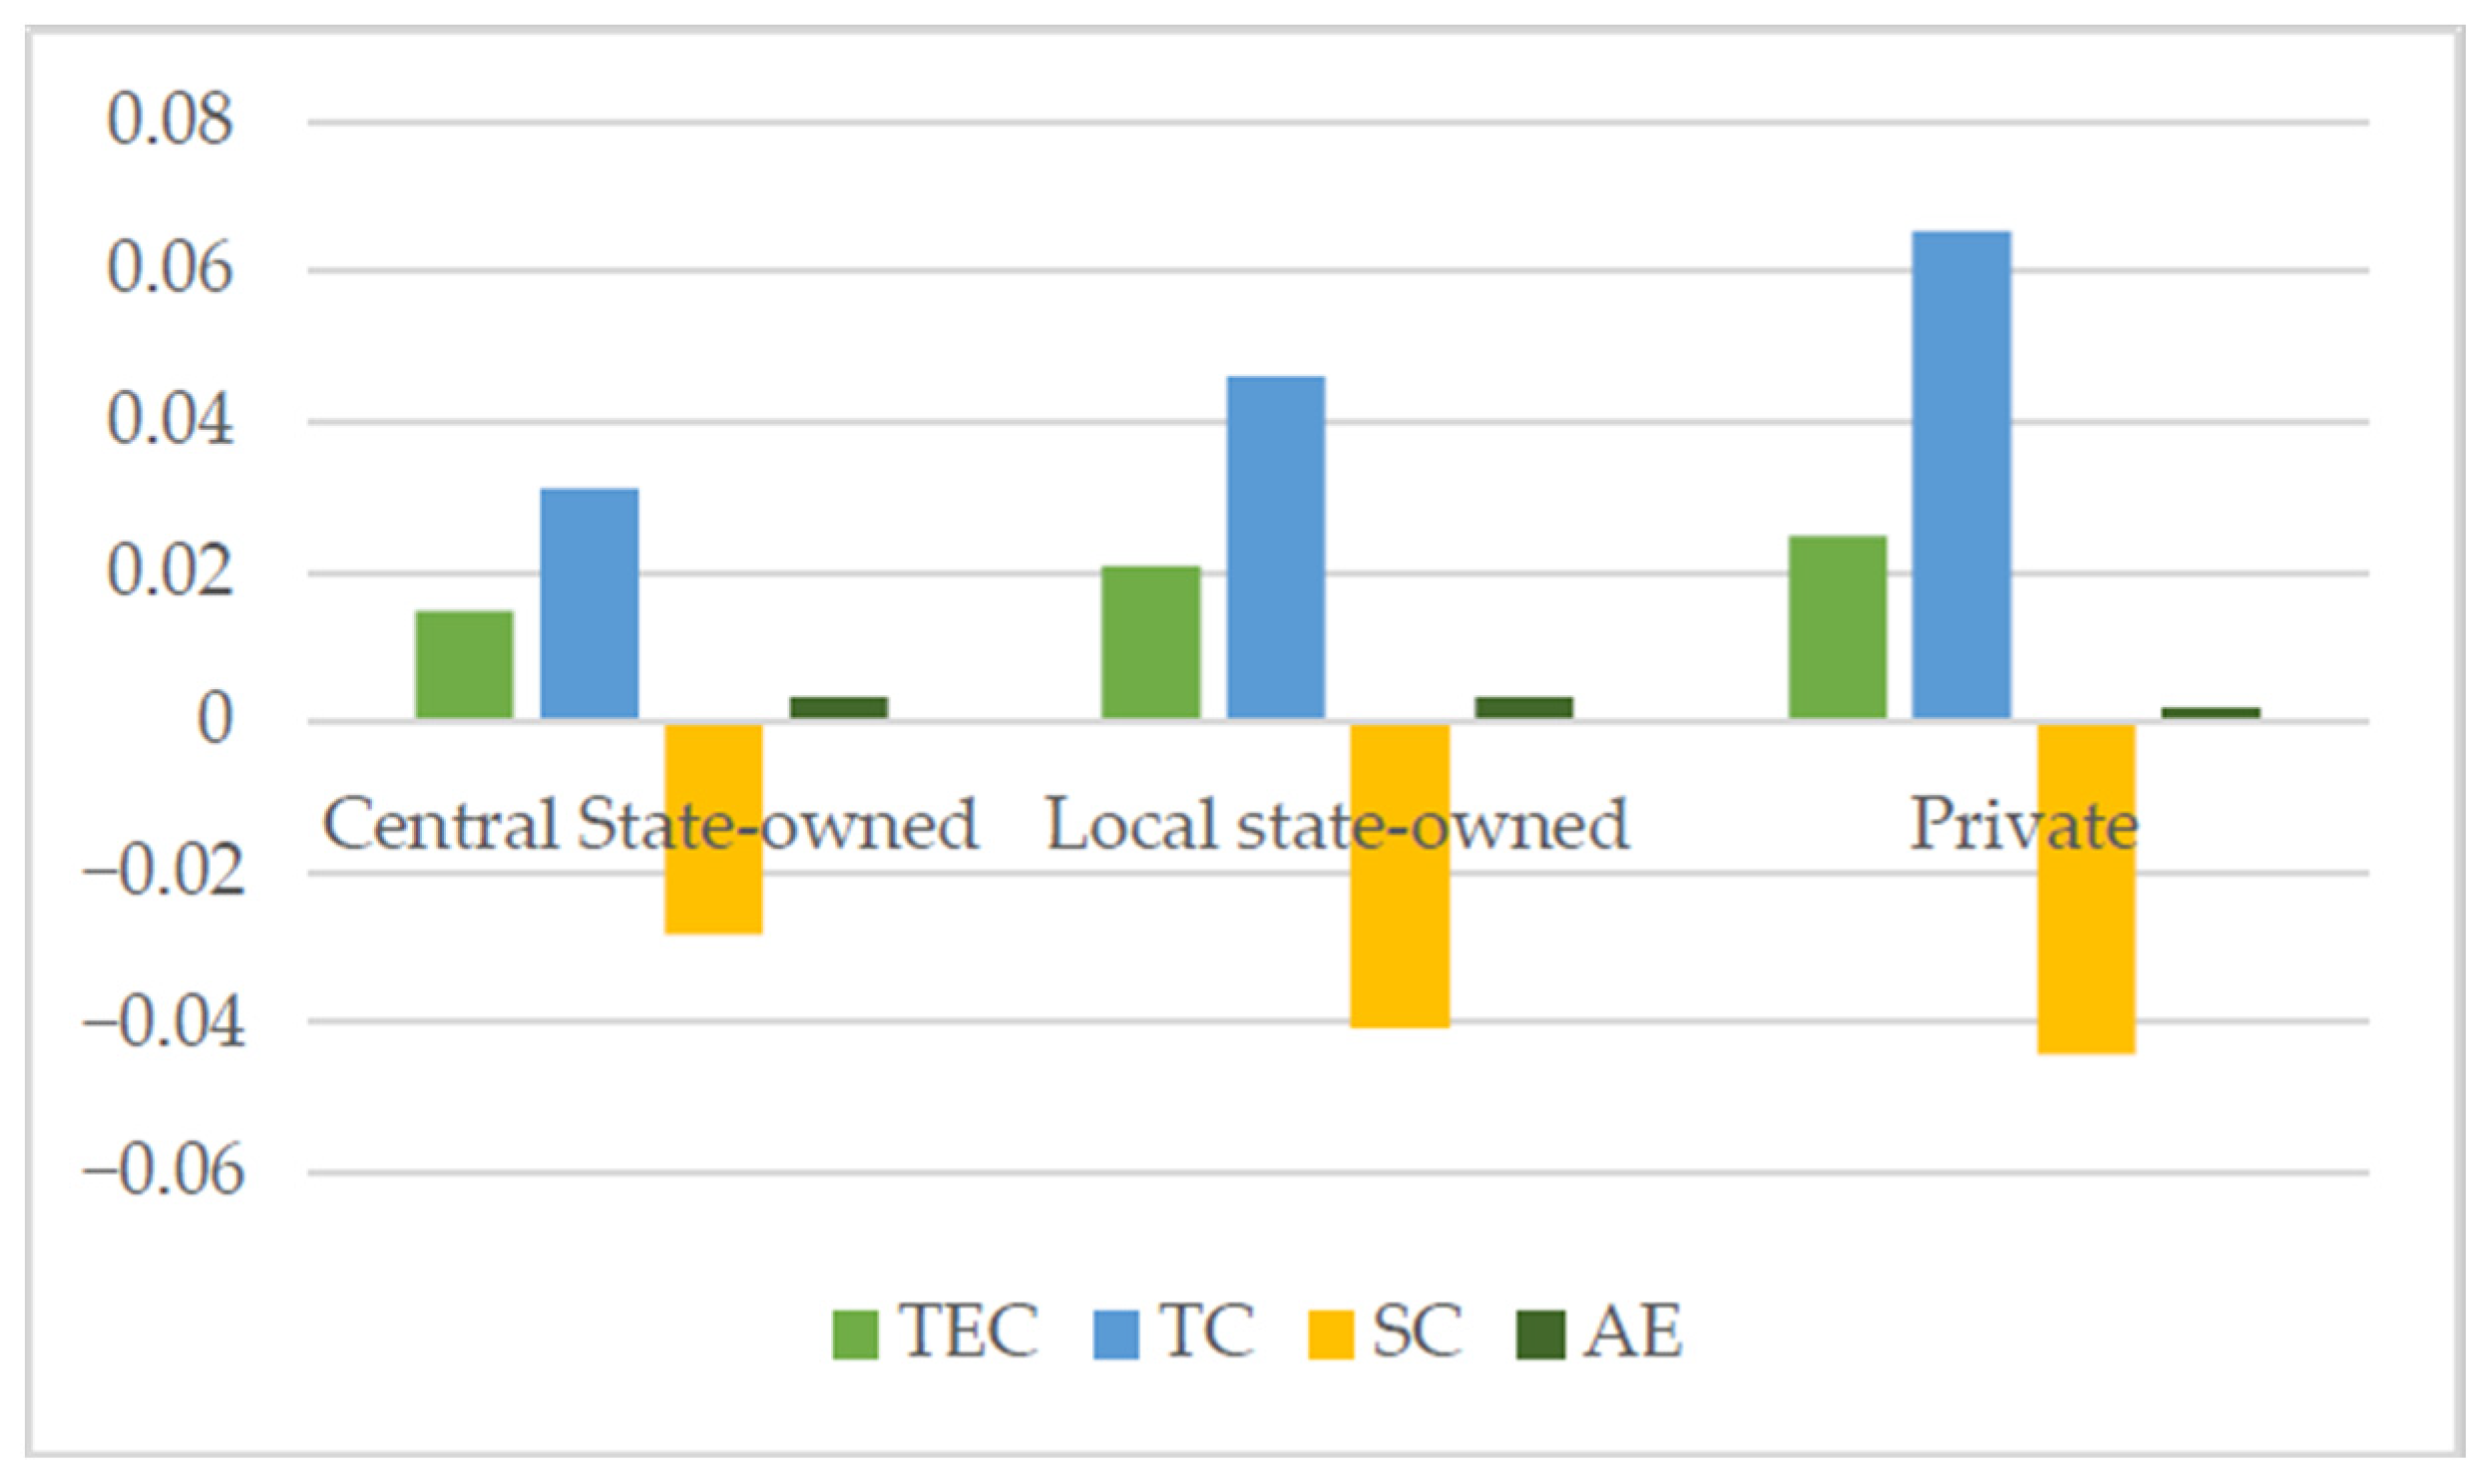
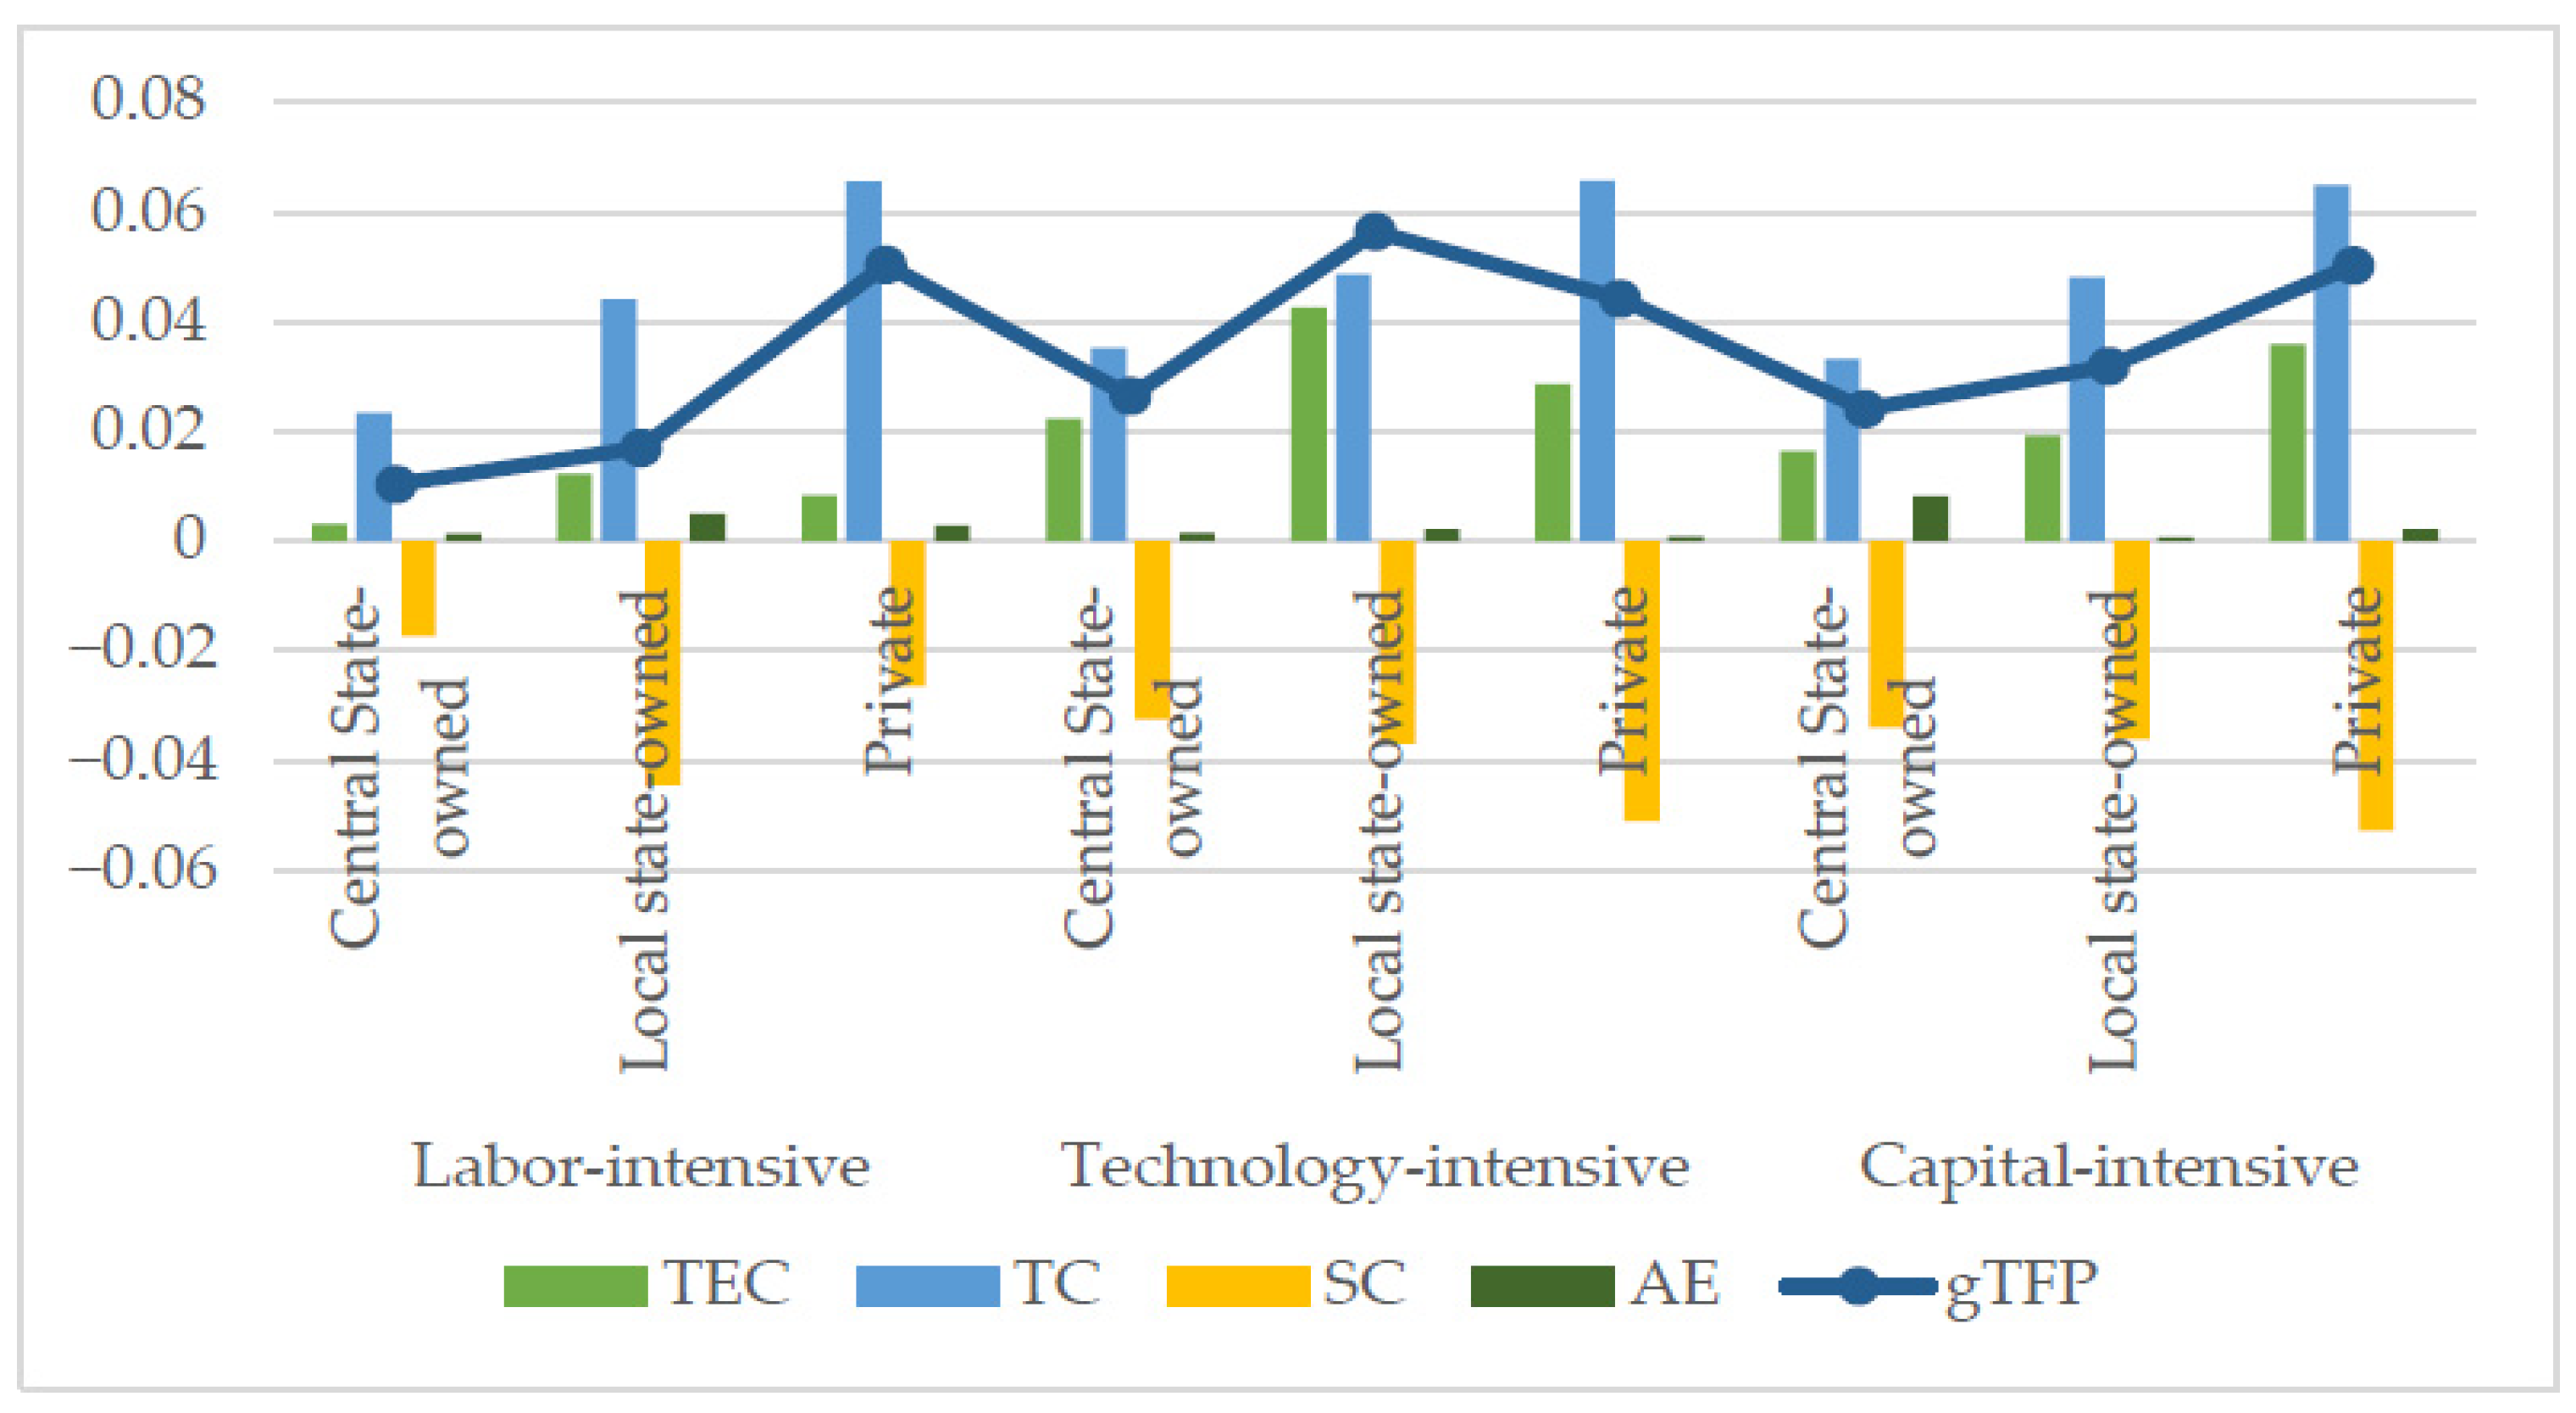
| Central State-Owned | Local State-Owned | Private Enterprise | |||||||
|---|---|---|---|---|---|---|---|---|---|
| Variable | lnY | lnK | lnL | lnY | lnK | lnL | lnY | lnK | lnL |
| Mean | 11.05 | 11.9 | 8.423 | 10.87 | 11.62 | 8.089 | 10.41 | 11.06 | 8.057 |
| Std. Dev. | 1.654 | 2.072 | 1.393 | 1.349 | 1.611 | 1.338 | 1.309 | 1.309 | 1.116 |
| Min | 5.674 | 4.696 | 3.466 | 6.235 | 5.43 | 2.708 | 4.46 | 5.061 | 3.178 |
| Max | 17.34 | 17.96 | 13.02 | 15.64 | 16.01 | 12.29 | 14.29 | 14.71 | 11.47 |
| N | 1920 | 1920 | 1920 | 3390 | 3390 | 3390 | 2190 | 2190 | 2190 |
| Labor-Intensive | Capital-Intensive | Technology-Intensive |
|---|---|---|
| A Agriculture, forestry, animal husbandry and fishery B Mining industry C13 Processing of food from agricultural products C14 Manufacture of foods C15 Wine, beverage and refined tea manufacturing C17 Manufacture of textile C18 Manufacture of textile wearing apparel and fashion C19 Manufacture of leather, fur, feather and related products, manufacture of footwear C20 Processing of timber, manufacture of wood, bamboo, rattan, palm and straw products C21 Manufacture of furniture D Production and supply of electric power, heat power, gas and water E Construction industry F Wholesale and retail trade G Transportation, warehousing and postal services R Culture, sports and entertainment industry S Comprehensive | C22 Manufacture of paper and paper products C23 Printing, reproduction of recording media C24 Culture and education, art, sports and recreation goods manufacturing C25 Processing of petroleum, coking, processing of nuclear fuel C26 Manufacture of raw chemical materials and chemical products C28 Manufacture of chemical fibers C29 Manufacture of rubber and plastics C30 Manufacture of non-metallic mineral products C31 Smelting and pressing of ferrous metals C32 Smelting and pressing of non-ferrous metals C33 Manufacture of metal products K Real estate industry L Lease and business services industry M Scientific research and technology services N Water conservancy, environment and public facilities management Q Health and social work O Residential services, repairs and other services | C27 Manufacture of medicines C34 Manufacture of general purpose machinery C35 Manufacture of special purpose machinery C36 Automobile manufacturing industry C37 Manufacturing of railway, marine, aerospace and other transportation equipment C38 Manufacture of electrical machinery and equipment C39 Manufacture of communication equipment, computers and other electronic equipment C41 Other manufacturing C43 Manufacture of metal products, machinery and equipment repair industry I Information transmission, software and information technology services |
| Parameter | (1) | (2) | (3) |
|---|---|---|---|
| Central State-Owned Enterprise | Local State-Owned Enterprise | Private Enterprise | |
| β0 | 8.058 *** | 9.041 *** | 12.843 *** |
| (18.22) | (15.50) | (11.92) | |
| βt | 0.076 *** | 0.139 *** | 0.098 *** |
| (4.03) | (7.24) | (3.05) | |
| βK | −0.568 *** | −0.193 * | −0.208 |
| (−6.34) | (−1.94) | (−1.33) | |
| βL | 0.573 *** | −0.039 | −1.001 *** |
| (4.03) | (−0.35) | (−4.45) | |
| 0.004 *** | 0.002 *** | 0.000 | |
| (6.09) | (3.86) | (0.04) | |
| βKK | 0.089 *** | 0.046 *** | 0.030 *** |
| (13.42) | (7.54) | (2.60) | |
| βLL | 0.075 *** | 0.065 *** | 0.081 *** |
| (5.95) | (8.59) | (6.29) | |
| βKL | −0.126 *** | −0.062 *** | −0.011 |
| (−9.28) | (−5.74) | (−0.53) | |
| βKt | −0.006 *** | −0.008 *** | −0.005 |
| (−2.82) | (−4.10) | (−1.33) | |
| βLt | −0.005 * | −0.005 ** | 0.002 |
| (−1.74) | (−1.97) | (0.59) | |
| γ | 0.876 | 0.889 | 0.867 |
| Observations | 1920 | 3390 | 2190 |
| Number of dmu | 128 | 226 | 146 |
| Wald chi2 (9) | 3265.72 | 3120.31 | 2423.62 |
| Prob > chi2 | 0.000 | 0.000 | 0.000 |
| Log likelihood | −1423.292 | −2809.570 | −2000.917 |
| Industry Classification | Central State-Owned Enterprise | Local State-Owned Enterprise | Private Enterprise | Industry Average |
|---|---|---|---|---|
| Labor-intensive | 0.5879 | 0.5816 | 0.5741 | 0.5812 |
| Capital-intensive | 0.5673 | 0.4982 | 0.6063 | 0.5573 |
| Technology-intensive | 0.5886 | 0.6122 | 0.6111 | 0.6040 |
| Region | Central State-Owned Enterprises | Local State-Owned Enterprises | Private Enterprises | Mean Value |
|---|---|---|---|---|
| North China | 0.6567 | 0.6684 | 0.5363 | 0.6205 |
| South China | 0.6272 | 0.6036 | 0.5714 | 0.6007 |
| East China | 0.5943 | 0.5816 | 0.6115 | 0.5958 |
| Northeast China | 0.5022 | 0.5202 | 0.6287 | 0.5504 |
| Southwest China | 0.4579 | 0.4791 | 0.6252 | 0.5208 |
| Northwest China | 0.3855 | 0.4527 | 0.6977 | 0.5119 |
| Central China | 0.5225 | 0.4526 | 0.4585 | 0.4779 |
| Year | TE | TC | SC | AE | gTFP | |
|---|---|---|---|---|---|---|
| Central state-owned enterprises | 2007 | 0.1878 | −0.0125 | −0.0518 | 0.0486 | 0.1721 |
| 2008 | −0.0447 | −0.0061 | −0.0630 | 0.0373 | −0.0766 | |
| 2009 | 0.2150 | 0.0004 | −0.0381 | 0.0036 | 0.1808 | |
| 2010 | 0.1127 | 0.0063 | −0.0660 | 0.0733 | 0.1264 | |
| 2011 | −0.0225 | 0.0138 | −0.0264 | 0.0334 | −0.0016 | |
| 2012 | 0.0881 | 0.0201 | −0.0460 | 0.0222 | 0.0844 | |
| 2013 | 0.1037 | 0.0267 | −0.0436 | −0.0195 | 0.0673 | |
| 2014 | 0.0760 | 0.0335 | −0.0410 | −0.0414 | 0.0270 | |
| 2015 | −0.0061 | 0.0406 | −0.0287 | −0.0471 | −0.0414 | |
| 2016 | 0.3380 | 0.0473 | −0.0527 | −0.0401 | 0.2925 | |
| 2017 | 0.1426 | 0.0546 | −0.0287 | −0.0174 | 0.1510 | |
| 2018 | 0.0060 | 0.0622 | −0.0252 | 0.0073 | 0.0503 | |
| 2019 | 0.0311 | 0.0693 | −0.0461 | −0.0056 | 0.0487 | |
| 2020 | 0.0112 | 0.0769 | −0.0159 | −0.0203 | 0.0518 | |
| Mean value | 0.0885 | 0.0309 | −0.0410 | 0.0024 | 0.0809 | |
| Local state-owned enterprises | 2007 | 0.2187 | 0.0264 | −0.0800 | 0.0503 | 0.2154 |
| 2008 | 0.0055 | 0.0296 | −0.0604 | 0.0476 | 0.0225 | |
| 2009 | 0.1730 | 0.0324 | −0.0611 | −0.0147 | 0.1295 | |
| 2010 | 0.2695 | 0.0353 | −0.0925 | 0.0131 | 0.2254 | |
| 2011 | 0.0171 | 0.0384 | −0.0736 | 0.0534 | 0.0352 | |
| 2012 | −0.0458 | 0.0405 | −0.0963 | 0.0743 | −0.0273 | |
| 2013 | 0.0828 | 0.0438 | −0.0615 | −0.0064 | 0.0587 | |
| 2014 | 0.0189 | 0.0468 | −0.0472 | −0.0104 | 0.0081 | |
| 2015 | 0.1338 | 0.0498 | −0.0721 | −0.0501 | 0.0614 | |
| 2016 | 0.1787 | 0.0529 | −0.0731 | −0.0105 | 0.1480 | |
| 2017 | 0.1702 | 0.0565 | −0.0230 | −0.0072 | 0.1966 | |
| 2018 | 0.0039 | 0.0606 | −0.0120 | 0.0010 | 0.0535 | |
| 2019 | −0.0265 | 0.0640 | −0.0190 | −0.0140 | 0.0045 | |
| 2020 | 0.0152 | 0.0674 | −0.0587 | −0.0176 | 0.0064 | |
| Mean value | 0.0868 | 0.0460 | −0.0593 | 0.0078 | 0.0813 | |
| Private enterprises | 2007 | 0.1432 | 0.0665 | −0.0808 | 0.0313 | 0.1602 |
| 2008 | −0.0651 | 0.0666 | −0.0742 | 0.0496 | −0.0231 | |
| 2009 | 0.2820 | 0.0663 | −0.1069 | −0.0300 | 0.2114 | |
| 2010 | 0.1356 | 0.0664 | −0.0718 | 0.0257 | 0.1558 | |
| 2011 | 0.0173 | 0.0661 | −0.0395 | 0.0275 | 0.0713 | |
| 2012 | −0.0495 | 0.0660 | −0.0807 | 0.0264 | −0.0378 | |
| 2013 | 0.2097 | 0.0656 | −0.0589 | −0.0467 | 0.1697 | |
| 2014 | 0.0275 | 0.0653 | −0.0604 | −0.0206 | 0.0118 | |
| 2015 | 0.0421 | 0.0648 | −0.0980 | −0.0112 | −0.0022 | |
| 2016 | 0.2272 | 0.0645 | −0.0678 | −0.0367 | 0.1872 | |
| 2017 | 0.1001 | 0.0645 | −0.0566 | −0.0036 | 0.1043 | |
| 2018 | −0.0357 | 0.0645 | −0.0468 | −0.0020 | −0.0201 | |
| 2019 | 0.0512 | 0.0643 | −0.0112 | −0.0152 | 0.0891 | |
| 2020 | 0.1686 | 0.0642 | −0.0273 | −0.0461 | 0.1594 | |
| Mean value | 0.0896 | 0.0654 | −0.0629 | −0.0037 | 0.0884 |
Disclaimer/Publisher’s Note: The statements, opinions and data contained in all publications are solely those of the individual author(s) and contributor(s) and not of MDPI and/or the editor(s). MDPI and/or the editor(s) disclaim responsibility for any injury to people or property resulting from any ideas, methods, instructions or products referred to in the content. |
© 2023 by the authors. Licensee MDPI, Basel, Switzerland. This article is an open access article distributed under the terms and conditions of the Creative Commons Attribution (CC BY) license (https://creativecommons.org/licenses/by/4.0/).
Share and Cite
Liu, C.; Lu, J.; Li, D.; Jia, M.; Han, K. Are State-Owned Enterprises Really Ineffective? An Empirical Study Based on Stochastic Frontier Analysis. Mathematics 2023, 11, 657. https://doi.org/10.3390/math11030657
Liu C, Lu J, Li D, Jia M, Han K. Are State-Owned Enterprises Really Ineffective? An Empirical Study Based on Stochastic Frontier Analysis. Mathematics. 2023; 11(3):657. https://doi.org/10.3390/math11030657
Chicago/Turabian StyleLiu, Chao, Jiaye Lu, Ding Li, Mengyao Jia, and Kunru Han. 2023. "Are State-Owned Enterprises Really Ineffective? An Empirical Study Based on Stochastic Frontier Analysis" Mathematics 11, no. 3: 657. https://doi.org/10.3390/math11030657
APA StyleLiu, C., Lu, J., Li, D., Jia, M., & Han, K. (2023). Are State-Owned Enterprises Really Ineffective? An Empirical Study Based on Stochastic Frontier Analysis. Mathematics, 11(3), 657. https://doi.org/10.3390/math11030657


