1. Introduction
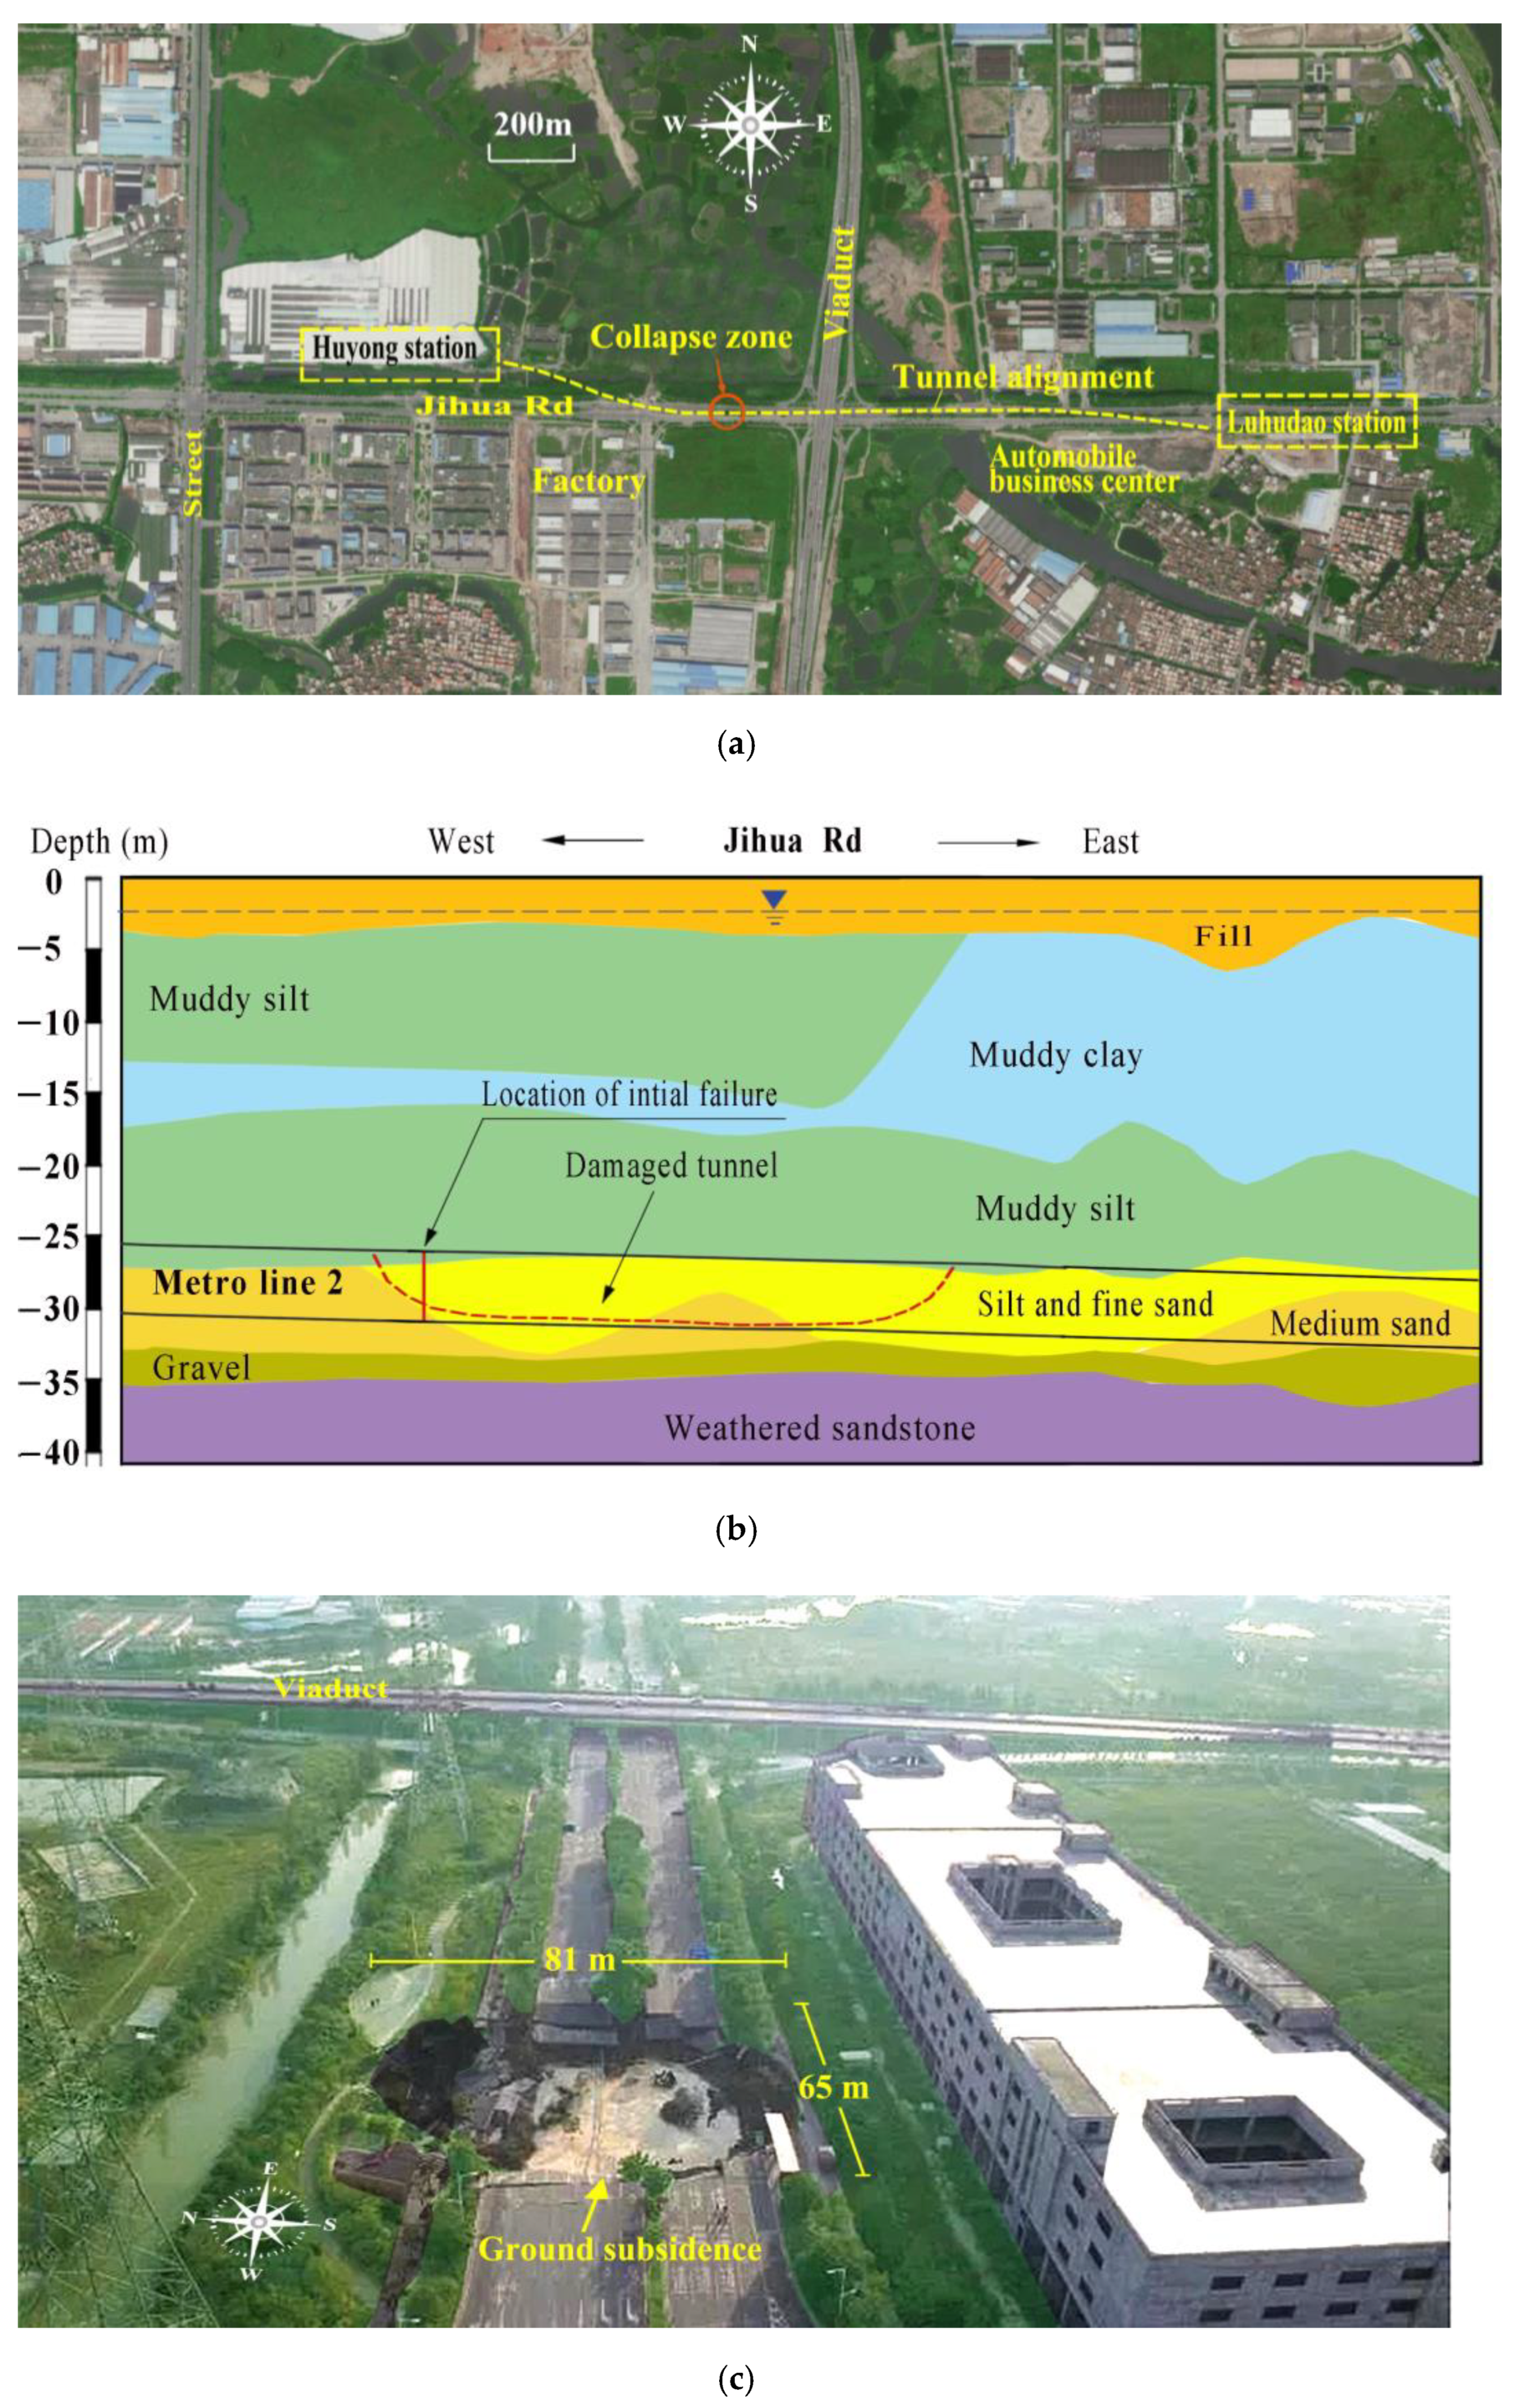
The development of cities often involves the construction of new tunnels buried underneath existing surface buildings and underground structures. When tunnels experience complicated and difficult conditions, devastating destruction can be induced by construction disturbances. For instance, in 2018, as shown in
Figure 1, an over 40 m long tunnel failed at Guangdong Foshan Metro Line 2 in a water-rich interbed of muddy silt, silt and fine and medium sand. An earth pressure balance shield machine was being driven from east to west. During the assembly of segments, leakage occurred at the tail of the shield. Grease was injected immediately, trying to plug the leakage point. Within two or three hours, the leakage intensified to quick sand flow. Water and sand kept gushed out, flooded the tunnel and eventually caused the failure of the tunnel. The failure claimed 11 lives, and the overall collapse of the ground extended to the surface, damaged unground gas pipelines and created 6–8 m deep ground subsidence.
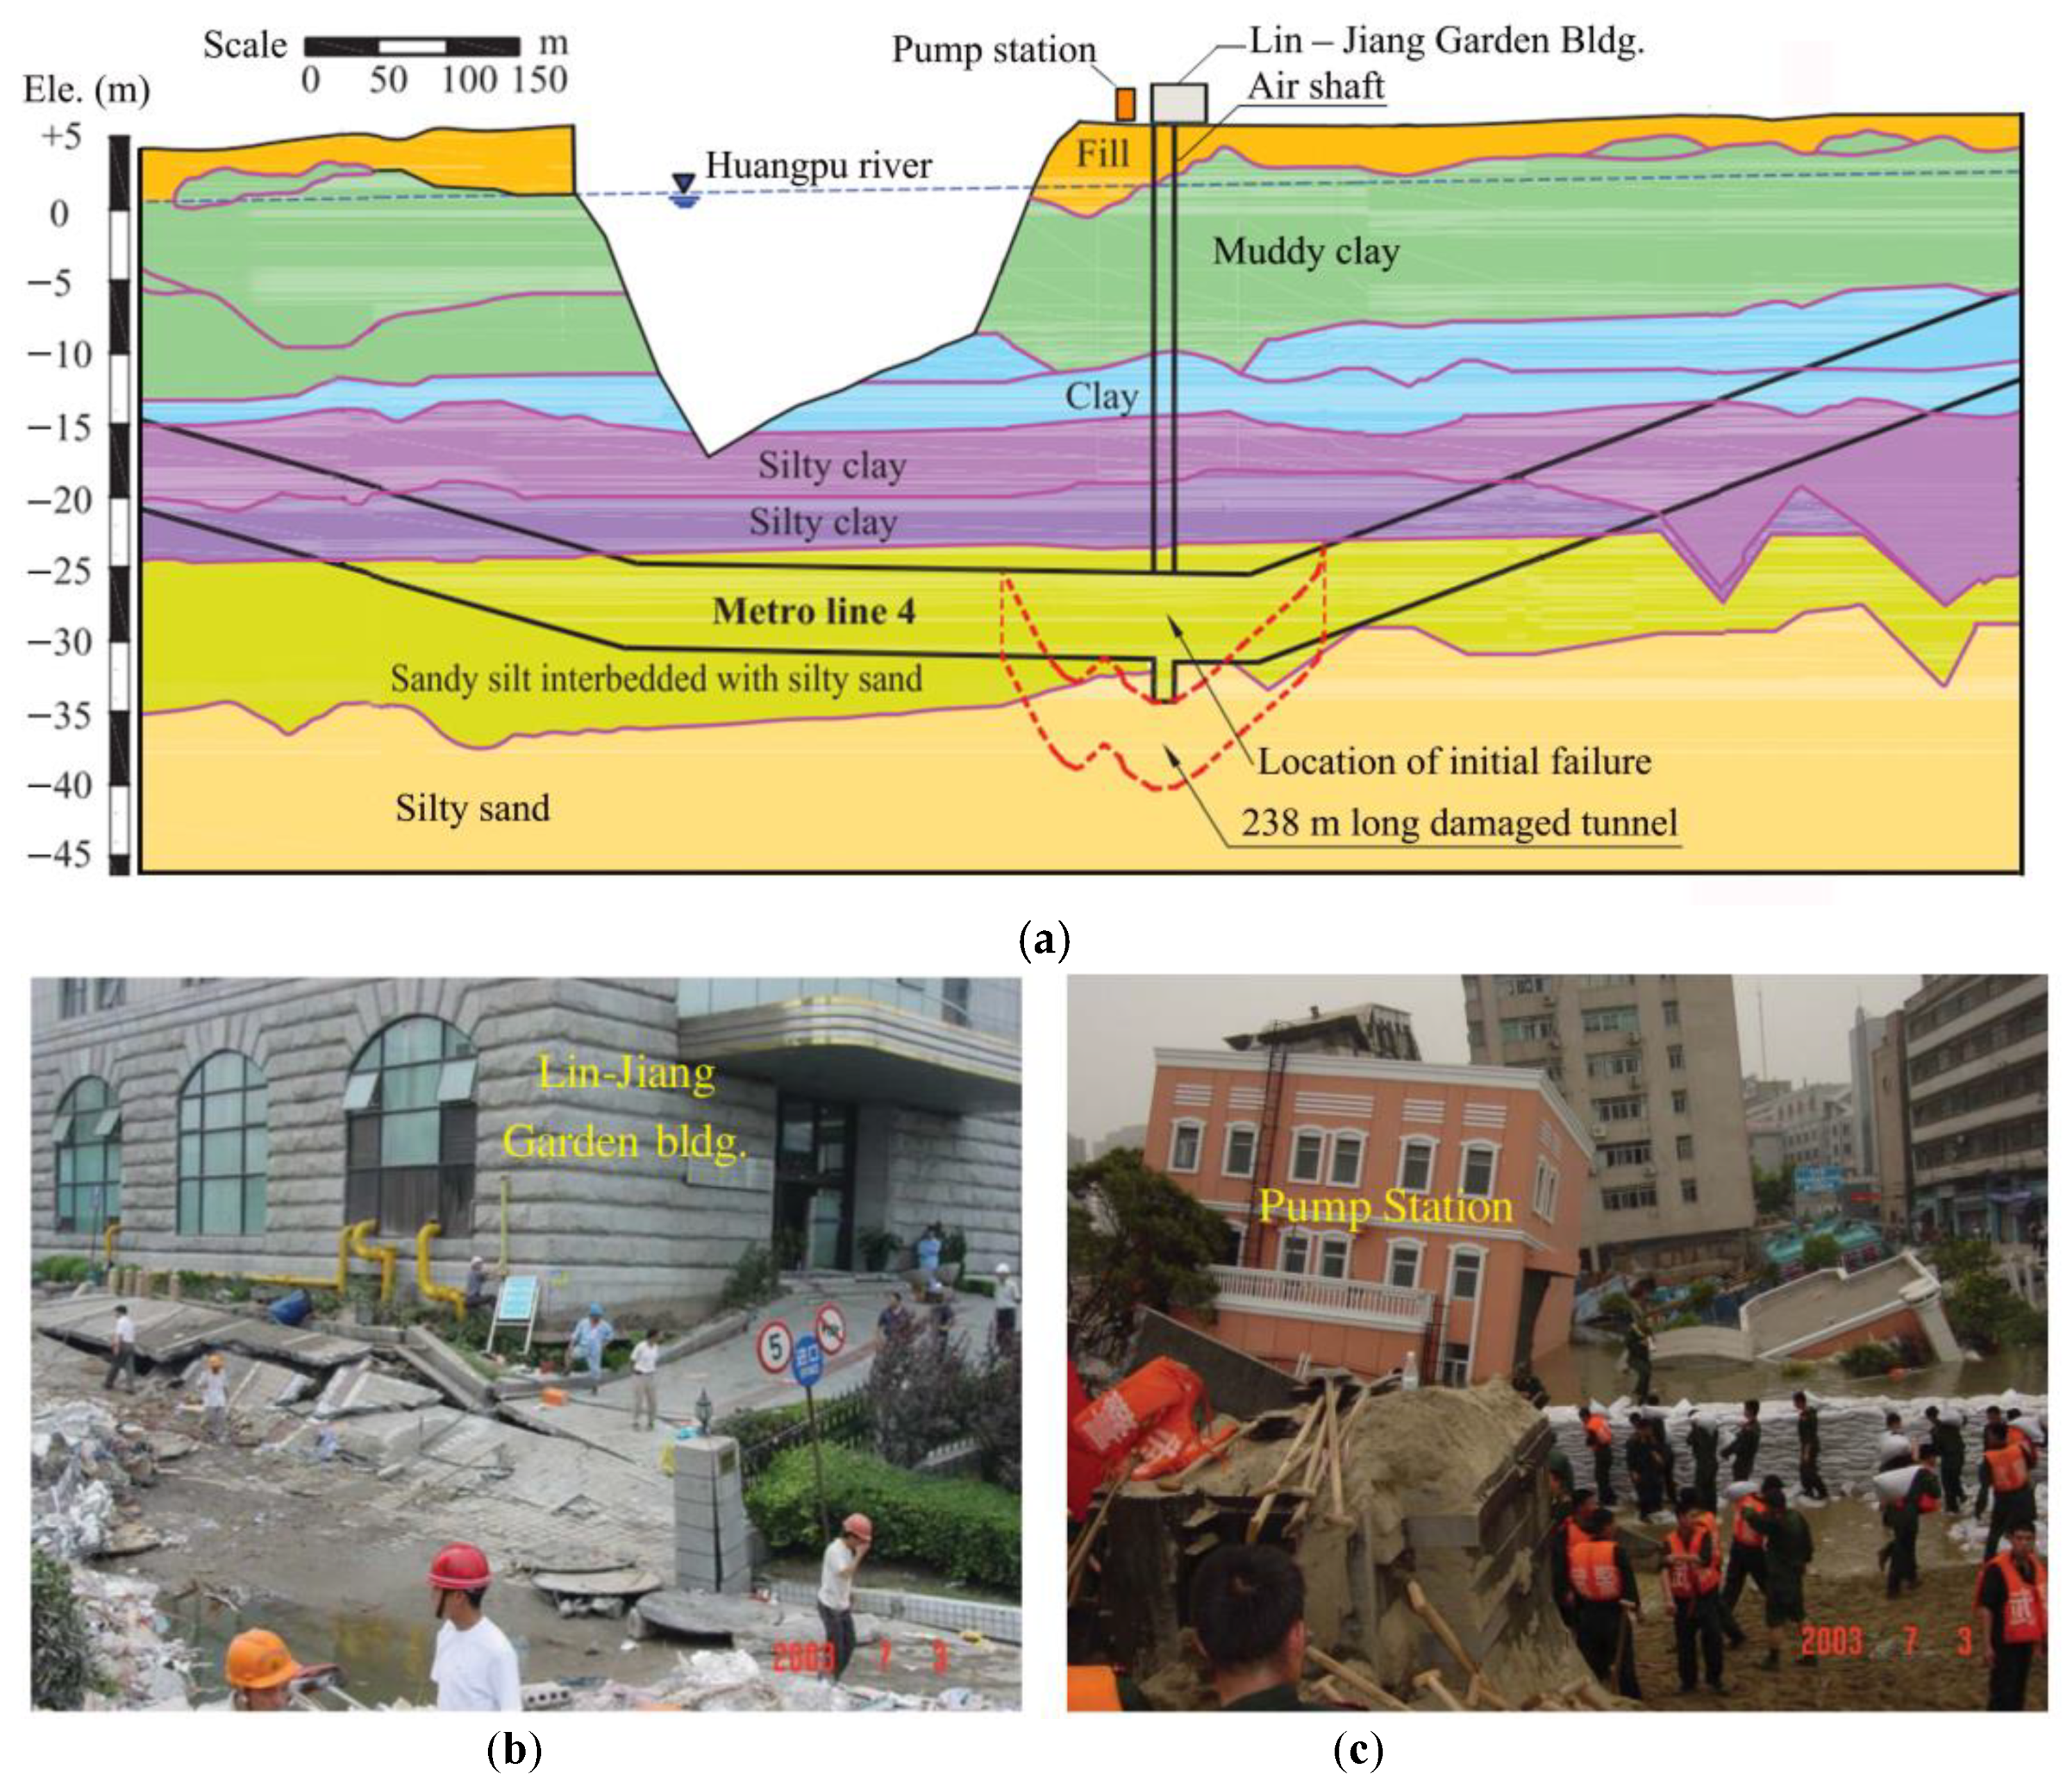
Tan et al. (2021) [
1] reported a 238 m long tunnel damaged at Shanghai Metro Line 4, as shown in
Figure 2. The initial failure was located at a cross passage connecting two tunnels. The main reason of the failure lies in three aspects: the excavation sequence of the air shaft and the cross passage was inadequate, the temperature rose due to the failure of the freezing equipment, and thus sand flow (sand bursting) gushed into the cross passage under artesian water. The failure of the cross passage led to the flooding and collapse of the 238 m long tunnel, the overall collapse of the ground, dramatic ground subsidence and the rapid sinking of existing structures. Coupling failure mechanisms developed in these cases, in which the failure of one structure resulted in the failures of adjacent structures caused by rapid sand flow, in partial failure, and in overall collapse initiated from construction disturbances. It is noted that the tunnel failure was of a large scale, and the induced damage was catastrophic.
Physical modeling has played an important role in studies related to the excavation of tunnels [
2,
3,
4,
5,
6,
7,
8,
9,
10,
11,
12,
13,
14,
15,
16,
17,
18,
19,
20,
21,
22]. It has been employed by many researchers to address the behavior of tunnel faces [
2,
23,
24,
25,
26], stress transfer [
25,
26,
27,
28], multi-tunnel construction [
29], deformation and the instability of structures [
30,
31,
32,
33,
34,
35,
36,
37,
38,
39]. However, most studies have focused on the response of a single structure to tunneling. The mechanisms of a single structure and a group of structures differ in that the latter is influenced by the interactions between structures, the arrangement of the structures with respect to the tunnel face, the failure pattern of the face, the gushing water encountered, etc. At present, theoretical and experimental studies on new tunnels underneath existing structures are still in the experience exploratory stage due to complex geological conditions and influencing factors. Research is still underway in this area within the international scientific community. It is essential to understand the coupling failure mechanism of existing underground structures to ensure the safe construction of new tunnels and the safe operation of existing structures.
In this study, four centrifuge model tests were performed at an 80 g level to investigate the coupling failure mechanism of existing underground structures subject to construction disturbances. A simple modeling technique was developed to simulate the instability of a tunnel face during construction. Three major mechanisms of sand flow, partial failure and overall collapse, associated with different soil conditions, were reproduced in the centrifuge. Observations of soil movement and the deformations of existing structures were made. The geometry of the failure zone is depicted for different tunnel face movements. The effects of soil properties, underground water and the presence of existing structures on deformations and failure mechanisms are discussed.
2. Centrifuge Model Testing
2.1. Model Setup
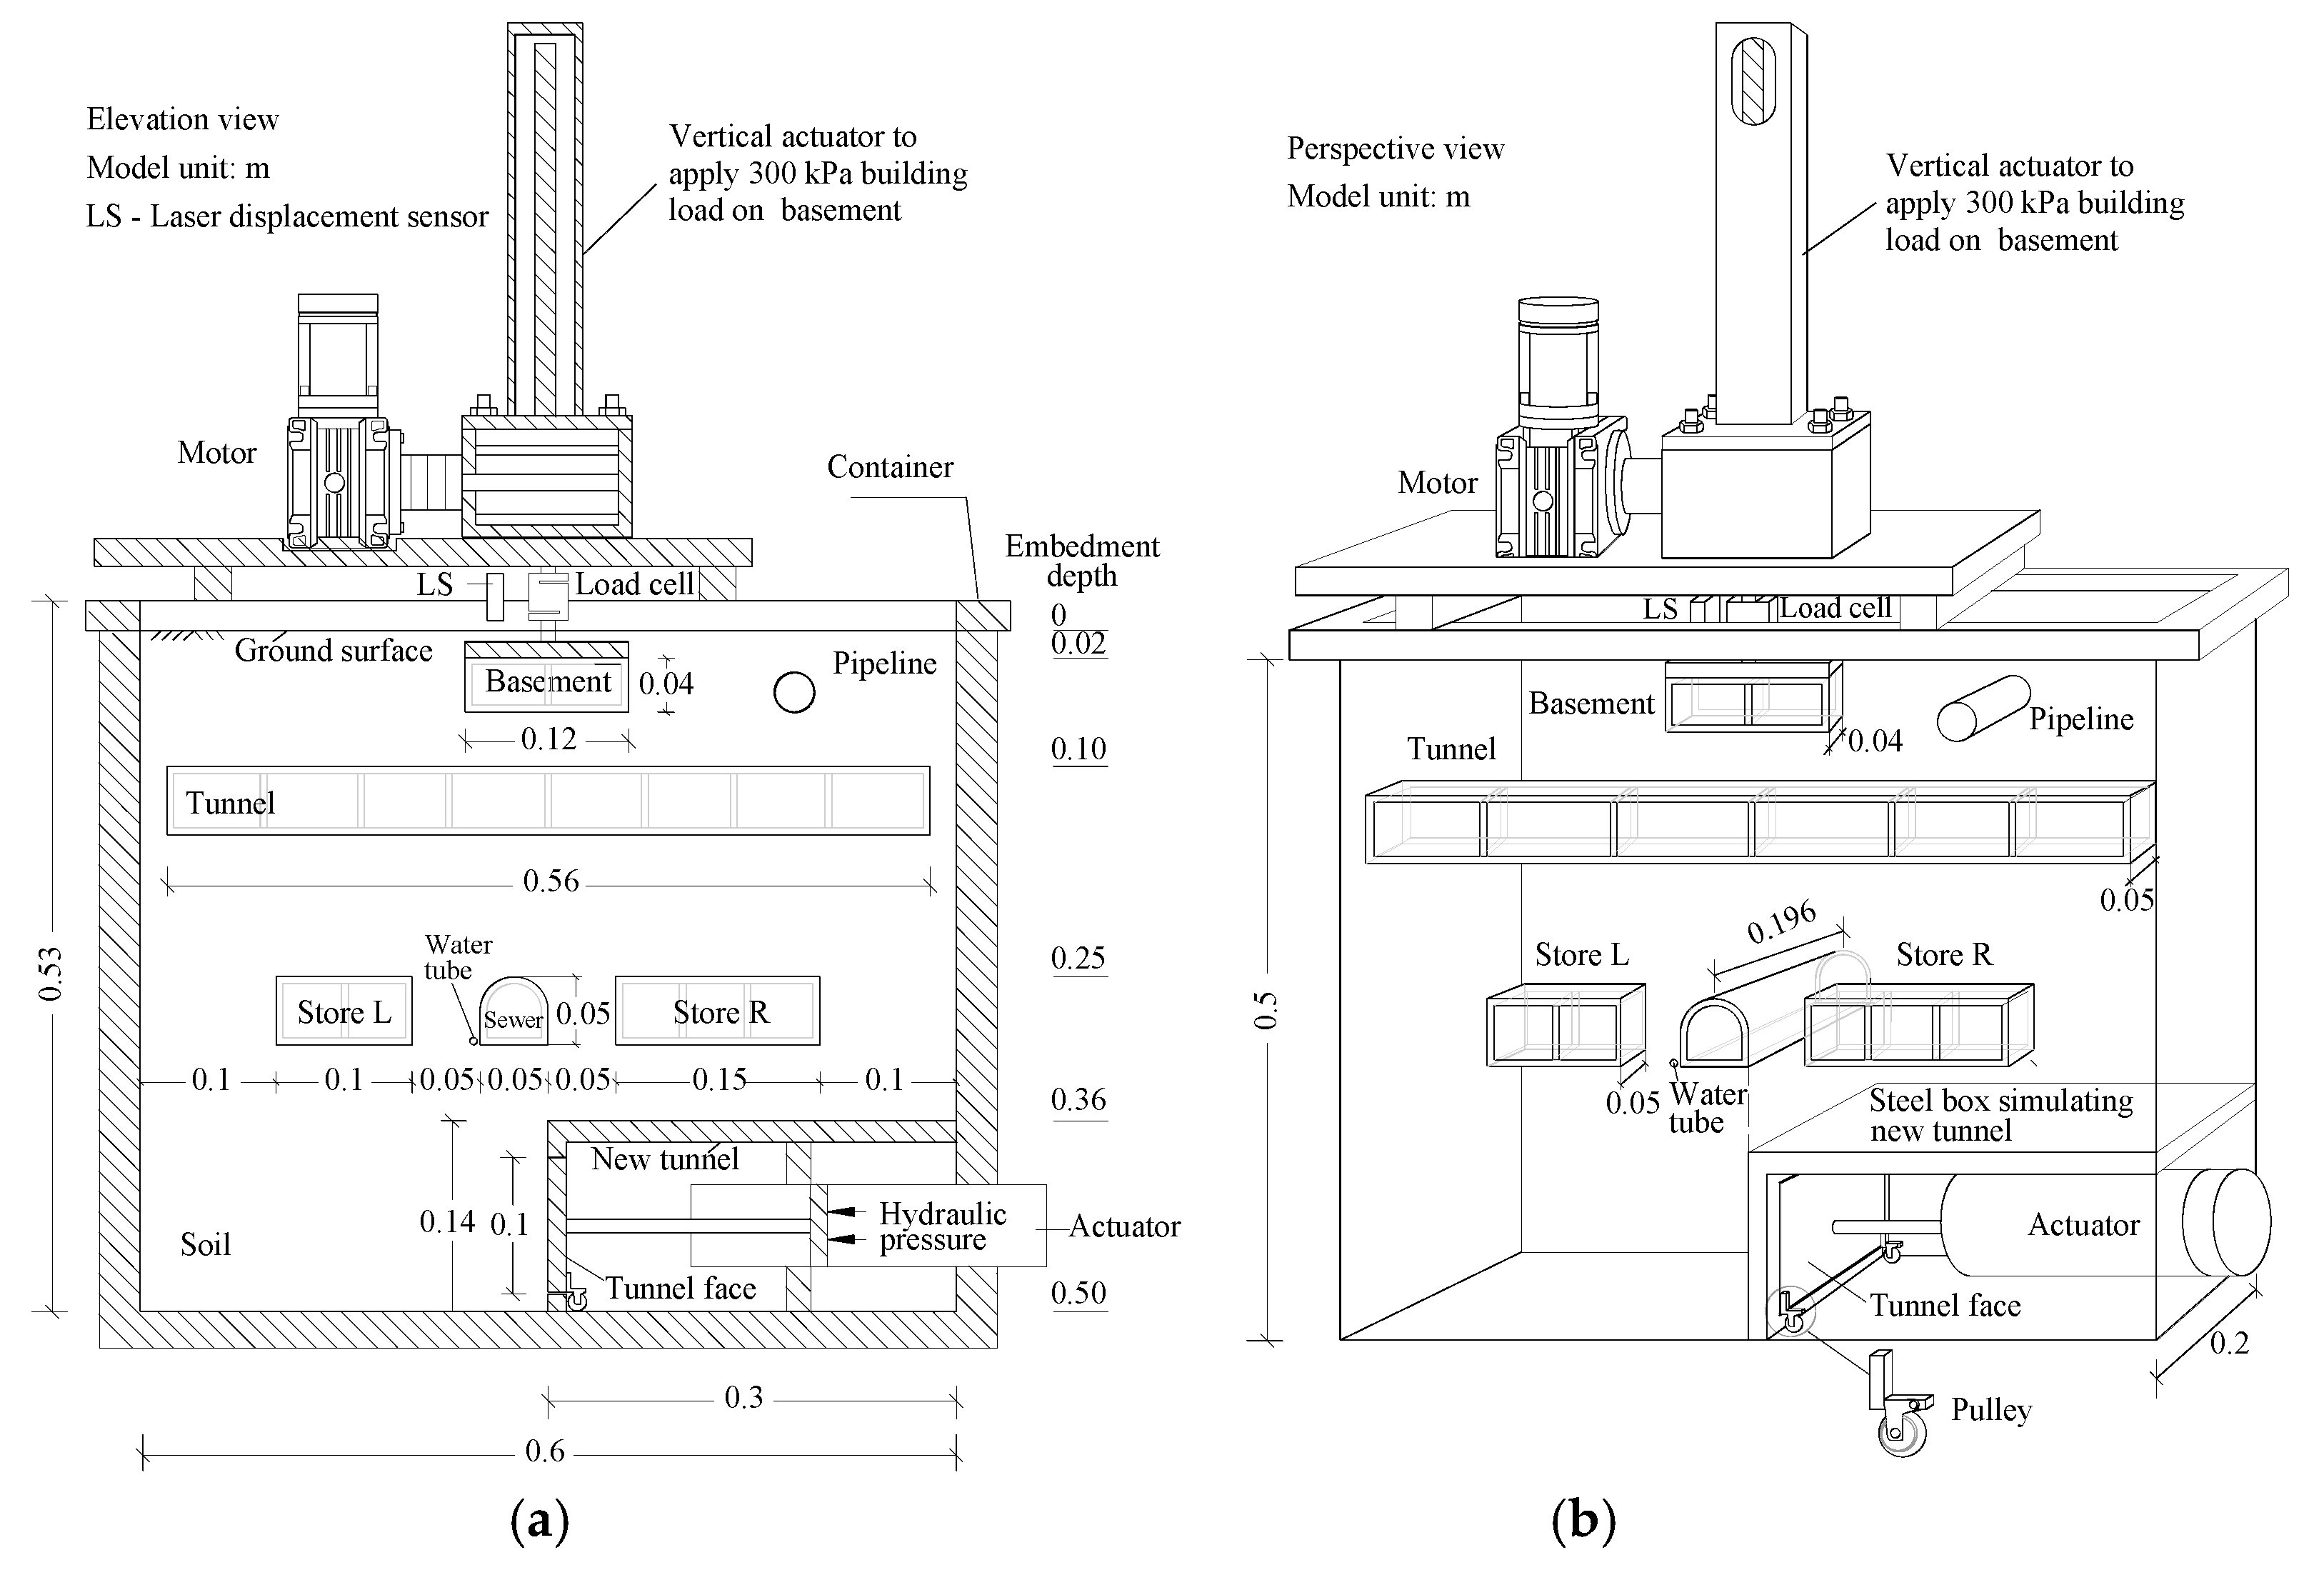
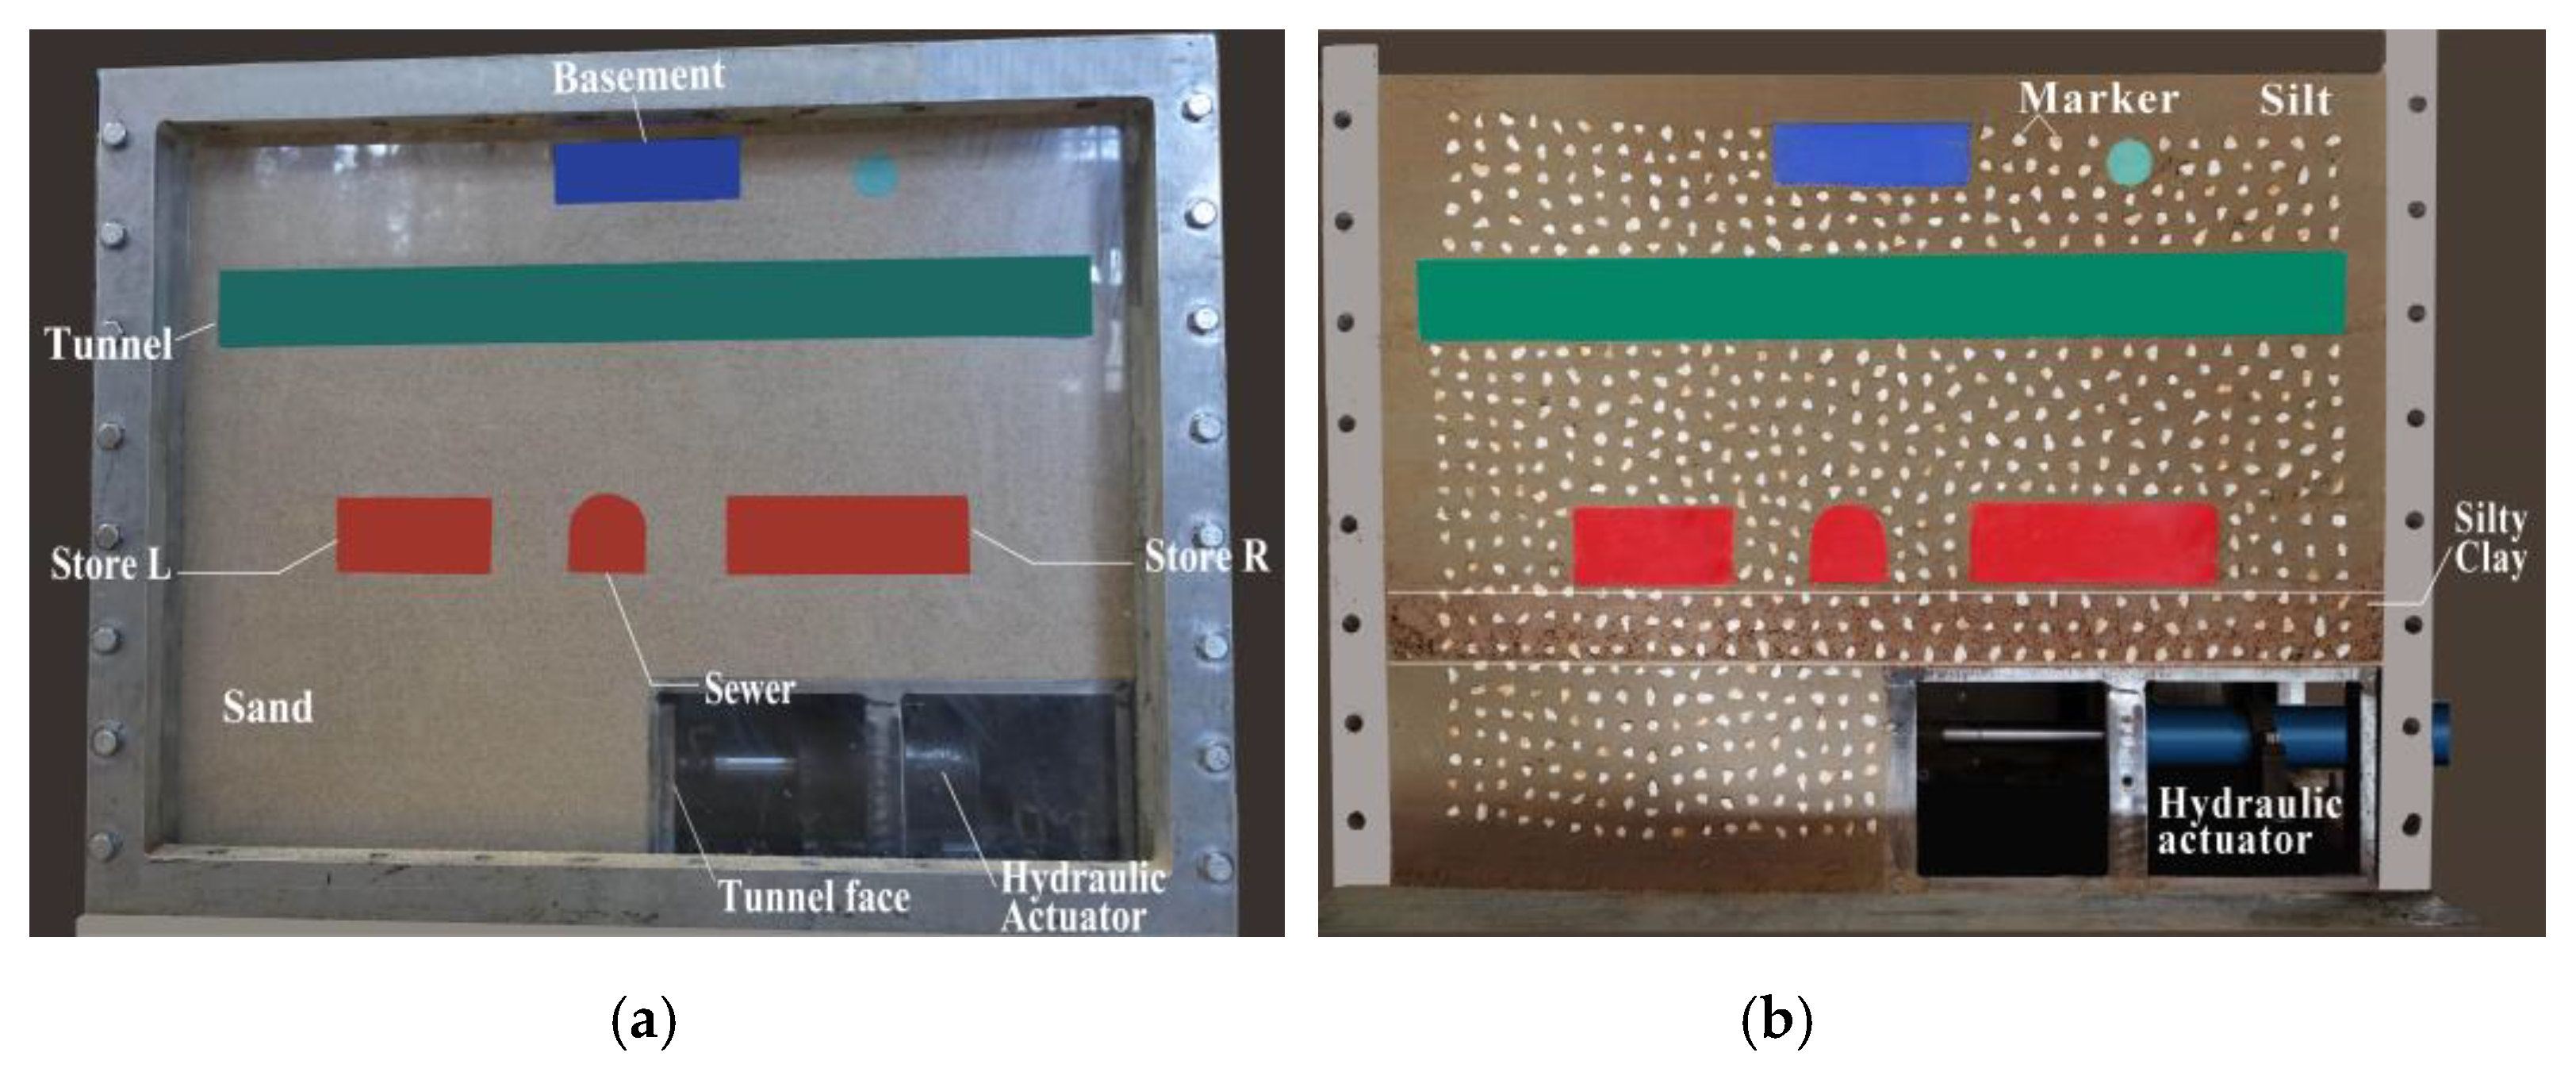
Figure 3 depicts the layout of the centrifuge model in a container. The container had internal dimensions of 0.6 m long × 0.2 m wide × 0.53 m high, accommodating existing underground structures underlaid by a new tunnel with a tunnel face at the center line of the container. A transparent front window enabled visual monitoring during the test. The model structures included a building basement of 0.12 m long × 0.04 m wide × 0.04 m high, a tunnel of 0.56 m × 0.05 m × 0.05 m and two storehouses (denoted as Store L of 0.1 m × 0.05 m × 0.05 m and Store R of 0.15 m × 0.05 m × 0.05 m) on either side of a sewer line (denoted as Sewer of 0.196 m × 0.05 m × 0.05 m).
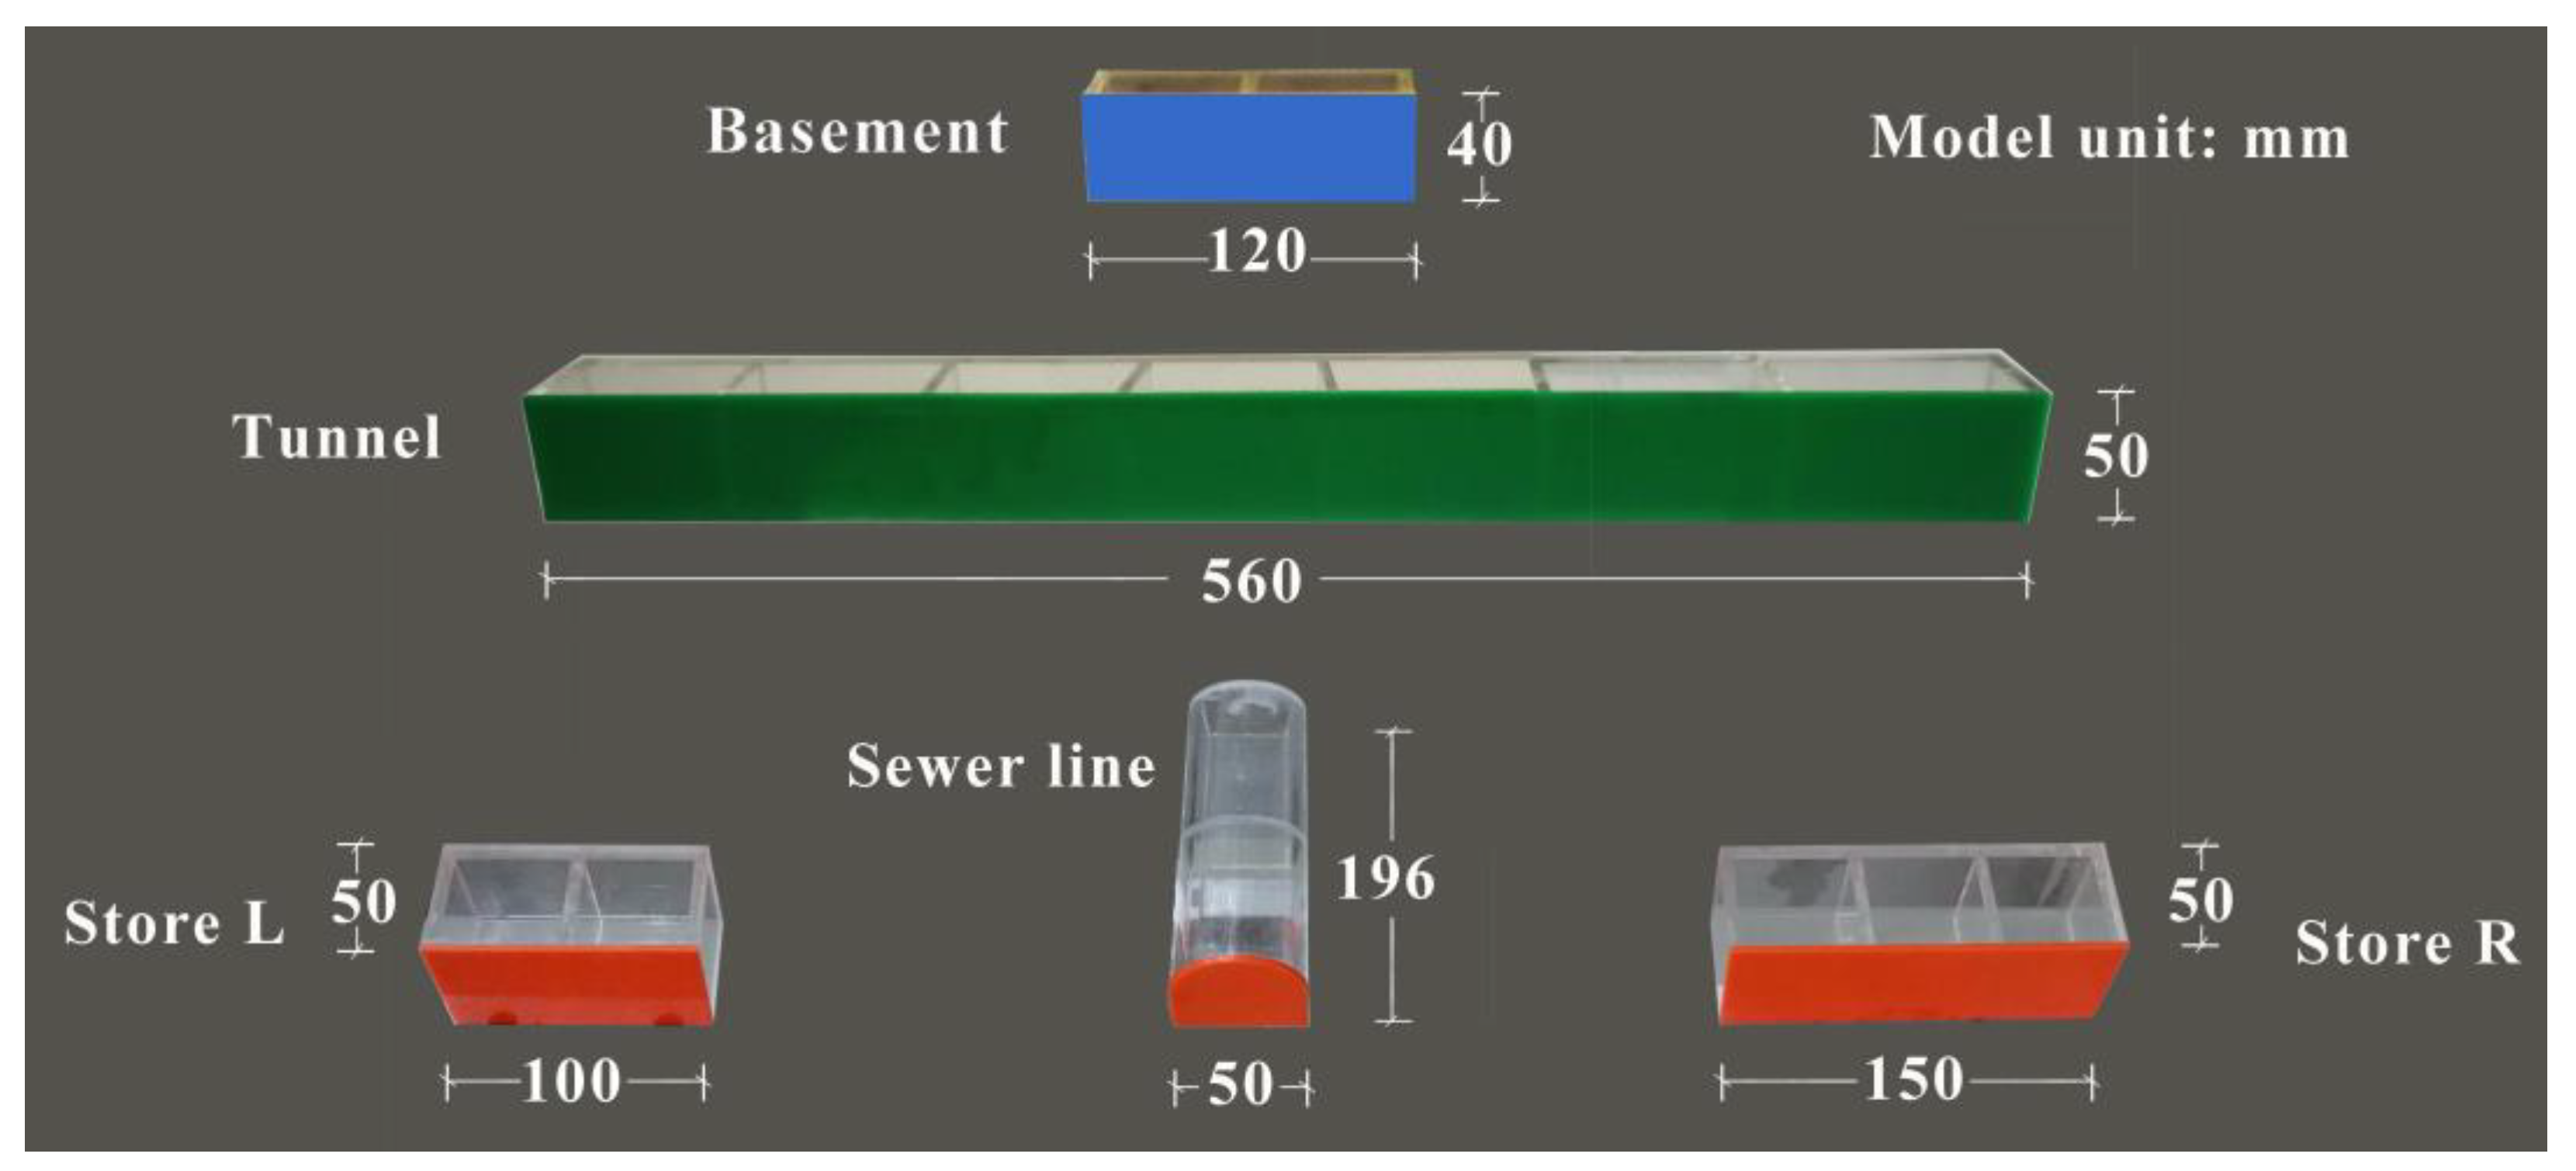
The soil depth in the container was 0.5 m. The embedment depths of the basement and the tunnel were 0.02 m and 0.1 m, respectively. The two storehouses and the sewer line were buried at the same depth of 0.25 m. The model structures were made from 5 mm thick transparent acrylic plates and a colored acrylic plate facing the front window, with supporting plates of the same material inside the box, as shown in
Figure 4. The stiffness of the model structure was measured to be 327 MPa. The length of the model tunnel (0.56 m) was smaller than the length (0.6 m) of the container, and the length of the model sewer line (0.196 m) was smaller than the width (0.2 m) of the container so that direct contact between the models and the interior of the container side could be avoided.
A new tunnel under construction was modeled with a steel box of 0.3 long × 0.2 wide × 0.14 m high at the bottom with a tunnel face of 0.16 m wide × 0.1 m high. The tunnel face of a steel plate was connected to a horizontal actuator mounted within the steel box. The actuator with hydraulic pressure on the right-hand side supported the face (
Figure 3a). It later applied hydraulic pressure on the opposite side to displace the tunnel face away from the soil, simulating the instability of the face. Two small pulleys were attached to the tunnel face, as shown in
Figure 3b, supporting the amplified weight of the face under 80 g, and contact was avoided between the face and the surrounding frame so that the frictional resistance at the areas of contact was reduced. This technique allowed the tunnel face to move smoothly under high centrifugal acceleration.
The centrifuge model tests were carried out in the geotechnical centrifuge at Tsinghua University [
40]. The soil models were scaled down to satisfy the principles of mechanical similitude between a model and its prototype [
41].
Table 1 summarizes the typical scaling factors for centrifuge model testing. For the centrifuge model at 80 g, the dimensions of the model and the displacements measured on the model were multiplied by 80 for the prototype.
2.2. Test Program
The test program had four models, as listed in
Table 2. The sand model consisted of uniform sand with a configuration as shown in
Figure 3, aiming to simulate sand flow caused by instability of the tunnel face. The low interlayer model, as shown in
Figure 5a, was made to reproduce partial collapse, limited to the front of the tunnel face, which comprised silt containing 0.05 m of thick silty clay beneath the sewer line. To evaluate the impact of overall collapse and compare the effects of soil properties and water, two models were used, i.e., the silt model consisting of uniform silt and the high interlayer model (
Figure 5b) containing 0.05 m of thick silty clay above the sewer line, as water is always a key factor involved in the safety of tunneling. A tiny tube was placed above the silty clay to bring water into the soil in the two interlayer models.
2.3. Soil Properties and Model Preparation
Table 3 summarizes the properties of the three soils. The sand is a clean medium of sand with a mean grain size (D50) of 0.34 mm. It was compacted into a container with a dry density of 1660 kg/m
3 for the sand model. The sand was dense and firm at this density. The model structures, facing the front window, were placed at the designated locations during the compaction process, as shown in
Figure 6a. The front window was removed after the preparation of the centrifuge model to place markers that were used to trace the movement of soil during the test, and it was then assembled back afterwards. A frictional coefficient between the model structures and the front window was estimated to be 0.3–0.4. It may have had a slight effect on the measured displacements of the model. To facilitate the placement of the markers, the sand was sprayed with a low water content of about 4%.
The silt had a plasticity index of 6.5 and was compacted with a water content of 8% and a dry density of 1500 kg/m
3. Saturated and drained triaxial tests were conducted to obtain the effective shear strength parameters of the sand and the silt. The silty clay had a plasticity index of 15.8, exhibiting high plasticity. The maximum dry density was 2287 kg/m
3 at a water content of 15% from a laboratory standard compaction test (ASTM D698). The silty clay was compacted with a water content of 17% and a dry density of 1600 kg/m
3 for the two interlayer models. It had a cohesion of 54 kPa and an internal friction angle of 14o through consolidated undrained triaxial tests at a water content of 17%. Markers of small white pebbles were used for the silt model and the two interlayer models, as shown in
Figure 6b. The transparent wall was removed for the placement of the markers and was assembled back afterwards.
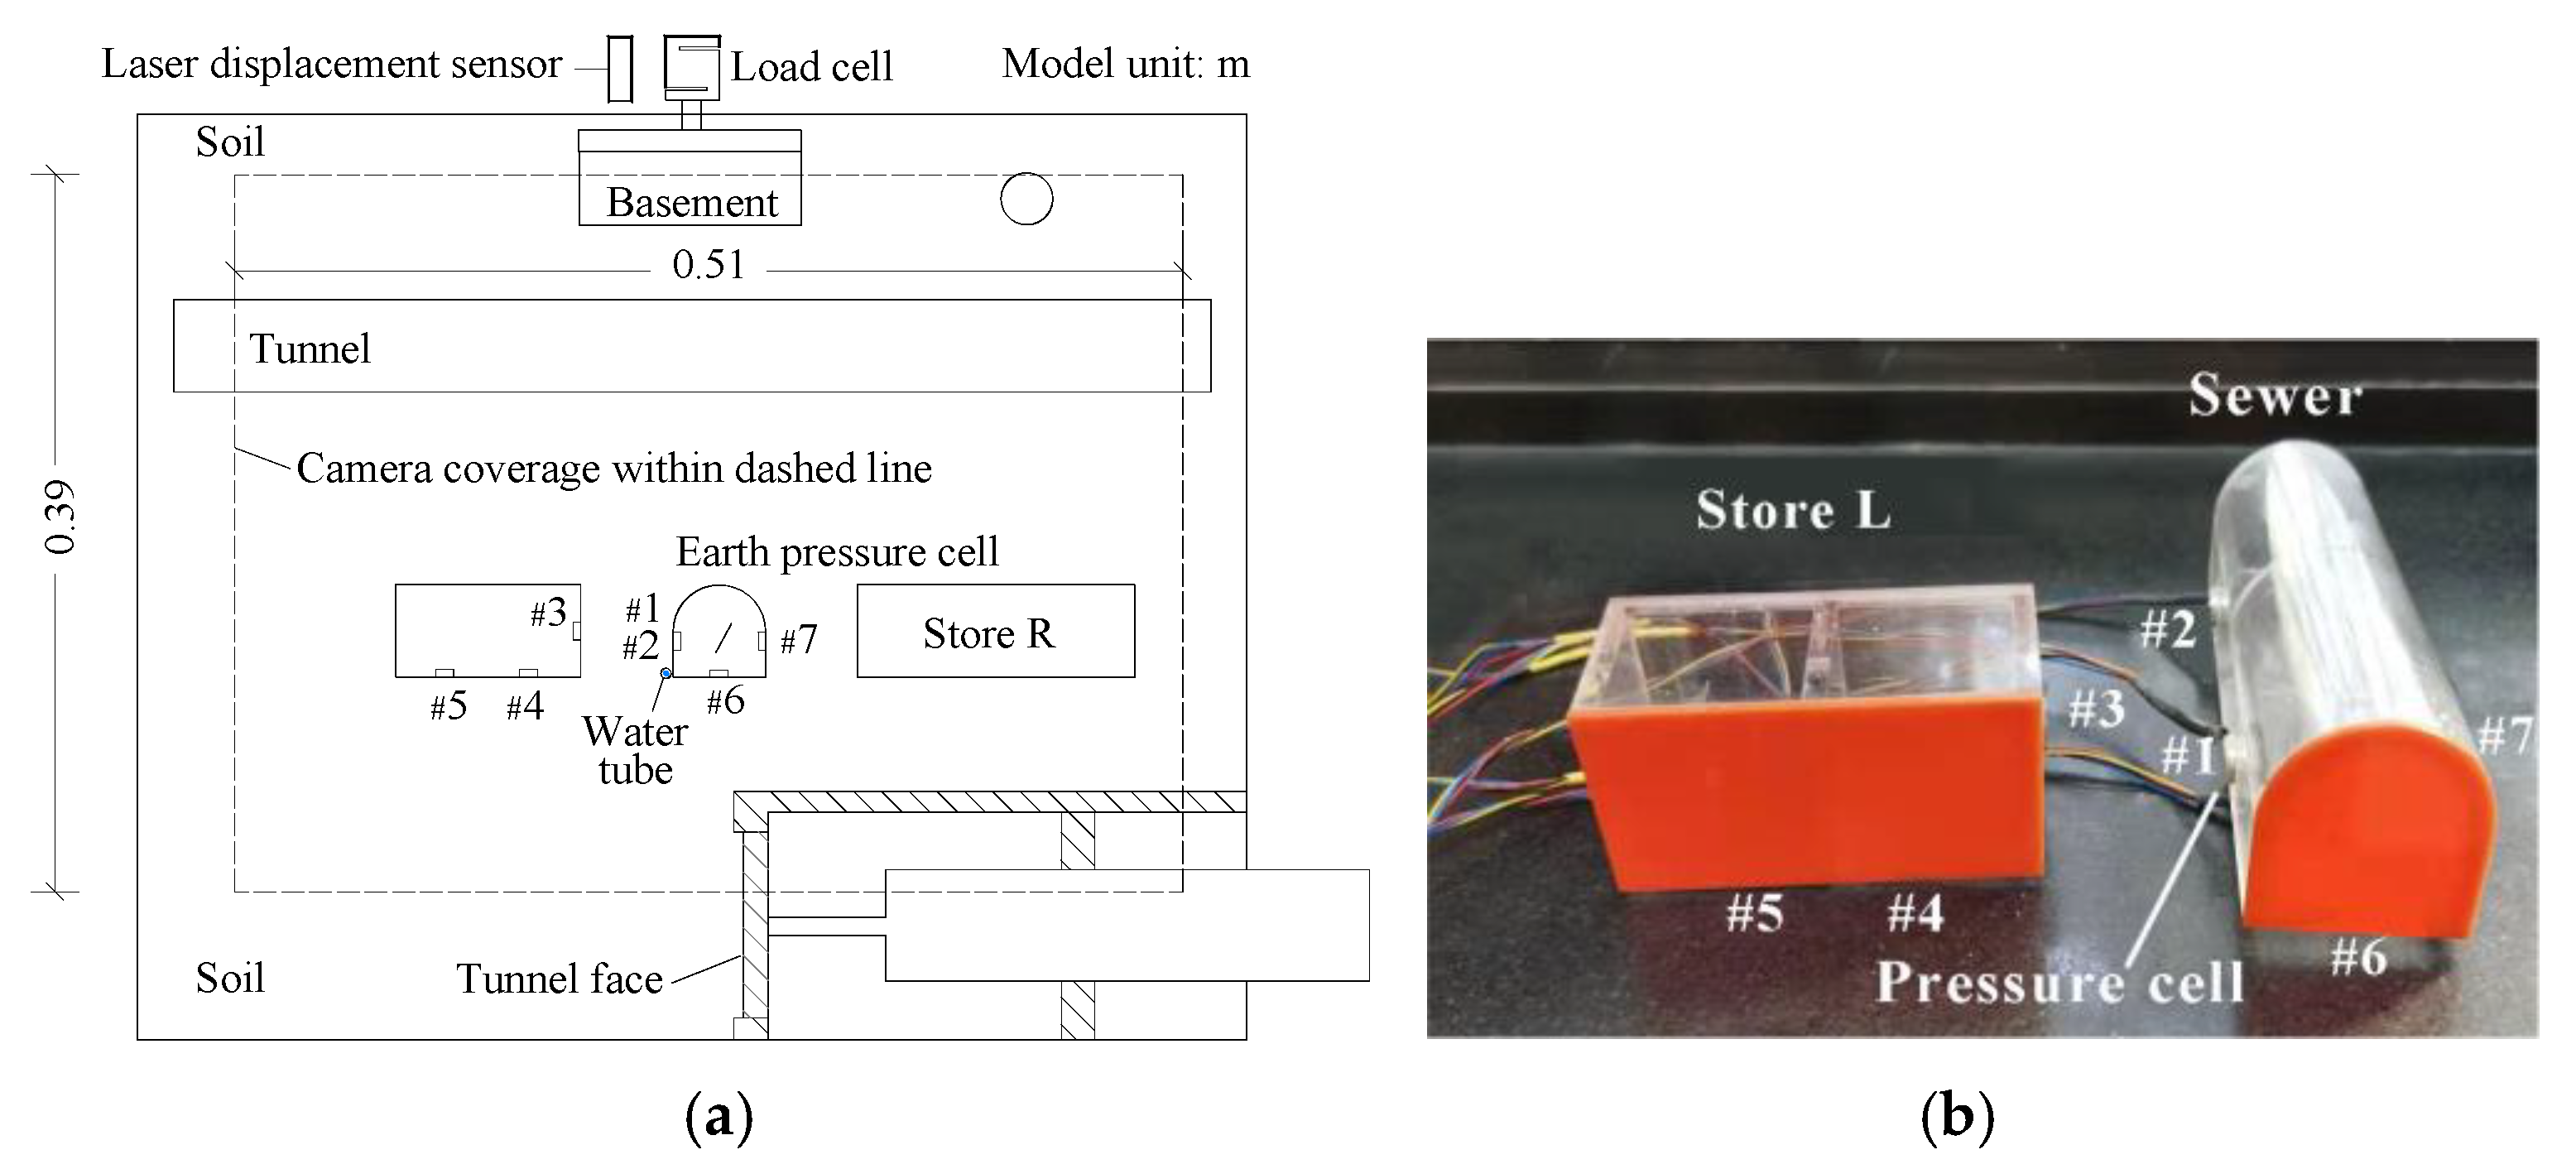
2.4. Instrumentation and Modeling Procedures
Figure 7 shows the instrumentation used in the model. A surcharge loading of 300 kPa, measured by a load cell, was applied to the basement to simulate the weight of the building. A non-contact laser displacement sensor was installed to measure the settlement of the ground surface. Seven tiny pressure cells were used: Nos. #1 and #2 were embedded on the left side of the Sewer, No. #3 was embedded on the right side of Store L, Nos. #4 and #5 were embedded on the base of Store L, and Nos. #6 and #7 were embedded on the base and right side of the Sewer to monitor the earth pressures. Unfortunately, the performance of the pressure cells deteriorated over time due to significant soil displacement. A digital black and white video camera was placed in front of the transparent side wall covering an area of 0.51 m–0.39 m, as indicated by dashed lines in
Figure 7a. A photo-imaging technique was used to accurately measure the displacements of the soil and the structures by tracing the markers [
39,
40].
The centrifuge model was consolidated at 80 g first under self-weight and then under the surcharge load, and it terminated when the readings of the displacement sensor became stable. The deformations during consolidation were measured and deducted in the process under construction disturbance. Following consolidation, the tunnel face moved toward the right at about 10 mm with each step. The induced movement of the soil and the structures were recorded continuously by the video camera at 20 frames/s. Images of key phenomena could be captured during the test. The data logger for the earth pressure cells was set to record data at 0.1 Hz
3. Results and Discussions
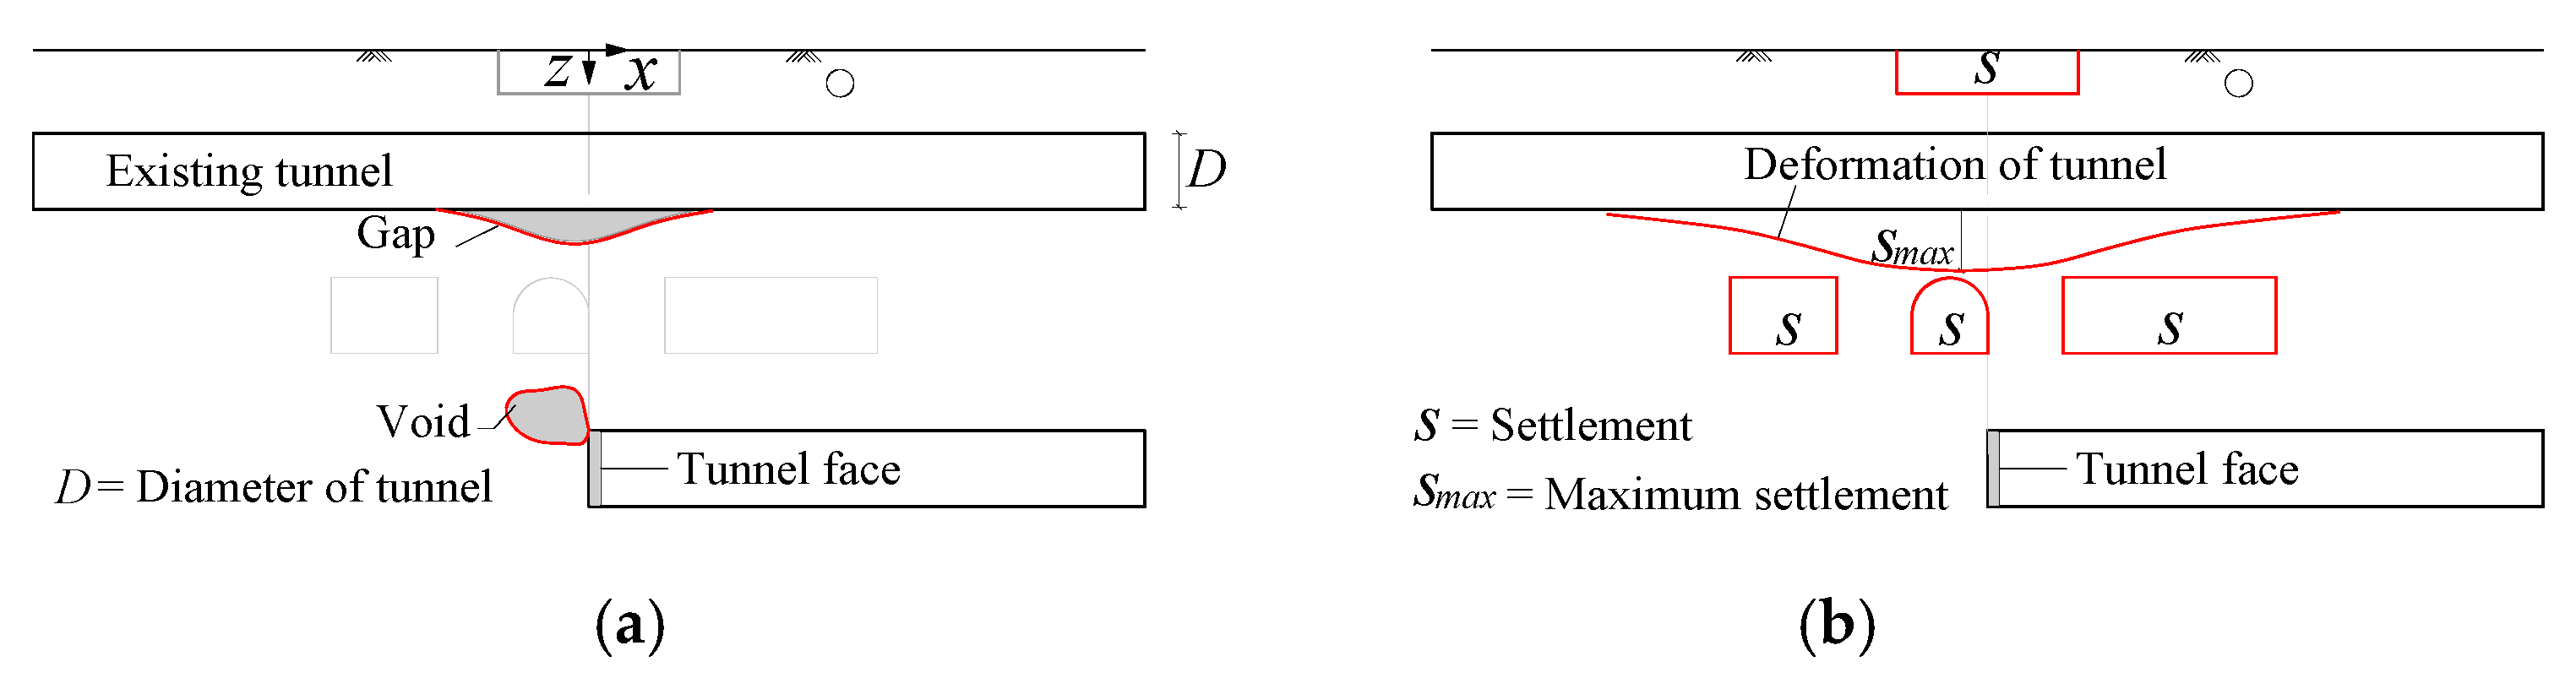
The displacements measured on the model were multiplied by 80 for the prototype with a unit of m, and the underground water in kilograms used the model’s scale. A two-dimensional description was adopted so that a major mechanism developed in the model could be captured. The geometries of the gap beneath the structures and the void induced by soil failure are depicted in
Figure 8a, in which
D = 4 m is the diameter of the tunnel. Settlement
S and tilt are indicated in
Figure 8b for the basement, the storehouses and the sewer line. Deformation along the longitudinal length of the existing tunnel is highlighted in
Figure 8b, in which
Smax is the maximum deformation.
3.1. Sand Flow
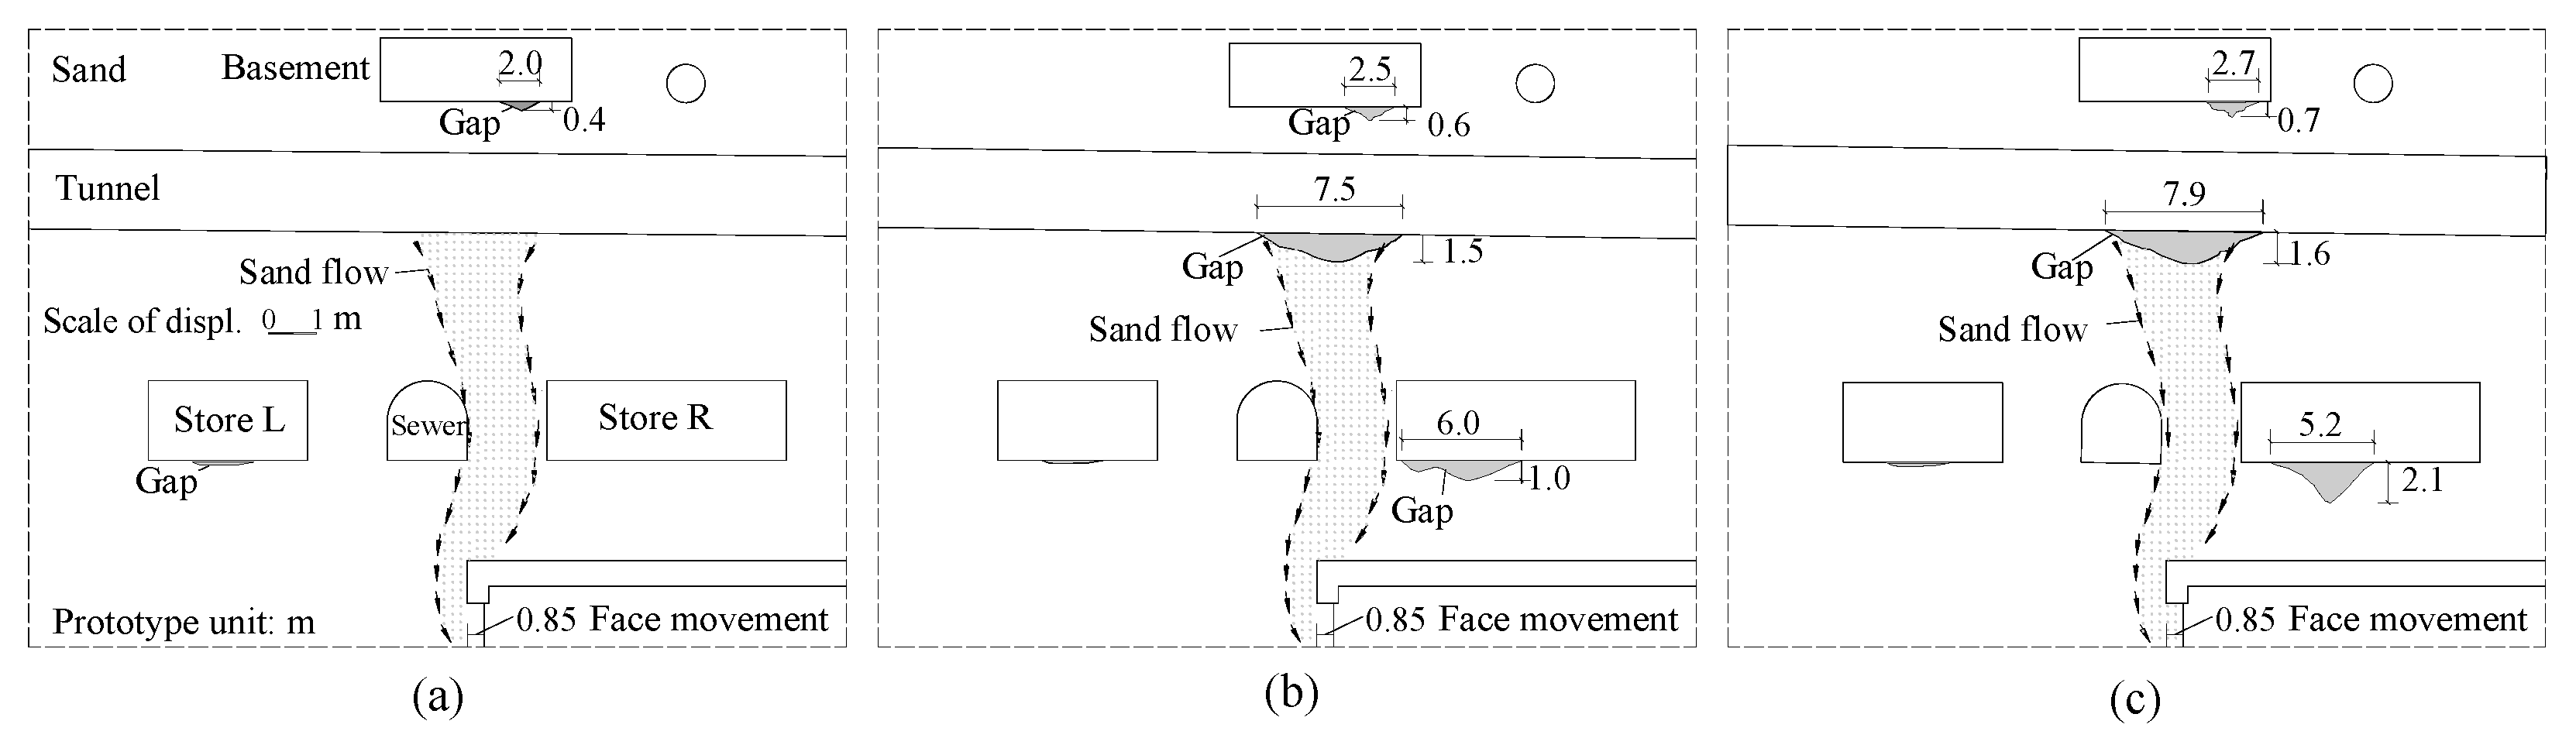
Following the instability of the tunnel face as shown in
Figure 9a in the sand model, which moved 0.85 m away from its initial position, sand flow occurred instantly, as reported in case studies [
1], with a chimney-like mechanism above the tunnel face [
9]. The existing tunnel then promptly deformed and tilted conspicuously. Through tracing the movement of some markers in the flow zone, soil displacements could be estimated to be 0.5 m. The position of the tunnel face remained, but the sand continuously flowed into the new tunnel. Gaps consequently formed beneath the basement, the existing tunnel and the storehouses, as shown in
Figure 9b. A 0.13 m settlement was found at the basement, and the sewer line tilted 1 degree. The gaps expanded as shown in
Figure 9c when sand flow terminated.
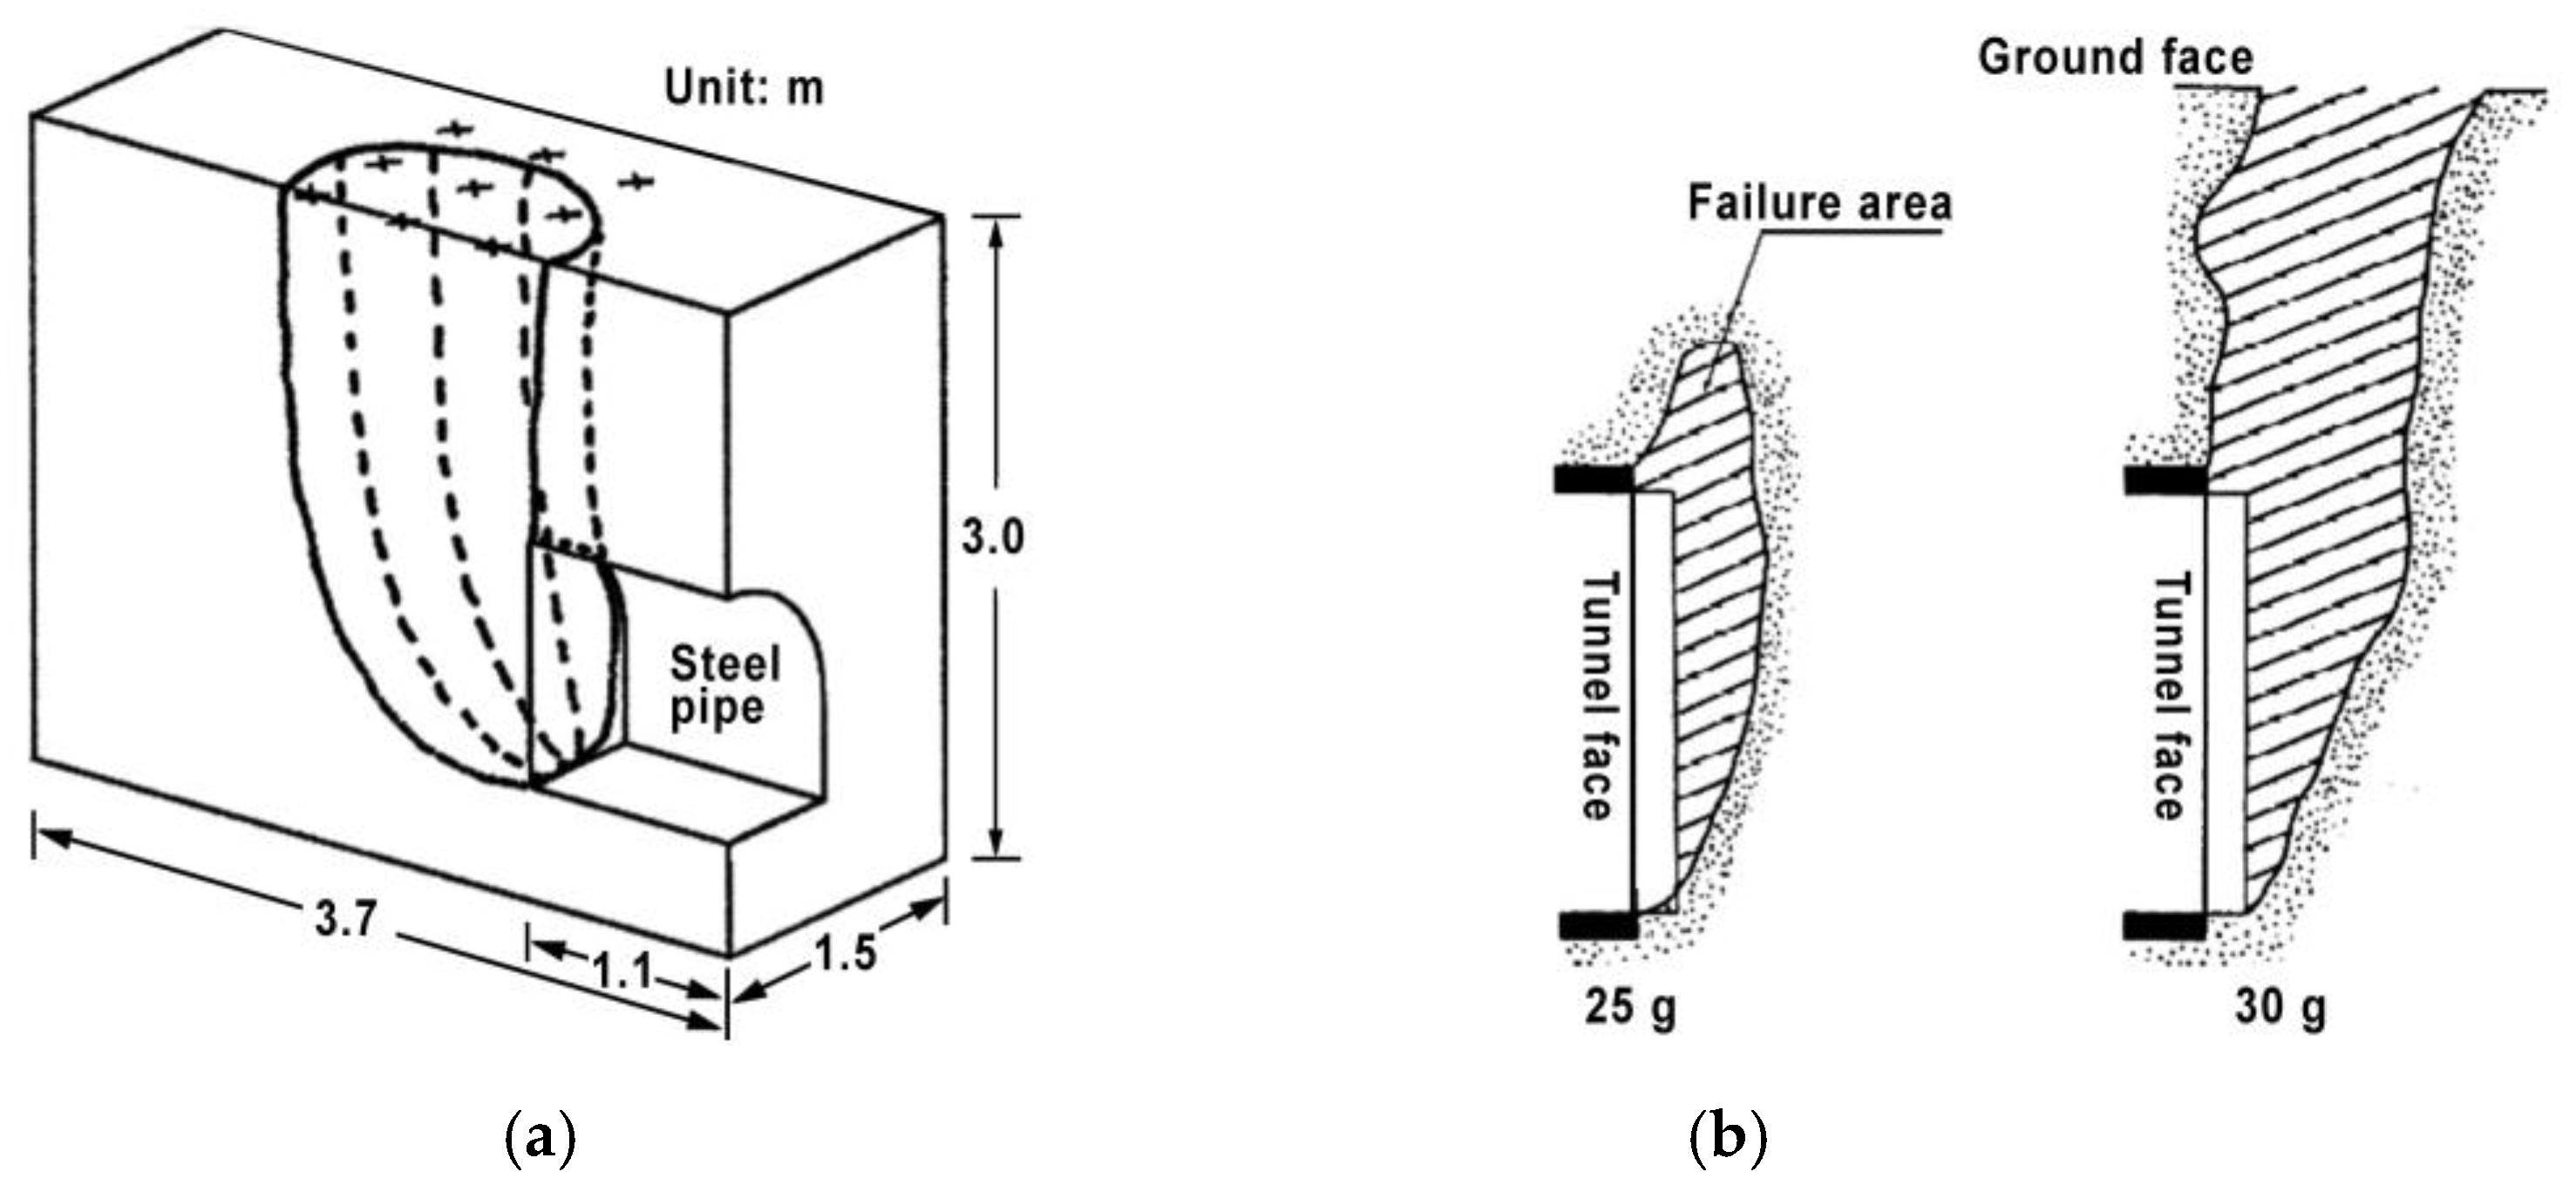
Failure patterns induced by tunnel face stability have been revealed by greenfield models in sand.
Figure 10a shows the recoded failure pattern in a large-scale 1 g model conducted by Sterpi et al. [
28]. The failure resulted from air pressure reduction at the tunnel face and extended to the ground surface. Kamata and Masimo [
25] showed similar failure patterns through centrifuge tests. The failure appeared in the vicinity of the tunnel face at 25 g and extended to the ground surface at 30 g. The observed failure mechanism in this study is similar to that reported by Sterpi et al. [
25] and Kamata and Masimo [
22]. However, the presence of the sewer line and the storehouse influenced the shape of the flow zone, and the existing tunnel prevented the flow zone from extending to the ground surface. In fact, the flow zone bypassed the tunnel and the basement and still reached the ground surface.
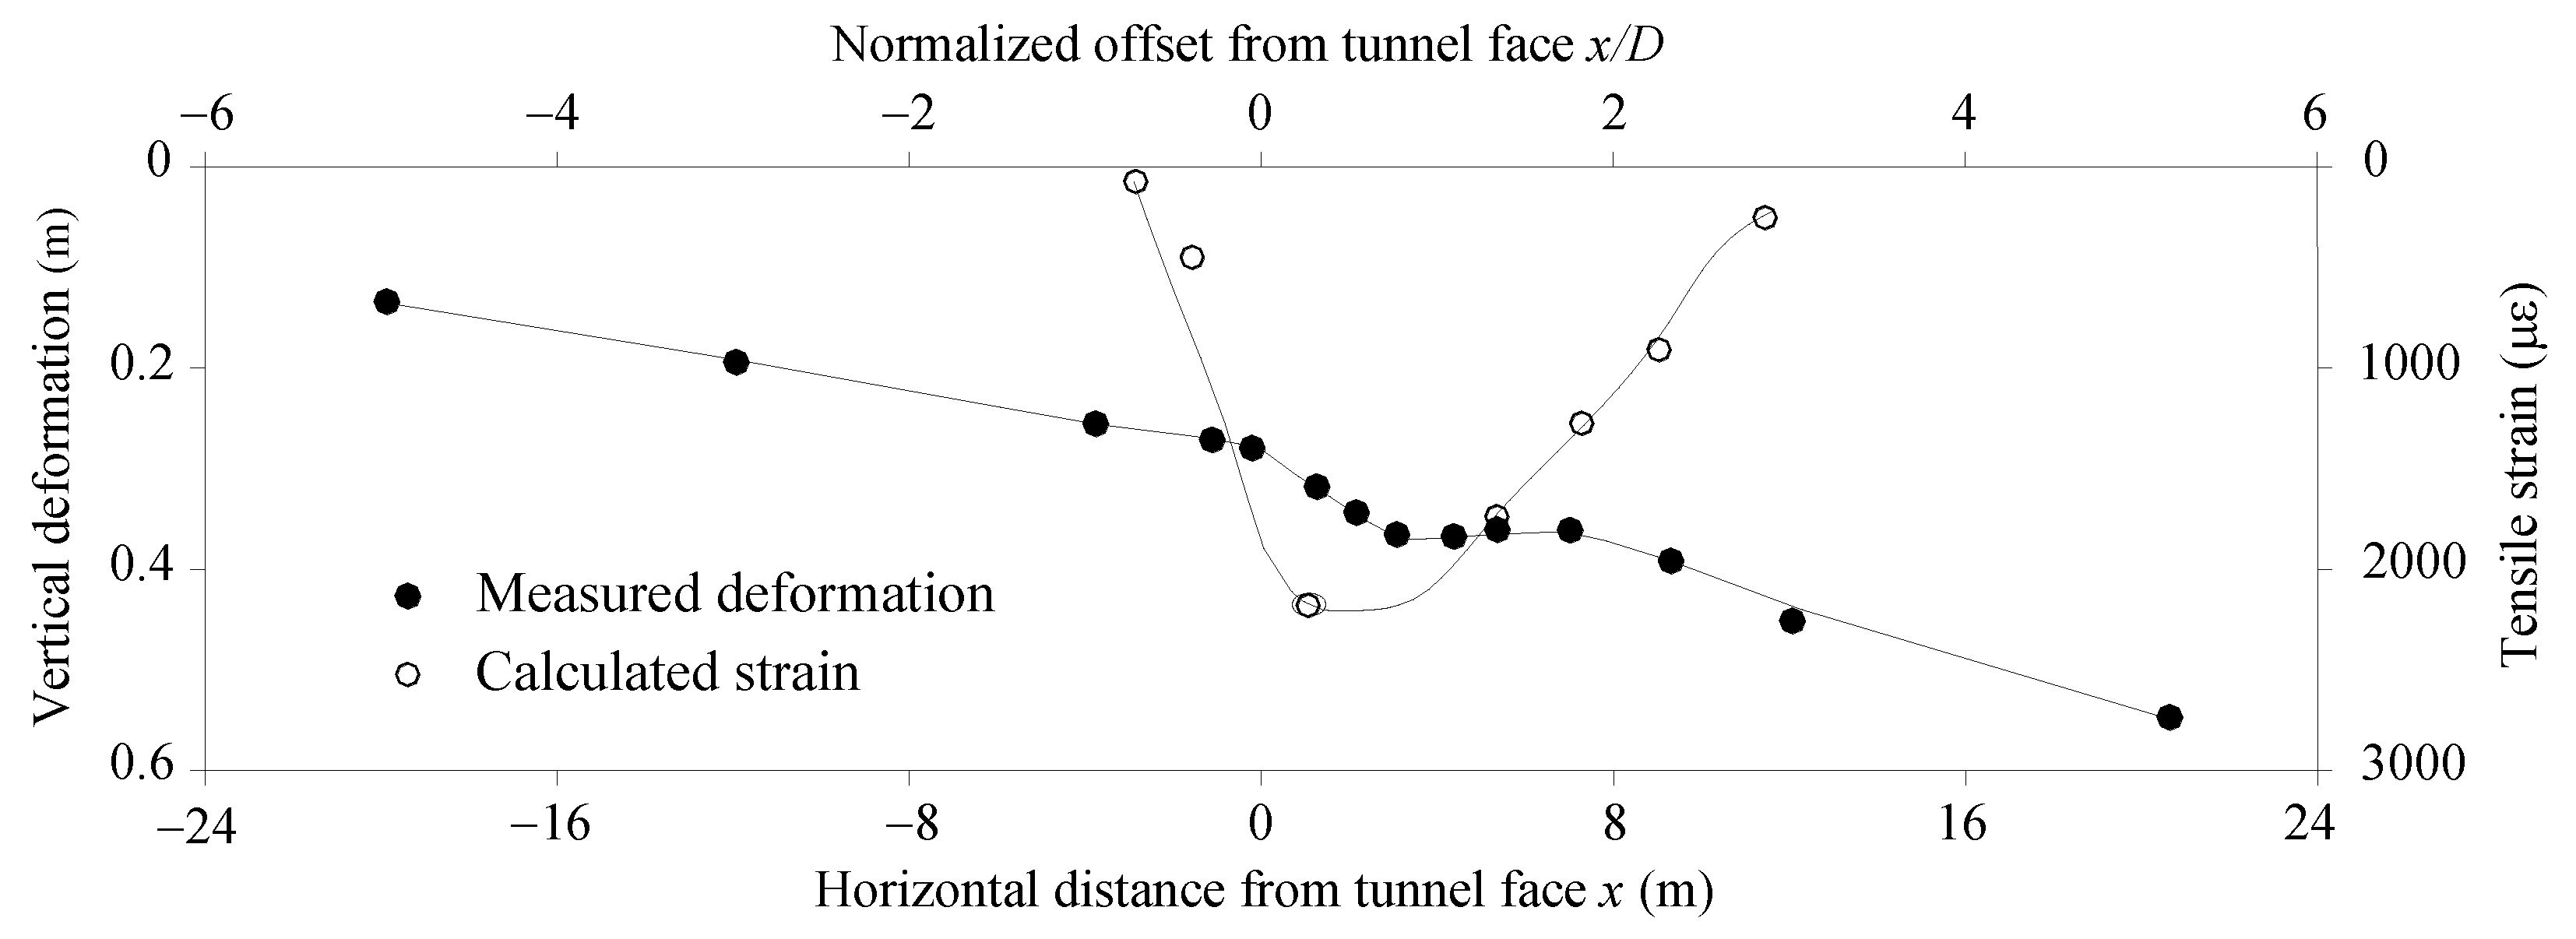
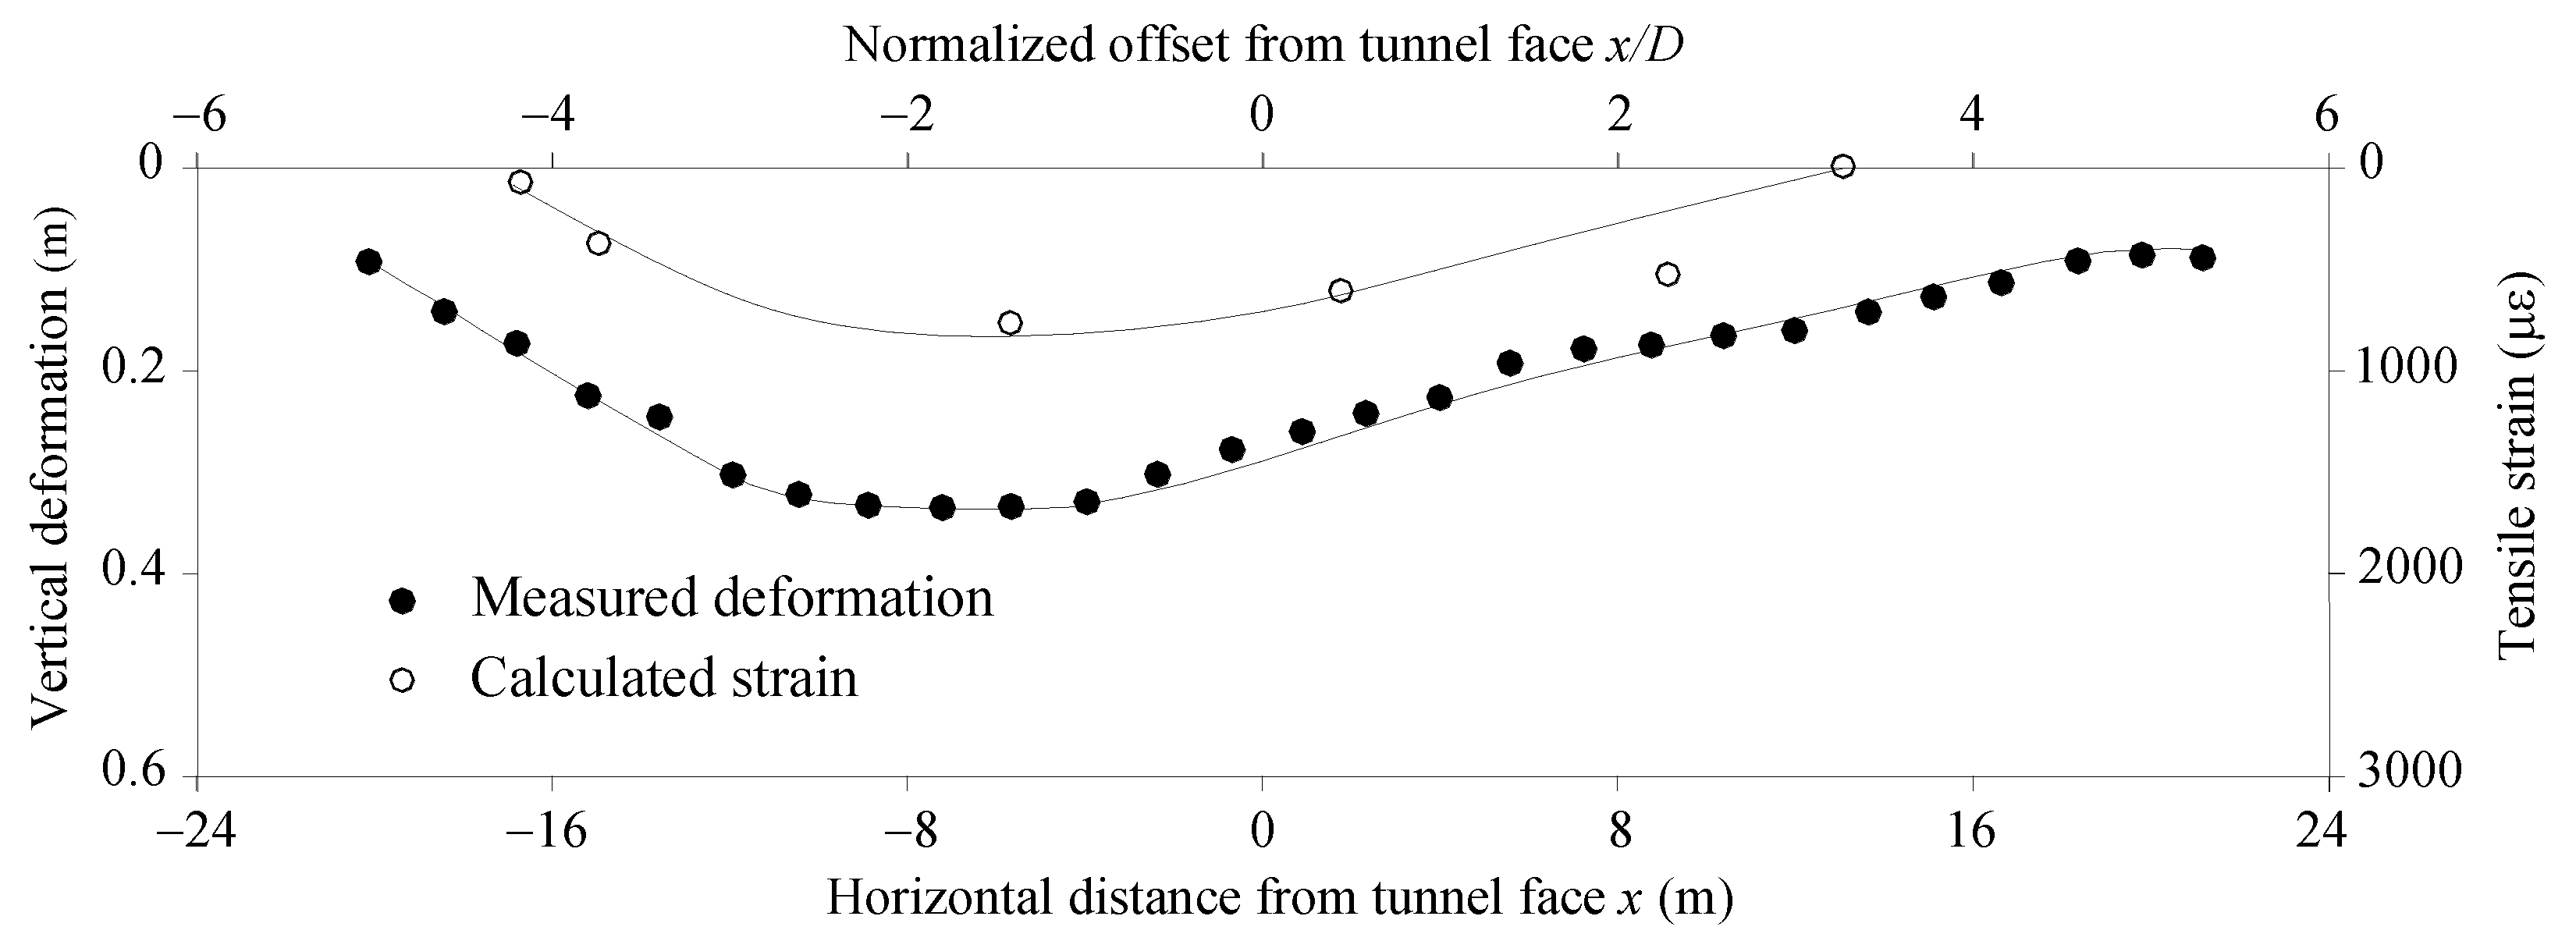
Deformations of the existing tunnel were measured through image analysis when the sand flow terminated (
Figure 9c), and the induced tensile strains were estimated by considering the tunnel to be equivalent Timoshenko beam [
41], as shown in
Figure 11, in which
x is the distance from the tunnel face. The tunnel generally tilted 1 degree toward the right, which may be attributed to the free contact at the end. As the sand flow was sudden, bending concentrated at the location above the sand flow. Compared with the disturbance induced by tunneling [
26,
37], the scale of the construction disturbance was very extensive and, as a consequence, the maximum induced tensile strain was 2100 με, which could cause severe damage to the tunnel.
3.2. Partial Failure
Partial failure refers to a failure zone limited in front of the tunnel face in cohesive soil due to an arching effect.
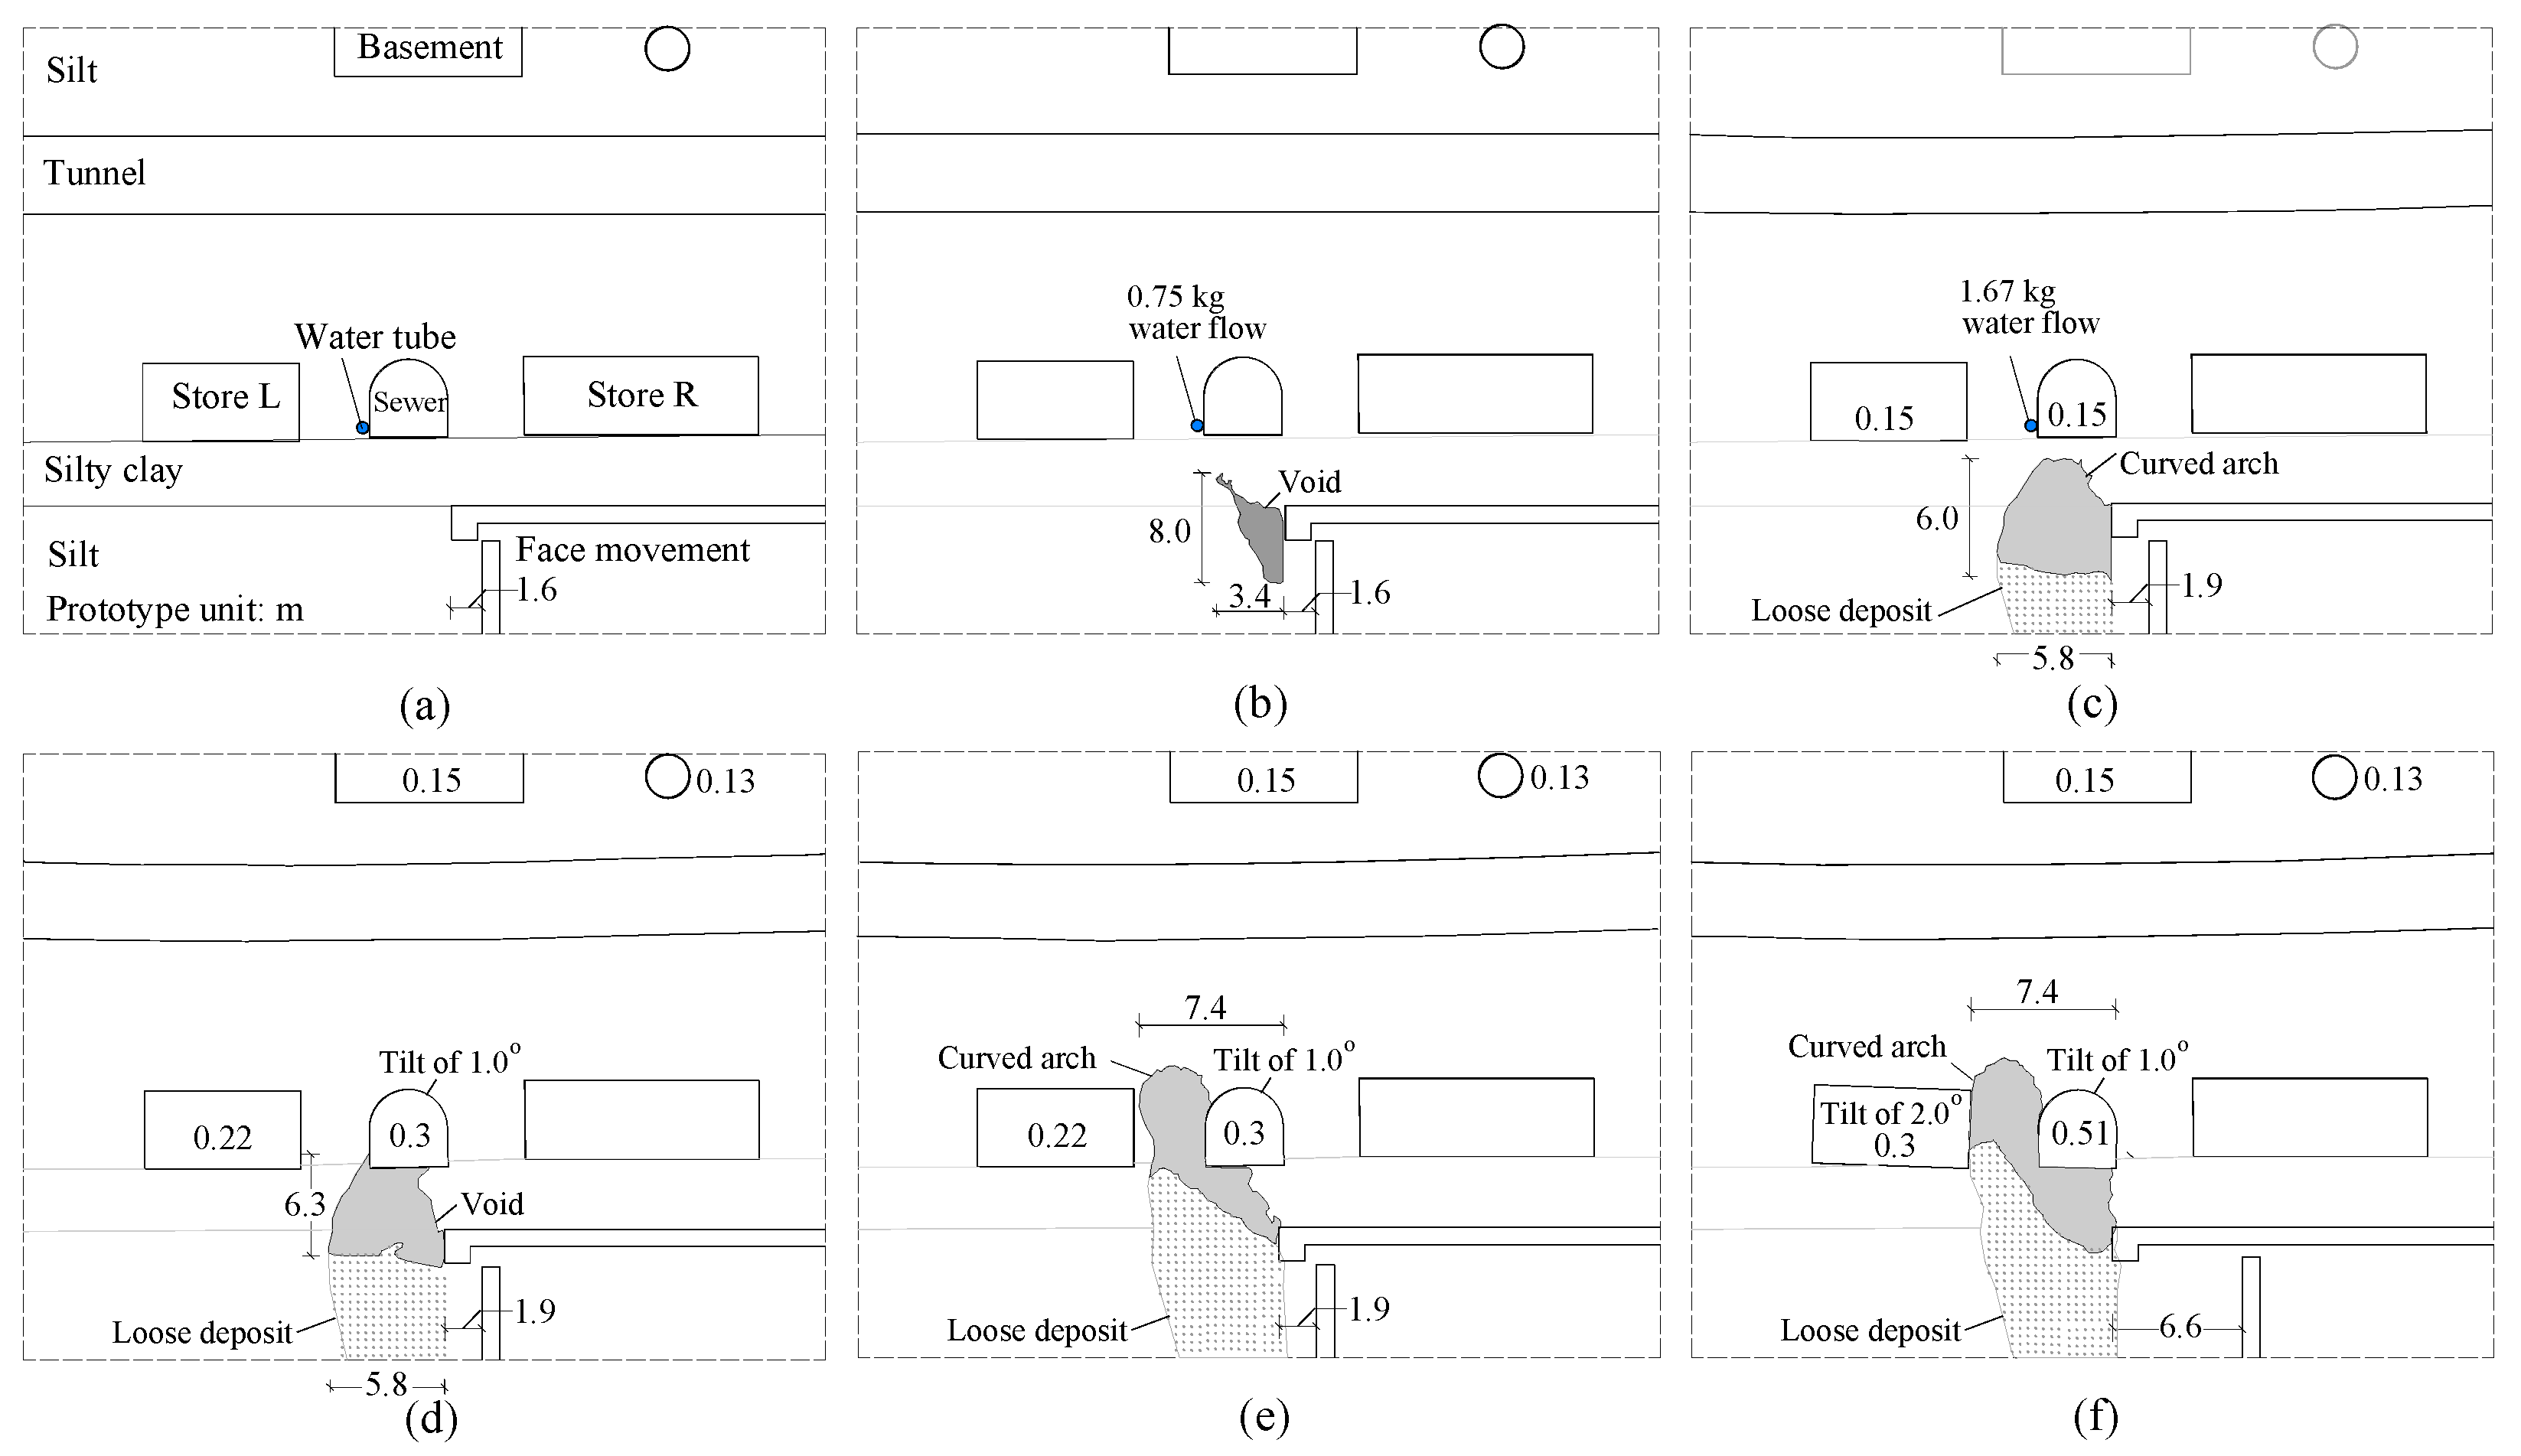
Figure 12 depicts the geometry of the failure zone for different tunnel face movements in the low interlayer model. In the beginning, the soil remained stable even when the tunnel face moved 1.6 m, as shown in
Figure 12a. Then, water was brought in at a speed of 1.67 kg per minute and lasted for one minute, and it gushed down under high centrifugal acceleration and caused a void of 3.4 m wide and 8.0 m high (
Figure 12b) in front of the face. At the end of water discharge (total water amount of 1.67 kg), the tunnel face moved from 1.6 m to 1.9 m, and a curved arch formed in the silty clay stratum, as shown in
Figure 12c. The soil failure continued to propagate and break through the silty clay, resulting in increments of structure settlement and tilt (
Figure 12d). A curved arch formed in the silt, as indicated in
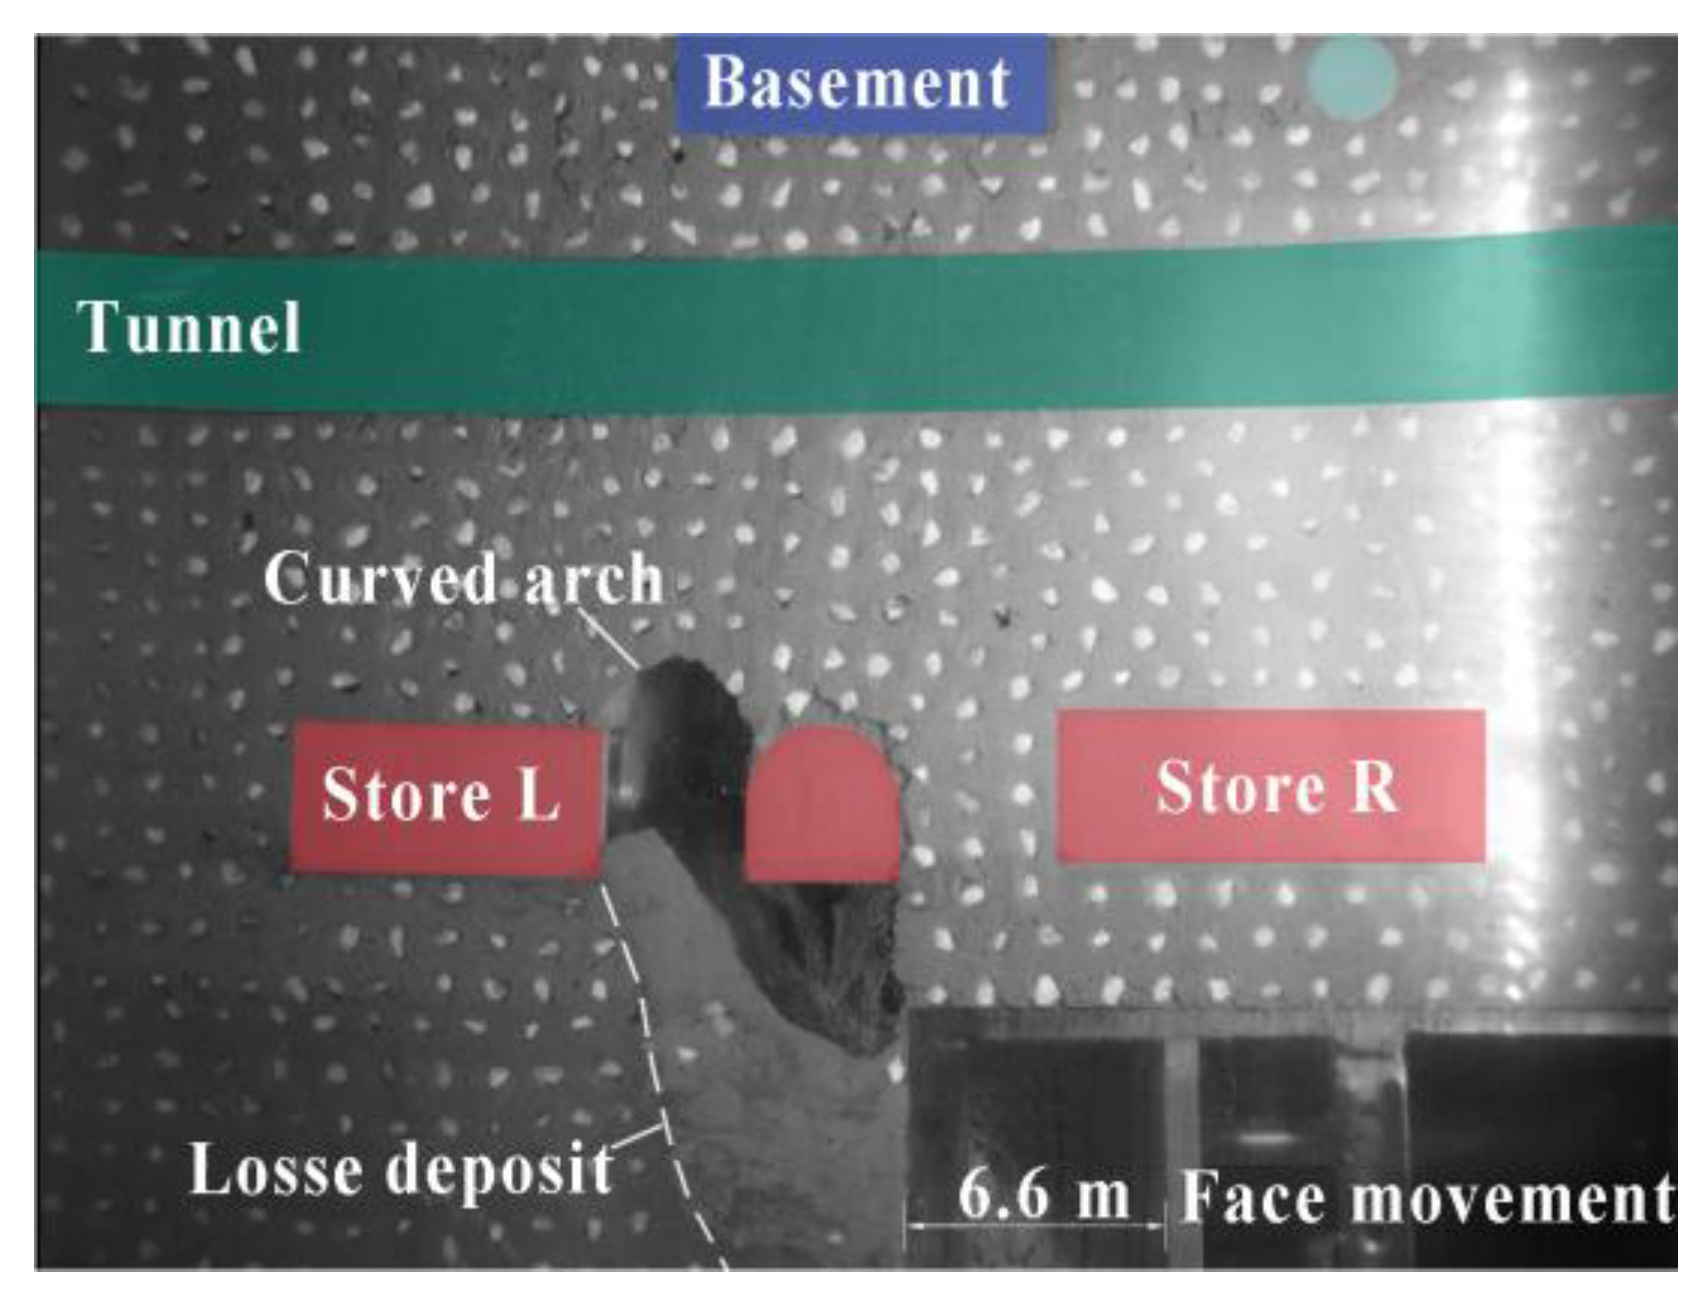
Figure 12e, which prevented the failure from developing upward. Therefore, later, when the tunnel face moved significantly from 1.9 m to 6.6 m, no further failure happened, as shown in
Figure 12f and
Figure 13.
Figure 14 illustrates the measured maximum deformations and calculated tensile strains of the existing tunnel at face movements of 6.6 m. Compared to the sand model, the arching had a strong effect on the deformations and induced strains on the existing tunnel. As the failure zone was limited, its impact on existing tunnel was greatly reduced. Consequently, the maximum settlement of the tunnel was 0.15 m, much lower than that in the sand model. The maximum strain in the low interlayer model was 850 με, only 40% of that in the sand model. However, the presence of the flexible interlayer of the silty clay may have increased the bending through width of the tunnel and thus had a greater influence on the performance of adjacent underground structures.
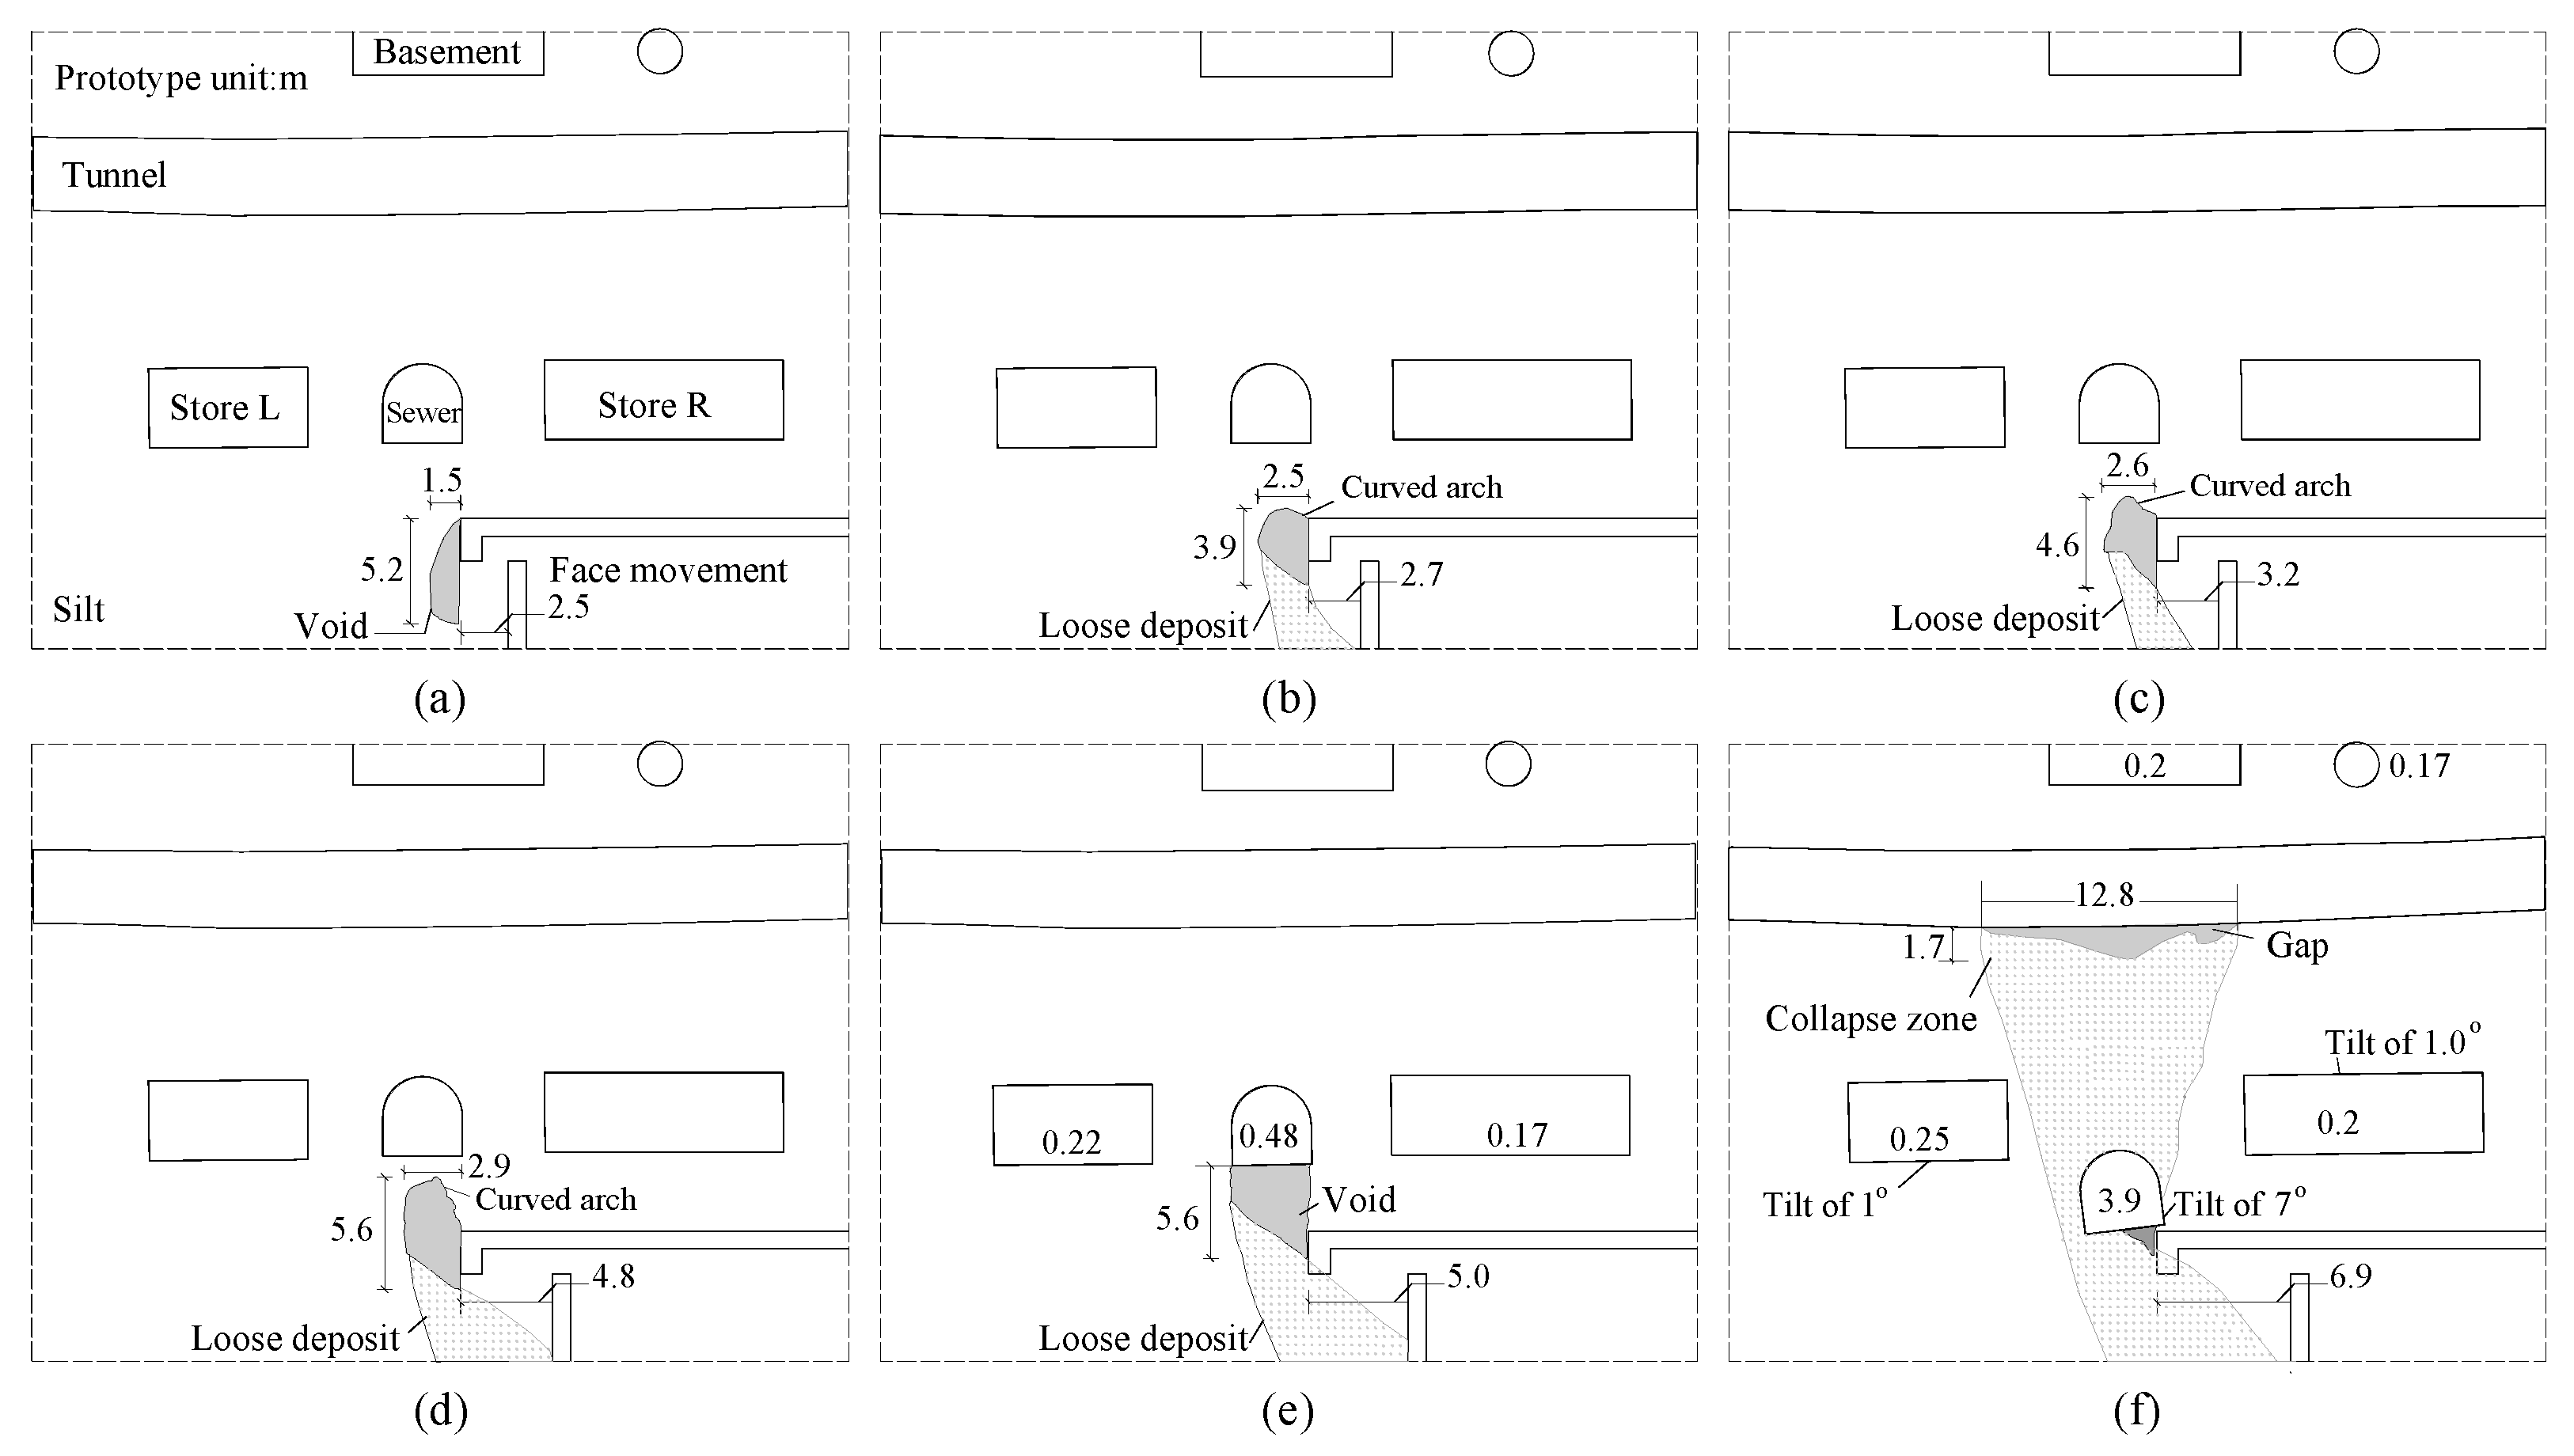
3.3. Overall Collapse
In the case of cohesive soils, face failure involves a large volume of ground ahead of the working front, presenting an overall collapse, a failure mode of a ground block bounded by two single or multiple shear planes extending from the tunnel face to the surface [
42]. To reproduce overall collapse in the centrifuge, two model tests were performed using the silt model and the high interlayer model.
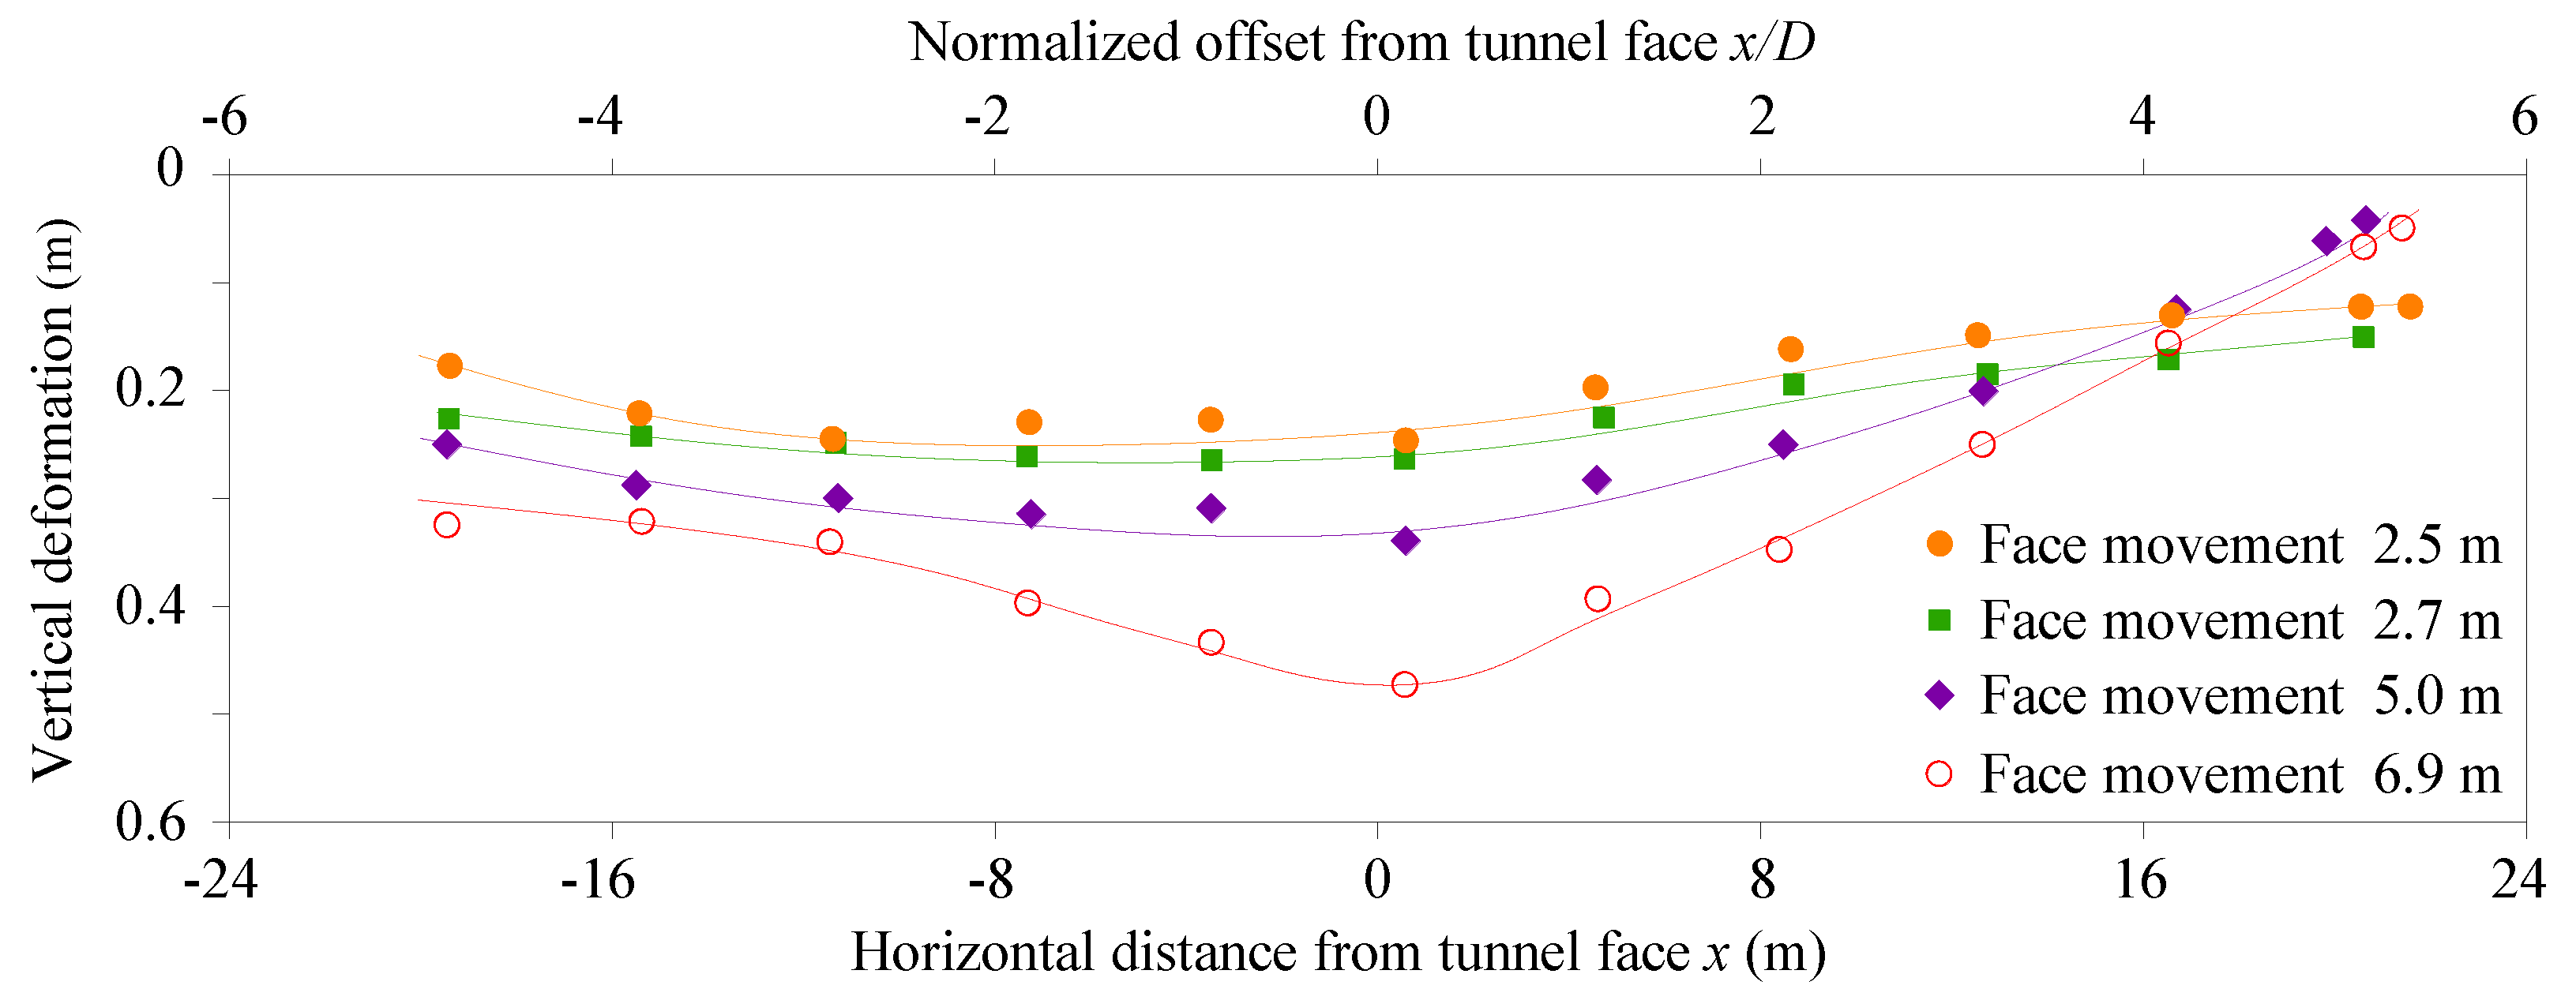
Figure 15 presents the failure mechanism in the silt model developed at different face movements. It was noticed that the curved arch formed with a face movement from 0 to 5.0 m, as shown in
Figure 15a–d. With a face movement of 5.0 m, a failure developed in the sewer line (
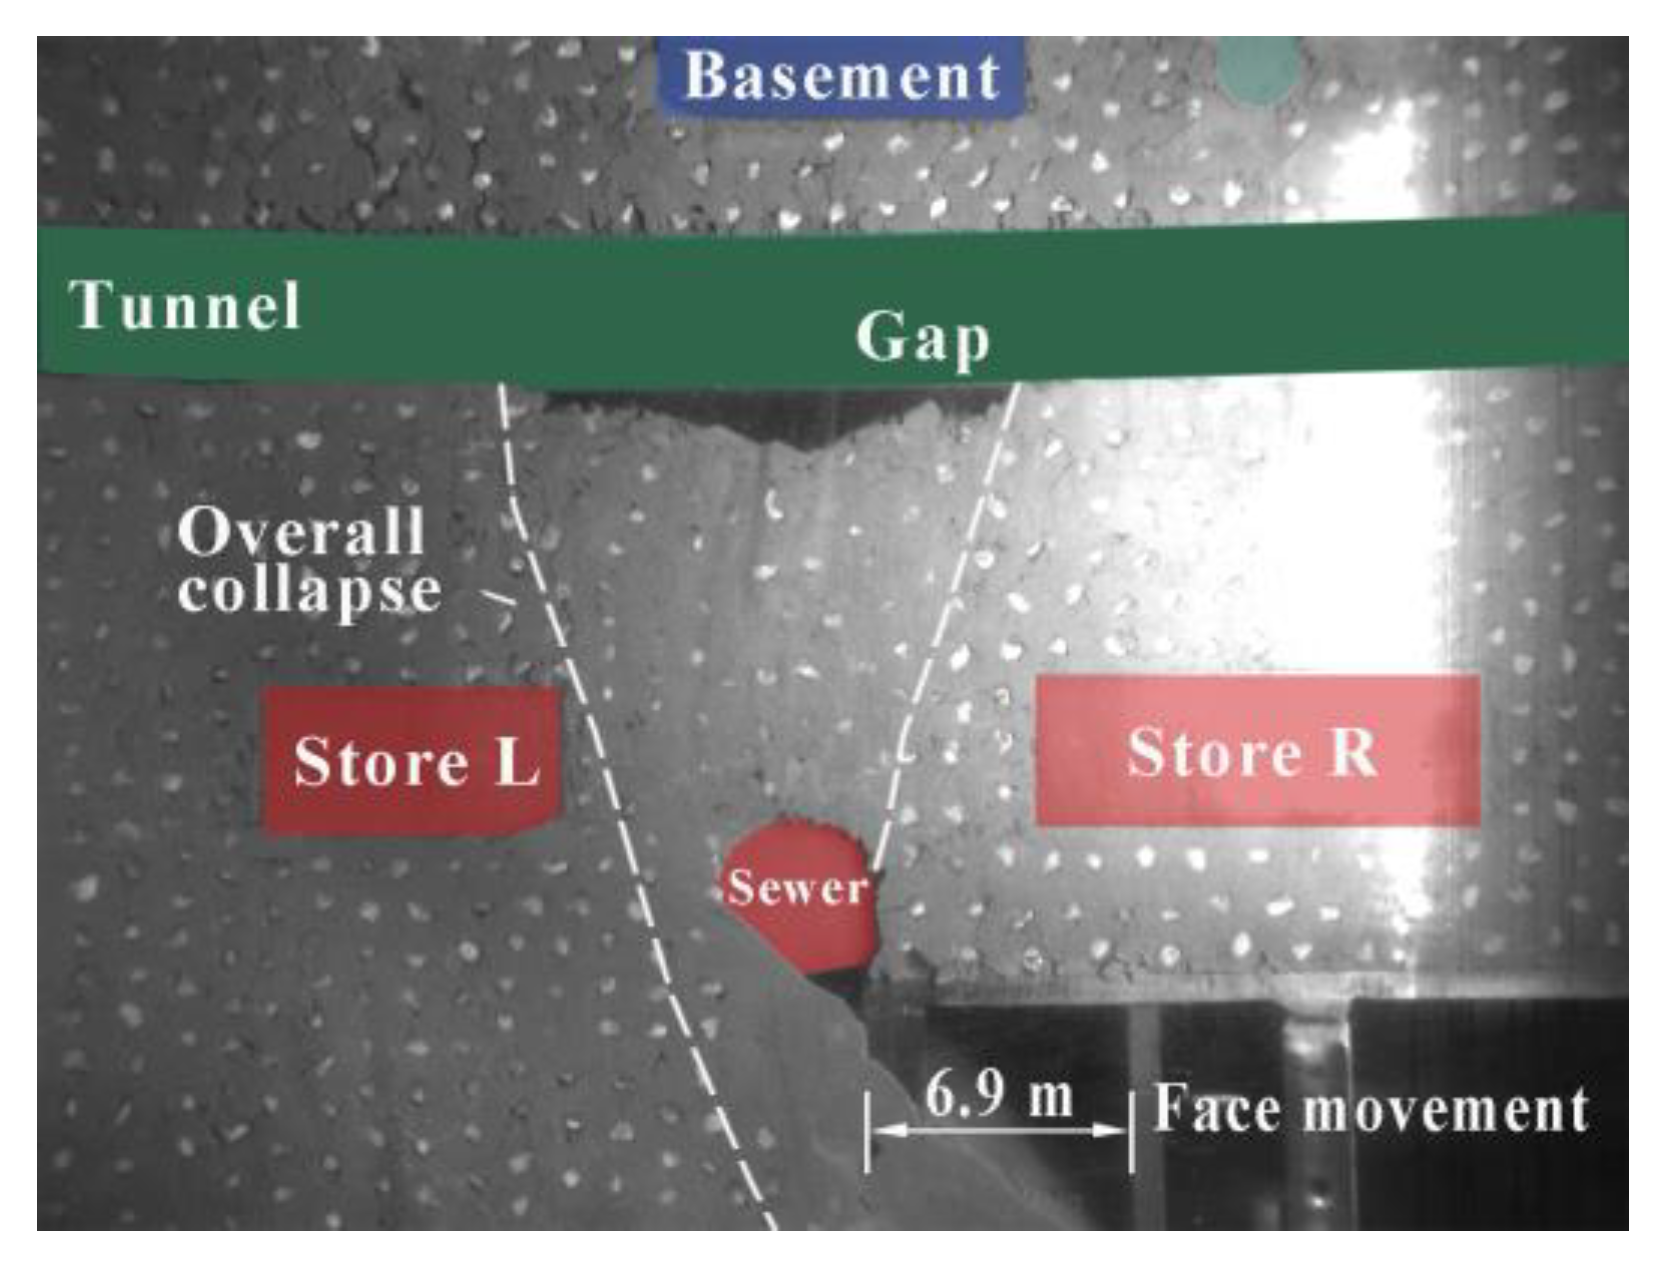
Figure 15e). By further increasing the face movement to 6.9 m, as depicted in
Figure 15f and
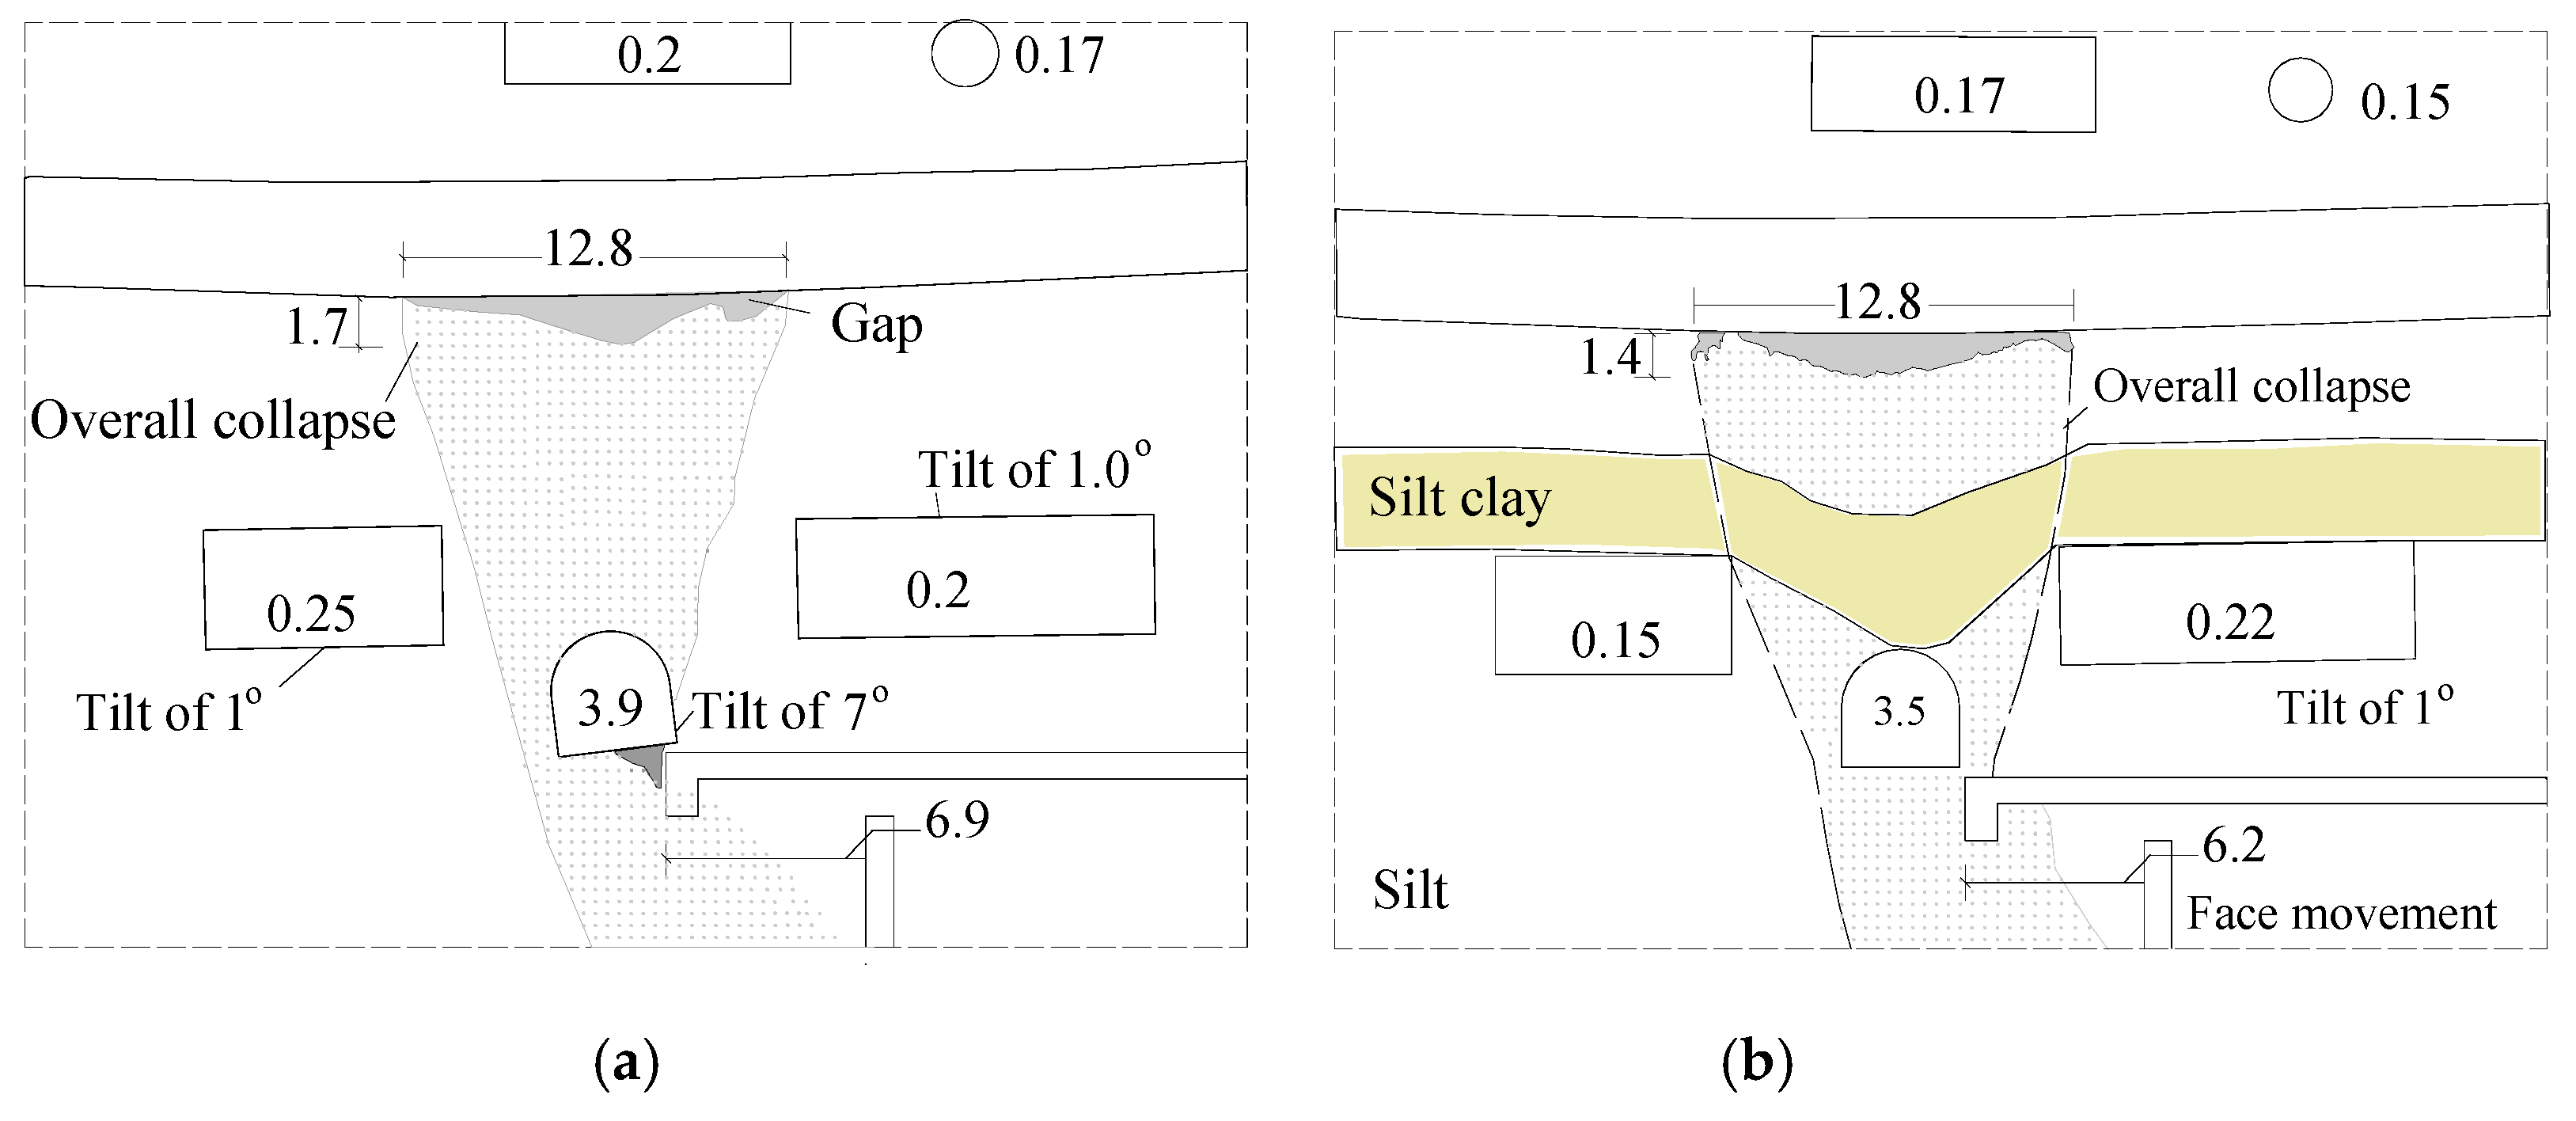
Figure 16, a sudden fall-down of 3.9 m for the Sewer triggered an overall collapse above the face, leaving a 12.8 m long and 1.7 m high gap beneath the tunnel. The overall failure was bounded by two single shear planes. The occurrence of the overall collapse may be attributed to the low cohesion strength of the silt.
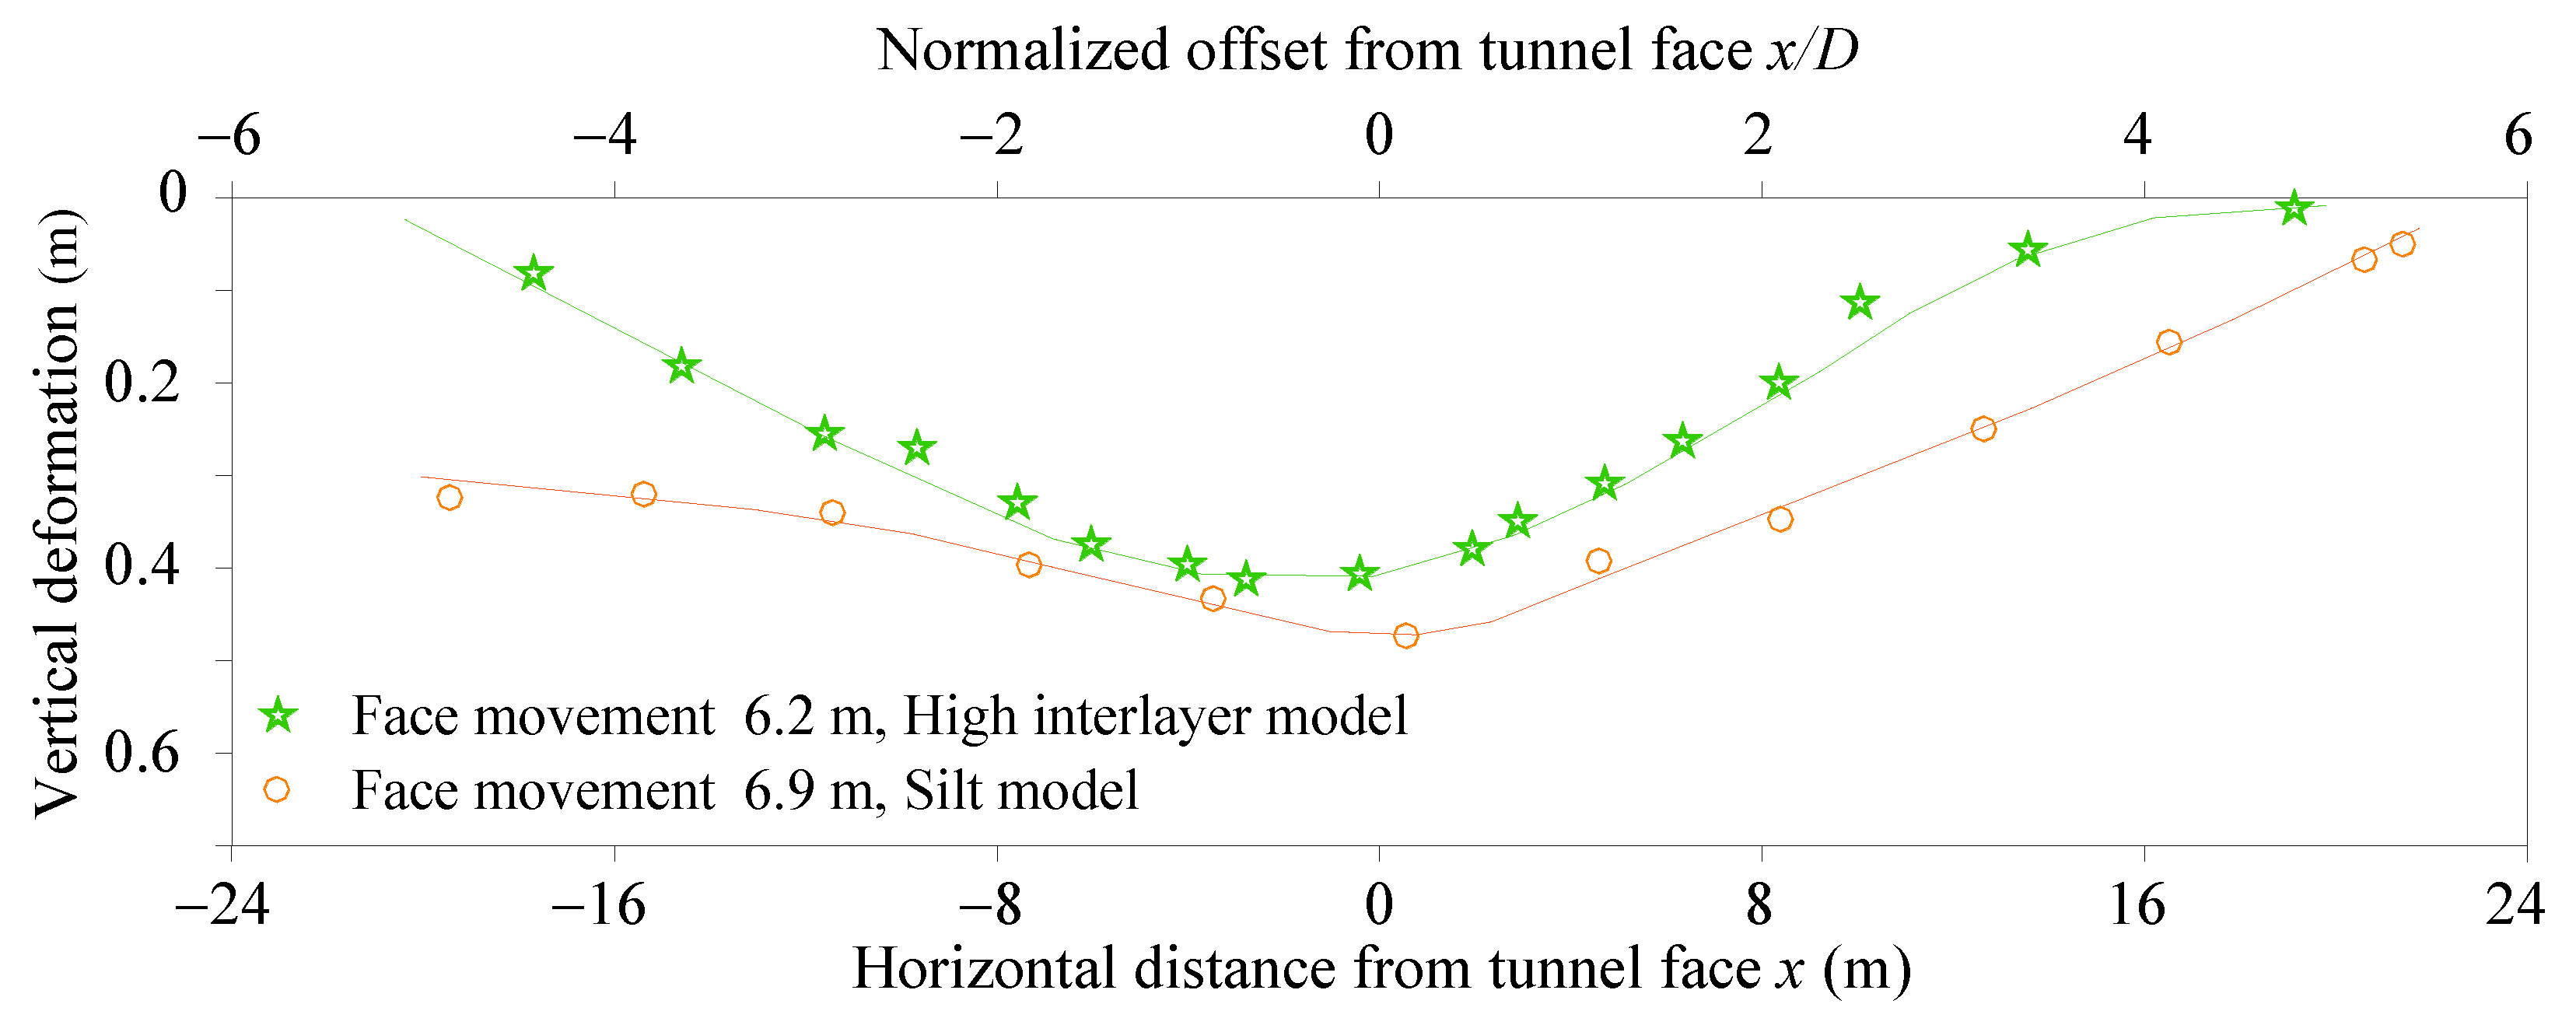
Figure 17 illustrates the measured deformations of the existing tunnel for different face movements. When failure was confined with a face movement of 2.5–5.0 m, the bending deformation of the existing tunnel developed steadily. After the sudden brittle failure of the ground, the deformation increased sharply, leading to significant bending of the existing tunnel at the location above the gap. The maximum deformation of the existing tunnel was 0.47 m, about 12% of tunnel diameter. It consequently led to 1 degree of tilt and an increment of settlement for Store L and Store R. Shielded by the existing tunnel, 0.2 m of settlement was caused at the basement.
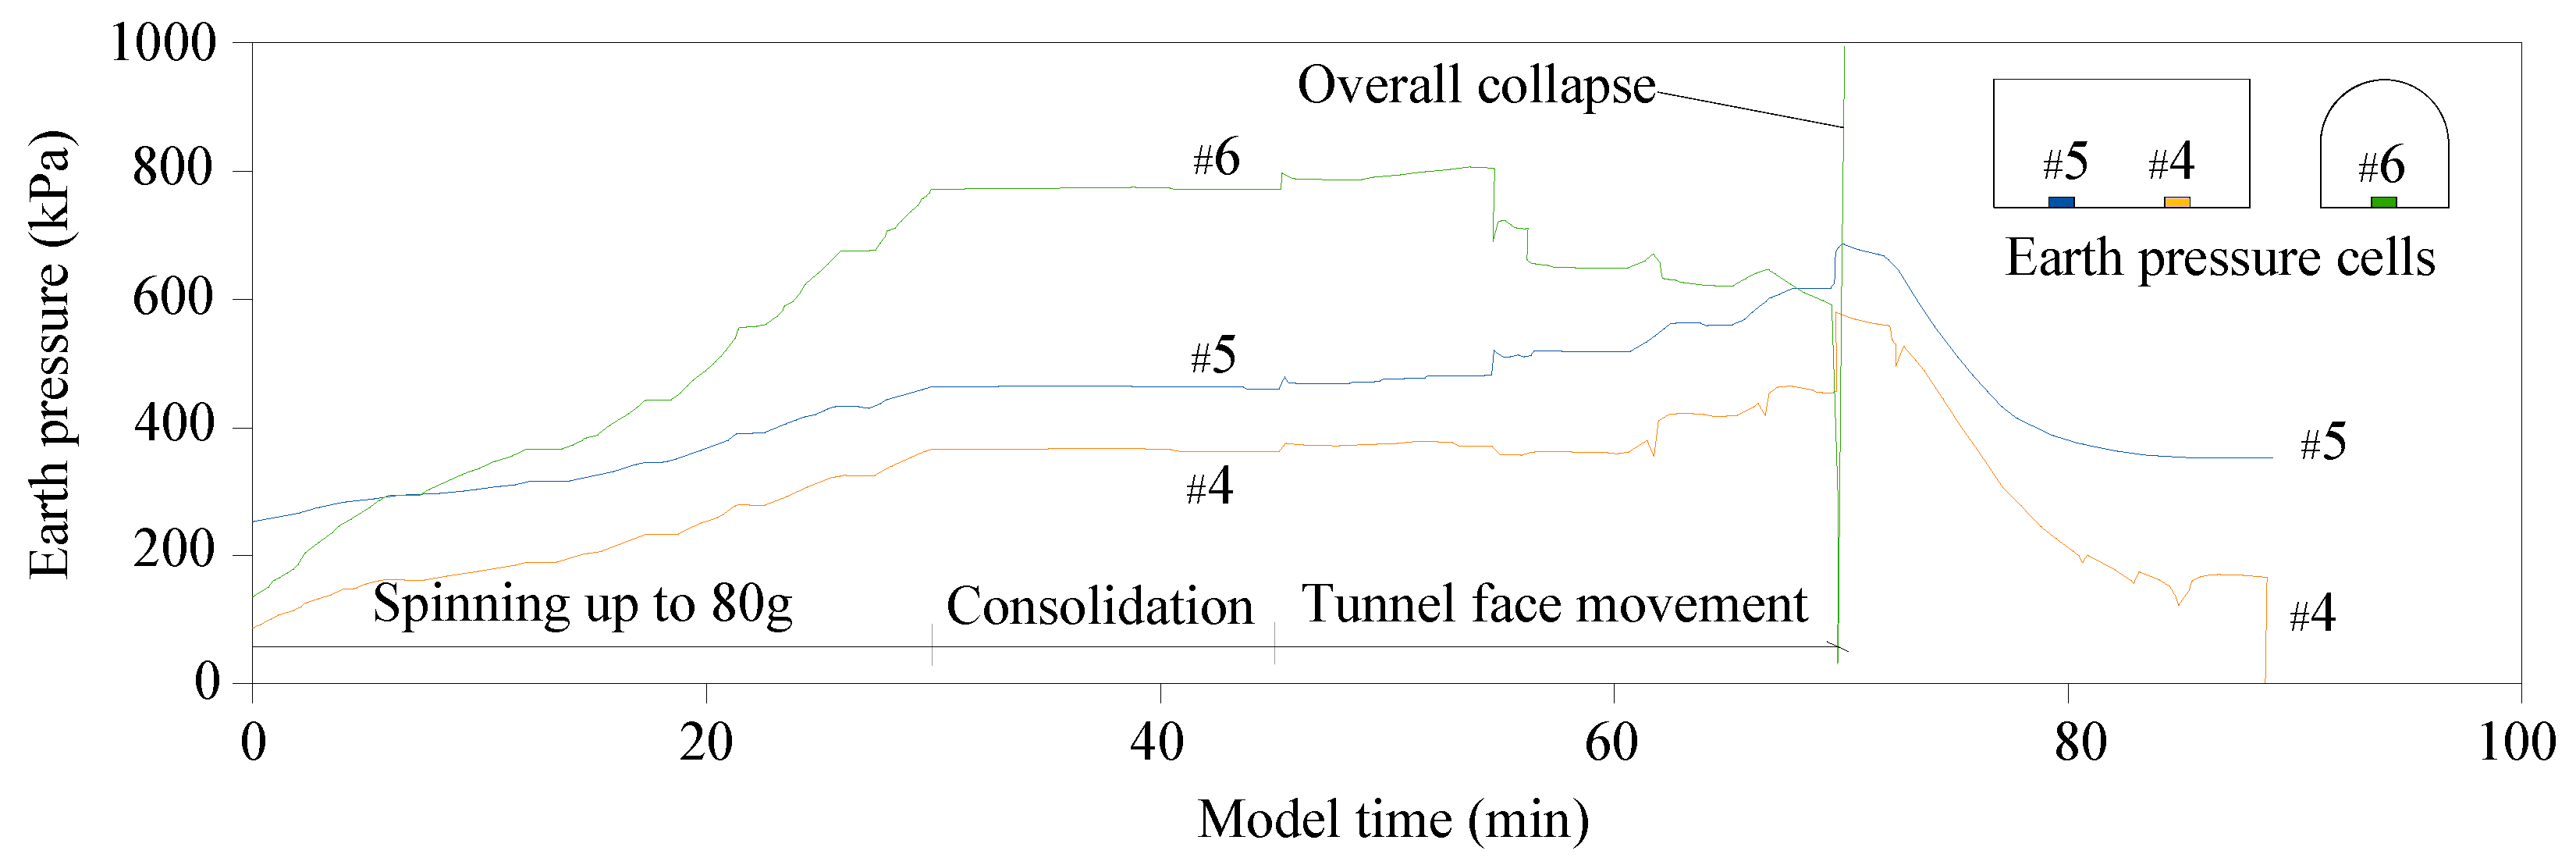
Figure 18 depicts the earth pressures of #4, #5 and #6 over the entire process, with sharp changes in the curves that are consistent with the overall collapse.
The high interlayer model presented an identical failure mechanism as that in the silt model, as shown in
Figure 19. The silt predominated the behavior in the high interlayer model and exhibited brittle failure similar to that in the silt model. In the comparison of the two models in
Figure 20, the silty clay layer above the sewer had a slight effect of reducing the induced bending deformation of the existing tunnel due to the flexibility of the interlayer.
Table 4 summarizes the maximum deformations of the buried structures in the four centrifuge models. As indicated in
Table 4, the bending deformation of the existing tunnel is well correlated with the failure mode, and a limited partial collapse (in the low interlayer model) had the smallest impact on the tunnel. The magnitude of the deformation of the structures depended not only on the failure mode but also on the scope and orientation of the failure.
4. Summary and Conclusions
This paper presents the results of four centrifuge model tests for investigating the coupling failure mechanisms of underground structures subjected to instability of the tunnel face. The physical investigation offered some new insights and led to the following conclusions:
(a) Rapid sand flow occurred instantly following a relatively small movement of 0.85 m of the tunnel face. This may be the main cause that induced the catastrophic failure in Shanghai Metro Line 4 and Guangdong Foshan Metro Line 2. A chimney-like mechanism created gaps underneath the existing structures.
(b) An arching effect in cohesive soil and the influence of adjacent structures led to a partial failure even with a large face movement of 6.6 m, a failure that was limited to the front of the tunnel face, having a lower impact on the existing tunnel.
(c) An overall collapse may occur in conditions of soil with lower cohesion strength or when involving changes in the ground water table, which is a failure mode of a ground block bounded by two single shear planes extending from the tunnel face to the surface.
(d) The maximum bending deformation and the induced tensile strain of the existing tunnel are well correlated with the failure mode. The maximum tensile strain was about 2000 μεfor cases of sand flow and overall collapse. The partial failure had the smallest impact on the tunnel, and the maximum tensile strain was only 40% of the former two cases. The magnitude of the deformation of the structures depended not only on the failure mode but also on the scope and orientation of the failure.
As indicated by case studies on Shanghai Metro Line 4 and Guangdong Foshan Metro Line 2, rapid occurrence of large-scale tunnel failure can cause serious damage to existing structures. Further studies can investigate the impact of the large-scale failures of tunnels during construction, especially for existing tunnels.
Author Contributions
Methodology, J.Z. and X.C.; investigation, J.Z. and A.W.; writing, J.Z.; editing, L.Z. All authors have read and agreed to the published version of the manuscript.
Funding
This research was funded by the National Natural Science Foundation of China, grant number 52090084 and 52279101.
Institutional Review Board Statement
Not applicable.
Informed Consent Statement
Not applicable.
Data Availability Statement
Not applicable.
Conflicts of Interest
The authors declare no conflict of interest.
References
- Tan, Y.; Lu, Y.; Wang, D.L. Catastrophic Failure of Shanghai Metro Line 4 in July, 2003: Occurrence, Emergency Response, and Disaster Relief. J. Perform. Constr. Facil. 2021, 35, 04020125. [Google Scholar] [CrossRef]
- Mair, R.J. Centrifugal Modelling of Tunnel Construction in Soft Clay. Ph.D. Thesis, University of Cambridge, Cambridge, UK, 1979. [Google Scholar]
- Davis, E.H.; Gunn, M.J.; Mair, R.J.; Seneviratine, H.N. The stability of shallow tunnels and underground openings in cohesive material. Géotechnique 1980, 30, 397–416. [Google Scholar] [CrossRef]
- Burford, D. Heave of tunnels beneath the Shell Centre, London, 1959–1986. Géotechnique 1988, 38, 135–137. [Google Scholar] [CrossRef]
- Anagnostou, G.; Kovari, K. Face stability of slurry-shield-driven tunnels. Tunn. Undergr. Space Technol. 1994, 9, 165–174. [Google Scholar] [CrossRef]
- Chang, C.T.; Sun, C.W.; Duann, S.W.; Hwang, R.N. Response of a Taipei Rapid Transit System (TRTS) tunnel to adjacent excavation. Tunn. Undergr. Space Technol. 2001, 16, 151–158. [Google Scholar] [CrossRef]
- Zhang, J.H.; Pu, J.; Zhang, M.; Qiu, T. Model tests by centrifuge of soil nail reinforcements. J. Test. Eval. 2001, 29, 315–328. [Google Scholar]
- Bezuijen, A.; Brassinga, H.M. Blow-Out Pressures Measured in a Centrifuge Model and in the Field. In Tunnelling; Bezuijen, A., Lottum, H.V., Eds.; A Decade of Progress—GeoDelft 1995–2005; Taylor & Francis: London, UK, 2005; pp. 143–148. [Google Scholar]
- Leca, E.; New, B. Settlements induced by tunneling in Soft Ground. Tunn. Undergr. Space Technol. 2007, 22, 119–149. [Google Scholar] [CrossRef]
- Meguid, M.A.; Saada, O.; Nunes, M.A.; Mattar, J. Physical modeling of tunnels in soft ground: A review. Tunn. Undergr. Space Technol. 2008, 23, 185–198. [Google Scholar] [CrossRef]
- Zhang, L.M.; Zhang, G.; Zhang, J.M.; Lee, C.F. Centrifuge model tests on a cohesive soil slope under excavation conditions. Soils Found. 2011, 51, 801–812. [Google Scholar] [CrossRef]
- Chen, X.S. A space-time-dependant design method and the stability of ice wall for deep shafts. In Applied Mechanics and Materials; Trans tech publications: Stafa-Zurich, Switzerland, 2012; Volume 204–208, pp. 3275–3281. [Google Scholar] [CrossRef]
- Nghiem, H.L.; Heib, M.A.L.; Emeriault, F. Physical model for damage prediction in structures due to underground excavations. In Proceedings of the International Conference on Geotechnical Engineering (Geoshanghai 2014), Reston, VA, USA, 26 May 2014; pp. 155–164. [Google Scholar]
- Senent, S.; Jimenez, R. A tunnel face failure mechanism for layered ground, considering the possibility of partial collapse. Tunn. Undergr. Space Technol. 2015, 47, 182–192. [Google Scholar] [CrossRef]
- Lu, H.; Shi, J.W.; Ng, C.W.W.; Lv, Y. Three-dimensional centrifuge modeling of the influence of side-by-side twin tunneling on a piled raft. Tunn. Undergr. Space Technol. 2020, 103, 103486. [Google Scholar] [CrossRef]
- Wang, H.Y.; Leung, C.F.; Huang, M.S.; Fu, Y. Axial response of short pile due to tunnelling-induced soil movement in soft clay. Int. J. Phys. Model. Geotech. 2020, 20, 71–82. [Google Scholar] [CrossRef]
- Weng, X.L.; Sun, Y.F.; Yan, B.H.; Niu, H.S.; Lin, R.A.; Zhou, S.Q. Centrifuge testing and numerical modeling of tunnel face stability considering longitudinal slope angle and steady state seepage in soft clay. Tunn. Undergr. Space Technol. 2020, 101, 103406. [Google Scholar] [CrossRef]
- Song, G.Y.; Marshall, A.M. Centrifuge study on the use of protective walls to reduce tunnelling-induced damage of buildings. Tunn. Undergr. Space Technol. 2021, 115, 104064. [Google Scholar] [CrossRef]
- Xu, J.M.; Franza, A.; Marshall, A.M.; Losacco, N.; Boldini, D. Tunnel-framed building interaction: Comparison between raft and separate footing foundations. Géotechnique 2021, 71, 631–644. [Google Scholar] [CrossRef]
- Alkhdour, A.; Tiutkin, O.L.; Marochka, V.V.; Boboshko, S.H. The centrifugal modeling of reinforcement on approaches to railway bridges. Acta Polytech. Hungarica 2022, 19, 131–142. [Google Scholar] [CrossRef]
- Benmebarek, M.A.; Benmebarek, S.; Rad, M.M.; Ray, R. Pile optimization in slope stabilization by 2D and 3D numerical analyses. Int. J. Geotech. Eng. 2022, 16, 211–224. [Google Scholar] [CrossRef]
- Esmaeili, M.; Astaraki, F.; Yaghouti, H.; Rad, M.M. Laboratory Investigation on the Effect of Microsilica Additive on the mechanical behavior of deep soil mixing columns in saline dry sand. Period. Polytech. Civ. Eng. 2021, 65, 1080–1091. [Google Scholar] [CrossRef]
- Corte, J.F. Presentation of the LCPC centrifuge. In International Symposium in Geotechnical Centrifuge Model Testing; Tokyo Institute of Technology: Tokyo, Japan, 1984; pp. 120–126. [Google Scholar]
- Chambon, P.C.; Corte, J.F. Shallow tunnels in cohesionless soil: Stability of tunnel face. J. Geotech. Eng. 1994, 120, 1148–1165. [Google Scholar] [CrossRef]
- Kamata, H.; Masimo, H. Centrifuge model test of tunnel face reinforcement by bolting. Tunn. Undergr. Space Technol. 2003, 18, 205–212. [Google Scholar] [CrossRef]
- Ng, C.W.W.; Wong, K.S. Investigation of passive failure and deformation mechanisms due to tunnelling in clay. Can. Geotech. J. 2013, 50, 359–372. [Google Scholar] [CrossRef]
- Konig, D.; Grittier, U.; Jessberger, H.L. Stress redistributions during tunnel and shaft constructions. In International Conference Centrifuge 1991; Balkema: Rotterdam, The Netherlands, 1991; pp. 129–138. [Google Scholar]
- Sterpi, D.; Cividini, A.; Sakurai, S.; Nishitake, S. Laboratory model tests and numerical analysis of shallow tunnels. In Proceedings of the International Symposium on Eurock 96—ISRM, Turin, Italy, 2–5 September 1996; Barla, G., Ed.; OnePetro: Richardson, TX, USA, 1996; Volume 1, pp. 689–696. [Google Scholar]
- Champan, D.N.; Ahn, S.K.; Hunt, D.V.L.; Chan, H.C. The use of model tests to investigate the ground displacement associated with multiple tunnel construction in soil. Tunn. Tunn. 2006, 21, 413. [Google Scholar]
- Hagiwara, T.; Grant, R.J.; Calvello, M.; Taylor, R.N. The effect of overlying strata on the distribution of ground movements induced by tunneling in clay. Soils Found. 1999, 39, 63–73. [Google Scholar] [CrossRef] [PubMed]
- Sharma, J.S.; Hefny, A.M.; Zhao, J.; Chan, C.W. Effect of large excavation on deformation of adjacent MRT tunnels. Tunn. Undergr. Space Technol. 2001, 16, 93–98. [Google Scholar] [CrossRef]
- Zhang, J.H.; Chen, Z.Y.; Wang, X.G. Centrifuge modelling of rock slopes susceptible to block toppling. Rock Mech. Rock Eng. 2007, 40, 363–382. [Google Scholar] [CrossRef]
- Farrell, R.P.; Mair, R.J. Centrifuge modelling of the response of buildings to tunnelling. In Proceedings of the 7th International Conference on Physical Modelling in Geotechnics, Zurich, Switzerland, 28 June–1 July 2010; Volume 1, pp. 549–554. [Google Scholar]
- Zheng, G.; Wei, S.W.; Peng, S.Y.; Diao, Y.; Ng, C.W.W. Centrifuge modeling of the influence of basement excavation on existing tunnel. In Proceedings of the International Conference on Physical Modelling in Geotechnics; Taylor & Francis Group: London, UK, 2010; pp. 523–527. [Google Scholar]
- Giardina, G.; DeJong, M.J.; Mair, R.J. Interaction between surface structures and tunnelling in sand: Centrifuge and computational modelling. Tunn. Undergr. Space Technol. 2015, 50, 465–478. [Google Scholar] [CrossRef]
- Yokota, Y.; Date, K.; Yamamoto, T. Verification of reinforcing effects of a tunnel face reinforcement method by centrifuge model tests and numerical analysis. In Proceedings of the 12th ISRM International Congress on Rock Mechanics, Harmonising Rock Engineering and The Environment, Beijing, China, 17–21 October 2011; Qian, Q., Zhou, Y., Eds.; OnePetro: Richardson, TX, USA, 2011; pp. 2173–2176. [Google Scholar]
- Franza, A.; Marshall, A.M.; Zhou, B. Greenfield tunnelling in sands: The effects of soil density and relative depth. Geotechnique 2019, 69, 297–307. [Google Scholar] [CrossRef]
- Ritter, S.; Giardina, G.; Franza, A.; DeJong, M.J. Building deformation caused by tunneling: Centrifuge modeling. J. Geotech. Geoenviron. Eng. 2020, 146, 04020017. [Google Scholar] [CrossRef]
- Meng, F.Y.; Chen, R.P.; Xu, Y.; Wu, H.N.; Li, Z.C. Centrifuge modeling of effectiveness of protective measures on existing tunnel subjected to nearby excavation. Tunn. Undergr. Space Technol. 2021, 112, 103880. [Google Scholar] [CrossRef]
- Zhang, J.H.; Lin, H.L.; Wang, K.Z. Centrifuge modeling and analysis of submarine landslides triggered by elevated pore pressure. Ocean. Eng. 2015, 109, 419–429. [Google Scholar] [CrossRef]
- Taylor, R.N. Geotechnical Centrifuge Technology; Blackie Academic and Professional: London, UK, 1995. [Google Scholar]
- White, D.J.; Take, W.A.; Bolton, M.D. Soil deformation measurement using particle image velocimetry (PIV) and photogrammetry. Géotechnique 2003, 53, 619–631. [Google Scholar] [CrossRef]
Figure 1.
Failure of shield−driven tunnel at Guangdong Foshan Metro Line 2: (a) Aerial view of collapse zone; (b) Location of initial failure and damaged tunnel; (c) Ground subsidence measuring 81 m × 65 m × 8 m (depth).
Figure 1.
Failure of shield−driven tunnel at Guangdong Foshan Metro Line 2: (a) Aerial view of collapse zone; (b) Location of initial failure and damaged tunnel; (c) Ground subsidence measuring 81 m × 65 m × 8 m (depth).
Figure 2.
Destructions at Shanghai Metro Line 4: (
a) Location of initial failure and 238 m long damaged tunnel; (
b) Ground subsidence before Lin−Jiang Garden building; (
c) Pump station sinking [
1].
Figure 2.
Destructions at Shanghai Metro Line 4: (
a) Location of initial failure and 238 m long damaged tunnel; (
b) Ground subsidence before Lin−Jiang Garden building; (
c) Pump station sinking [
1].
Figure 3.
Centrifuge model setup: (a) Elevation view; (b) Perspective view.
Figure 3.
Centrifuge model setup: (a) Elevation view; (b) Perspective view.
Figure 4.
Dimensions of the model structures that were made of transparent acrylic plate.
Figure 4.
Dimensions of the model structures that were made of transparent acrylic plate.
Figure 5.
Two models consisting of silt with an interlayer of silty clay: (a) Low interlayer model with the silty clay beneath the sewer line; (b) High interlayer model with the silty clay above the sewer line (model unit: m).
Figure 5.
Two models consisting of silt with an interlayer of silty clay: (a) Low interlayer model with the silty clay beneath the sewer line; (b) High interlayer model with the silty clay above the sewer line (model unit: m).
Figure 6.
(a) Sand model after preparation; (b) Low interlayer model with pebble markers (the transparent wall was temporarily removed).
Figure 6.
(a) Sand model after preparation; (b) Low interlayer model with pebble markers (the transparent wall was temporarily removed).
Figure 7.
Instrumentation used in the centrifuge model: (a) Layout of instrument; (b) Placement of earth pressure cells.
Figure 7.
Instrumentation used in the centrifuge model: (a) Layout of instrument; (b) Placement of earth pressure cells.
Figure 8.
Characterization of deformations and failure: (a) Geometries of gap and void in soil; (b) Settlement of existing structures.
Figure 8.
Characterization of deformations and failure: (a) Geometries of gap and void in soil; (b) Settlement of existing structures.
Figure 9.
Side view of the model within coverage of the digital camera: (a) Sand flow occurring instantly following the instability of the tunnel face; (b) Gaps forming beneath structures; (c) Existing tunnel bending and gaps expanding.
Figure 9.
Side view of the model within coverage of the digital camera: (a) Sand flow occurring instantly following the instability of the tunnel face; (b) Gaps forming beneath structures; (c) Existing tunnel bending and gaps expanding.
Figure 10.
Greenfield failure patterns: (
a) 1 g model [
28]; (
b) Centrifuge model [
25].
Figure 10.
Greenfield failure patterns: (
a) 1 g model [
28]; (
b) Centrifuge model [
25].
Figure 11.
Measured deformations and calculated tensile strains of existing tunnel in sand model.
Figure 11.
Measured deformations and calculated tensile strains of existing tunnel in sand model.
Figure 12.
Partial failure in low interlayer model: (a) No changes at face movement of 1.6 m; (b) Void initiated by 0.75 kg of water flow; (c) Curved arch in silty clay at face movement of 1.9 m and 1.67 kg of water flow; (d) Breakthrough of silt clay layer and structures settling after water discharge; (e) Curved arch formed in silt; (f) Collapse zone stabilizing at face movement of 6.6 m.
Figure 13.
Photo of low interlayer model corresponding to
Figure 12f.
Figure 13.
Photo of low interlayer model corresponding to
Figure 12f.
Figure 14.
Measured deformations and calculated tensile strains of existing tunnel in low interlayer model.
Figure 14.
Measured deformations and calculated tensile strains of existing tunnel in low interlayer model.
Figure 15.
Overall collapse in silt model: (a) Void initiating with face movement of 2.5 m; (b–d) Curved arch with face movement from 2.5 to 4.8 m; (e) Void moving up to Sewer with face movement of 5.0 m; (f) Overall collapse with face movement of 6.9 m.
Figure 15.
Overall collapse in silt model: (a) Void initiating with face movement of 2.5 m; (b–d) Curved arch with face movement from 2.5 to 4.8 m; (e) Void moving up to Sewer with face movement of 5.0 m; (f) Overall collapse with face movement of 6.9 m.
Figure 16.
Photo of the silt model after failure.
Figure 16.
Photo of the silt model after failure.
Figure 17.
Measured deformations of existing tunnel in the silt model.
Figure 17.
Measured deformations of existing tunnel in the silt model.
Figure 18.
Earth pressure vs. model time in the silt model.
Figure 18.
Earth pressure vs. model time in the silt model.
Figure 19.
Identical overall collapse mechanism in silt model and high interlayer model: (a) silt model; (b) High interlayer model.
Figure 19.
Identical overall collapse mechanism in silt model and high interlayer model: (a) silt model; (b) High interlayer model.
Figure 20.
Comparison of bending deformations in silt model and high interlayer model.
Figure 20.
Comparison of bending deformations in silt model and high interlayer model.
Table 1.
Scaling law for centrifuge model test [
41].
Table 1.
Scaling law for centrifuge model test [
41].
| Parameter | Model/Prototype |
|---|
| Macroscopic length (m) | 1/N |
| Gravitational acceleration (m/s2) | N |
| Microscopic length (m) | 1 |
| Stress (kPa) | 1 |
| Strain (–) | 1 |
| Time for soil consolidation | 1/N2 |
Table 2.
Four centrifuge models in the test program.
Table 2.
Four centrifuge models in the test program.
| Model Name | Soil Description | Water Effect | Failure Mechanism |
|---|
| Sand model | Uniform sand | Not involved | Sand flow |
| Low interlayer model | Silt with an interlayer below the sewer line | 1.67 kg water | Partial failure |
| Silt model | Uniform silt | Not involved | Overall collapse |
| High interlayer model | Silt with an interlayer above the sewer line | 0.75 kg water | Overall collapse |
Table 3.
Properties of three types of soil used in centrifuge tests.
Table 3.
Properties of three types of soil used in centrifuge tests.
| Parameter | Sand | Silt | Silty Clay |
|---|
| Specific gravity | 2.64 | 2.65 | 2.67 |
| Maximum dry density (kg/m3) | 1680 | / | 2290 |
| Minimum dry density (kg/m3) | 1330 | / | / |
| Dry density of soil model (kg/m3) | 1660 | 1500 | 1600 |
| Liquid limit (%) | / | 25 | 30.0 |
| Plastic limit (%) | / | 18.5 | 14.2 |
| Water content of soil model (%) | 4 | 8 | 17 |
| Cohesion (kPa) | 0 | 6.1 | 54 |
| Internal friction angle φ | 38° | 28.9° | 14° |
Table 4.
Maximum deformations of buried structures induced by instability of tunnel face (m).
Table 4.
Maximum deformations of buried structures induced by instability of tunnel face (m).
| Model Name | Tunnel | Sewer | Store L | Store R | Basement |
|---|
| Low interlayer model | 0.13 | 0.51 | 0.3 | 0.24 | 0.15 |
| Sand model | 0.45 | 0.09 | 0 | 0.05 | 0.13 |
| Silt model | 0.47 | 3.9 | 0.09 | 0.14 | 0.20 |
| High interlayer model | 0.41 | 3.5 | 0.15 | 0.22 | 0.17 |
| Disclaimer/Publisher’s Note: The statements, opinions and data contained in all publications are solely those of the individual author(s) and contributor(s) and not of MDPI and/or the editor(s). MDPI and/or the editor(s) disclaim responsibility for any injury to people or property resulting from any ideas, methods, instructions or products referred to in the content. |
© 2023 by the authors. Licensee MDPI, Basel, Switzerland. This article is an open access article distributed under the terms and conditions of the Creative Commons Attribution (CC BY) license (https://creativecommons.org/licenses/by/4.0/).


