1. Introduction
Recently, the world has witnessed tremendous developments in artificial intelligence (AI) techniques, which are necessary for management science because of their predictive accuracy, classification, ease of analysis, and time-saving features. Traditional methods were used in the past, based on handwriting as an analytical tool for personality or the manual observation of some personal traits [
1].
The application of artificial intelligence (AI) for human-resource management through the use of the Big Five personality test can be a powerful tool for making data-driven decisions and improving efficiency. By analyzing the results of the Big Five personality test, human-resources professionals can identify patterns and trends in personality traits and predict which candidates will be likely to be successful in specific job roles. Additionally, AI algorithms can be used to identify training-and-development needs, analyze employee-performance data, and identify factors that contribute to high levels of employee engagement and retention. Overall, the use of AI in human-resource management has the potential to greatly enhance decision-making and improve the overall effectiveness of HR processes [
2,
3].
When candidates submit their applications for a specific job to a company, the first expectation of the human-resources manager is that they select the right candidate for potential placement. A common approach is to require a certificate and experience from the applicant. Most organizations focus on specific criteria, including creativity, communication, the ability to analyze, speed of intuition, and the ability to overcome the types of challenges associated with the position. In addition, leadership skills are often sought. These include firmness, administrative discipline, and the ability to direct others toward the organization’s goals [
4,
5,
6].
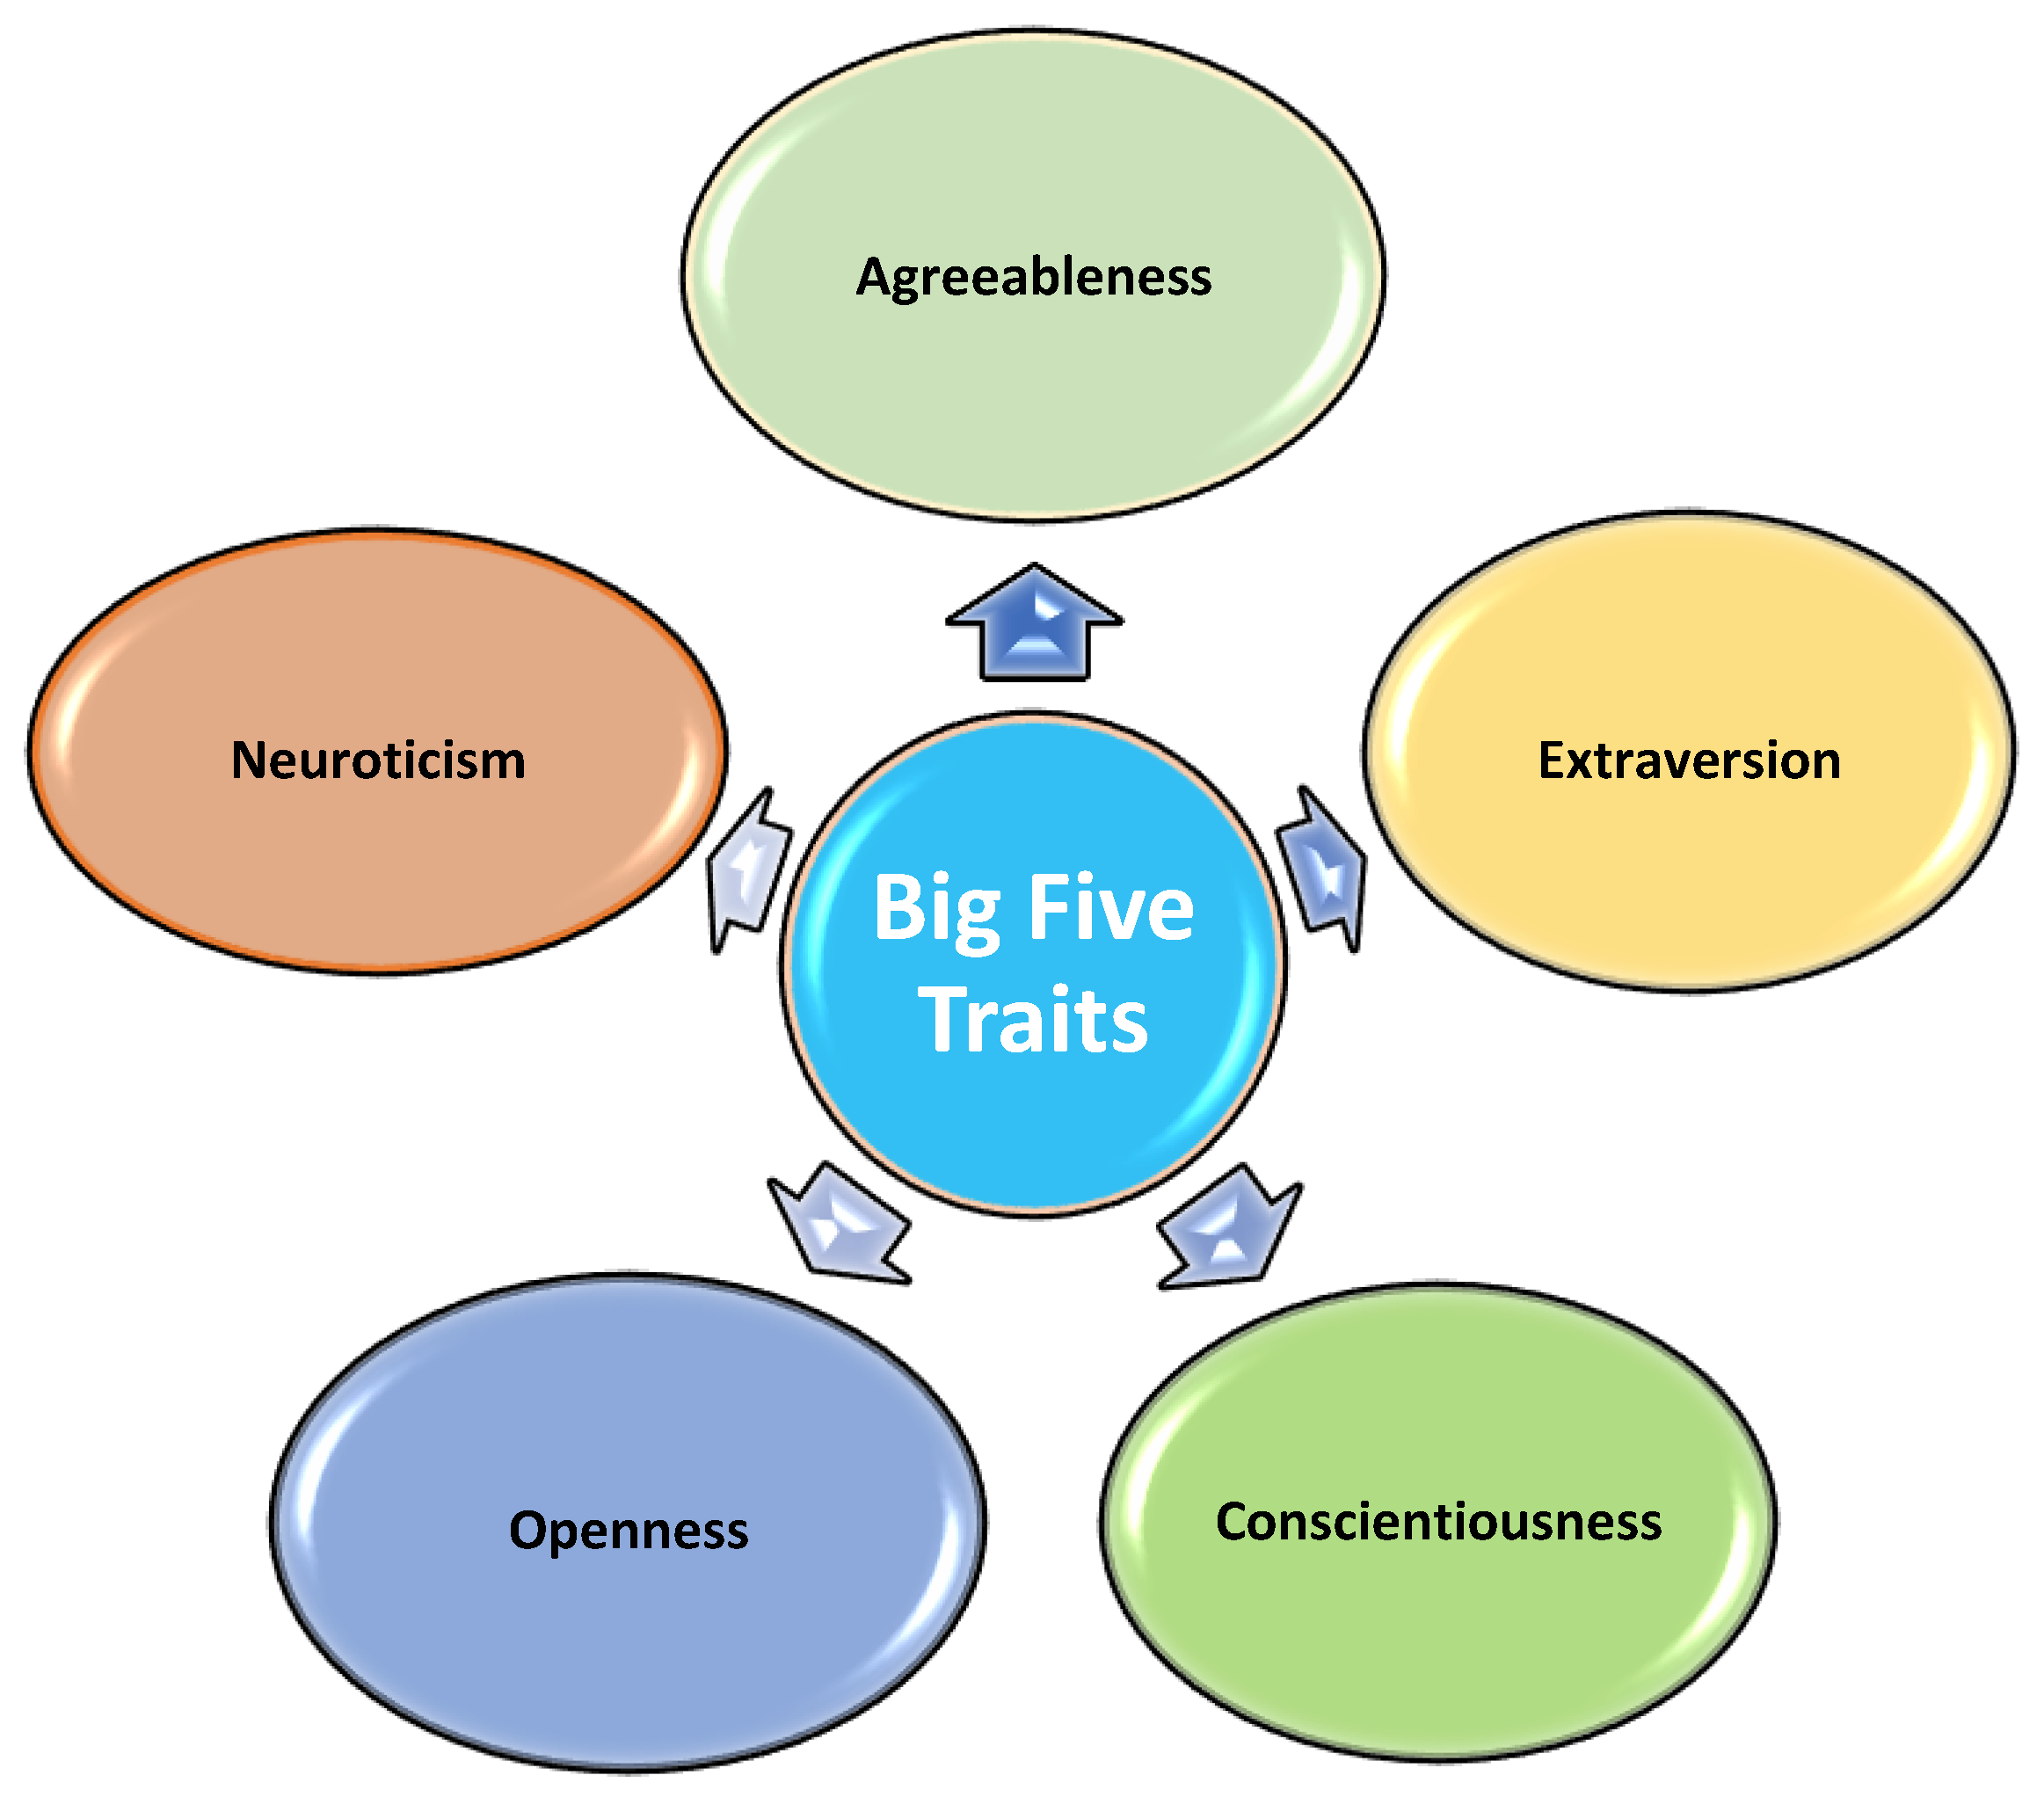
The Big Five model, sometimes referred to as the five-factor model, is currently the theory of personality that has the greatest level of acceptance among psychologists. According to this idea, an individual’s personality may be broken down into five primary components, sometimes known by the acronym OCEAN (openness, conscientiousness, extraversion, agreeableness, and neuroticism) [
7].
The Big Five personality test may be carried out by any organization. However, the test does not exclude or withhold some jobs from some people; the goal is more significant and profound. Some organizations are interested in developing a team with a high capacity for carrying out specific tasks to achieve company goals [
8,
9,
10].
Figure 1 shows Big Five personality traits.
In modern psychology, the Big Five personality test examines the essential categories of individual personality included in OCEAN [
11], which determine individuals’ personalities and explain their behaviors. The OCEAN categories include the following:
Openness to new experiences: This trait characterizes people who enjoy the arts and new adventures. People with a high score on this characteristic are often inquisitive, less traditional, and more inventive.
Conscientiousness measures people who are organized, productive, and accountable. High-scoring results for this trait are often obtained by meticulous and highly reliable individuals. Low scores are given to people who exhibit low performance and are uninterested in their jobs.
Extraversion evaluates sociability and an individual’s source of energy and excitement. Furthermore, in a manner that could be compared with a spotlight, those who score well on this characteristic often inspire others to succeed.
Agreeableness measures trustworthiness, candor, and getting along with people. Low scores for this trait are often indicative of less trustworthy and more dissatisfied individuals. These tend to be more argumentative, which may reduce their chances of being hired [
12].
Neuroticism assesses an individual’s emotional stability, impulsivity, and anxiety in the face of pressure. People who go absent without leave (AWOL) from work, use harsh language, or behave negatively after an intense meeting will likely have a higher score for this trait.
This approach, which is recommended in this study, has two advantages:
It was mentioned in [
15] that it is necessary to investigate personality with more focus and with a fuller consideration of the particulars of expansion and revolution than have been employed hitherto. To highlight the issue in this study, it is indicated by Verma and Bandi [
16] that 69% of employees’ inadequate qualities are due to poor hiring decisions. The explanations for this include deficiencies in the understanding of candidates’ profiles and their alignment with companies’ cultures, in addition to the subjective assessment of candidates’ hard and soft skills. This is because the employment process is typically conducted by human recruiters, who individually check CVs and other sources to find applicants. As individuals have narrow capabilities, performing all the necessary tasks is not easy, and generally entails more time from each individual recruiter. Other issues include human limitations, such as prejudices, biases, and time constraints, which can influence how a recruitment procedure operates [
17] and may lead a company to lose applicants who are better suited [
18]. Indeed, AI and machine learning may help to solve this problem by making human-capital management more smart and effective. Thus, the purpose of study is to enlarge upon and fill the gap in the current research by examining how AI will help organizations to select their human capital to increase the effectiveness of their recruitment.
The rest of the article is broken up into the following sections. The next part presents a literature review of the existing studies.
Section 3 provides the methodology, which examines the data collection and sources, as well as the technique used for the analysis. The results are discussed in
Section 4, while the discussion of these results and their connection to the motivation behind the study are presented in
Section 5. The conclusion and potential directions for future research are presented in
Section 5.
2. Literature Review
In the current era, technological advancements have made it possible to obtain and analyze data to acquire information about human behavior [
19]. For example, the analysis of the Big Five personality traits has been applied in different fields, such as health care, education, online-behavior analysis, and human-resource management. Alamsyah et al. [
20] identified prospective employment applicants based on a personality measurement using an ontology model with the help of social-media data. They selected five Twitter users whose data were available on social media as samples.. Furthermore, through their approach, they found that the personality measurement using this model revealed that each job applicant had different personality traits, such as openness, extraversion, agreeableness, and conscientiousness.
Another study, presented by Laleh et al. [
21], analyzed the behavior of users and customers on social-media platforms such as Twitter and Facebook. The users’ text data, such as likes, follow-ups, and online posts were collected in order to track their activities. The aim was to determine which customers were targeted and attracted by the promotion of particular companies’ products, thus increasing these companies’ profits. Some companies also use online social media posts for behavioral and psychological analysis. Qin et al. [
22] presented a deep-learning model based on an artificial neural network, BP, to predict OCEAN personality traits. The textual analysis and deep-learning model were trained and tested on a dataset collected from the Sina Weibo website. The results showed that the model can predict the efficiency of the OCEAN personality test, achieving an accuracy of 74%.
Some studies have been conducted on the academic field. For instance, John et al. [
23] used questionnaires to test students’ performances. Another study, by Curtis et al. [
24], tested the relationship between personality traits and employee aging. The study found that neuroticism may be negatively related to the tested individuals’ general cognitive ability, capacity, and smooth thinking.
In health care, Dymecka et al. [
25] tested the influence of self-efficacy and the Big Five personality characteristics on emergency-telephone-number operators’ stress during the COVID-19 epidemic. One hundred emergency-telephone operators participated in the research and provided the data. The authors discovered that the operators of emergency telephone numbers suffered from a considerable amount of stress. All the Big Five personality characteristics and self-efficacy were linked to the amount of stress experienced. Self-efficacy and emotional stability were significant predictors of reported stress in a sample of emergency-telephone-number operators using stepwise regression.
Furthermore, Muntean et al. [
26] tested doctors’ stress. The authors tested doctors exposed daily to several stressors; their levels of occupational stress were thoroughly examined. In mental health, Chavoshi et al. [
27] studied the relationship between depressive symptoms and the Big Five personality traits. The results showed an association between neuroticism and depressive symptoms that was significantly positive, whereas the link between extraversion, conscientiousness, and openness was significantly negative [
28].
Xu et al. [
29] studied how the geographic environment influences human personality at the provincial level. The authors studied the association between the Big Five personality characteristics and the measurement of mountainous areas. They investigated the differences in the personalities of inhabitants of mainland China in relation to geographical region by exploring the relationships between the Big Five personality characteristics and indices of mountainous areas. Priyadharshini et al. [
30] applied the Big Five personality test in the selection of decision makers and leaders in various investment, military, and government sectors, in which decisions determine the fates of countries or other sectors, and the failure or success of their projects.
There are some similarities between the Big Five test and the Myers–Briggs Type Indicator (MBTI).. The MBTI is a personality model that is rarely used in personality computing. Unlike the Big Five and HEXACO, the MBTI defines personality according to types rather than traits; in other words, the human personality is solely defined by a specific personality type or class, rather than through different scores for multiple traits. The Myers-Briggs Type Indicator (MBTI) classifies people into one of four categories: extraversion or introversion, sensing or intuition, thinking or feeling, and judging or perceiving. This is a technique that is usually used in the process of assisting persons in better comprehending their personal communication preferences, as well as the manner in which they engage with other people. Knowledge of the Myers-Briggs Type Indicator (MBTI) may assist individuals in adapting their interpersonal styles to suit a variety of settings and audiences. In psychology, the MBTI applies four binary criteria and categorizes individuals into one of 16 distinct personality types. The MBTI has long since been replaced by approaches such as the Big Five traits, which are more reliable, valid, and complete. These approaches are considerably more descriptive of the underlying reality (e.g., most individuals are neither drastically introverted nor extroverted, but rather somewhere in the center) than categorical characteristic dimensions such as those deployed by the MBTI. The Big Five is not the only contemporary theory of personality. Its most notable rivals are the honesty–humility, emotionality, extraversion, agreeableness, conscientiousness, and openness-to-experience (HEXACO) model. However, HEXACO and the Big Five are relatively similar; HEXACO’s additional honesty–humility element is the primary distinguishing feature [
28], which adds a sixth dimension to personality analysis, [
31].
3. Methodology
Many modern psychologists who study personality point to the Big Five personality traits as evidence that there are at least five fundamental aspects of human nature [
32]. Extraversion, agreeableness, openness, conscientiousness, and neuroticism are the five main characteristics of a person’s character. In modern management methods, knowledge of personality traits is essential. Therefore, career professionals and psychologists use this information in a personality career test for recruitment and candidate assessment [
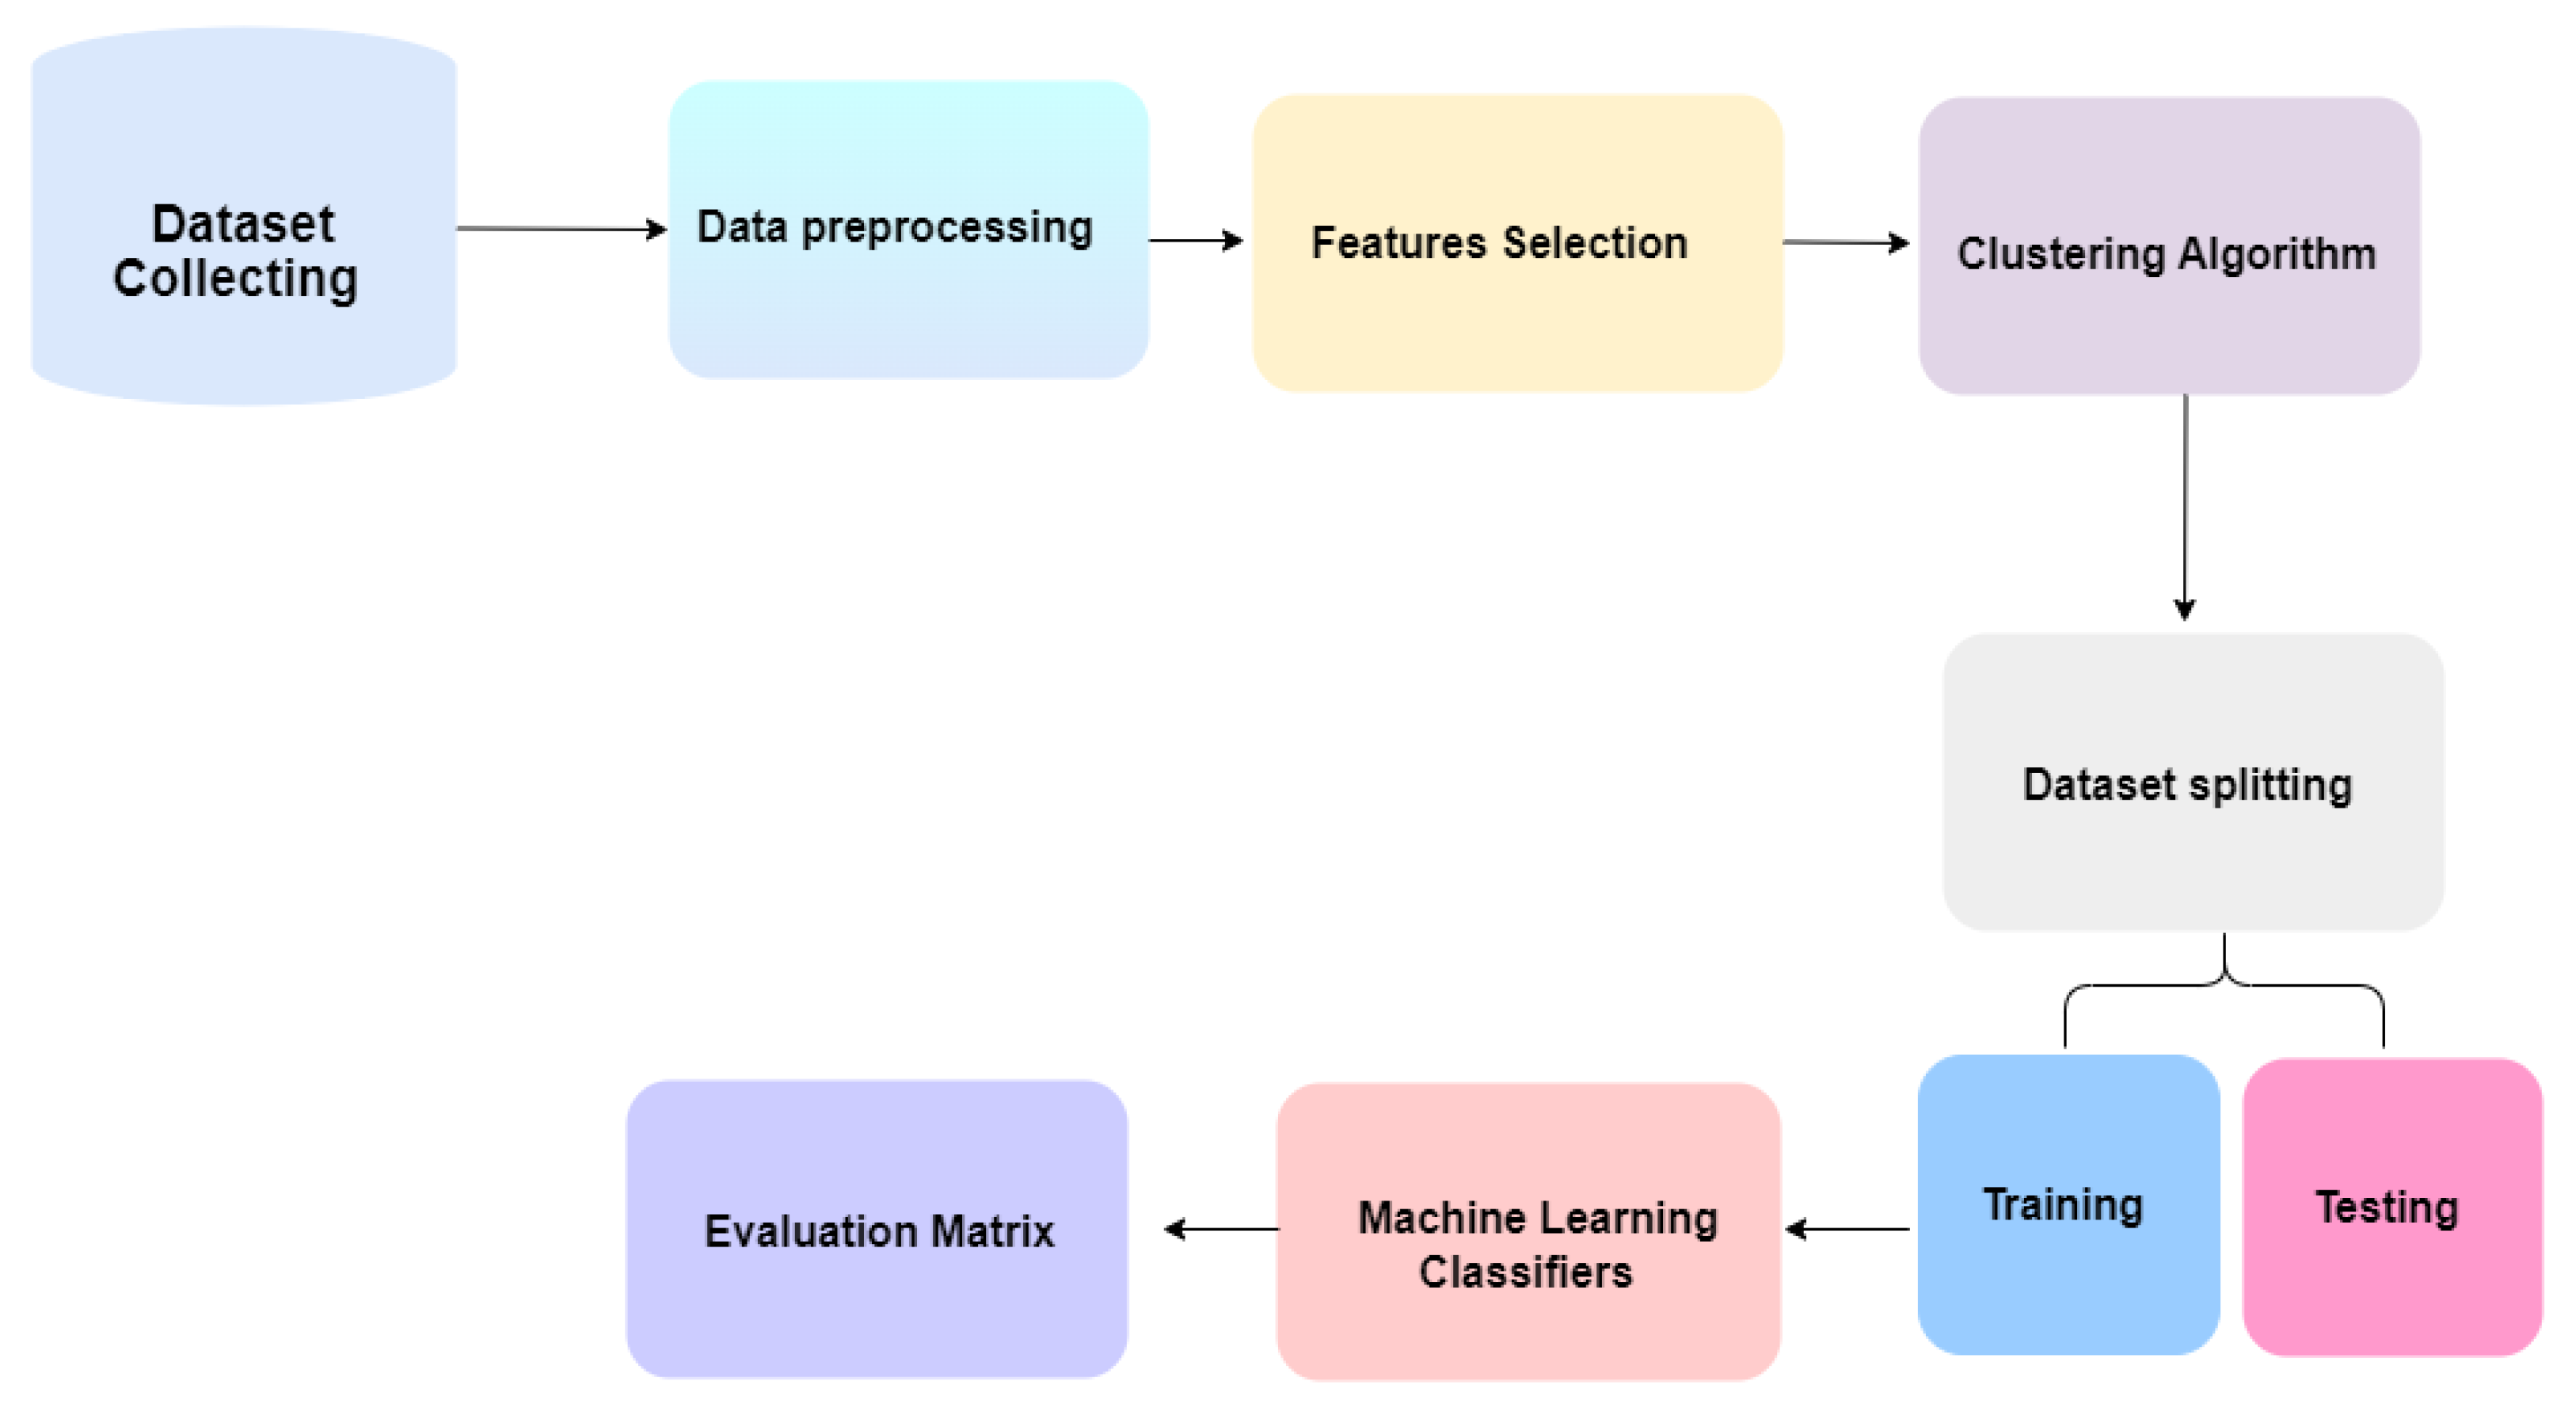
33]. This study developed a machine-learning approach to Big Five personality test dataset to give decision makers in organizations or businesses detailed information on the personalities of applicants and more insight into how they react in different situations, which can help in selecting occupations for employees. The proposed methodology has seven phases, as follows:
Figure 2 shows the structure of the methodology.
3.1. Dataset Collection
Open Psychometrics collected this dataset from participants worldwide through an online model [
34]. This dataset contains information from 1,015,342 individuals who answered the questionnaire, which comprised 50 questions. It is publicly available on Kaggle [
35].
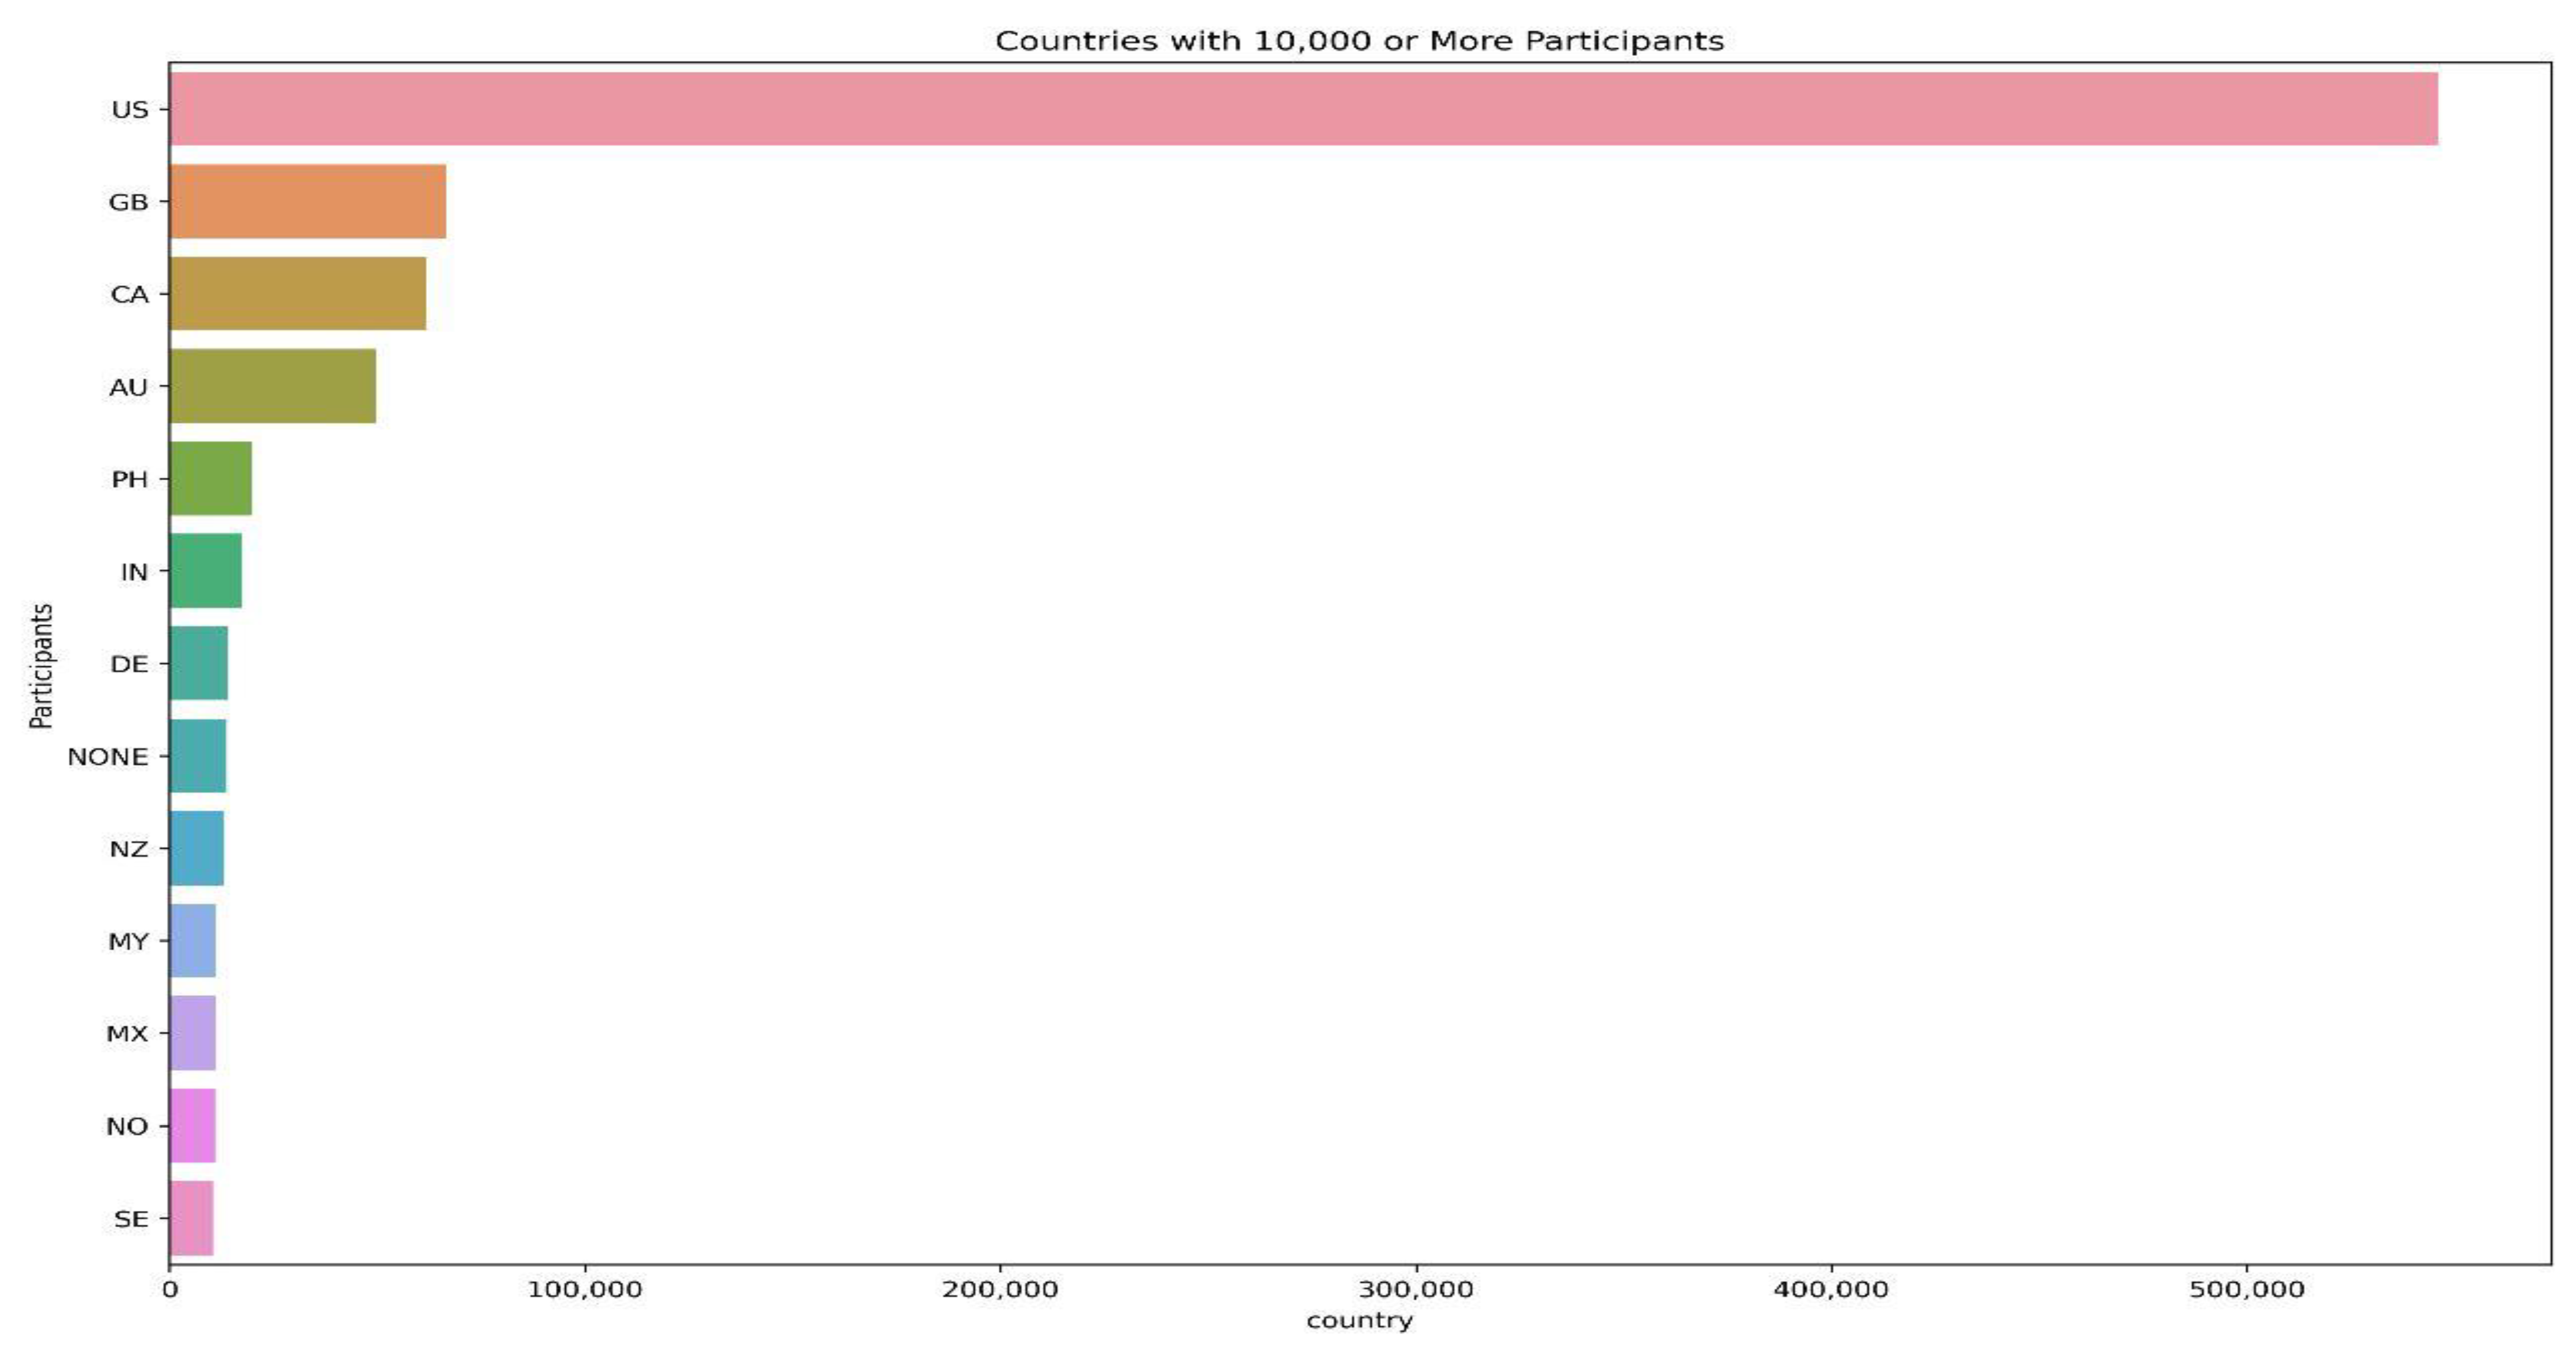
Figure 3 shows the countries with 10,000 or more participants. A large number of participants were from the following countries: USA, with 545,912 participants; the UK, with 66,487; Canada, with 61,805; Australia, with 49,753; the Philippines, with 19,844; and India, with 17,482. Some countries had few participants. These included Yemen, with 14 participants, and Burundi, with one participant.
3.2. Data Preprocessing
This dataset needed processing because it had missing values. When no value was stored for a particular feature in the dataset, the “dropna” method was used to clean the dataset. The dataset also contained some unwanted features; therefore, we focused on the responses to questions that only related to personal traits. Next, MinMaxScaler was used to scale the data. It modifies attributes by scaling each attribute to a specified range. The default range is between 0 and 1. Subsequently, principal-component analysis (PCA) was used to reduce the dimensionality of the data and k-means for clustering to label the data. The following sections explain the rest of the preprocessing.
3.2.1. Correlation Testing Using Pearson’s Approach
The Pearson correlation coefficient (named after Karl Pearson) can be used to summarize the strength of the linear relationship between data samples. Python software 3.9 was used to find correlations between features. It is expressed by Equation (1), below.
The range of the correlation is between −1 and +1. When the correlation value is closer to zero, there is no linear trend between the two variables. When the correlation is close to 1, the correlation is more positive, which means that a change in one variable affects the other variable. A correlation closer to −1 is similar, but instead of increasing, one variable decreases as the other increases [
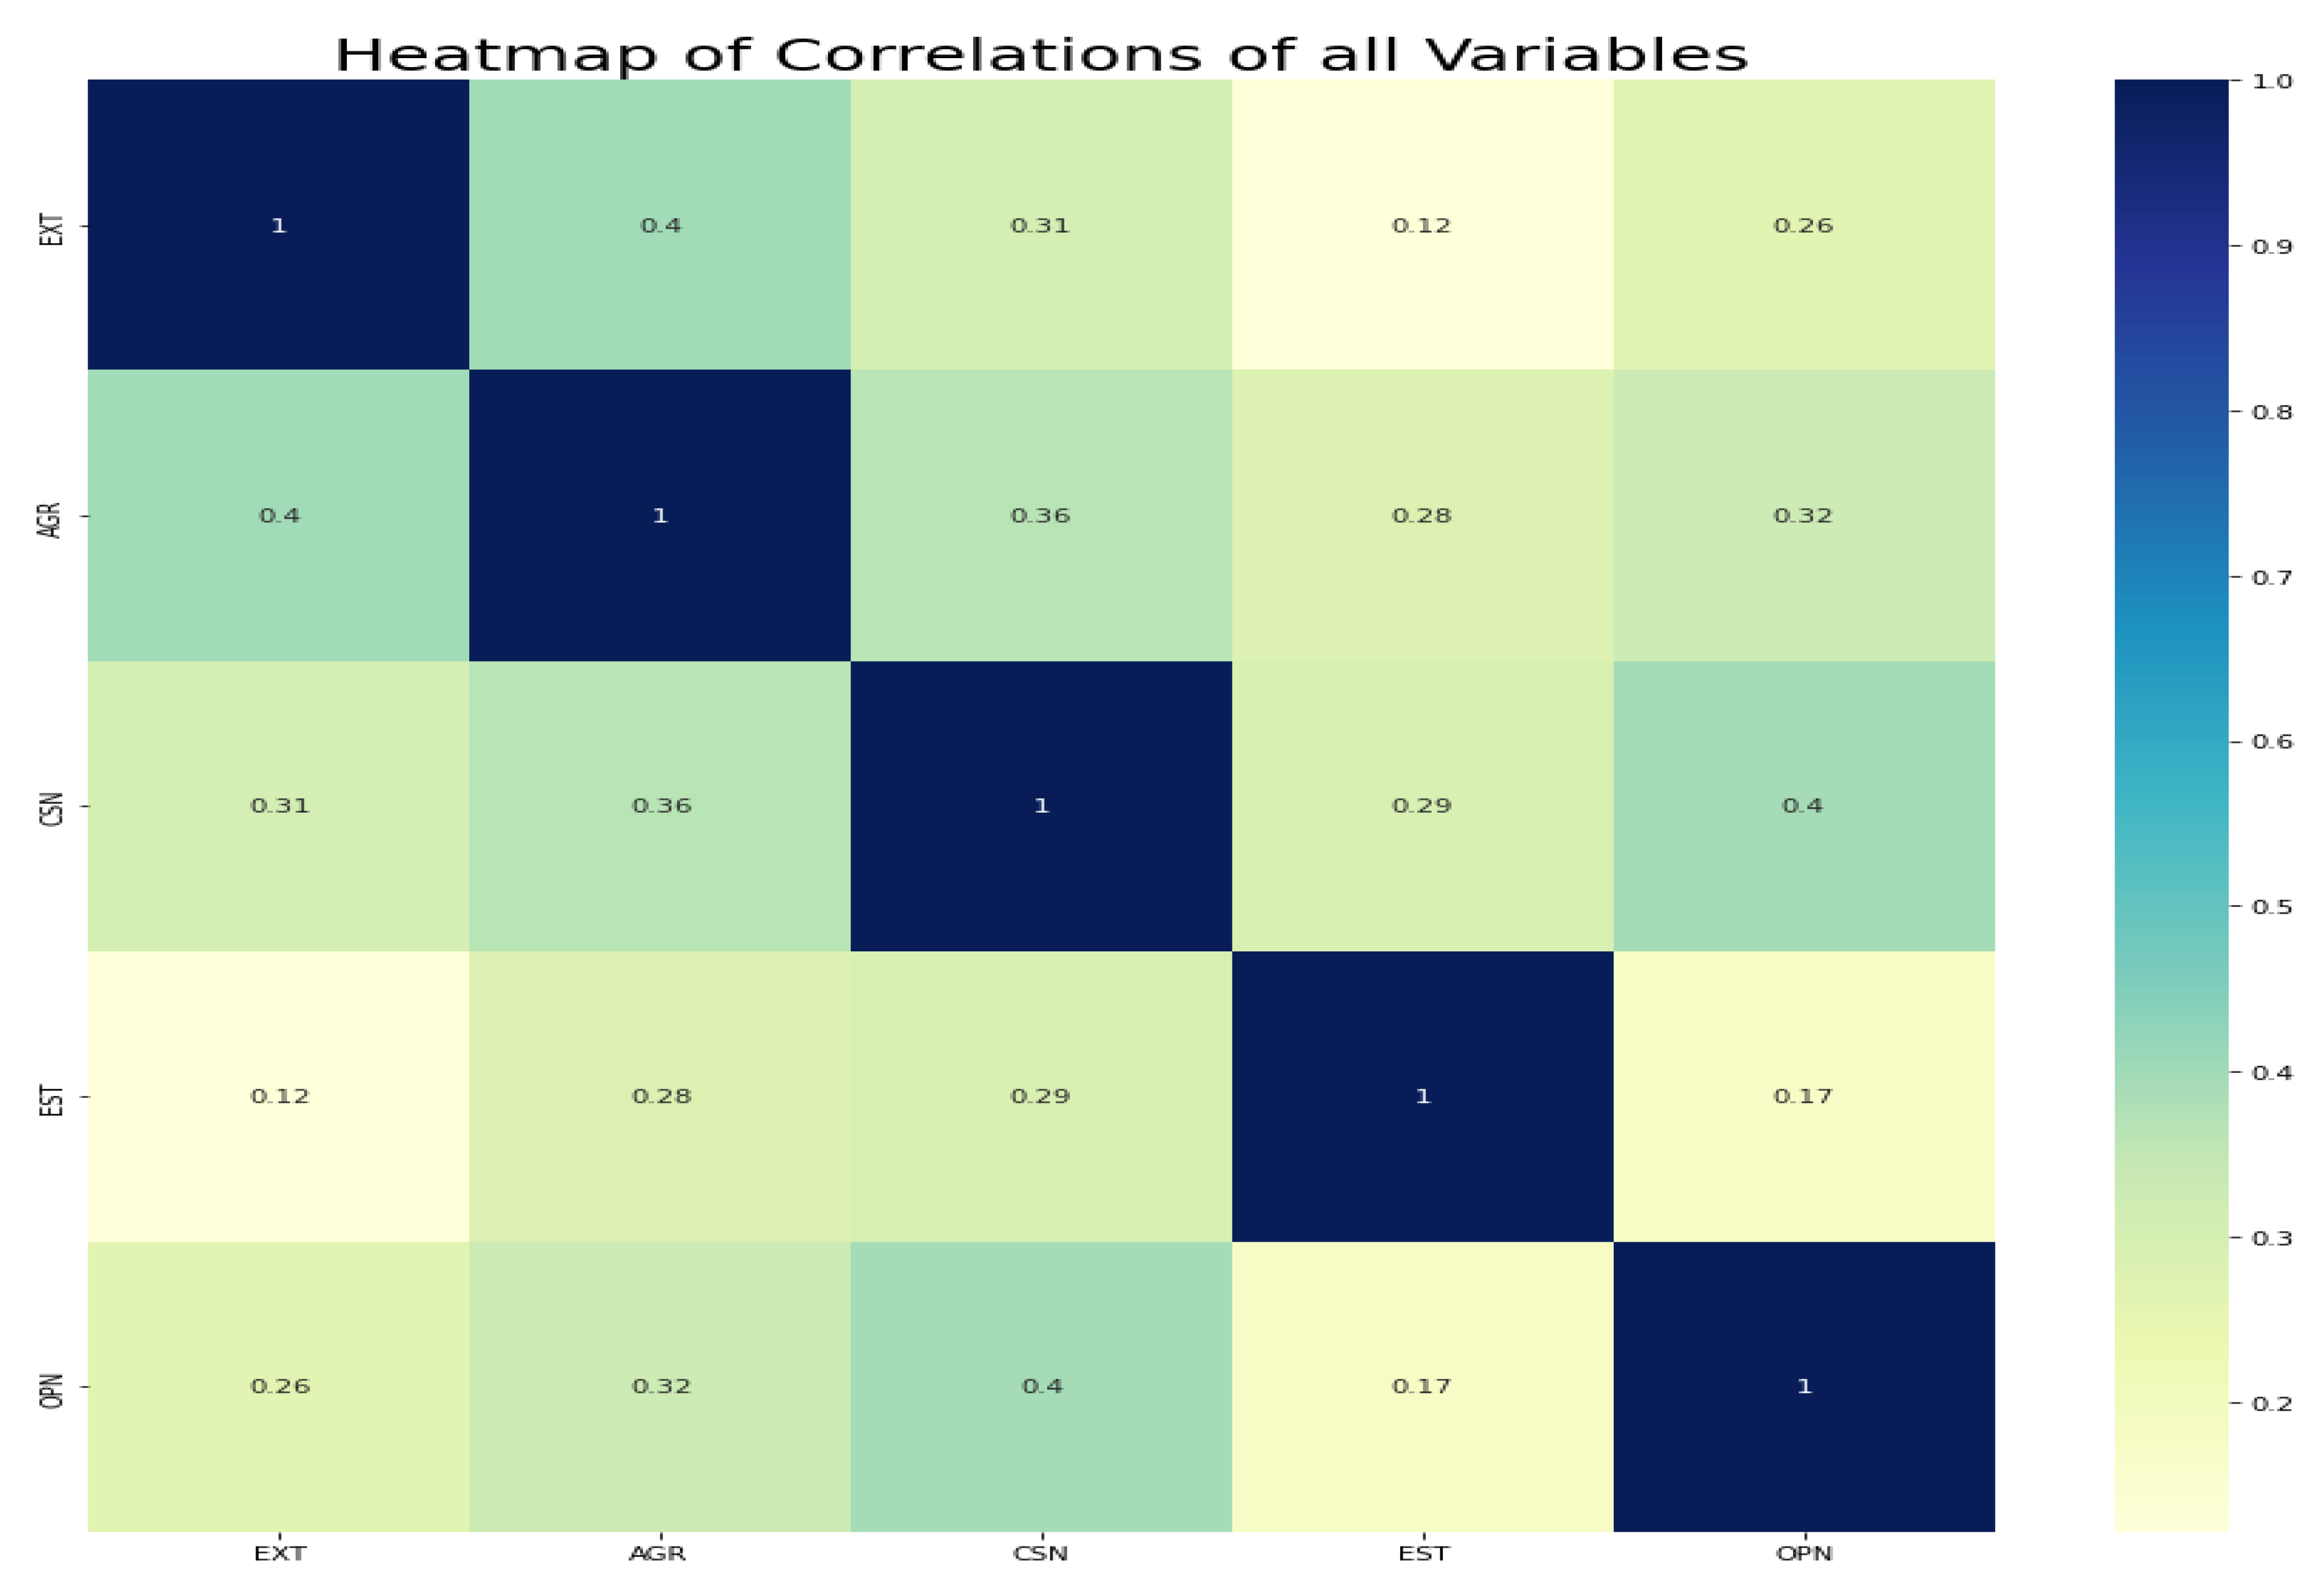
36]. The heatmap shows that the diagonals are all “1,” dark blue, because these squares correlate each variable with itself (indicating a perfect correlation). For the rest of the values, the larger the number and the darker the color, the stronger the correlation between the two variables. The plot is also symmetrical about the diagonal, since the same two variables are paired together in these squares. To make the heatmap in
Figure 4 more comprehensible, we combined the personality traits into five variables using the mean value of 50 variables and tested the correlations.
Figure 4 shows a positive relationship between conscientious personality (CSN) and open personality (OPN), of 0.4. Furthermore, there was a positive relationship between extraversion personality (EXT) and agreeableness personality (AGR), of 0.4. In addition, there was a positive relationship between the AGR and the CSN, of 0.36. When we compared the correlations between any personality trait and neuroticism personality traits, we found a weak correlation, as shown in
Figure 4.
3.2.2. Feature Selection
The dataset used in this study had 50 features, and each group of personal traits had 10 positive and negative questions. These groups had strong internal correlations. To develop our model, we used a subset from the dataset of 20,000 (20 k) samples, because of the limitations of computer configurations. However, PCA was applied. Principal-component analysis is an unsupervised learning approach used to decrease the dimensionality of data features and is extensively employed as a dimensionality-reduction algorithm [
37,
38,
39]. Reducing the dimensionality of input dataset features used to train and test a predictive model achieves a higher performance level. From another perspective, it makes large datasets easy to process and classify in less calculation time. The main objective of the PCA algorithm is to wrap high-dimensional features into a set of lower-dimensional spaces and then reconstruct them. The PCA can be calculated by Equation (2), where
is the mean and
a set of input features.
Table 1 shows results of PCA method when selecting significant features.
where
i and
j are simply index variables that are used to refer to different data features within a dataset.
3.2.3. Clustering Algorithm
Clustering is the process of gathering data into groups based on patterns of similarity and distance. In this study, the dataset was not labeled; for this reason, we applied clustering to label the data. The use of k-means clustering is a simple way to divide a dataset into K groups that do not overlap. To implement k-means clustering, we must first assume how many clusters we require [
40,
41]. The k-means algorithm then locates each observation in one of the K clusters. The number of clusters was determined using the Elbow method.
Elbow method for clustering determination
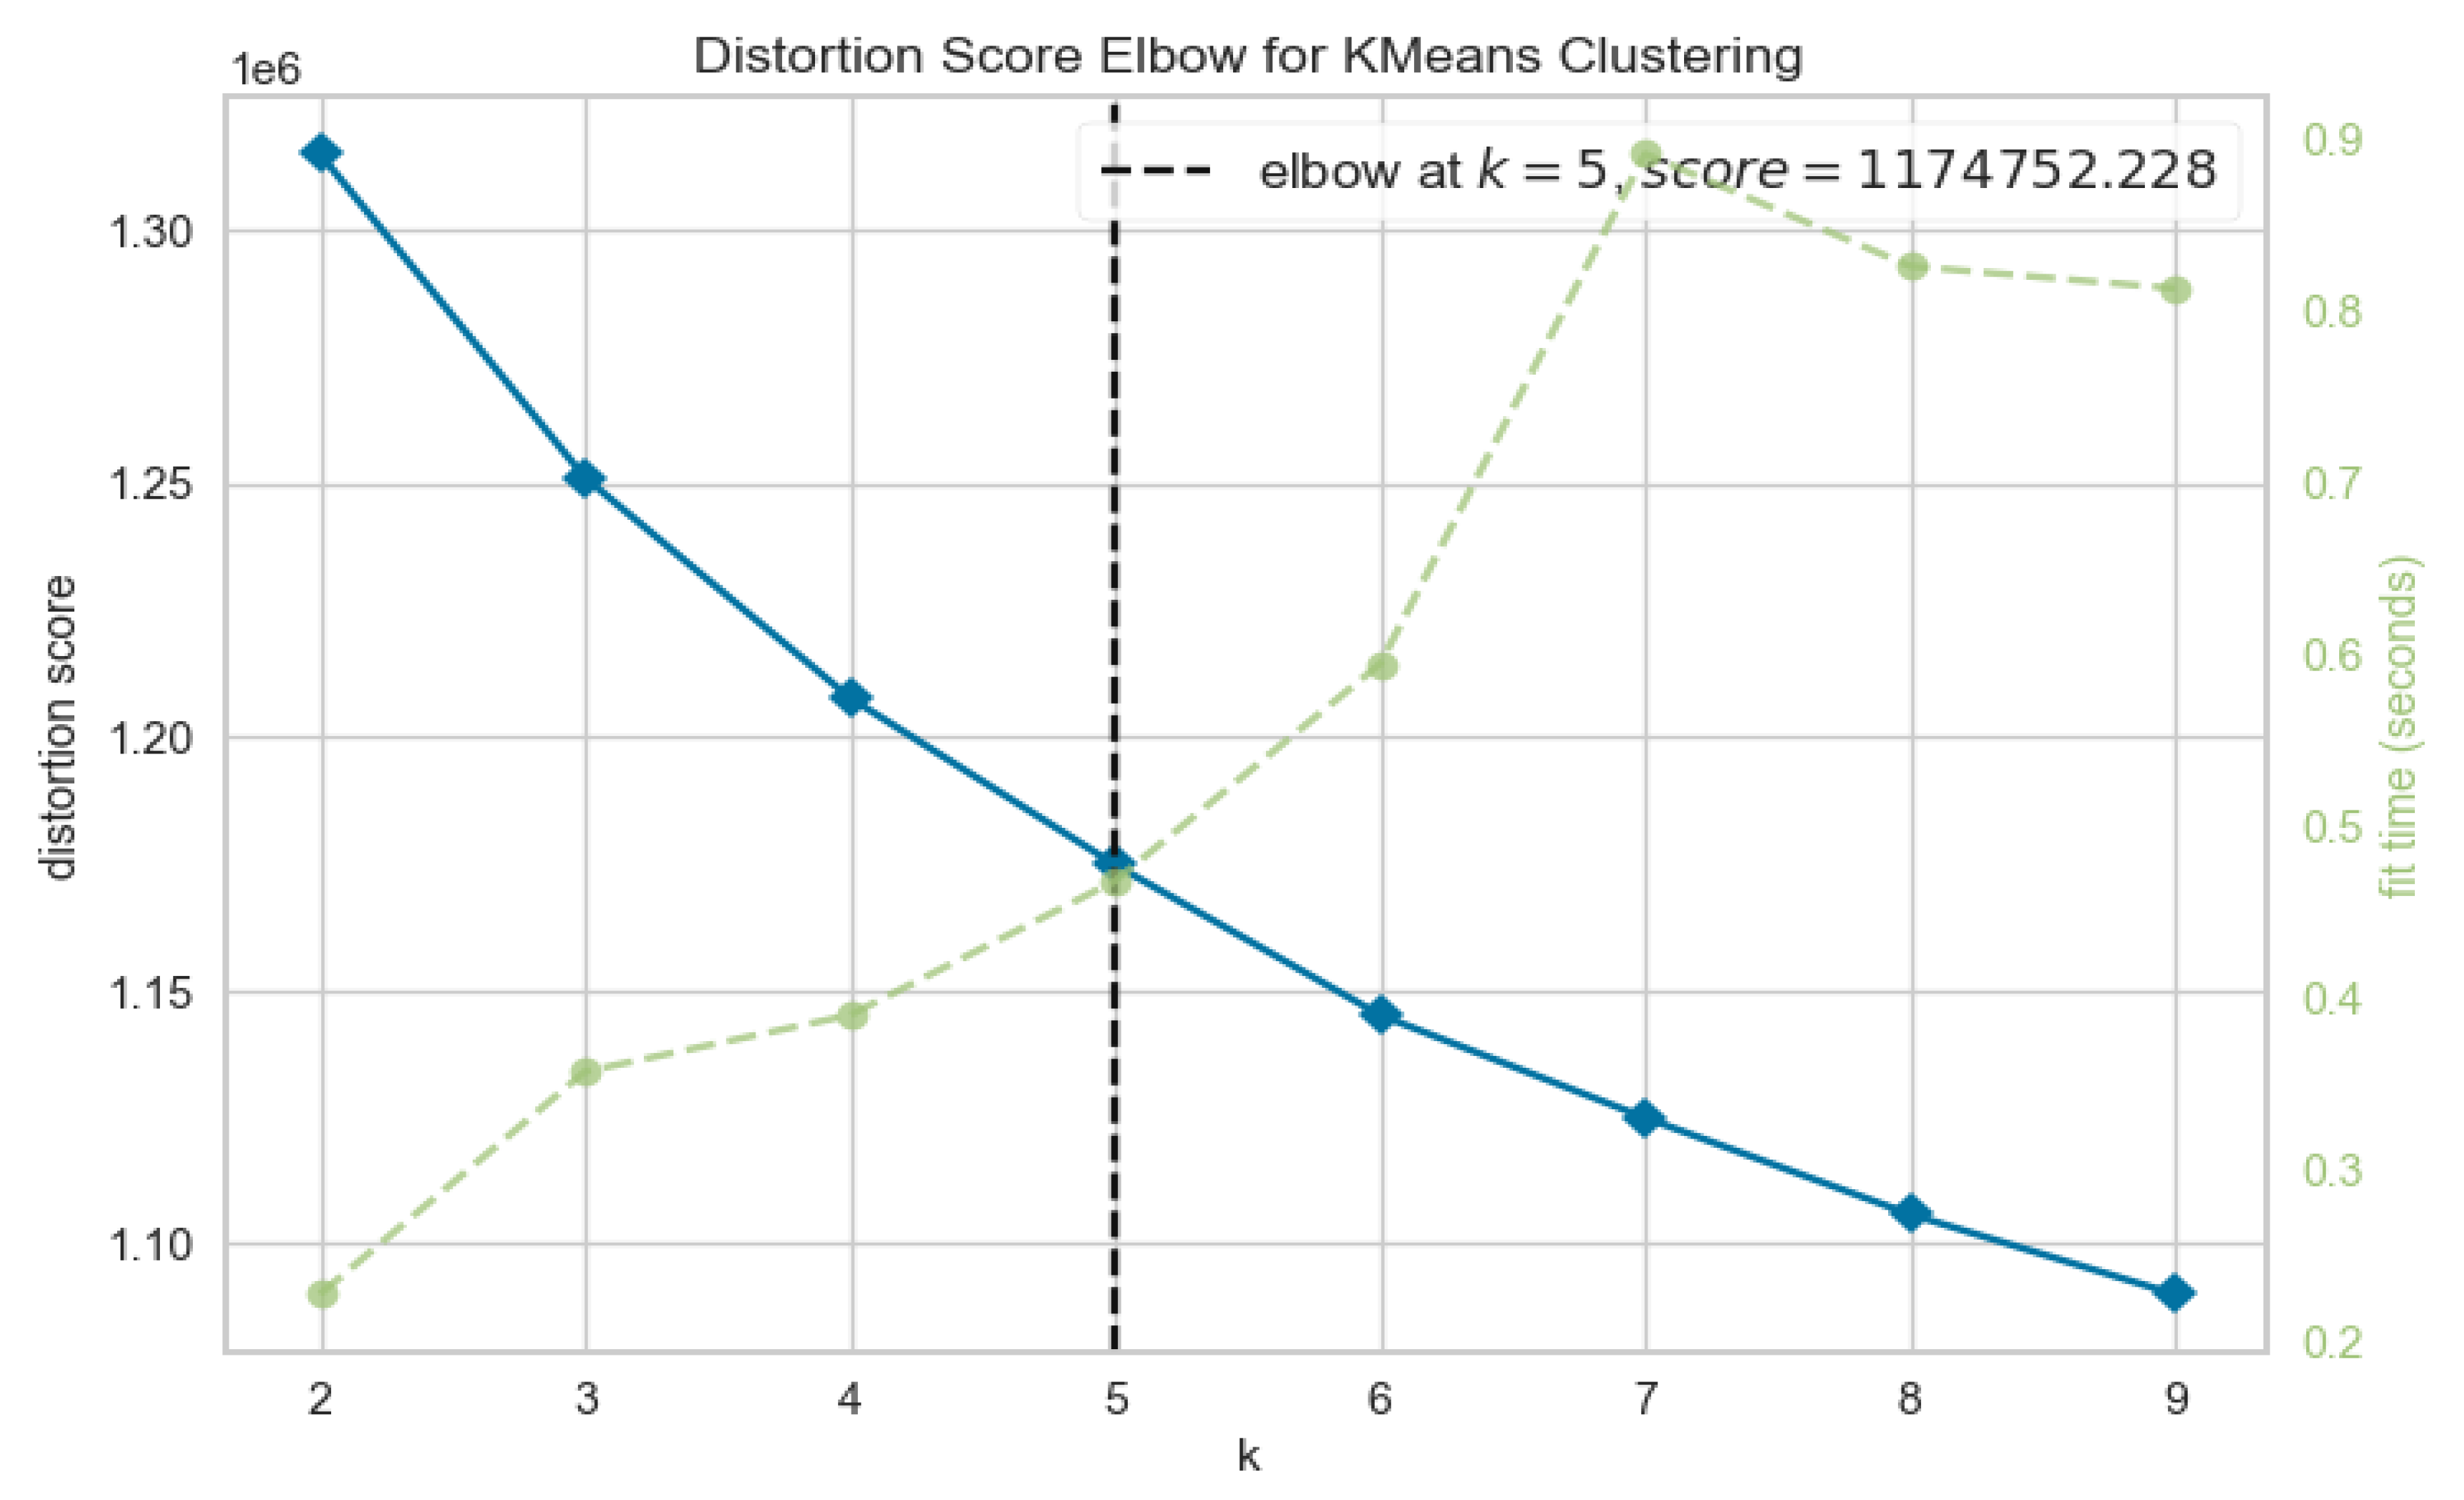
The Elbow method is one of the most popular methods for determining the optimal value of k, referring to the number of clusters. The idea behind the Elbow method is based on how the arm is made. However, the structure of the Elbow method may change based on how the parameter “metric” is set. The Elbow method used a k-means algorithm to determine the k number of clusters by setting in the range (k = 2 to 9) to find groups in unlabeled data. The method detected five clusters, as shown in
Figure 5.
The k-means algorithm grouped the data by dividing the samples into n groups with the same degree of variation. This was achieved by minimizing what is called inertia, or within-cluster sum-of-squares. The aim was to discover a centroid with the least amount of inertia or within-cluster sum-of-squares. The following is an explanation of how k-means works:
Step 1: Calculate the value “K,” which denotes the number of clusters. In this instance, we chose K = 5 (agreeableness, extraversion, openness, conscientiousness, neuroticism).
Step 2: Initialize a cluster by choosing, for instance, five different centroids at random from fresh data points. If “K” is equal to 5 and there are five centroids, cluster initialization occurs.
Step 3: Calculate the distance between each point and the centroid. For instance, calculate the distance between the first point and the centroid.
Step 4: Assign each point to the closest cluster and then measure the distance between the initial point and the centroid.
Step 5: As the new centroid, compute the mean of each cluster. Each cluster’s mean should be used to update the centroid.
Step 6: Repeat steps 3–5 with the new cluster center. Repeat until reaching a halt, indicating convergence (no more changes), as well as the maximum number of repetitions. The process is complete when the clustering does not change during the preceding round.
The algorithm created groups based on the similarity between the answers, and it was arranged in five clusters. The next step was training and testing output-cluster data based on machine-learning models.
3.3. Machine-Learning Models
Supervised learning is a machine-learning method that is applied using labeled datasets. The models based on this method must determine the mapping function connecting the input variable (X) to the output variable (Y). After the data were labeled, using a k-means clustering algorithm, we trained and tested several machine-learning algorithms to obtain a high-accuracy model to predict measurements of different personality traits. Random forest (RF), linear support vector machine (LSVM), K-nearest neighbor (KNN), and AdaBoost algorithms were applied to divide the dataset into the following classes: Class 0, Class 1, Class 2, Class 3, and Class 4.
3.3.1. Support Vector Machine (SVM) Method
Support-vector-machine classification is a supervised-learning algorithm that uses support-vector machines to classify feature values into different categories. This algorithm is particularly useful for linearly separable data, meaning the feature values can be easily separated into distinct categories based on their features. One of the main advantages of SVM classification is its ability to handle high-dimension data and large datasets. It can also handle cases in which the data are not linearly separable by using kernel functions to transform the data into a higher-dimensional space, in which they become separable.
Support-vector-machine classification works by finding the hyperplane in a high-dimensional space that maximally separates different classes. In predicting personality traits, SVM classification can be used to identify patterns in the data indicative of specific traits. For example, a hyperplane separating individuals high in openness from those low in openness may be identified through SVM classification, allowing for accurate predictions of an individual’s openness level. In this research, the radial basis function (RBF) was employed to classify the data [
42].
where
) is Euclidean distance between the input variables.
3.3.2. AdaBoost Method
AdaBoost (adaptive boosting) classification is a machine-learning technique. It works by iteratively training weak classifiers, which are models that perform slightly better than chance, and then combining them into a single strong classifier (Freund and). The weak classifiers are trained on different subsets of the data, with a greater weight given to misclassified samples in order to focus on improving their classification. One of the key benefits of AdaBoost classification is that it can be applied to a wide range of classification problems, including binary and multi-class classification. It has also been shown to perform well in cases in which the data are unbalanced.
AdaBoost classification can be used to predict personality traits in order to identify patterns in the data indicative of specific traits. For example, a classifier combining multiple weak learners that can accurately predict an individual’s openness level may be identified through AdaBoost classification.
3.3.3. K-Nearest Neighbors (KNN)
K-nearest neighbors (KNN) is a classification technique that is both one of the easiest and one of the most essential in ML. In the fields of pattern recognition, data mining, and intrusion detection, supervised learning is one of the strategies that is used the most often. Because it does not make any fundamental assumptions about the manner in which data are distributed, it is entirely superfluous in the context of real-world scenarios [
43,
44]. The KNN algorithm’s goal is to determine the class label that should be applied to a particular query point by locating the points that are geographically the most similar to that location. We determined that the k value should be set to 3.
The k value is employed to locate and compute the points in the feature vectors that are closest to each other. As a result, the value must stand out. Furthermore, and are feature vectors for finding the closest point
3.4. Evaluation Metrics
A model was evaluated by testing an algorithm on an unseen dataset that was not used during the training step to analyze the model performances. In these experiments, we used several standard micro averages of a metric, such as confusion matrix, accuracy, f1-score, precision, and recall. The classification results were also quantified using the ROC metric, which calculated the false-positive and false-negative samples, as illustrated in the representation graph below. A confusion matrix shows four categories of results: (1) true positive (
TP), (2) false negative (
FN), (3) false positive (
FP), and (4) true negative (
TP). The equations for these metrics are as follows:
3.5. Experimental Results
This section presents the empirical results from experiments conducted to classify participants’ personal traits into Class _0, Class_1, Class _2, Class _3, and Class_4. The participants belonging to Class_0 were identified as having the same medium score measurements for three traits, extraversion, agreeableness, and openness, and low scores for conscientiousness and neuroticism. Class_1 means the participant has a high score for neuroticism and a low score for conscientiousness, openness, extraversion, and agreeableness. Class_2 means the participant has a high agreeableness score and a medium score for other traits. Class_3 means that the participant has a low conscientiousness score and similar scores for other traits. Class_4 means that the participant has identical scores for openness and agreeableness and the same medium scores for the other three traits. We used 20,000 samples as a subset of the Big Five personality-test dataset.
The training and testing of the used dataset were carried out by using two different data-split approaches: traditional data splitting and cross-validation splitting.
3.5.1. Traditional Data Spilt
The samples were split as follows. In total, 70% were placed in the training set and 30% were used to test various machine-learning models to detect and classify participants’ personal traits. These models included KNN, SVM, RF, and AdaBoost. Performance evaluation of each model was conducted using weighted-measurement metrics, such as precision, recall, f1-score, and accuracy. In addition to these metrics, a confusion matrix was also applied.
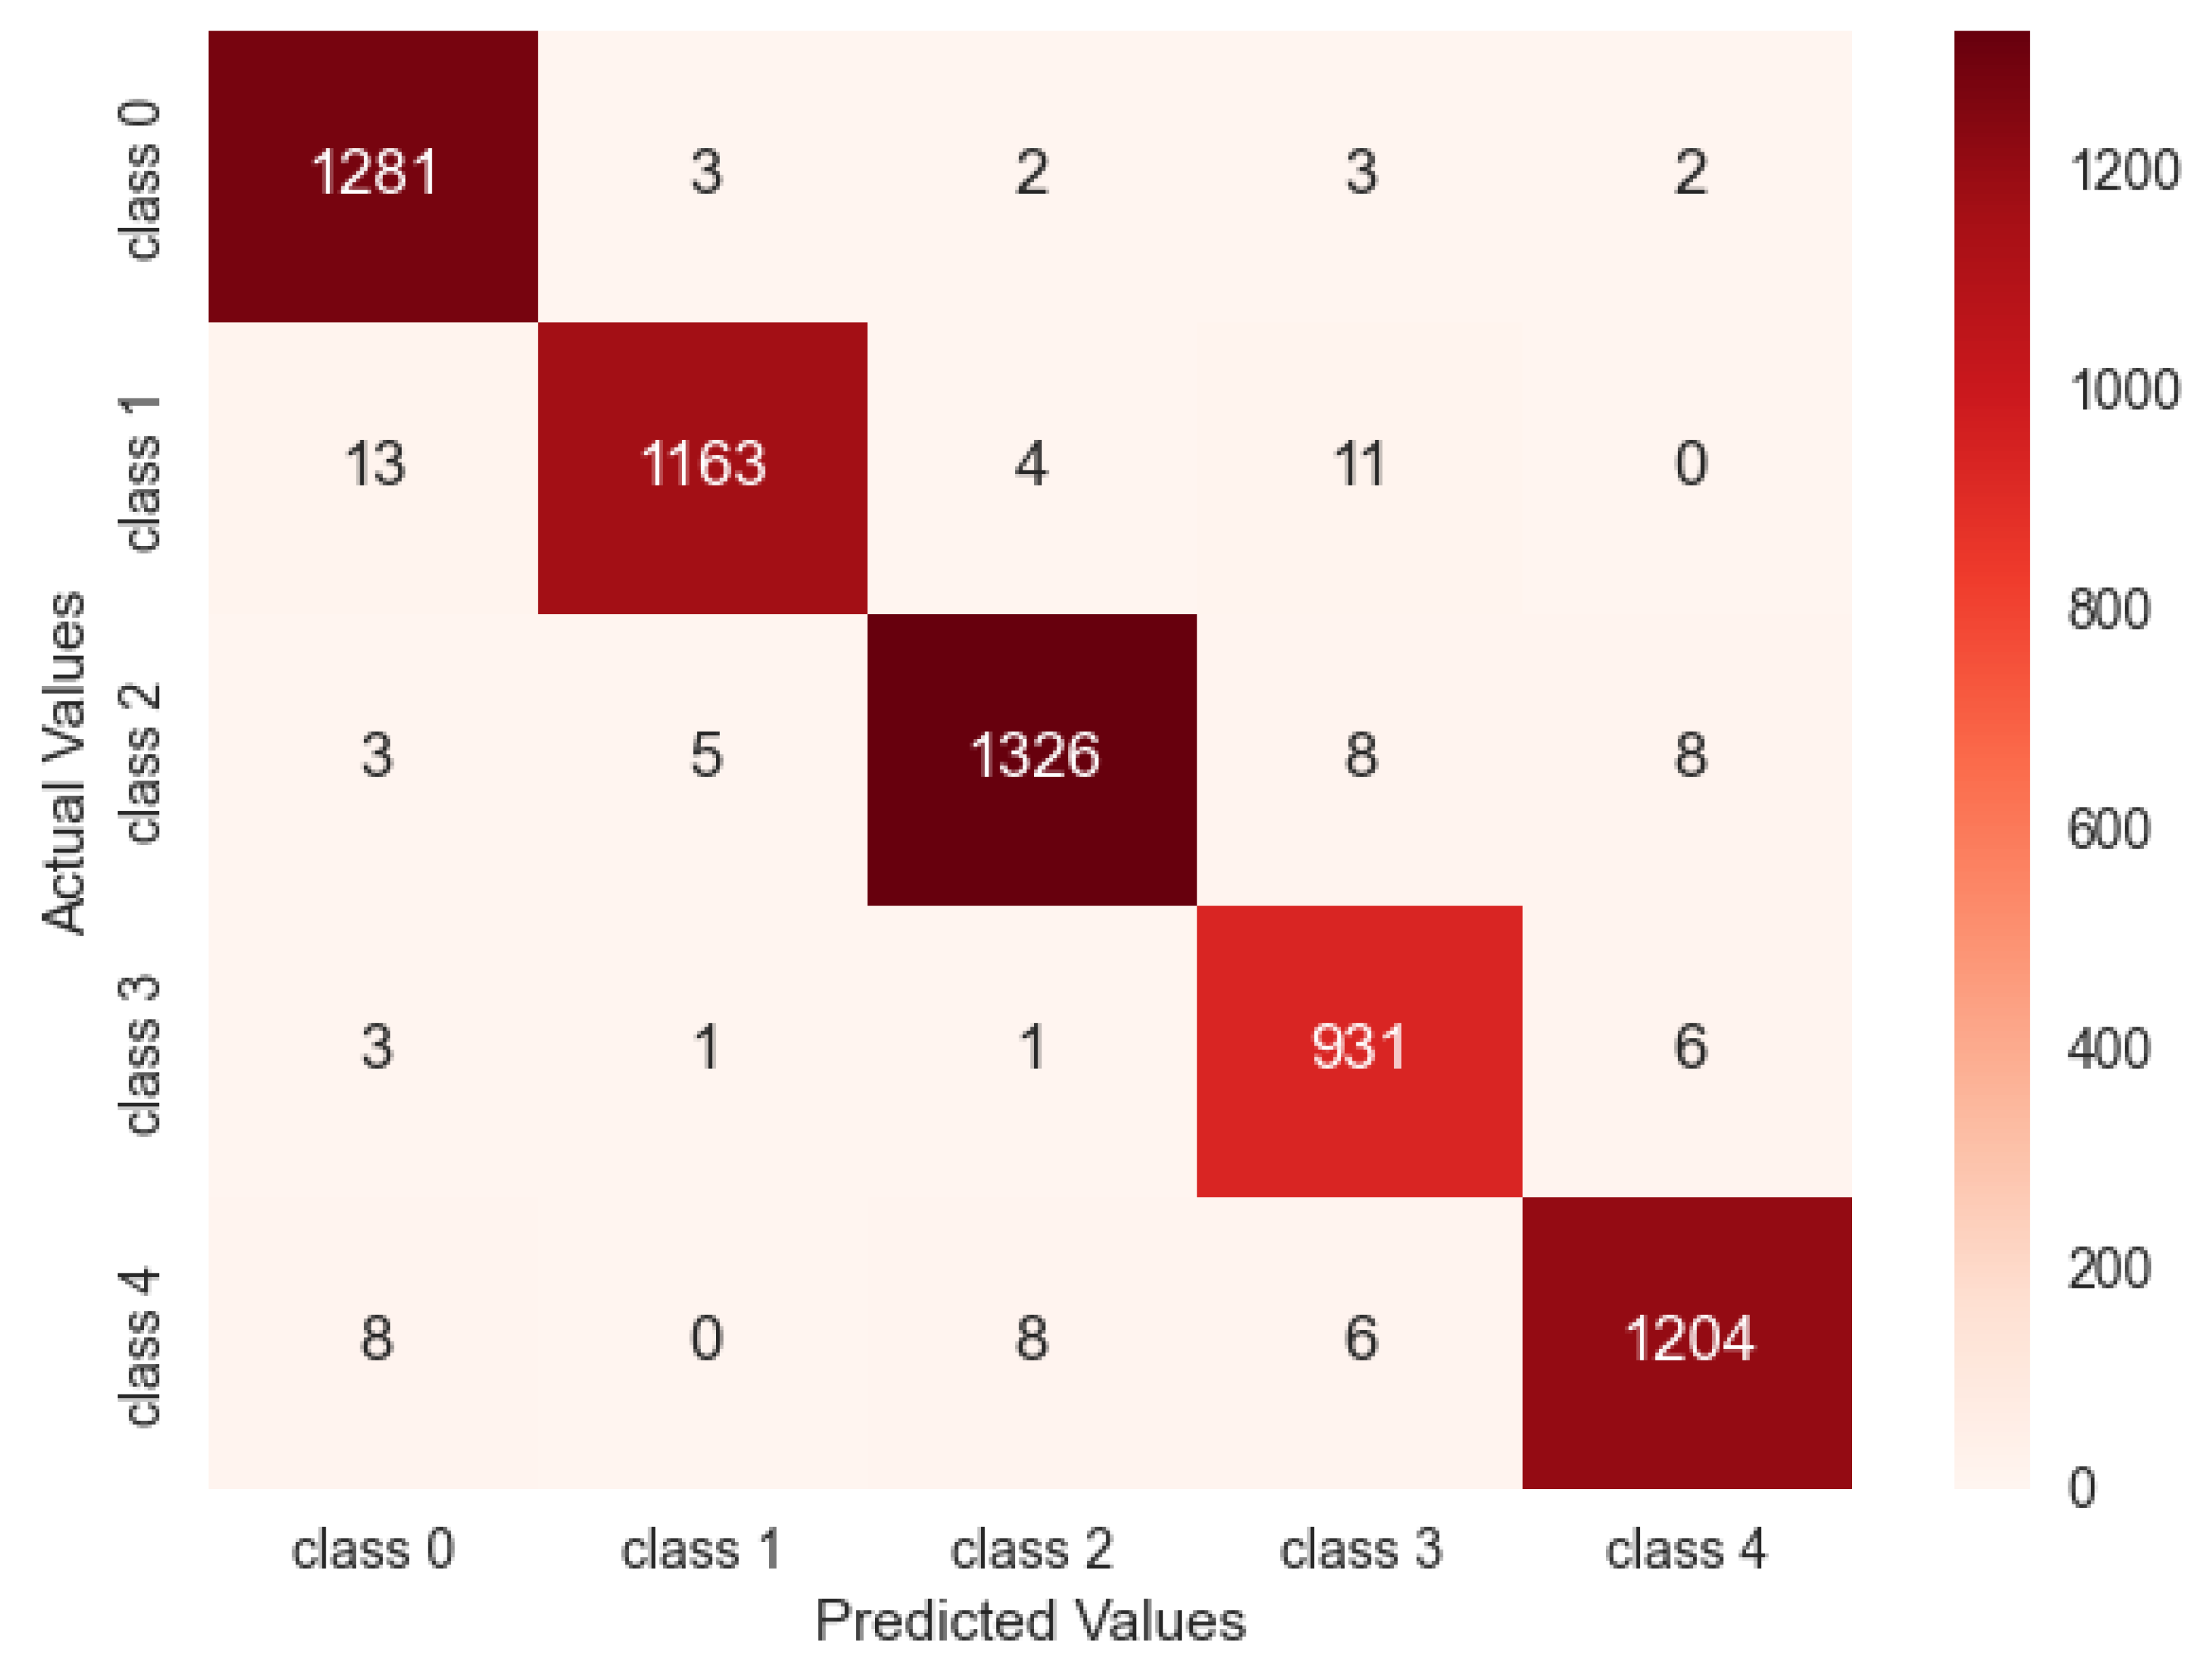
Figure 6 shows the confusion matrix for the best model-classification results.
Based on the results of the confusion metric, the SVM model obtained 95 misclassified samples out of the 6000, which were used as a testing set. The model’s performance was reliable and could be applied to classify the participants’ personality traits accurately.
Table 2 summarizes the classification results of the traditional data-splitting models.
Table 1 and the confusion matrix in
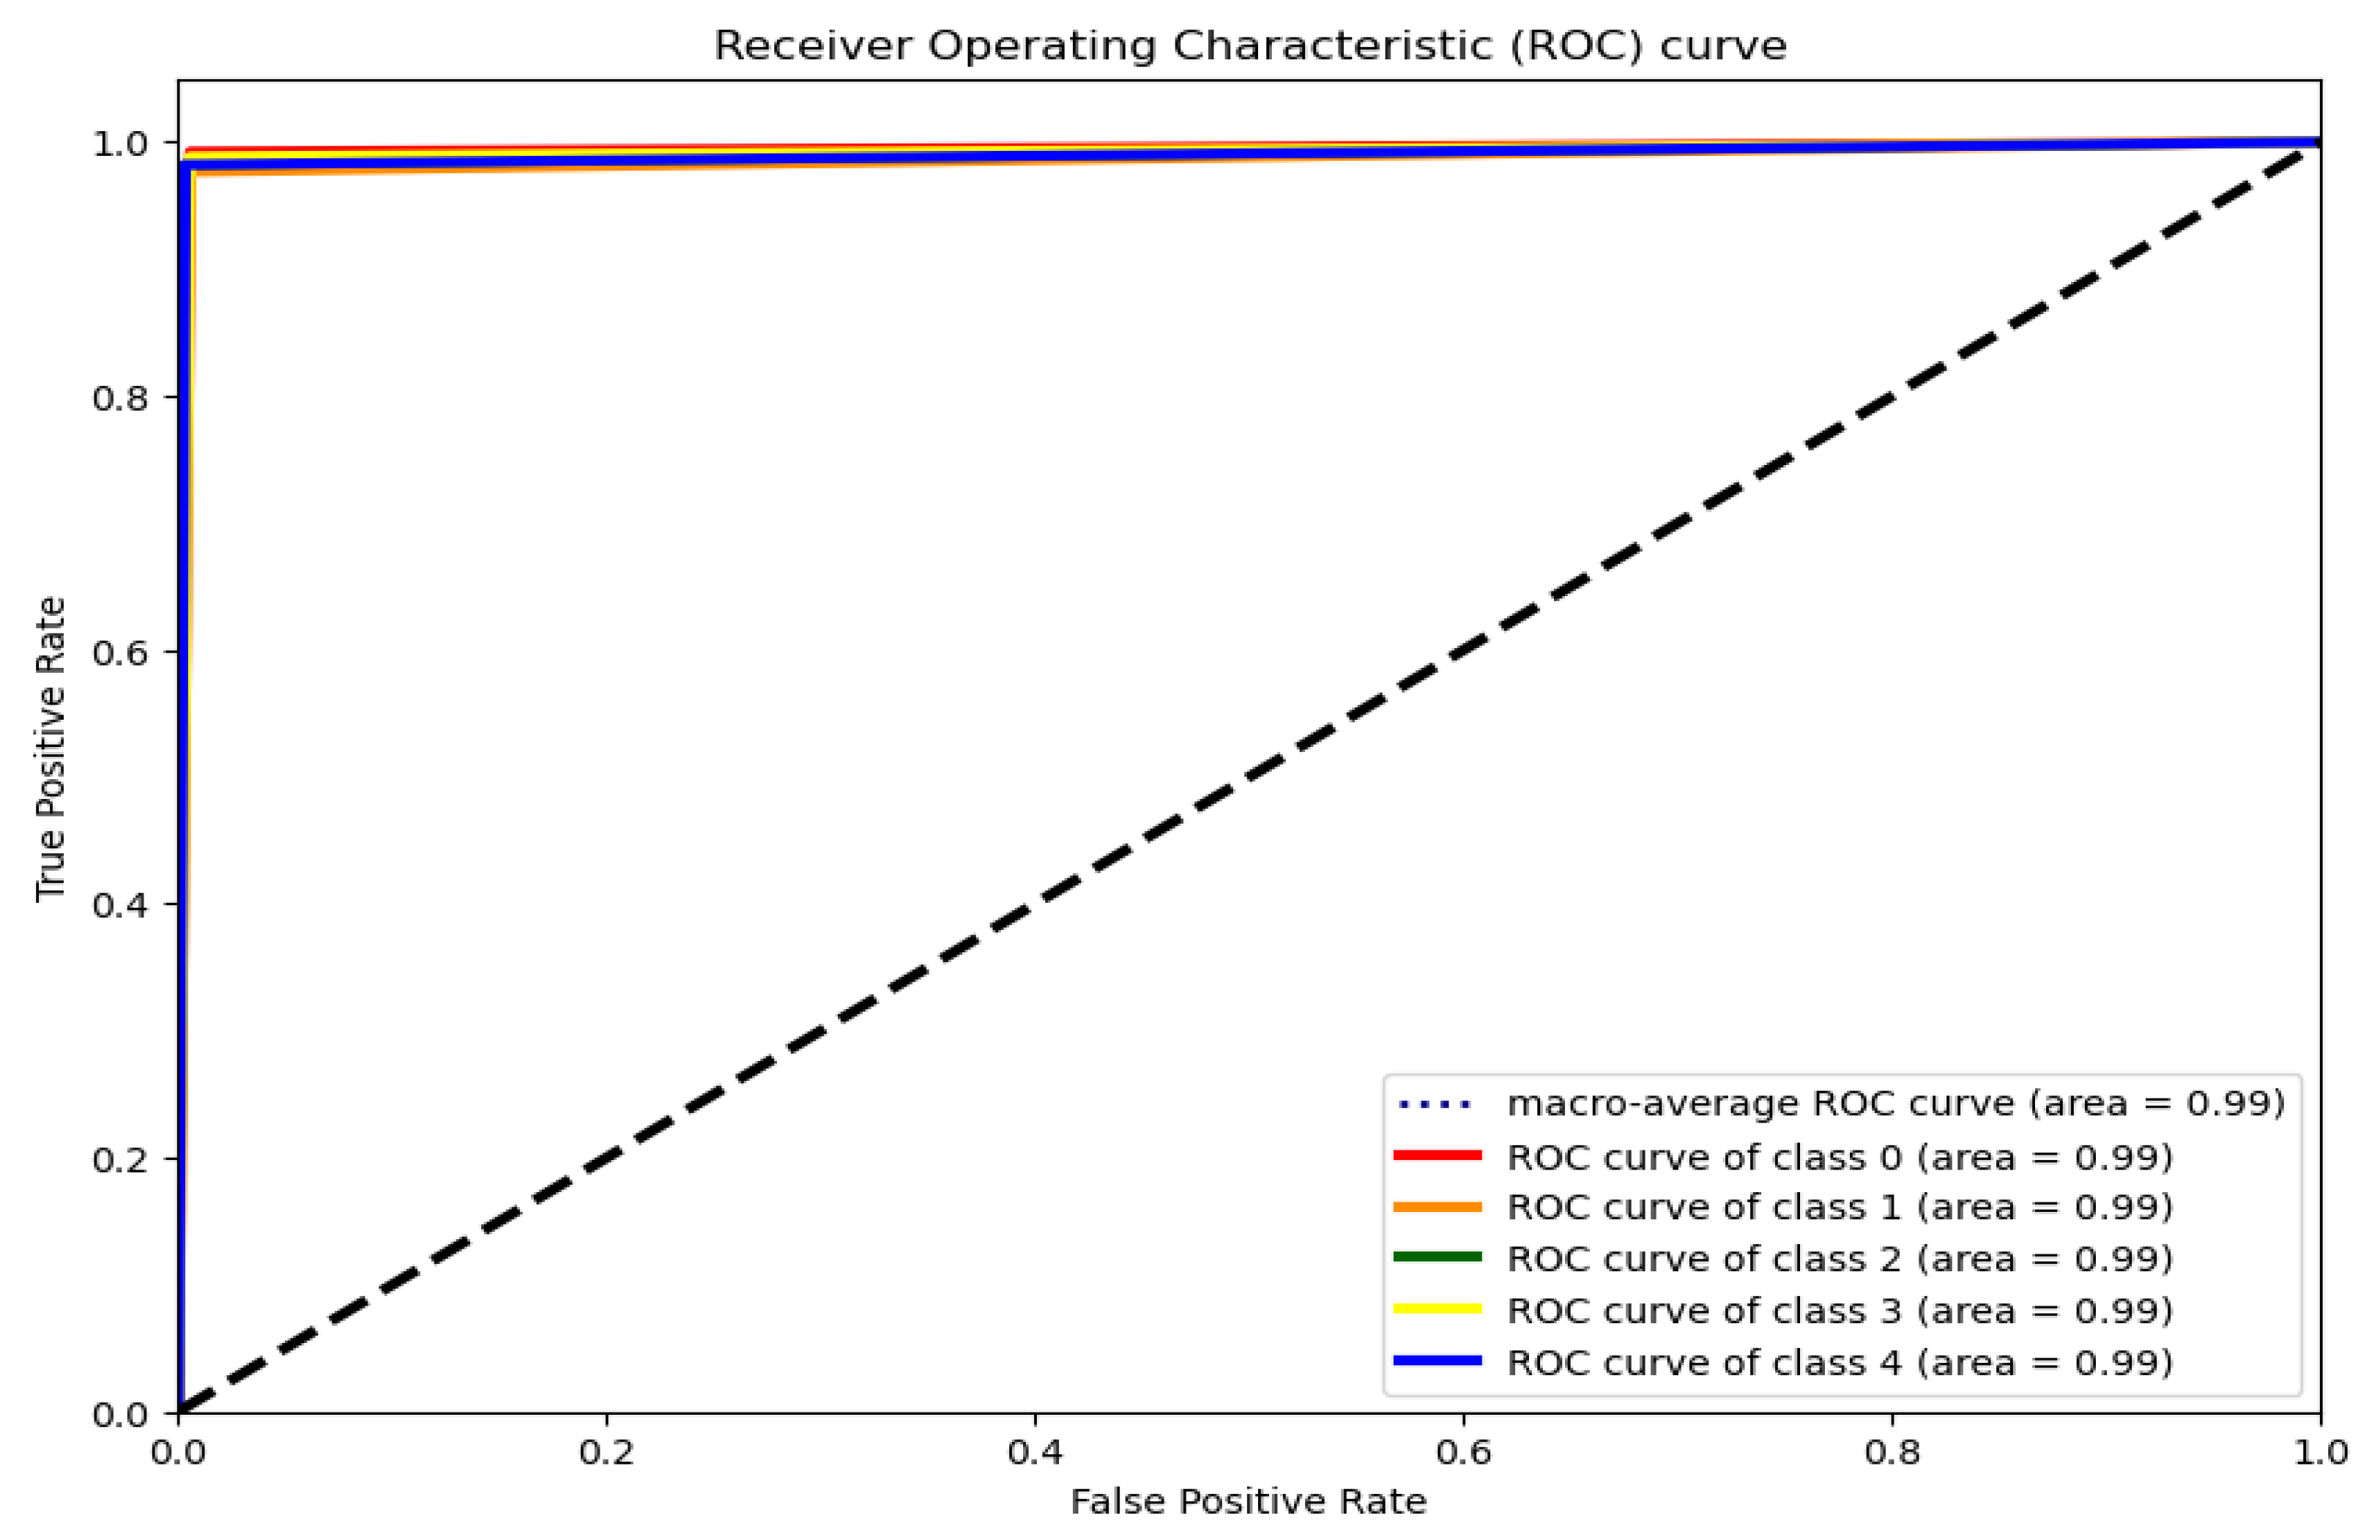
Figure 6 analyze the performances of the proposed models. By comparing the results of the evaluation metrics, we found that the SVM classifier proved its effectiveness and efficiency with an accuracy of 98%. Furthermore, it outperformed the other classifiers in classifying and predicting participants’ personality traits using different categories, as described in the previous section. Furthermore, poor performance was observed using the AdaBoost model. The ROC curve for the SVM classifier is shown in
Figure 7 shows ROC of SVM method in the training and testing evaluation method.
3.5.2. Cross-Validation Spilt
Cross-validation is a statistical method used to evaluate the performances of machine-learning models. It involves dividing a dataset into separate training and testing subsets and using the training subset to fit the model. The model is then evaluated on the testing subset to assess its performance. This process is repeated multiple times, with different subsets of the data used as the training and testing sets each time. In this study, we implemented a common k-fold cross-validation method to ensure the accuracy of our results, as shown in
Table 1.
In this experiment, we used five-fold cross-validation, which is a resampling procedure used to evaluate the performance of our proposed machine-learning models. It involves dividing the dataset into five subsets (folds), training the model on four folds, and evaluating its performance on the remaining fold. This process is repeated five times, with a different fold used as the test set in each iteration. The performance measure is then averaged across all five iterations to estimate the model’s performance with unseen data. The testing results of the KNN, RF, SVM, and AdaBoost classifiers using the five-fold cross-validation are presented in
Table 3,
Table 4,
Table 5 and
Table 6. The experiential results clearly show that SVM classifier provided the best performance and outperformed other classifiers.
4. Discussion
In this study, we presented a personal-traits-testing model based on machine-learning techniques that can help organizations and government agencies to select appropriate employees for specific jobs or to form a working team to perform a specific task. The compatibility of team qualities contributes significantly to the success of large businesses and the achievement of their strategic goals. The model was designed based on a standard dataset collected from the responses of individuals worldwide. Machine-learning techniques were used in the data analysis, clustering, and classification. For the clustering task, the k-means algorithm successfully sorted the data into five clusters, each containing similar personal patterns from the participants. These clusters were agreeableness, conscientiousness, extraversion, openness, and neuroticism. To the best of our knowledge, no other study has applied the same idea and dataset. However, some previous studies were identified in the literature review, such as social-identity personality traits based on social-media data [
15,
21], and in other domains, such as healthcare (using questionnaires [
24]) and education [
22].
Table 7 shows a comparison of the proposed system’s results with those of previous studies.
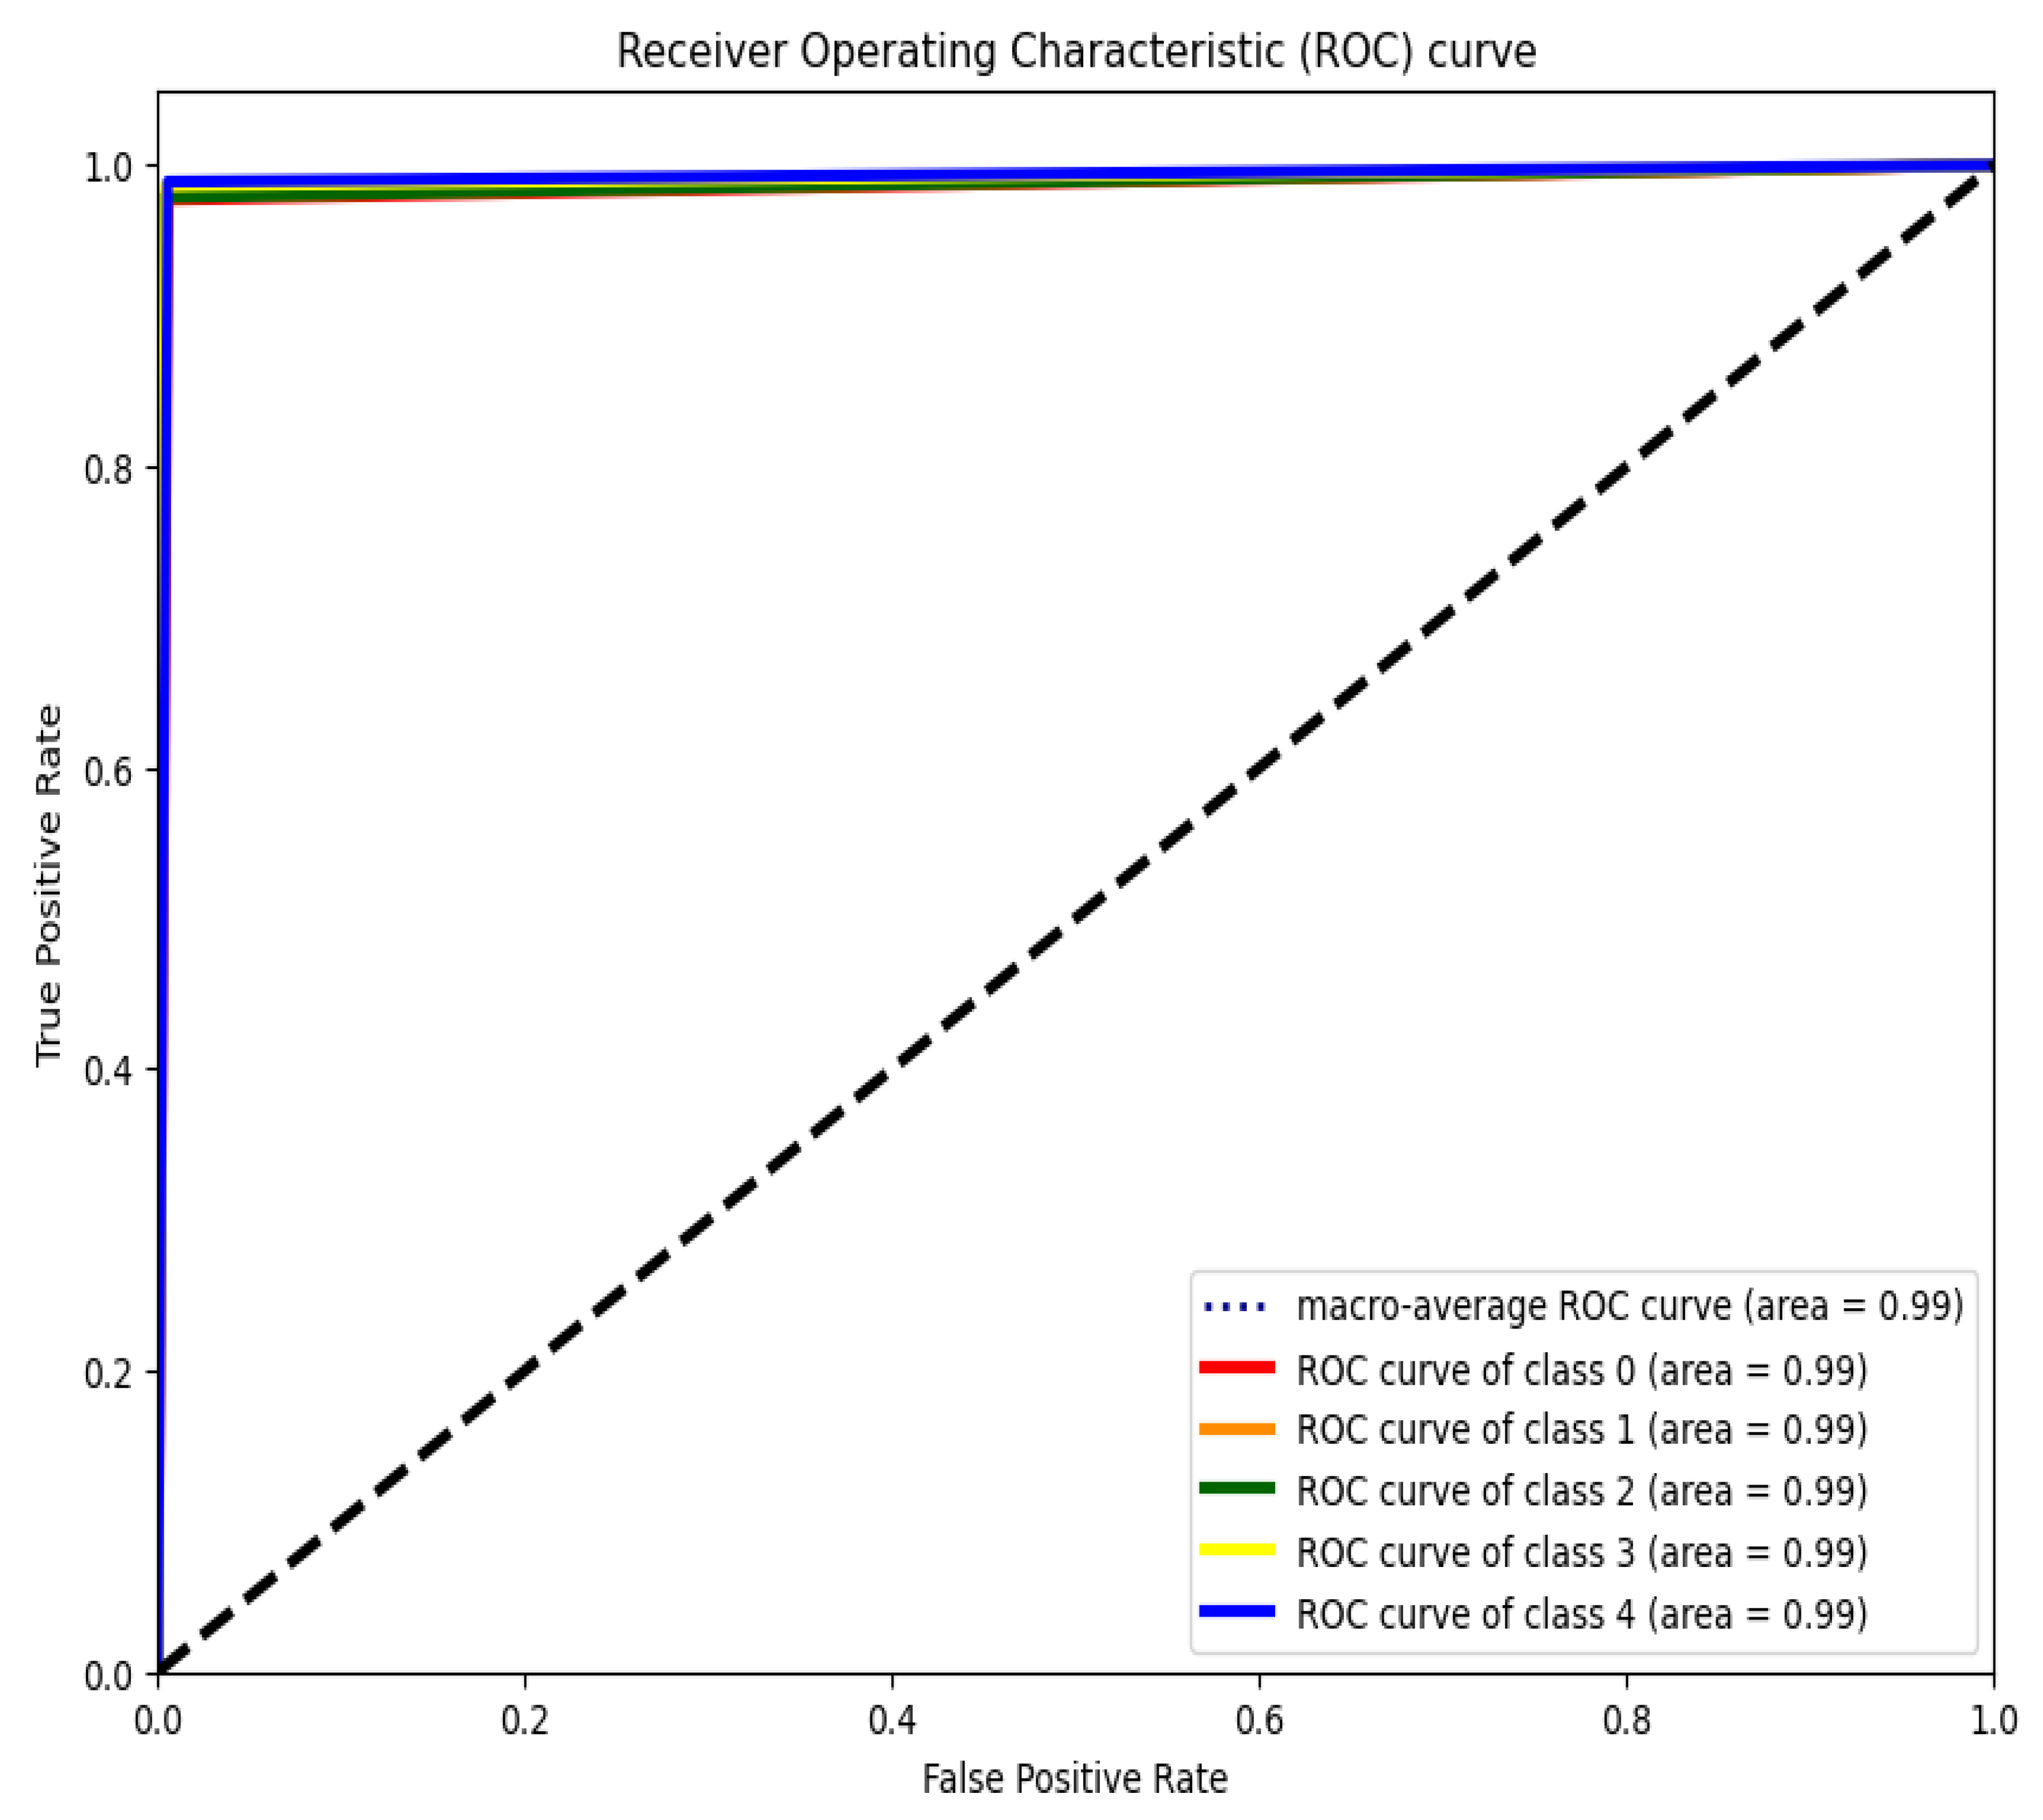
Figure 8 shows ROC of SVM method in cross validation method.
The application of information technology in the management of human resources has developed steadily in different countries, along with the level of information technology. Human-resource-management information systems have the potential to reduce the amount of information transmitted, as well as the amount of time this requires. Additionally, it has the potential to release human-resource personnel from mundane administrative tasks, and change the mode of service that human-resources departments provide, transforming into a management role involving the provision of decision-making support and solutions
5. Conclusions
This study concluded that behavioral tests must be applied in human-resources management and performance management to motivate qualified employees toward achieving organization’s strategic goals. The study analyzed behavioral data collected from 20,000 participants through a publicly available dataset on the Kaggle platform. We obtained the Big Five personality-test results to cluster the participants by type of behavior. Supervised machine-learning models were used to analyze the responses to the questions according to personal traits. The algorithm was able to divide the individuals into a group of clusters; each cluster was a set of similar personality traits.
The findings of the study were as follows:
The internal correlation test of the groups for every ten questions showed a positive correlation.
There was a positive relationship between the following four traits: agreeableness, conscientiousness, extraversion, and openness.
The relationship between one personality trait, neuroticism, and the other four personality traits was negative.
This test helps to identify participants’ psychological and behavioral traits in any domain.
Companies and organizations prefer participants who can integrate and adapt to their work teams.
This test can be a source of safety for organizations in preventing violent behavior.
Machine-learning models, such as SVM, RF, KNN, and AdaBoost, were used to classify personalities based on psychological traits, derived from the participants’ responses, with satisfactory results. By comparing the evaluation-metrics results, we found that the SVM classifier proved effective and efficient, with an accuracy of 98%. Furthermore, it outperformed the other classifiers in classifying and predicting the participants’ personality traits using different categories. Finally, poor performance was evident when using the AdaBoost model.
The proposed personal-traits-testing model can be adopted. Its accuracy rate is high, and it can save time and effort compared to personal interviews and direct questions to determine the characteristics of the candidates. The answers to these questions may be untrue and hide aspects of a candidate’s true personality. Organizations can apply this proposed methodology to evaluate employees’ personality traits during their work on strategic plans. Achieving the goals that maintain an organization’s image requires people with specific personal and behavioral skills. Analyses of user preferences and behavioral predictions based on user data may provide some useful reference points for optimizing information structure and improving service accuracy. These can be learned from the data. However, the OCEAN user-personality-model-identification algorithms still have certain limitations. The machine-learning algorithm is one modern approach with a comparative advantage. This algorithm may be quickly adapted to meet a broad range of directional issues, which makes it a competitive option. When we began to write this paper, one of our primary objectives was to improve the identification process used by the OCEAN personality model via the application of a neural-network approach. The plan for advancing this direction of study is to develop a model based on deep-learning algorithms.
