1. Introduction
In the rapidly evolving landscape of financial markets, the interplay between media sentiment and stock prices has emerged as an important area of study. This paper delves into this dynamic, focusing on the impact of digital media sentiment on the stock prices of three prominent technology companies: Microsoft, Tesla, and Apple. With the increasing influence of digital news and social media on public opinion, understanding how sentiment, as captured through news titles and descriptions, correlates with stock-market behavior is of paramount importance.
The purpose of this research is to dissect the nuanced relationship between media sentiment and stock-market dynamics, particularly in the context of large-cap tech firms. These companies are known for their market sensitivity to public sentiment, making them ideal subjects for this study. Employing advanced statistical methods such as Pearson correlation, wavelet coherence, and regression analysis, the study aims to quantitatively assess the extent to which fluctuations in stock prices can be attributed to the polarity of media sentiment.
This investigation is particularly significant in today’s digital age, in which the reliance on digital news and social media is ever-increasing. The insights gained from this study are expected to benefit investors, financial analysts, and market strategists in making informed decisions. By understanding the underpinnings of market movements in relation to media sentiment, stakeholders in the financial markets can better navigate the complexities of stock-market predictions.
The central focus of this research revolves around the degree to which media sentiment, as reflected in news titles and descriptions, correlates with and influences the stock prices of major tech companies. The research aims to establish the correlation between media sentiment and stock-price fluctuations and explore the temporal dynamics of this relationship. Furthermore, it seeks to provide a foundational understanding and insights into how sentiment analysis can be a useful tool for predicting stock-market trends, especially within the technology sector.
In this study, we specifically focus on the impact of media sentiment on the stock prices of Microsoft, Tesla, and Apple, chosen for their significant presence in the market and sensitivity to public sentiment. By using Polygon.io to aggregate news articles and TextBlob for sentiment analysis in titles and descriptions, we discern sentiment trends in media coverage. Our analysis also encompasses stock opening and closing prices from
finance.yahoo.com (accessed on 8 October 2023) over a year, from September 2022 to September 2023. This approach melds sentiment analysis with stock data, providing insights into the influence of media sentiment on stock dynamics in key tech companies.
2. Literature Review
The study of sentiment analysis, also known as opinion mining, plays an important role in the computational analysis of sentiments, attitudes, and emotions within textual content, especially in the financial domain [
1]. This interdisciplinary field, incorporating natural language processing and text analytics, aims to classify the polarity of sentiments in various texts [
2]. Despite the substantial progress made in sentiment analysis in finance, particularly in evaluating financial texts for market prediction [
3], there remains a need to critically analyze and identify gaps in existing research to further the understanding of this complex interplay. There remains a gap in understanding how different types of sentiments, particularly in news titles versus descriptions, uniquely influence financial markets. Our study aims to delve into this nuanced aspect.
Studies such as Refs. [
4,
5] have significantly advanced our understanding by demonstrating a positive correlation between sentiment scores and market returns. In addition to the complexities of sentiment analysis in the financial domain, it is critical to understand the influence of market-wide investor sentiment on the stock-price response to firm-specific news. In Ref. [
6], the authors found that investor sentiment significantly sways the stock-price response to news such as earnings announcements, dividend changes, and stock-split announcements, particularly in stocks characterized by attributes such as volatility and lack of dividend payments. Furthermore, the role of psychological factors in investment decisions cannot be overlooked. The investigation in Ref. [
7] into the impact of emotional intelligence on portfolio performance revealed that investors with higher emotional intelligence are more adept at managing and controlling their emotions during market fluctuations, positively influencing portfolio performance. This research complements our study’s focus on sentiment analysis by illustrating the significant impact of investor psychology on financial decision-making. However, these studies primarily focus on generalized market sentiments without delving into the specific impacts of different types of financial news, such as titles versus descriptions, on stock prices. Our research aims to fill this gap by providing a more nuanced analysis of how distinct aspects of media sentiment influence stock movements, specifically in major tech companies.
The development of new investor sentiment indices, as shown in Ref. [
8], marks an important advancement in predicting stock returns. However, the variability of sentiment’s predictive power during different economic phases, such as recessions or crises, has not been thoroughly explored [
9,
10,
11]. Our study contributes to this area by examining how sentiment impacts stock prices across various market conditions. Also, our study aims to capture this impact through a temporal analysis using wavelet coherence methods.
The influence of sentiment on stock-market dynamics, highlighted in Refs. [
12,
13], underscores the importance of sentiment in investment decisions. However, the temporal dynamics of sentiment influence, a key aspect of market behavior, remain underexplored. Our research addresses this by employing wavelet coherence analysis to uncover the temporal patterns in the sentiment–stock-price relationship.
The research conducted in Ref. [
14] delves into the role of sentiment and its manifestation in the trading behavior of investors in the U.S. stock market. However, there is a paucity of research on how these sentiments, when analyzed over different time frames, affect the trading behavior, an aspect our study addresses.
Historically, financial market predictions were heavily reliant on quantitative data, including price patterns and economic indicators. However, with the advent of the internet and the proliferation of online textual information, the role of qualitative data, especially sentiments expressed in texts, has gained prominence in financial analysis [
15]. Our research enriches this perspective by introducing advanced methodologies, like wavelet coherence, in sentiment analysis to understand the temporal dynamics of sentiment’s influence on stock prices.
The emergence of social media as an important sentiment source has opened new avenues for real-time market sentiment analysis [
16,
17]. Yet, the literature, including studies like Refs. [
18,
19], often does not provide a comparative analysis of the effectiveness of various media sources. Ref. [
20] revealed that the mass-media effect leads to fluctuations in investor sentiment and significantly affects investors’ trading decisions. This suggests that the source or publisher of information can potentially influence investor sentiment. Platforms like Bloomberg, Reuters, and CNBC are not just news outlets but important sources of real-time insights, detailed market trends analysis, and evaluations of companies’ performance. These platforms, along with financial blogs, offer a nuanced blend of factual reporting and expert analysis, making them integral in the sentiment analysis landscape [
21]. Our study seeks to bridge this gap by analyzing and comparing the impact of different media platforms on stock prices.
Additionally, the attributes of financial news, such as title length and clarity, have been shown to significantly impact investor sentiment [
21,
22]. Our study extends this line of inquiry by examining how these specific news attributes correlate with stock-market movements, thus contributing to a more comprehensive understanding of the role of media in finance. Ref. [
23] suggests that the type of news (uninformative versus informative) plays a significant role in influencing investor sentiment, particularly during initial trading periods, while simultaneously impacting the asymmetry of information between issuing firms and external investors. In a complementary manner, the findings from Ref. [
24] underscore the significance of media attention, alongside investor sentiment and targeted corporate discourse, in shaping the perception and valuation of publicly listed companies. This indicates a strategic imperative for nuanced media engagement within corporate frameworks. Furthermore, Ref. [
25] presents empirical evidence of a direct, positive correlation between the frequency of a company’s coverage in prominent financial news outlets, such as the Financial Times, and the transaction volume of its stocks, both preceding and following news releases.
There have been advancements in quantitative models for sentiment analysis. Ref. [
26] presents models which can be used to value cryptocurrencies like Ether, taking into account investor sentiment and price jumps, thereby highlighting the importance of sentiment in the valuation of digital assets. This development emphasizes the growing relevance of sentiment analysis in diverse financial contexts, including the burgeoning field of cryptocurrency. In terms of sentiment analysis models, a trade-off between accuracy and complexity is evident in Refs. [
27,
28,
29]. Our research enhances this discussion by implementing and evaluating the effectiveness of various models, providing valuable insights into the most suitable methodologies for sentiment analysis in finance.
Despite advancements in sentiment analysis, challenges like data quality and the complexity of financial jargon remain [
30]. Our study acknowledges these challenges and proposes innovative solutions, advancing the field of sentiment analysis in finance.
Despite its potential, sentiment analysis in finance faces several challenges, including data quality, the complexity of financial jargon, and the rapid evolution of online languages. Ref. [
30] suggested that the role of predictions in financial news is not so much that of giving straightforward advice to investors, but rather providing sound argumentative reasoning that the investor-reader might apply in the uncertain context of financial markets. However, advancements in AI and machine learning offer opportunities to overcome these challenges, enhancing the accuracy and reliability of sentiment analysis in finance. Thus, sentiment analysis models are instrumental in extracting and interpreting sentiments from textual data in the financial sector. The choice of model depends on various factors, including the complexity of the task, the volume of data, and the required accuracy. As advancements in AI and machine learning continue, we anticipate the emergence of more sophisticated models offering enhanced accuracy, speed, and contextual understanding.
Our study’s methodology stands out from previous research by taking a comprehensive approach to sentiment analysis within the framework of stock-market dynamics. Unlike prior studies, we employ the TextBlob library for sentiment analysis, which, despite its simplicity compared to models like BERT, allows for efficient and rapid analysis of large datasets. This is particularly advantageous in processing and comparing the sentiments of news titles and descriptions, a distinction rarely made in previous research. Our novel use of wavelet coherence analysis further sets our study apart. This advanced technique enables us to delve into the temporal dynamics between sentiment and stock prices, a perspective not thoroughly explored in existing literature. This approach is particularly significant in understanding the time-sensitive nature of stock-market reactions to media sentiment. Additionally, our inclusion of linear and nonlinear regression models, as well as autoregressions with exogenous factors, provides a robust statistical framework to accurately capture and analyze the intricate relationship between media sentiment and stock prices. By integrating these advanced methodologies, our study not only fills identified gaps in the literature but also offers a unique and comprehensive understanding of how different aspects of media sentiment, over time, influence stock prices of significant market players like Microsoft, Tesla, and Apple.
3. Materials and Methods
The data was generated using the Polygon.io platform, which provides various news articles related to active stocks. To conduct sentiment analysis on the titles and descriptions of these news articles, we employed the TextBlob library, a straightforward yet effective lexically based sentiment analysis tool.
TextBlob is a Python library designed to process textual data, offering a simple API for common natural language processing (NLP) tasks such as tokenization, part-of-speech tagging, and sentiment analysis. For sentiment analysis, TextBlob classifies text into positive, neutral, or negative categories based on the polarity of the words used. The tool uses a lexical approach, in which it evaluates the sentiment of a text by examining individual words and phrases against predefined lists or lexicons containing sentiment scores. This method, while less sophisticated than context-aware models like BERT, offers rapid analysis and is suitable for a broad range of applications, especially when processing large datasets or when a quicker sentiment assessment is desired [
29].
In our methodology, for each news article obtained from the Polygon.io platform, we subjected both its title and its description to sentiment analysis using TextBlob. We extracted the sentiment polarity—a continuous value ranging from −1 (most negative) to 1 (most positive)—and classified the sentiment into one of three categories: positive, neutral, or negative. This approach allowed us to capture the general sentiment trend present in the financial news related to specific stocks.
After obtaining the sentiment scores, we utilized the Pandas library, a robust Python data analysis tool, to structure and store the results. We then visualized the sentiment polarity of both titles and descriptions over time to discern any patterns or trends that might be present in the data.
The use of TextBlob in this context provides a preliminary insight into the prevailing sentiment in financial news articles. While more intricate models like BERT can capture nuanced relationships in phrases due to their context-aware capabilities, TextBlob’s lexical approach offers a swift and effective way to gauge sentiment, especially when analyzing large volumes of text.
In order to forecast the stock prices, we obtained the daily closing and opening prices using finance.yahoo.com, which operates as a historical data repository.
Data was obtained for a period of 1 year, from 30 September 2022 to 30 September 2023.
We focused on Microsoft, Tesla, and Apple due to their significant market presence and sensitivity to public sentiment, which make them prime subjects for analyzing media sentiment’s impact on stock prices. We utilized Polygon.io for data collection; it was chosen for its extensive, real-time coverage of stock-related news. The TextBlob library was selected for its efficiency in large-scale text processing and rapid sentiment analysis. This methodology, combined with the use of finance.yahoo.com for stock-price data, forms a comprehensive framework for exploring the relationship between news sentiment and stock-market dynamics. The choice of these variables, including title and description sentiment, alongside stock opening and closing prices, aims to intricately capture the media’s influence on stock behavior.
The results obtained using Textblob and the stock prices are explained in
Table 1.
After the sentiment scores and stock prices were obtained, the descriptive statistics were analyzed; the determinations are listed in the results section, along with the graphs for each result obtained. The descriptive statistics include the mean, median, maximum value, minimum value, std. dev., skewness, Jarque–Bera value, probability, and sum sq. dev.
After the descriptive statistical interpretation, Dickey–Fuller unit root tests were performed in order to test the stationarity of each series [
31].
Next, Pearson correlation was performed among the results variables in order to identify the causal relationships among different variables and to prepare the data for the modeling phase and wavelet coherence analysis. Next, heteroskedasticity tests of the residuals were performed in order to identify which type of regression models could be applied to the data. The heteroskedasticity test applied was the Glejser test, and all of the analyzed variables were homoscedastic.
Next, the wavelet coherence was computed, plotted, and interpreted, and linear and nonlinear regressions were applied, along with multiple nonlinear and linear autoregressions with exogenous factors, among which the most significant ones are presented in this paper.
Wavelet coherence measures the degree of association between two time series in both the time and the frequency domains. The wavelet coherence involves the computation of the cross-wavelet spectrum and the individual wavelet power spectra of the two-time series. Let
W1(
f,t) and
W2(
f,t) be the wavelet transforms of two time series
x(
t) and
y(
t), respectively. The wavelet coherence
C(
f,t) is calculated as follows in Equation (1):
where
f is the frequency,
t is time,
denotes the complex conjugate of
W, and |⋅|denotes the absolute value. The numerator expression
represents the cross-wavelet power, and the denominator represents the normalization factor. The normalization ensures that the coherence values are between 0 and 1, where 0 indicates no coherence, and 1 indicates perfect coherence. Afterwords, the wavelet coherence was plotted. The coherence patterns may indicate high or low coherence regions. Regions with high coherence indicate that the two time series are strongly correlated at specific time–frequency points. This suggests that the two signals have similar patterns or periodicities at those scales. Regions with low coherence indicate a lack of consistent correlation between the two signals at specific time–frequency points. It is essential to assess the statistical significance of coherence values. Many wavelet coherence implementations provide significance levels, usually through a significance test or confidence intervals. High coherence values that exceed the significance level are more likely to represent meaningful associations.
Linear, quadratic, and cubic regressions were used in order to analyze the relation between the sentiment score and the stock’s opening-price change. The relations for the linear, quadratic, and cubic autoregressions are presented in Equation (2), Equation (3), and Equation (4), respectively:
where
y is the stock price;
,
,
, and
are the unknown parameters;
x is the sentiment score variable; and
is the error term.
Y is the stock price at time
t.
After running the linear, quadratic, and cubic regressions, we ran two linear autoregressions with an exogenous factor (ARX), as can be seen in Equations (5) and (6):
where
y is the opening price at time
t,
x is the sentiment score, and
yt−1/2/3/4 are the prices at times
t − 1,
t − 2,
t – 3, and
t − 4.
In order to perform our regression, we used ordinary least squares.
4. Results
The results section is structured in six subsections. The first subsection, the descriptive statics, covers the main descriptive indicators for all of the data analyzed and the line charts for the data. The second subsection covers the unit root test results and the interpretation. The third section covers the Spearman correlation matrix, while the fourth section covers the heteroskedasticity tests. The fifth subsection covers the wavelet coherence estimation and interpretation, while the sixth section covers the linear and nonlinear regressions and the autoregressive regressions with exogenous factors.
4.1. Descriptive Statistics
In
Table 2, the descriptive statistics are presented for the Apple, Microsoft, and Tesla stocks. It can be observed that mean of the closing prices for Apple is USD 160.79 for the analyzed period of September 2020 to September 2023. The mean for title polarity is 0.07, a positive score. The maximum closing price in the analyzed period was USD 196.45, while the minimum was USD 125.02.
In the case of Microsoft, the mean for the opening prices is USD 282.28. The mean sentiment score for the description is 0.11, a positive mean score. The minimum opening price was USD 219.85, while the maximum was USD 361.75.
In the case of Tesla, the mean of the opening prices for the analyzed period is USD 194.25 and the minimum opening price is USD 103, while the maximum is USD 296.04, with a standard deviation of 47.28. The mean for the title sentiment polarity is 0.064.
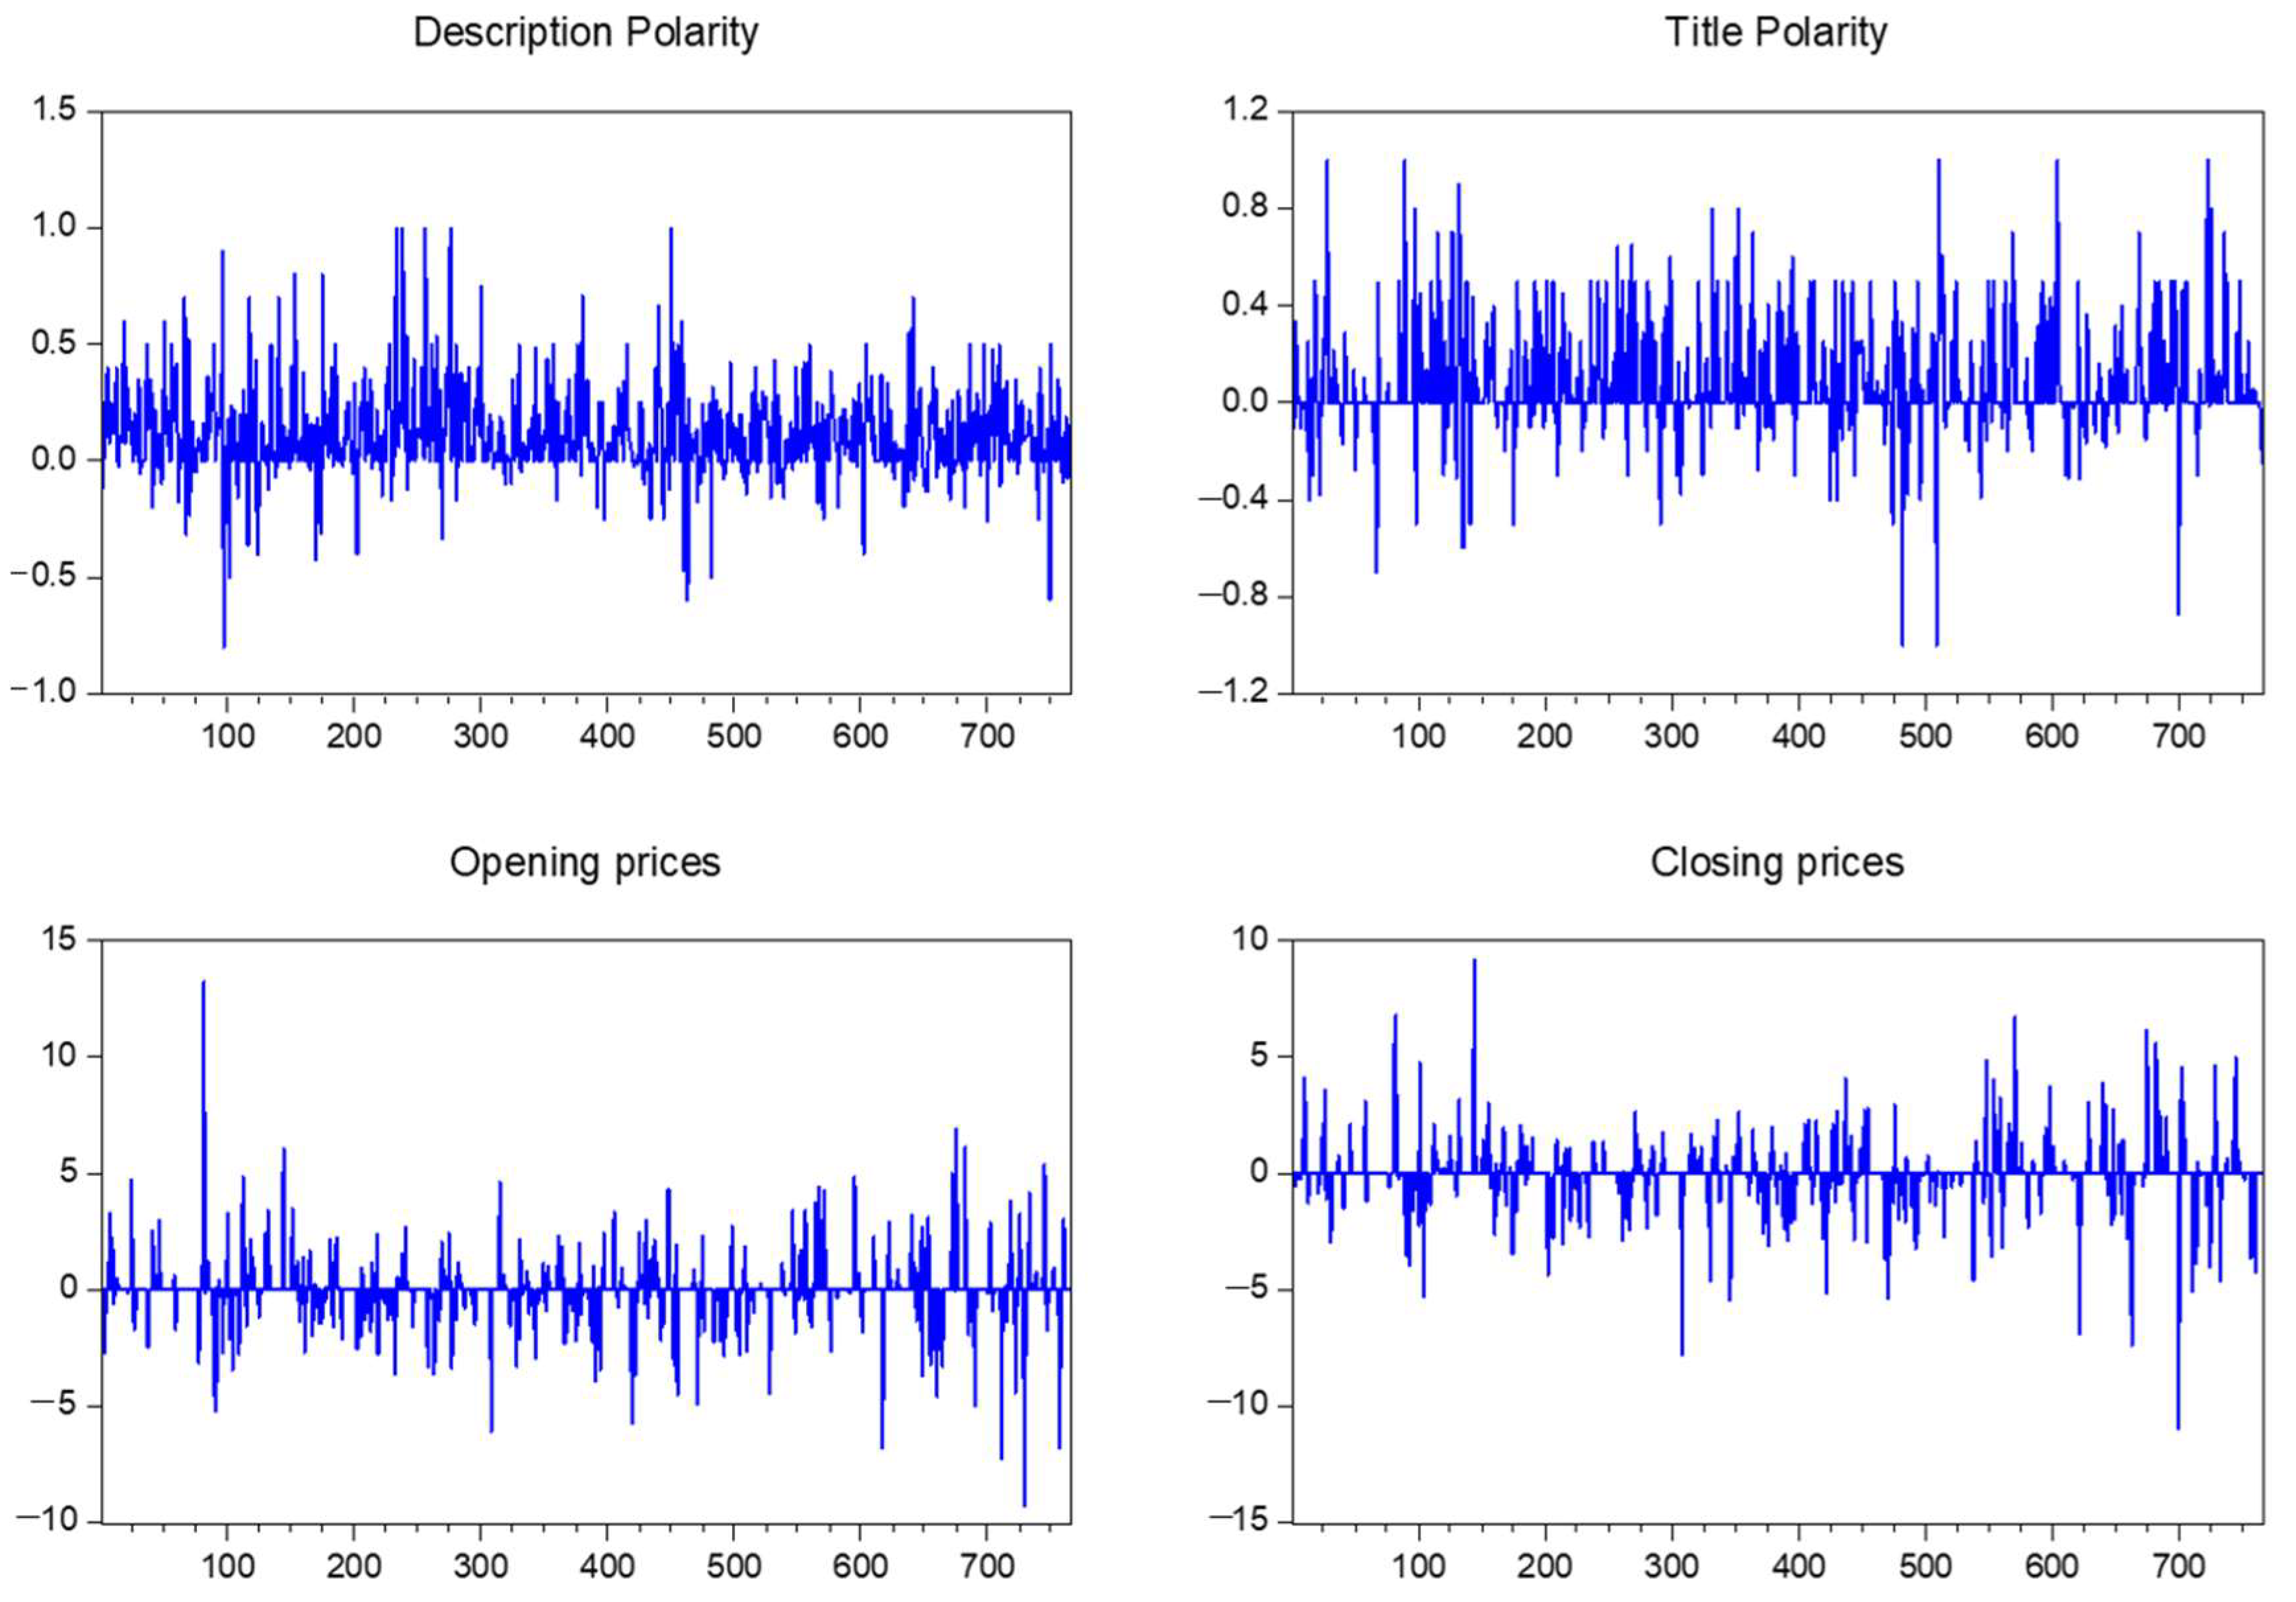
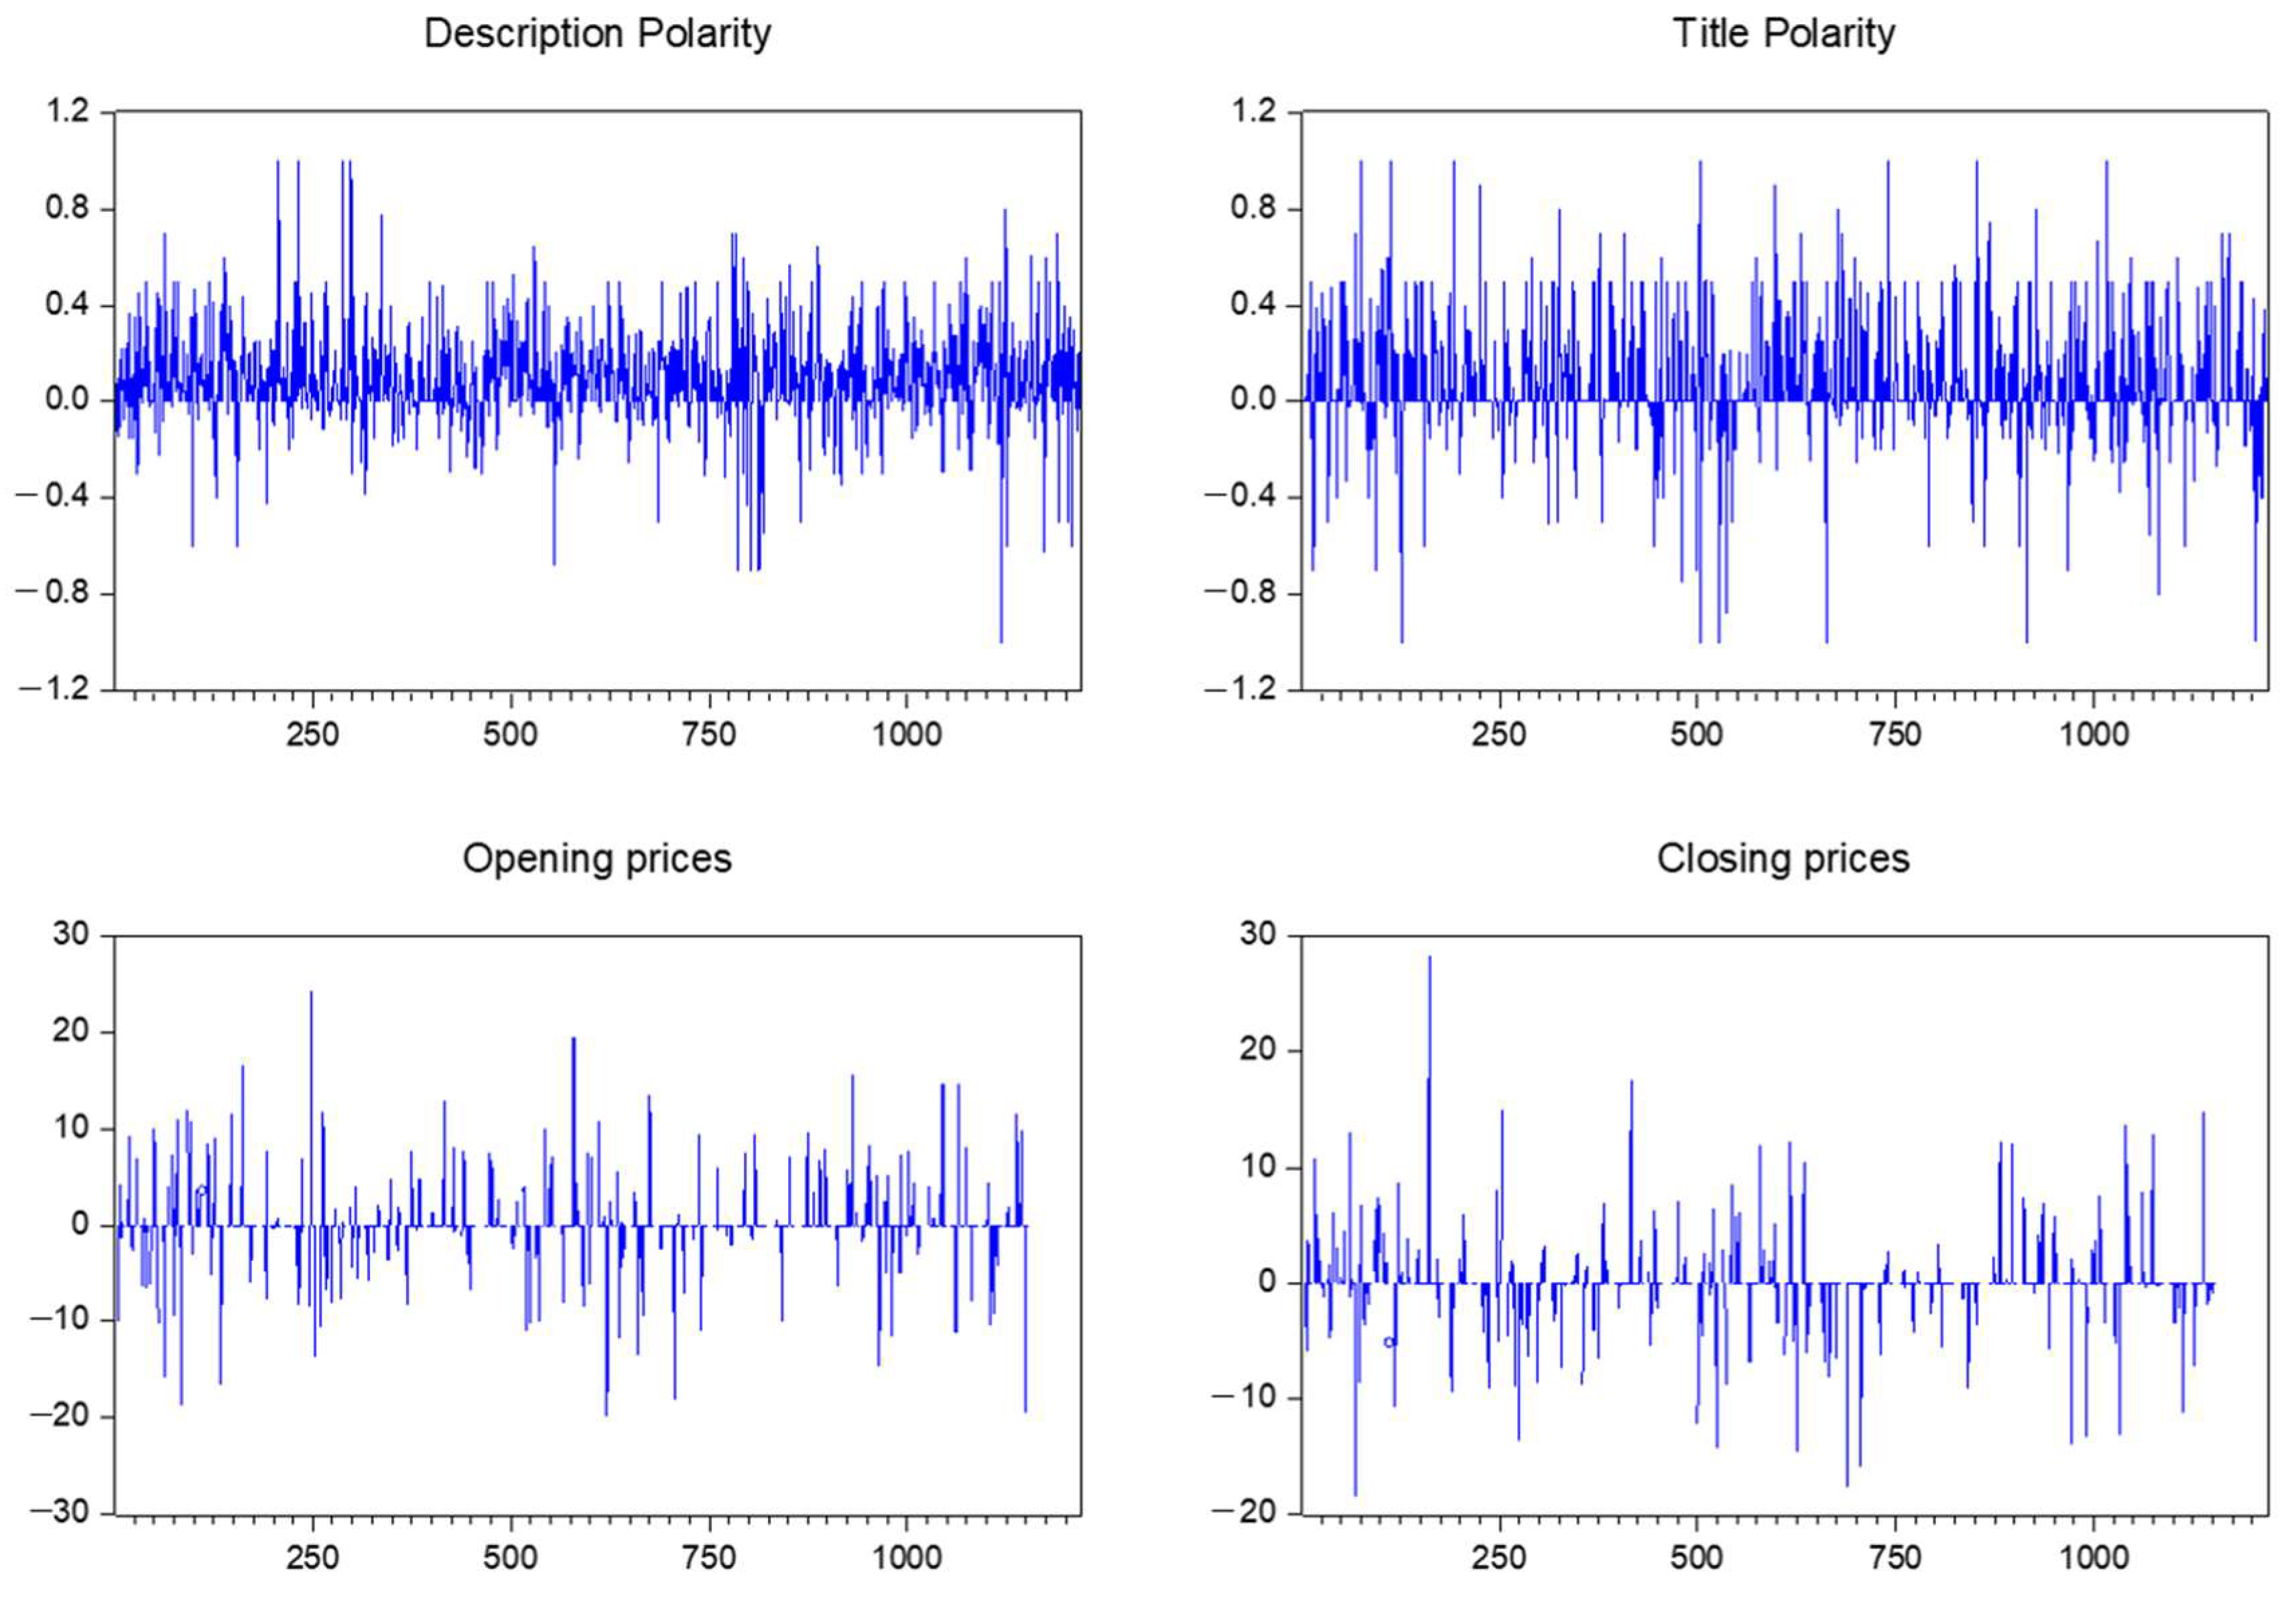
In
Figure 1, line graphs for all of the analyzed variables for the Apple stocks are presented as follows: description polarity, title polarity, opening prices (first differenced), and closing prices (first differenced). There is a noticeable difference in the variance of the title’s sentiment score versus the descriptions’ sentiment scores, as the title polarity presents higher variance.
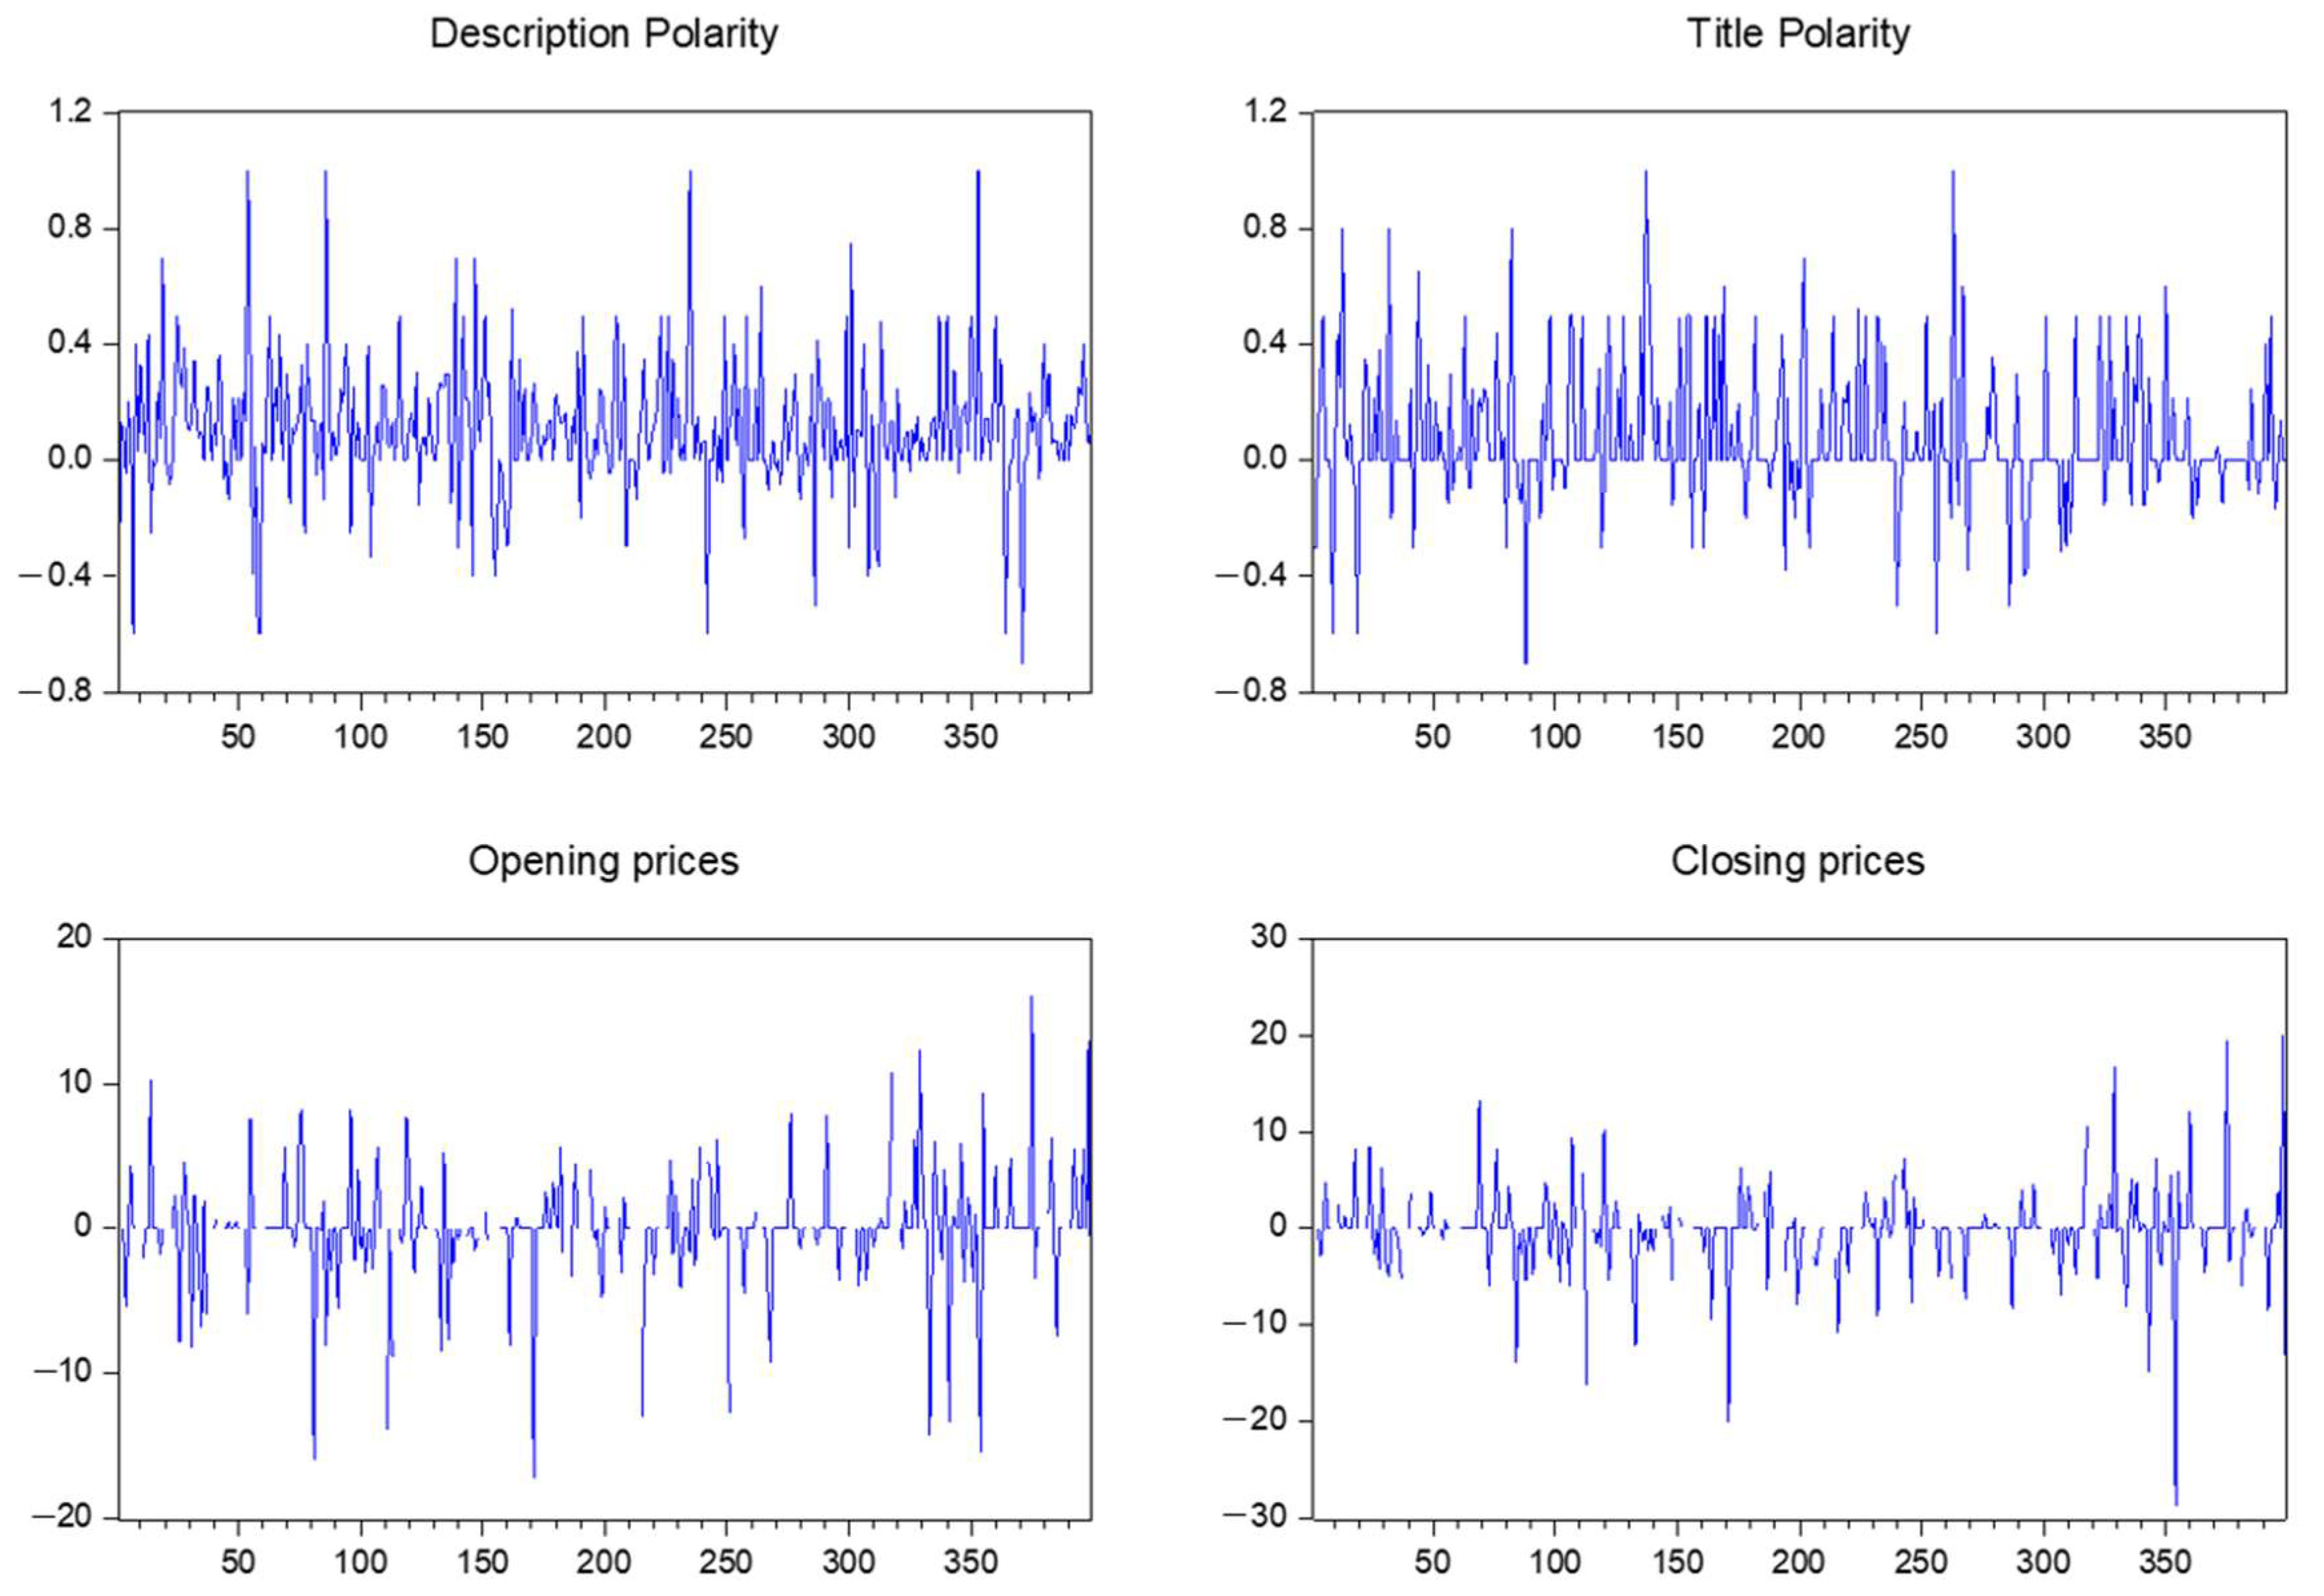
In
Figure 2, graphics for all of the analyzed variables for the Microsoft stocks are presented as follows: description polarity, title polarity, opening prices (first differenced), and closing prices (fist differenced). It can be observed that the description polarity is larger, and has a higher variance, than the title polarity, while the stock prices register visible signals in the last part of the first quarter and the middle part of the last quarter.
In
Figure 3, the line graphs for all of the analyzed variables for the Tesla stocks are presented as follows: description polarity, title polarity, opening prices (first differenced), and closing prices (first differenced). It can be observed that the title polarity scores present a higher variance compared to the description polarity scores.
4.2. Unit Root Test—Test for the Absence of Non-stationarity
In
Table 3, the results computed under the Dickey–Fuller test (ADF) procedure are presented. The tested hypotheses are as follows:
H0: A unit root is present in a time-series sample.
H1: The time-series sample has no unit root; thus, it is stationary.
From
Table 3, we can observe that the
p-values for the description polarity, description length, title polarity, and title-length series for the Apple stocks are less than the significance level of 0.5, with no difference; thus, we can reject the null hypothesis and conclude that the time series are stationary. In the cases of the closing and opening prices, the
p-values were significant after the first differentiation. For the Microsoft data, the
p-values for the description polarity, description length, title polarity, and title length series are less than the significance level of 0.5, with no difference; thus, we can reject the null hypothesis and conclude that the time series are stationary. In the cases of the closing and opening prices, the
p-values were non-significant; thus, we have once-differentiated all the opening and closing prices series.
Also, in the case of the Tesla data, the p-values for the description polarity, description length, title polarity, and title length series are less than the significance level of 0.5, with no difference; thus, we can reject the null hypothesis and conclude that the time series are stationary. In the cases of the closing and opening prices, the p-values were non-significant; thus, we have once-differentiated all the opening and closing price series.
Table 3.
Dickey–Fuller test results.
Table 3.
Dickey–Fuller test results.
| | Apple | Microsoft | Tesla |
|---|
| Variable Tested | ADF | p-Value | Level | ADF | p-Value | Level | ADF | p-Value | Level |
|---|
| Closing prices | −27.22 | 0.000 | 1′st diff | −16.50 | 0.000 | No diff | −35.16 | 0.000 | No diff |
| Description length | −26.23 | 0.000 | No diff | −17.70 | 0.000 | 1′st diff | −28.99 | 0.000 | 1′st diff |
| Description polarity | −29.45 | 0.000 | No diff | −20.74 | 0.000 | No diff | −34.20 | 0.000 | No diff |
| Opening prices | −28.14 | 0.000 | 1′st diff | −17.37 | 0.000 | 1′st diff | −29.56 | 0.000 | 1′st diff |
| Title length | −26.10 | 0.000 | No diff | −18.71 | 0.000 | No diff | −35.75 | 0.000 | No diff |
| Title polarity | −26.84 | 0.000 | No diff | −18.42 | 0.000 | No diff | −35.05 | 0.000 | No diff |
4.3. Correlation Matrix
From
Table 4, it can be observed that there is a significant correlation among the description lengths and closing prices, in the case of Apple, with a significance level under 5%; title polarity and closing prices, in the case of Microsoft (with a significance level under 10%); and title length and closing prices, in the case of Tesla (with a significance level under 10%).
We decided to further test for heteroskedasticity, in order to perform a regression model on our data.
4.4. Heteroskedasticity Tests
In
Table 5, the results of the Glejser tests are presented, taking in consideration the hypotheses tested:
H2: The residuals of the linear regression are homoscedastic.
H3: The residuals of the linear regression are heteroscedastic.
Table 5.
Glejser heteroskedasticity test for linear regression residuals.
Table 5.
Glejser heteroskedasticity test for linear regression residuals.
| | Dependent Variable | Independent Variable | F-Statistic | Prob. F(1.763) | R-Squared | Prob. Chi-Square (1) | β | Prob. of β |
|---|
| Apple | Closing prices | Title polarity | 1.813126 | 0.1785 | 1.813569 | 0.1781 | −0.273302 | 0.1785 |
| Microsoft | Opening prices | Description polarity | 0.598667 | 0.4396 | 0.601196 | 0.4381 | 0.627657 | 0.4396 |
| Tesla | Opening prices | Title polarity | 0.0365 | 0.8485 | 0.036578 | 0.8483 | 0.087392 | 0.8485 |
Because the significance value for the title polarity’s variable effect on the residuals of the equation is higher than 0.05, we conclude that there is no evidence for the presence of heteroskedasticity.
4.5. Wavelet Coherence
Because our closing and opening prices were not stationary, we have estimated and plotted the wavelet coherence for each of the analyzed stocks. As stated in [
32], “continuous wavelet cross-correlation provides a time–scale distribution of the correlation between two signals, whereas continuous wavelet coherence provides a qualitative estimator of the temporal evolution of the degree of linearity of the relationship between two signals on a given scale”.
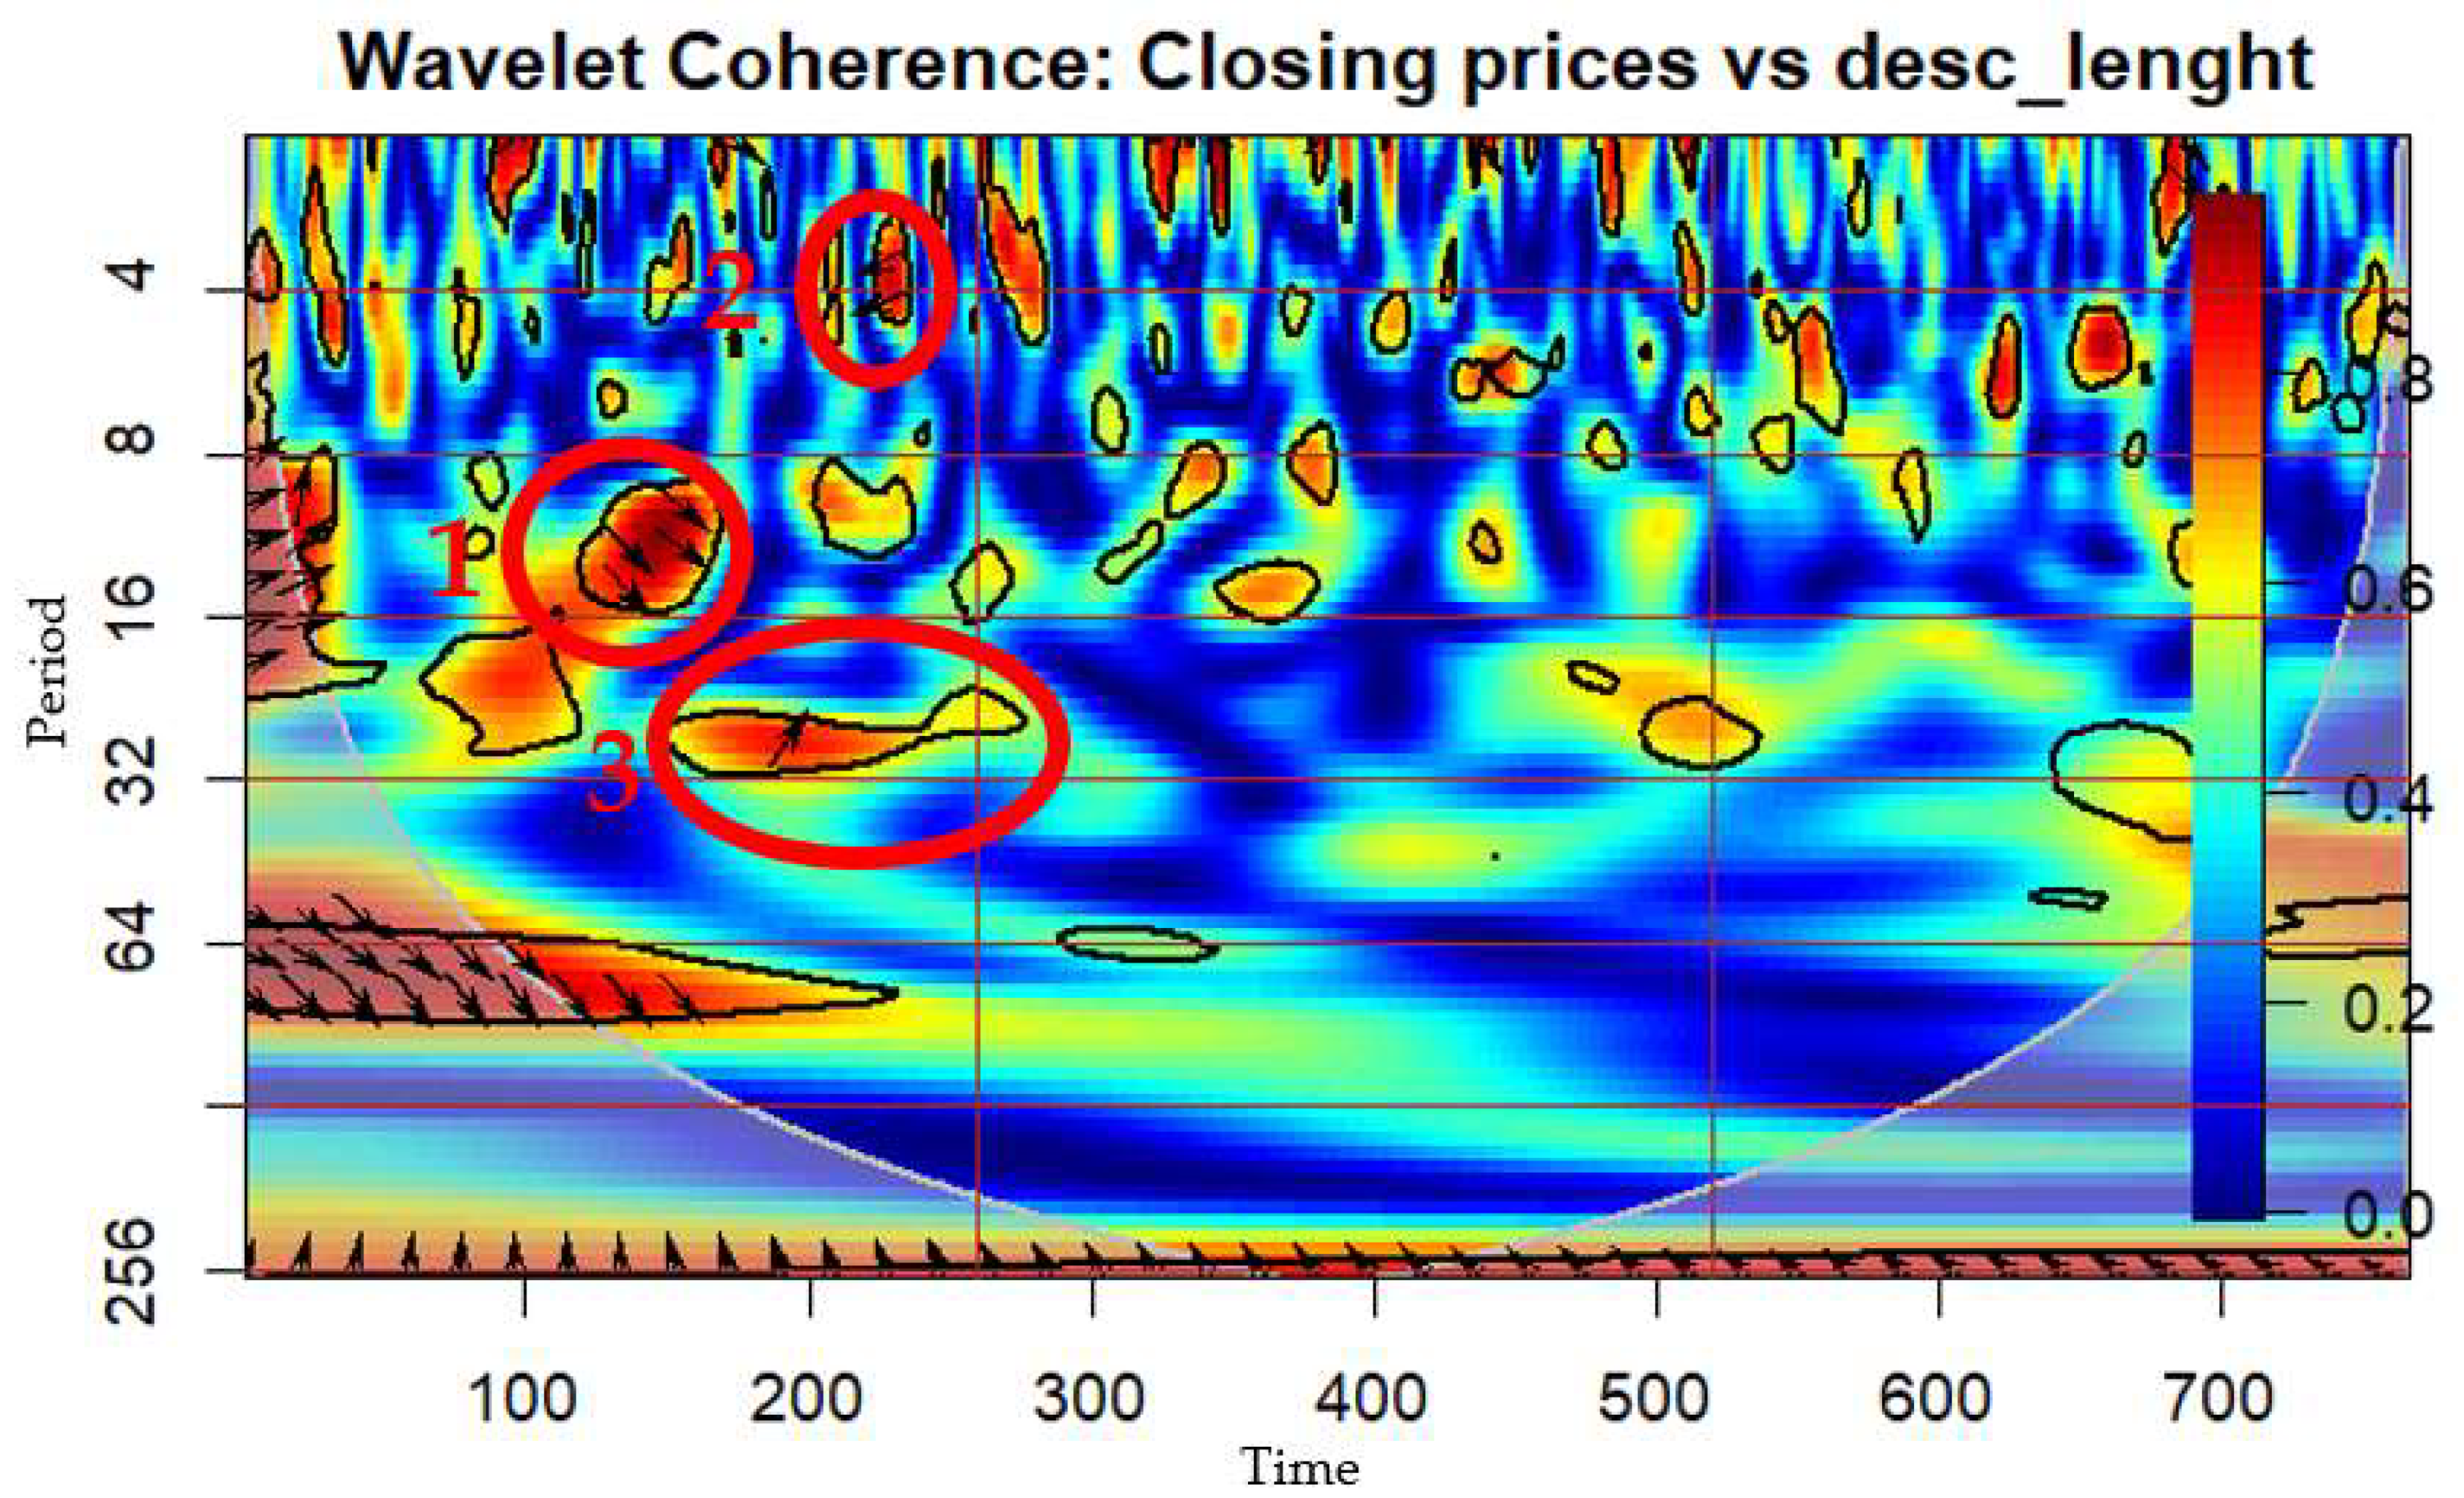
In
Figure 4, the wavelet coherence for the closing prices and description lengths is plotted. It can be observed, in the cone of influence, that there that there are three regions of coherent oscillation behavior, firstly between 8 and 16 period coherence lags, in the first time period between the 100 to 300 news titles. In the first significant coherence lag, as mentioned before, the arrows’ direction points to a lagging A index, which means that in the first 100 to 300 news titles, the closing prices determined the general opinion in the media that was presented through the description length, with a lag of 8 to 16 periods, where periods mean 6 to 8 h. Also, in the second coherence region, the closing prices are leading the media opinion, represented through the description length, with a lag of 4 to 8 periods. In the third significant coherence region, the variables are in phase, and the descriptive length is leading the closing prices’ change for the Apple stocks, with a lag of 16 to 32 periods.
In
Figure 5, the wavelet coherence between the closing prices and title polarity is presented. A single significant coherence region is identified, one where the title polarity score is lagging, meaning that the opening prices influence the stock description score, with a lag of 4 periods (approx. 4 days). The coherence period runs from day 200 to day 220.
In
Figure 6, the wavelet coherence for the closing prices and title lengths is plotted. It can be observed, in the cone of influence, that there are two significant coherent oscillation regions, one that generates from outside of the cone of influence, in the first time-period, where the variables are in phase and the title length is leading the closing prices’ change for the Tesla stocks, with a lag of over 64 periods. In the second one, in the last period of time, news 800 to 1000, one extends with a direction that points out that the closing prices are leading the title lengths, with a lag of 32 to 64 periods (a period = approx. 1 day, in this case).
4.6. Regressions
Because the Glejser test provided evidence that the series residuals are homoscedastic in all of the three stock-index cases’ analyses, different types of regression were computed, among which the most significant were presented and analyzed.
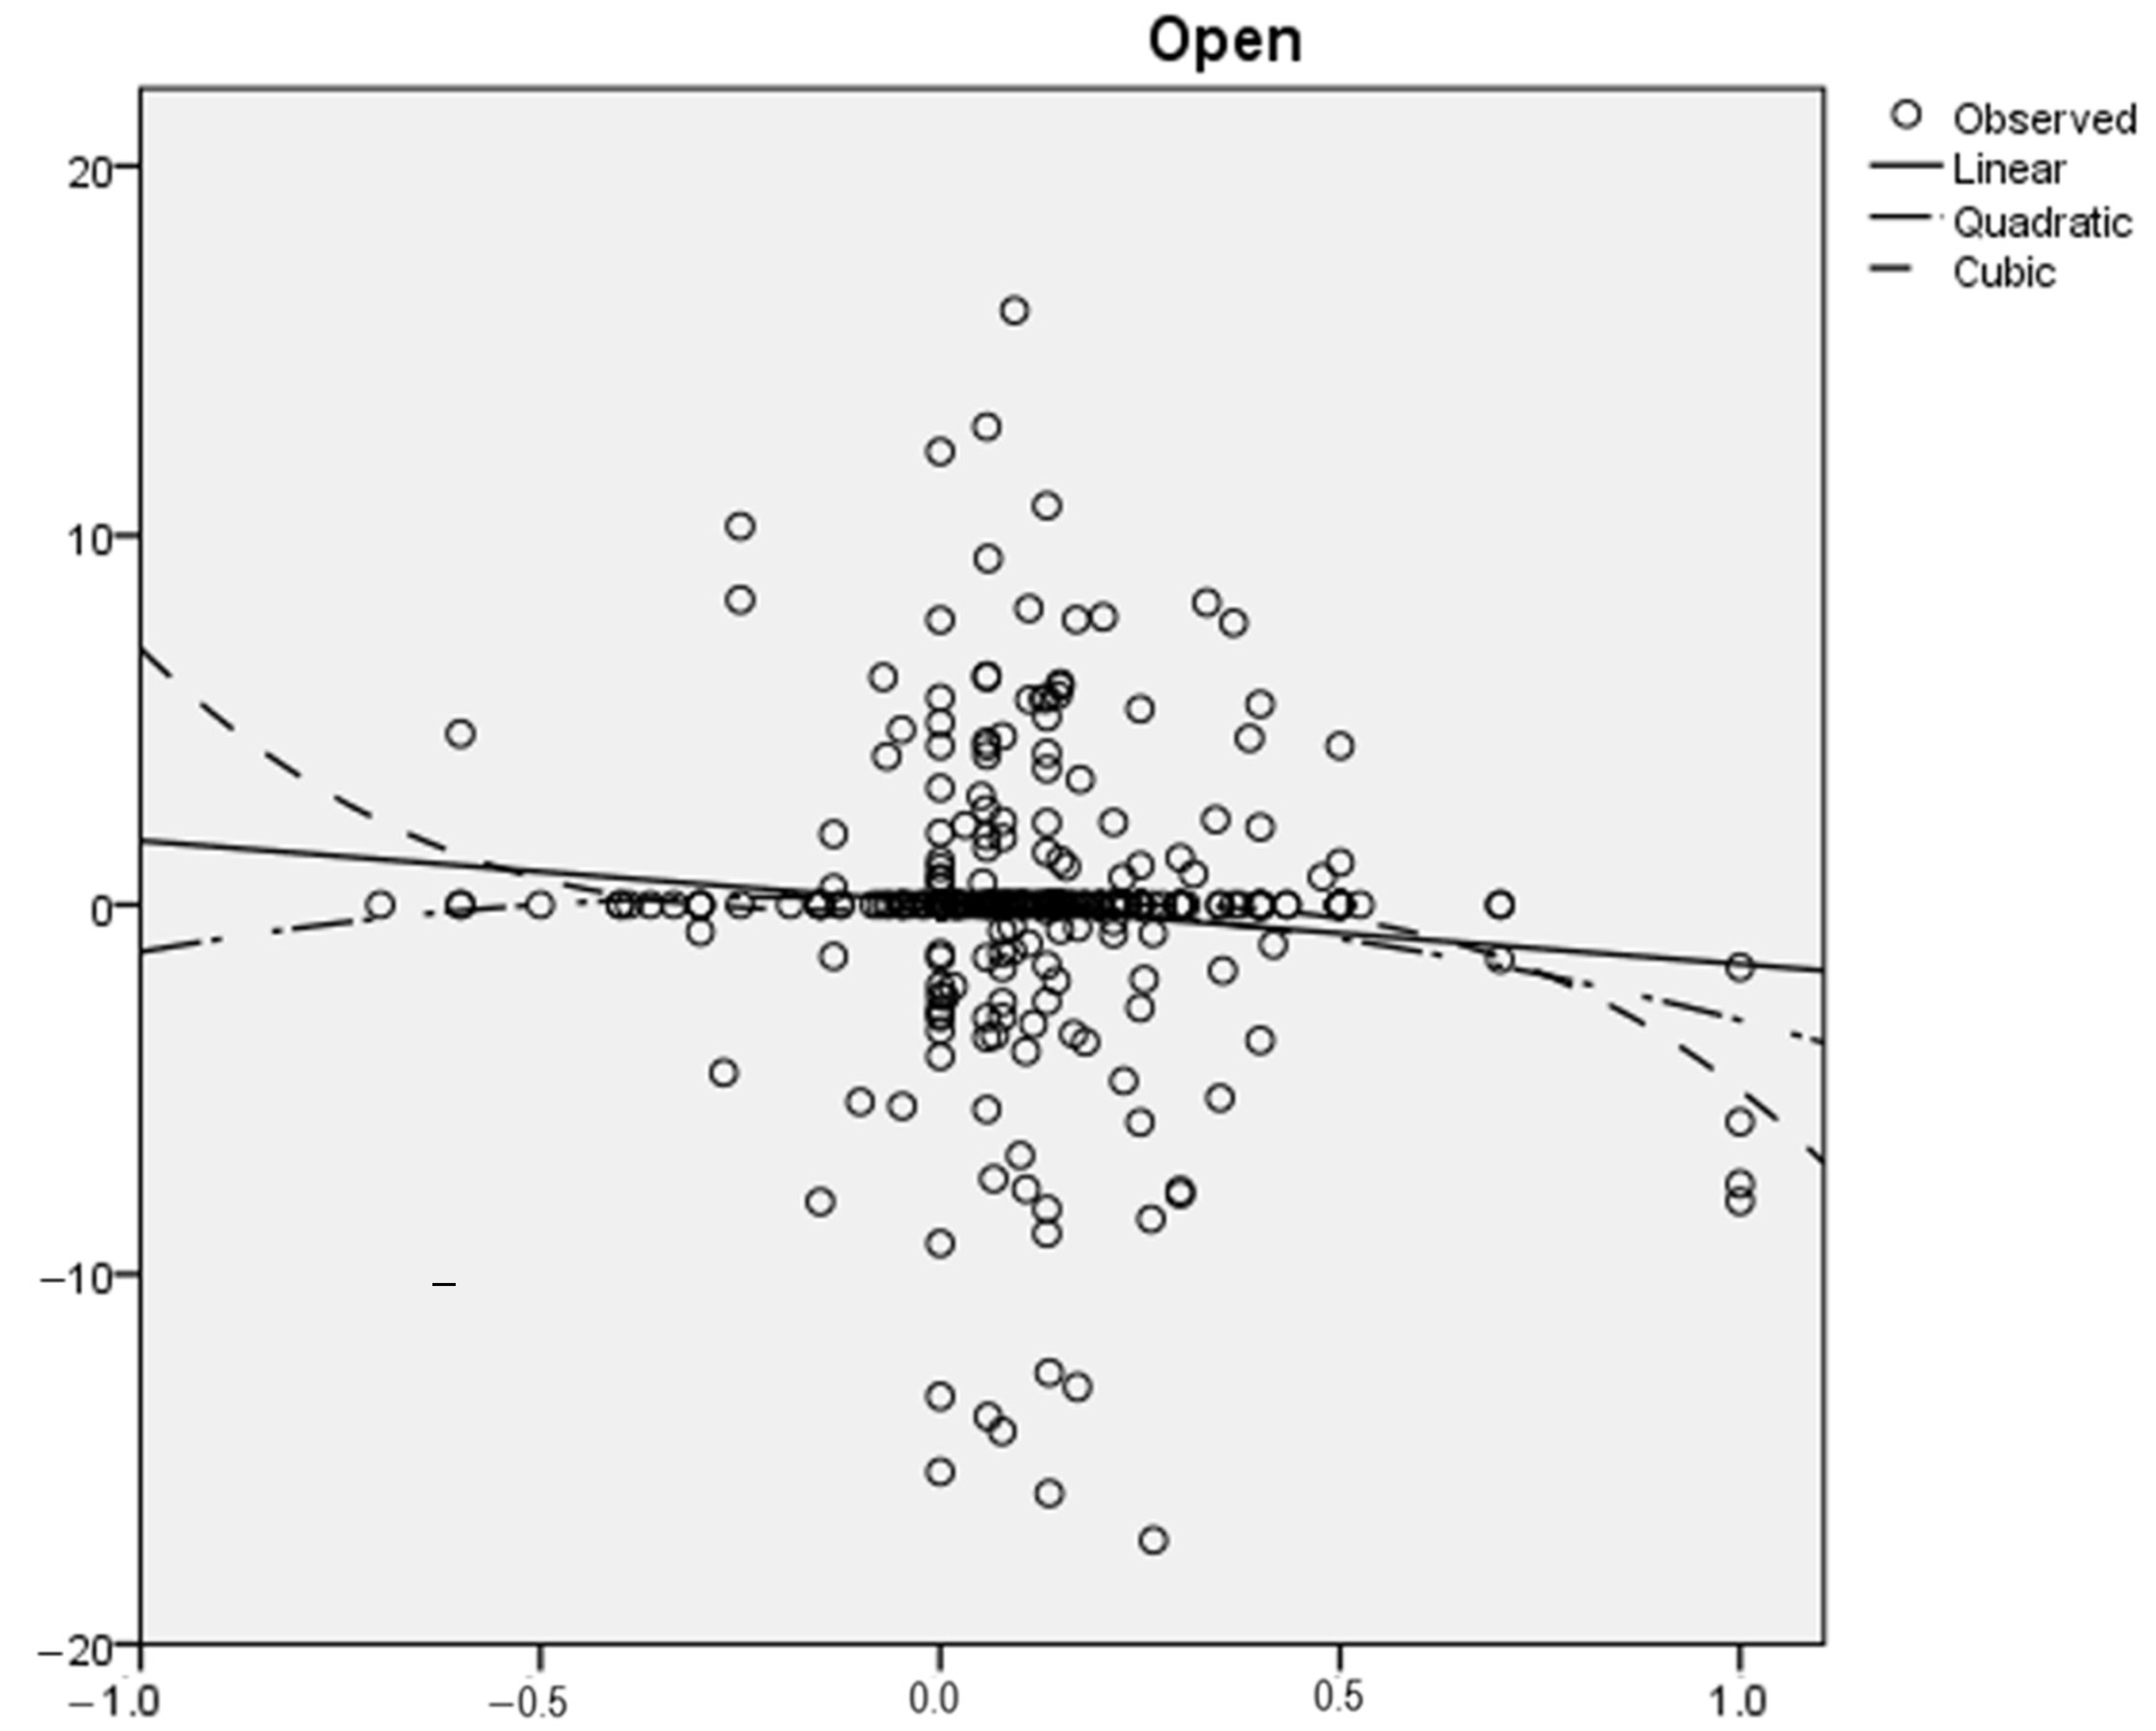
In
Table 6, the results of the linear, quadratic, and cubic regressions were presented, with the closing prices transformed into stationary series by first differentiation. It can be observed that the cubic regression has the highest R-square value, of 0.13. In
Figure 7, the three regressions are presented.
The equation for the cubic regression is presented in Equation (7).
Next, an autoregression with an exogenous factor is estimated, as follows from Equation (4).
In
Table 7, the parameters of the autoregressive model with an exogenous factor are presented. It can be observed that the parameter estimations are both positive, while the title polarity coefficient (0.41) is higher that the lagged closing prices coefficient (0.014). The computed R-squared is 0.004.
In
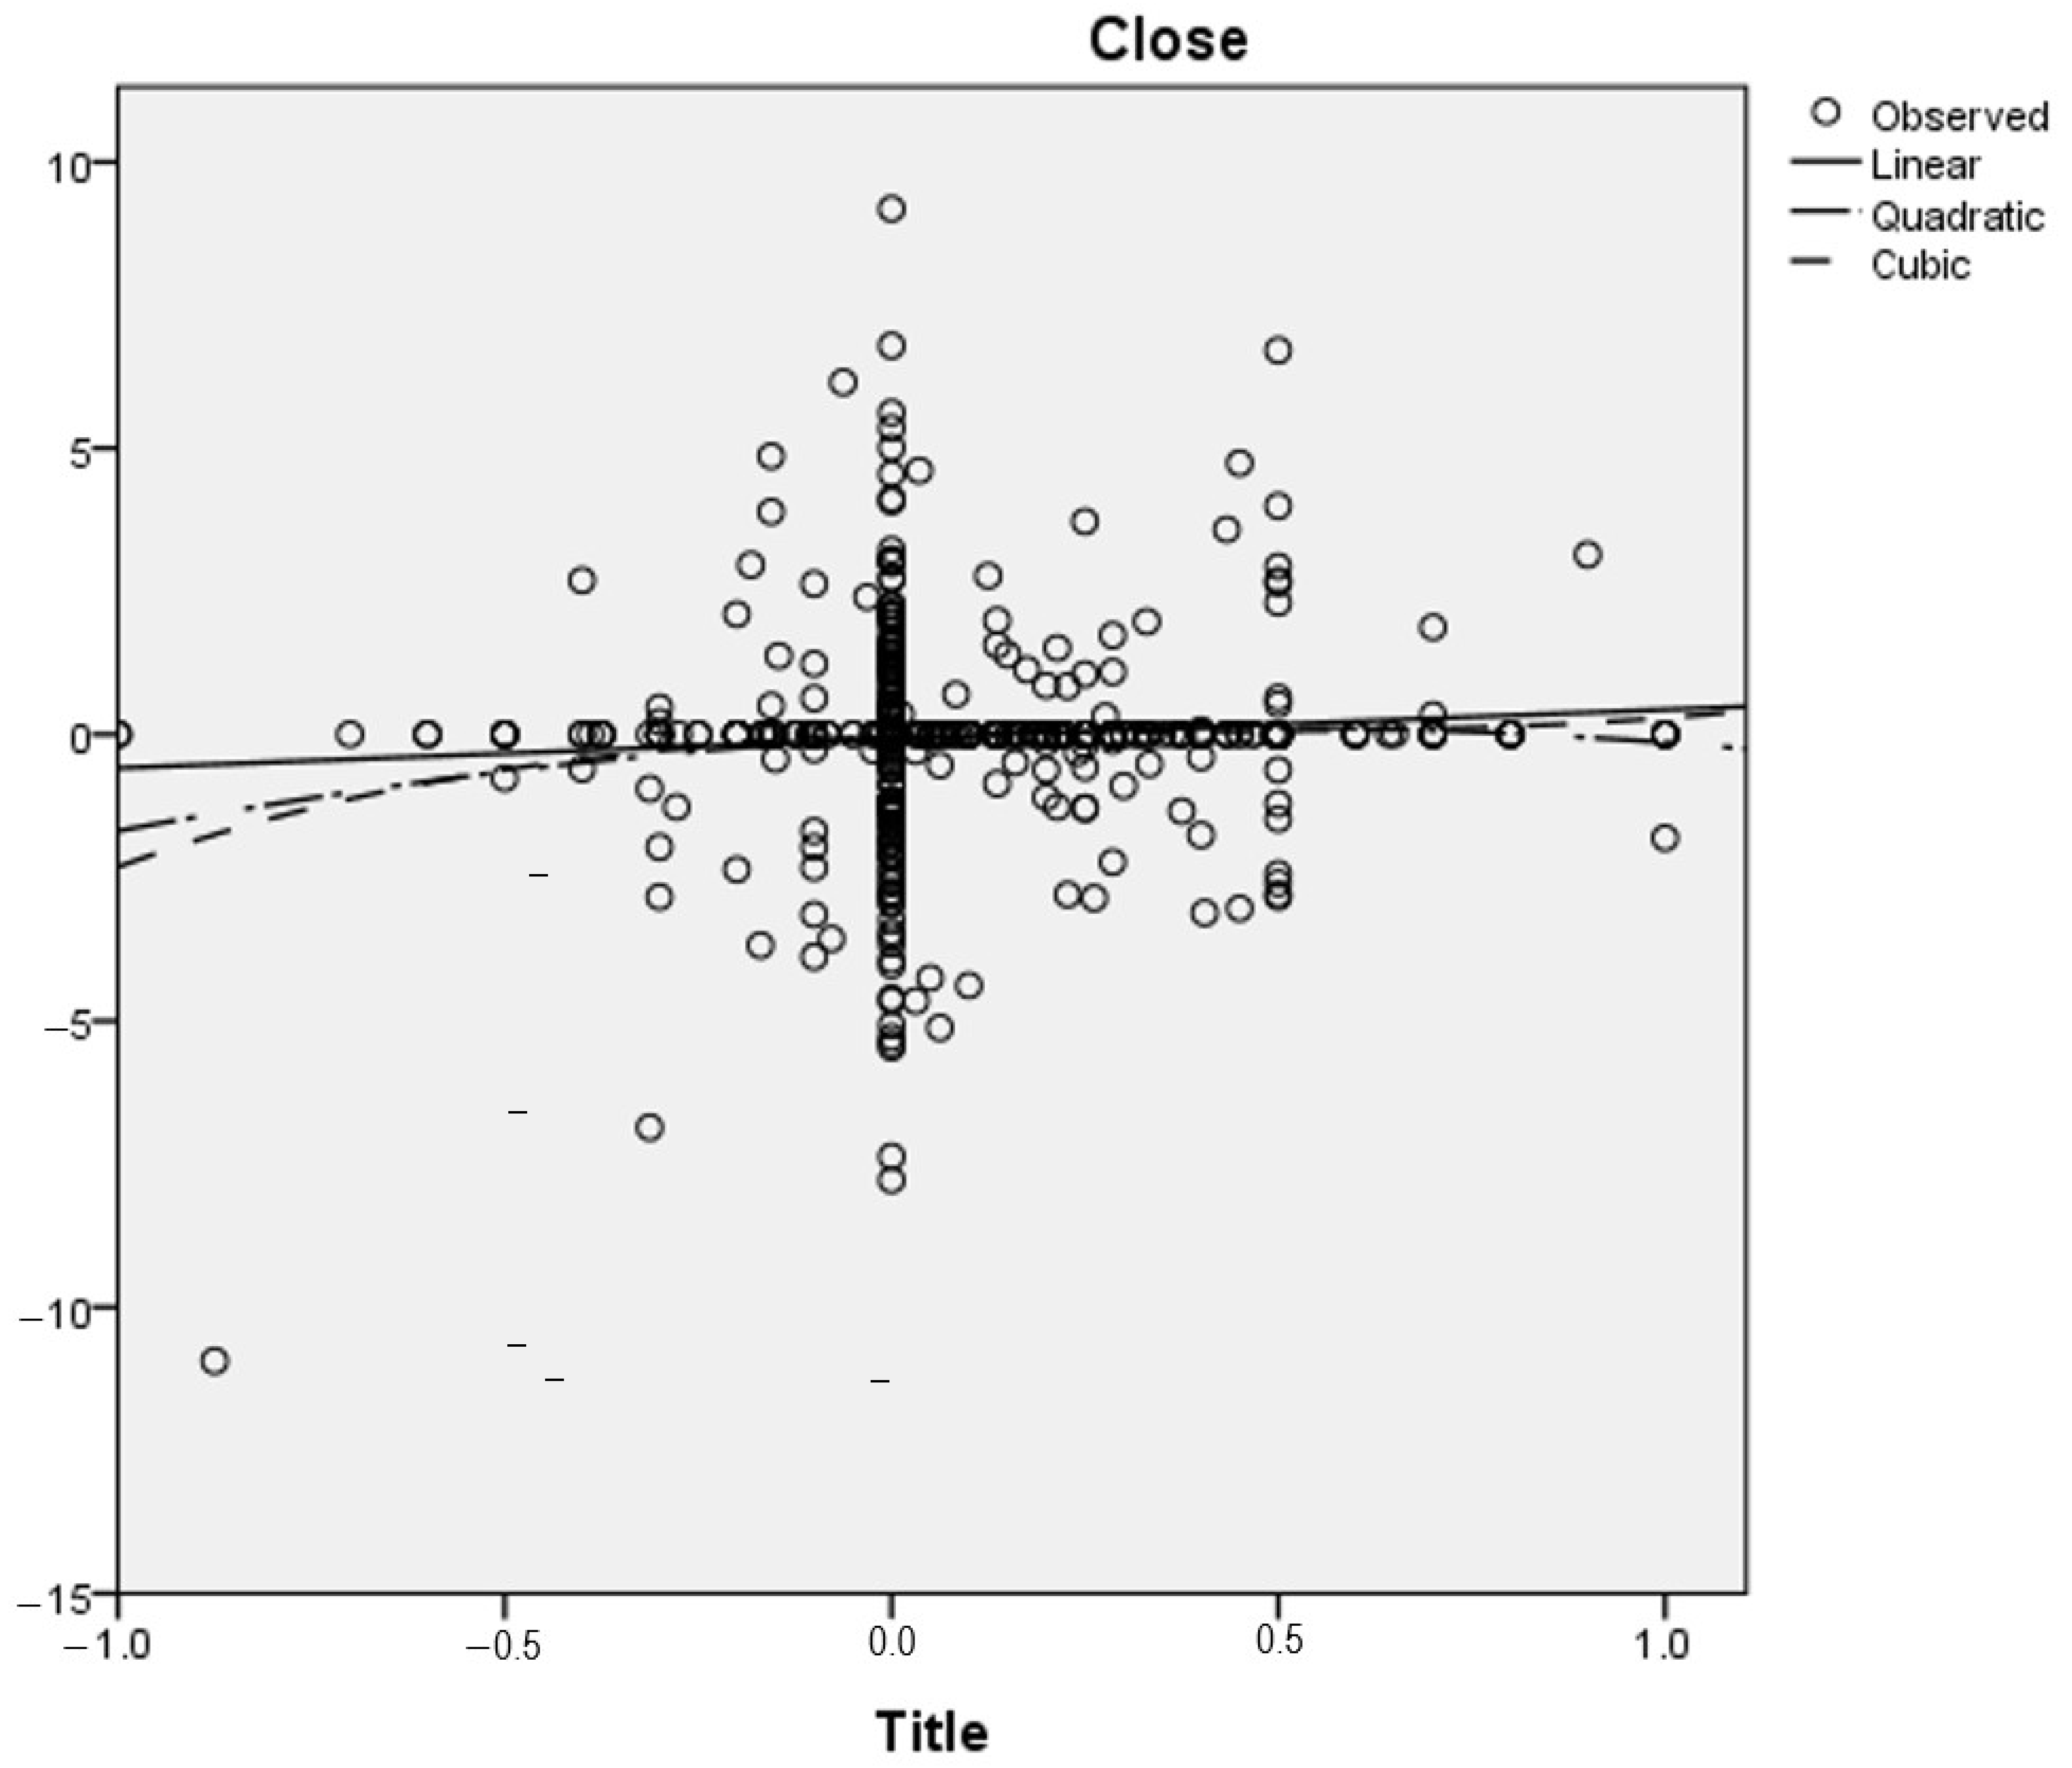
Table 8, the results of the linear, quadratic, and cubic regressions are presented, with the closing prices transformed into stationary series by first differentiation. It can be observed that the cubic regression has the highest R-square value, of 0.23. In
Figure 8, the three regressions are presented.
The equation for the cubic regression is presented in Equation (8).
In
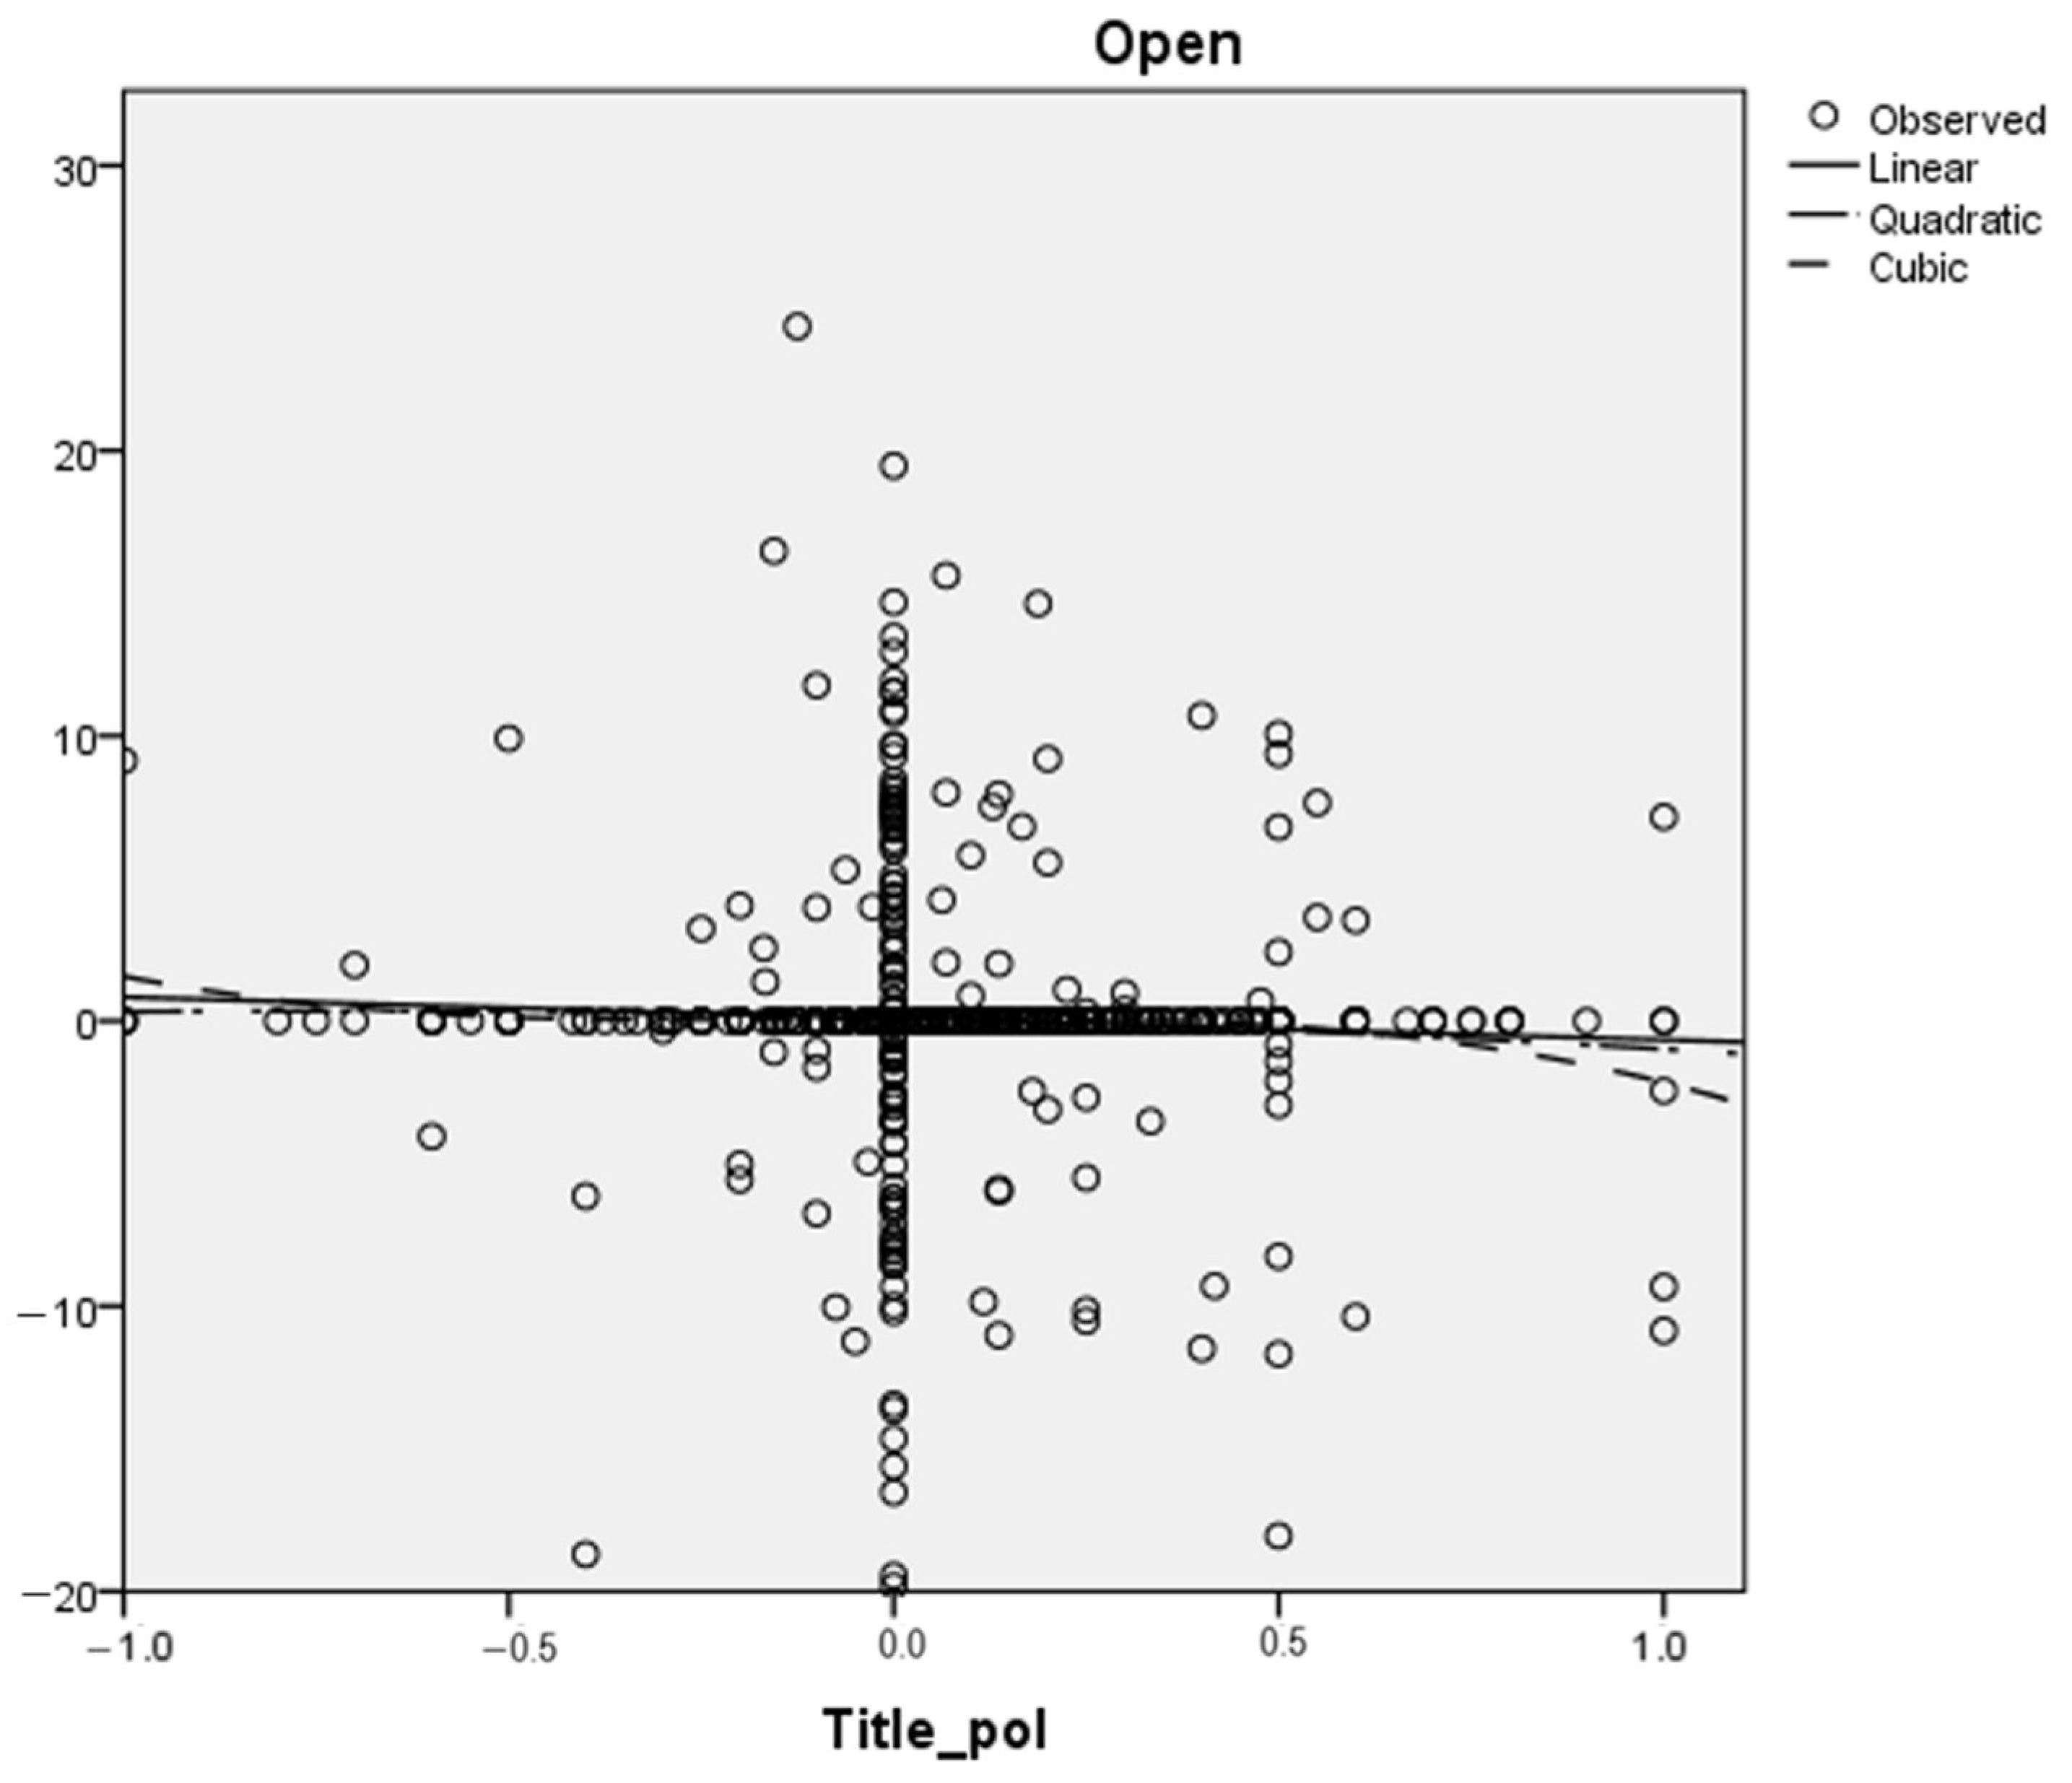
Table 9, the results of the linear, quadratic, and cubic regressions are presented, with the closing prices transformed into stationary series by first differentiation. It can be observed that the cubic regression has the highest R-square value, of 0.05. In
Figure 9, the three regressions are presented.
In
Table 10, the parameters of the autoregressive model with an exogenous factor are presented. It can be observed that the parameter estimations are both positive, while the title polarity coefficient (16.99) is higher that the lagged closing prices coefficient (0.902). The estimated R-squared is 0.555.
The resulting equation for the autoregressive model with an exogenous factor is presented in Equation (9).
5. Discussion
The application of sentiment analysis to major companies like Microsoft (MSFT), Tesla (TSLA), and Apple (AAPL) has become increasingly prevalent due to the significant influence of public sentiment on their stock prices. This chapter explores the specific applications and impacts of sentiment analysis for these tech giants, drawing insights from various studies and real-world scenarios.
A study described in Ref. [
33] highlighted the differential impacts of Twitter sentiment on various companies. For instance, Microsoft showed a strong positive correlation between Twitter sentiment and stock prices. This underscores the importance of social media sentiment in determining the influence on the stock performance of tech companies, including MSFT, TESLA, and AAPL.
Ref. [
34] constructed an individual stock sentiment index, revealing that sentiment has a more pronounced impact on small-firm stock prices. However, given the large market capitalization of MSFT, TESLA, and AAPL, understanding the nuanced effects of sentiment on these giants requires a more tailored approach.
Ref. [
35] integrated sentiment analysis into machine learning to forecast the SSE 50 Index’s movement direction, achieving an accuracy of 89.93%. This highlights the potential of real-time sentiment analysis in predicting the stock movements of major companies like MSFT, TESLA, and AAPL.
Ref. [
36] found a significant positive relationship between firm-specific investor sentiment and stock-price crash risk. This relationship is amplified for firms with worse liquidity, emphasizing the need to consider liquidity factors when analyzing the sentiment impacts on MSFT, TESLA, and AAPL.
Ref. [
37] underscored the importance of considering both investors’ optimism and investors’ pessimism in analyzing individual stocks’ effects. This comprehensive approach can offer nuanced insights into the impacts of sentiment on companies like MSFT, TESLA, and AAPL.
Wavelets are analytical tools effective in examining fluctuations in spatio-temporal behavior, even among identical objects or similar actions [
38].
Similar to Ref. [
39], wavelet analyses “confirm the validity of the proposed WLMC in detecting complex evolving correlation structures, both along time and across different frequencies/timescales, that may be present in the data”.
Future research may focus on analyzing the Hurst parameter, as proposed in Ref. [
40], in which “a method to investigate long range dependence, which is quantified by the Hurst parameter, in high frequency financial time series” was developed.
Limitations of the chosen methodology may occur in the measurement of the coherence between the three sets of variables that were analyzed. In order to address these limitations, future research may also focus on using a BEKK or diagonal BEKK model, in order to calculate the covolatility persistence and asymmetry between the two variables.
6. Conclusions
The primary aim of this study was to explore the intricate relationship between sentiment analysis and stock prices, with a specific focus on three major tech companies: Microsoft (MSFT), Tesla (TSLA), and Apple (AAPL). Utilizing various analytical techniques, including Pearson correlation, wavelet coherence, and regression models, the research sought to unveil the underlying patterns that tie public sentiment, as presented in news titles and descriptions, to the dynamic fluctuations observed in stock prices.
The findings from the study are enlightening and hold substantial significance in the domains of finance and stock-market analytics. Notably, there were discernible correlations between sentiment and stock prices, specifically in relation to description polarity and opening prices for Microsoft, as well as title polarity and opening prices for Tesla. Additionally, a positive correlation was identified between title polarity and closing prices for Apple stocks, further corroborating the influence of sentiment analysis on stock-market dynamics.
Furthermore, wavelet coherence analysis, a sophisticated method used to discern patterns across multiple timescales, provided deeper insights.
These results not only align with some past studies, but also add a novel dimension to the current literature. The fact that large corporations like Microsoft, Tesla, and Apple are susceptible to media sentiment, albeit in varying capacities and manners, underscores the profound impact of public sentiment in today’s digitally connected world. The study thus fills a critical gap, offering a more granular understanding of how sentiment, as derived from news titles and descriptions, can influence stock trajectories for tech giants.
Theoretically, this research enriches the existing knowledge base by demonstrating the nuanced impacts of sentiment analysis on specific stock-price movements, offering a detailed exploration of the temporal dynamics within the financial domain. It contributes to the ongoing dialogue in behavioral finance, highlighting the significance of media sentiment in shaping market trends and investor behavior. Practically, our findings offer actionable insights for investors and financial strategists, suggesting that monitoring and analyzing sentiment in financial news can be a significant aspect of developing informed investment strategies. This understanding can be leveraged to anticipate market shifts, enabling a proactive approach to stock-market investment.
Moreover, the application of wavelet coherence in this study provides a promising avenue for future research endeavors. This methodology reaffirms the observations made in Ref. [
39], proving effective in decoding evolving correlation structures across diverse timescales. The findings also hint at the potential relevance of the Hurst parameter, an area of study suggested for future research endeavors, as a means to further deepen our understanding of long-range dependencies in financial time series.
One of the key limitations was the focus on three tech giants: Microsoft, Tesla, and Apple. While these companies hold significant sway in the market and are representative of large-capitalization stocks, they might not entirely capture the diverse landscape of stock-market reactions across varying sectors or smaller firms. As highlighted by Ref. [
34], sentiment might have a more pronounced impact on small-firm stock prices. Thus, generalizing our findings to the broader market requires caution.
Moreover, our analysis predominantly centered on news titles and descriptions as the primary sources of sentiment. While these are influential and widespread, they represent just a fraction of the sentiment-generating sources available. Social media platforms, investor forums, blogs, and expert analyses contribute substantially to the sentiment landscape and could provide alternative or supplementary insights.
Additionally, while our wavelet coherence analysis was comprehensive, it inherently carries the constraints of the technique. For instance, not finding significant coherence behavior for Tesla within the cone of influence doesn’t necessarily indicate a lack of relationship but might allude to other intricate dynamics that the technique couldn’t capture.
Looking ahead, the richness of our findings and the observed limitations naturally pave the way for future research directions. A logical extension would be to diversify the study across different sectors and include both large-cap and small-cap stocks. This would provide a more holistic picture of the stock market’s sentiment sensitivity.
Furthermore, incorporating a broader range of sentiment sources could refine our understanding. Analyzing sentiment data from social media platforms, especially given their real-time nature and vast user bases, could reveal patterns that traditional news sources might overlook.
Technological advancements also offer opportunities to integrate more sophisticated machine learning and artificial intelligence techniques, as suggested by Ref. [
35]. Such methodologies might provide sharper predictive insights, enhancing the practical application of sentiment analysis in stock-market forecasting.
Lastly, the potential exploration of the Hurst parameter, as hinted in our conclusions, stands as a promising area of study. Delving into long-range dependencies in financial time series can reveal patterns that traditional analyses might miss, providing investors with deeper, more nuanced insights.
In conclusion, this research not only sheds light on the intricate dance between sentiment analysis and stock-market behavior but also paves the way for future studies. It emphasizes the importance of sentiment analytics as a valuable tool for investors, financial analysts, and stakeholders looking to decode stock-market movements. As we continue to delve deeper into the age of information, understanding such dynamics will be paramount for making informed investment decisions and fostering financial growth.


 ,
, 


