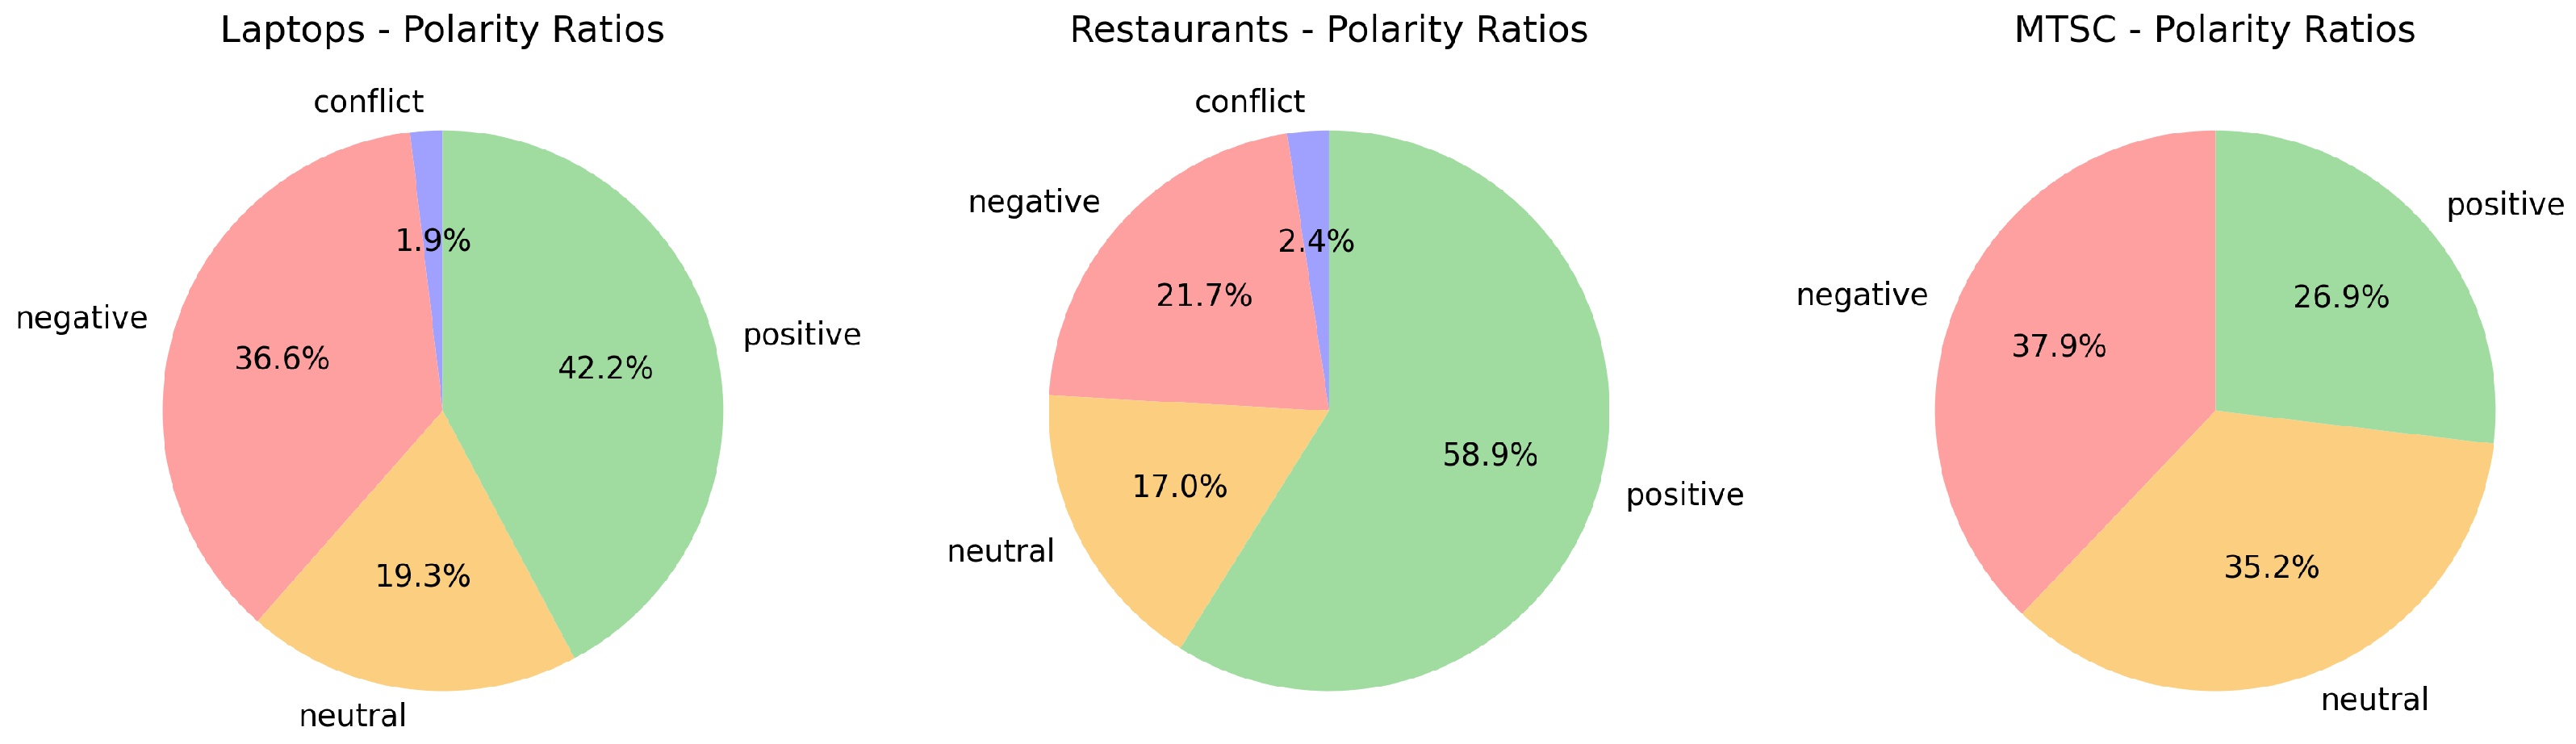
Figure 1.
Polarity distributions for the three data sets.
Figure 1.
Polarity distributions for the three data sets.
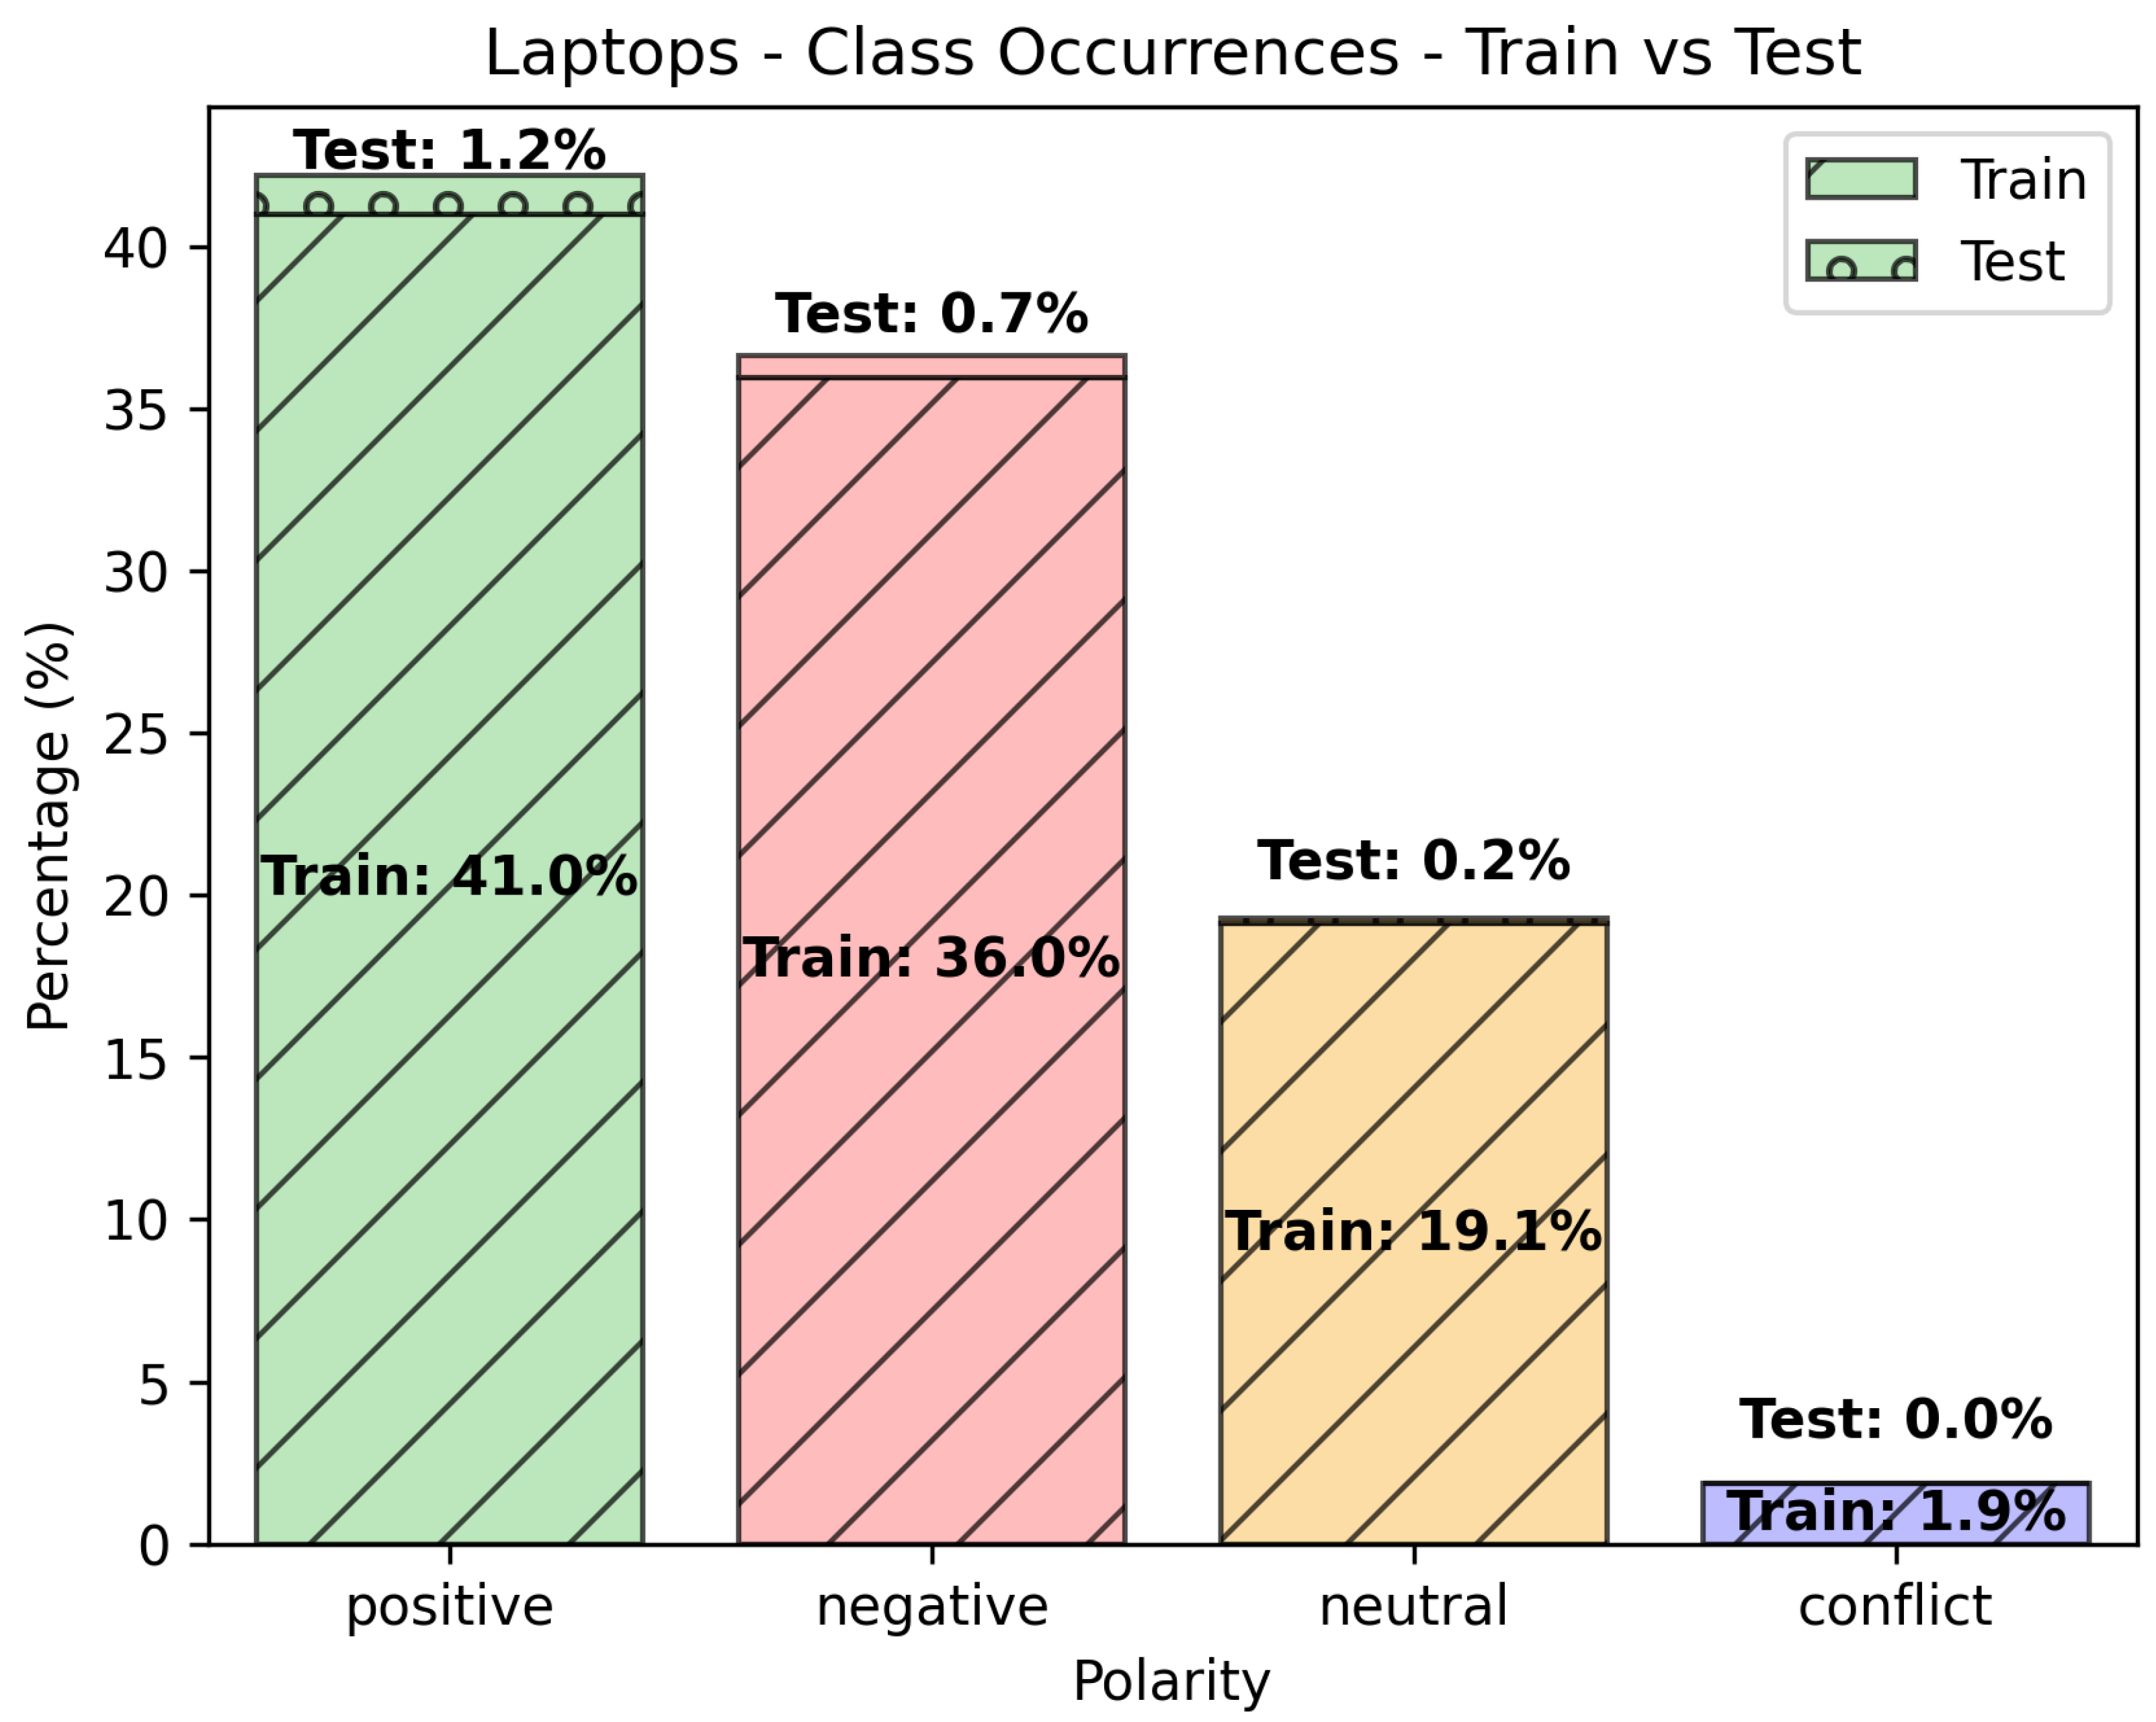
Figure 2.
Class occurrences (Train vs. Test) for the “Laptops” data set.
Figure 2.
Class occurrences (Train vs. Test) for the “Laptops” data set.
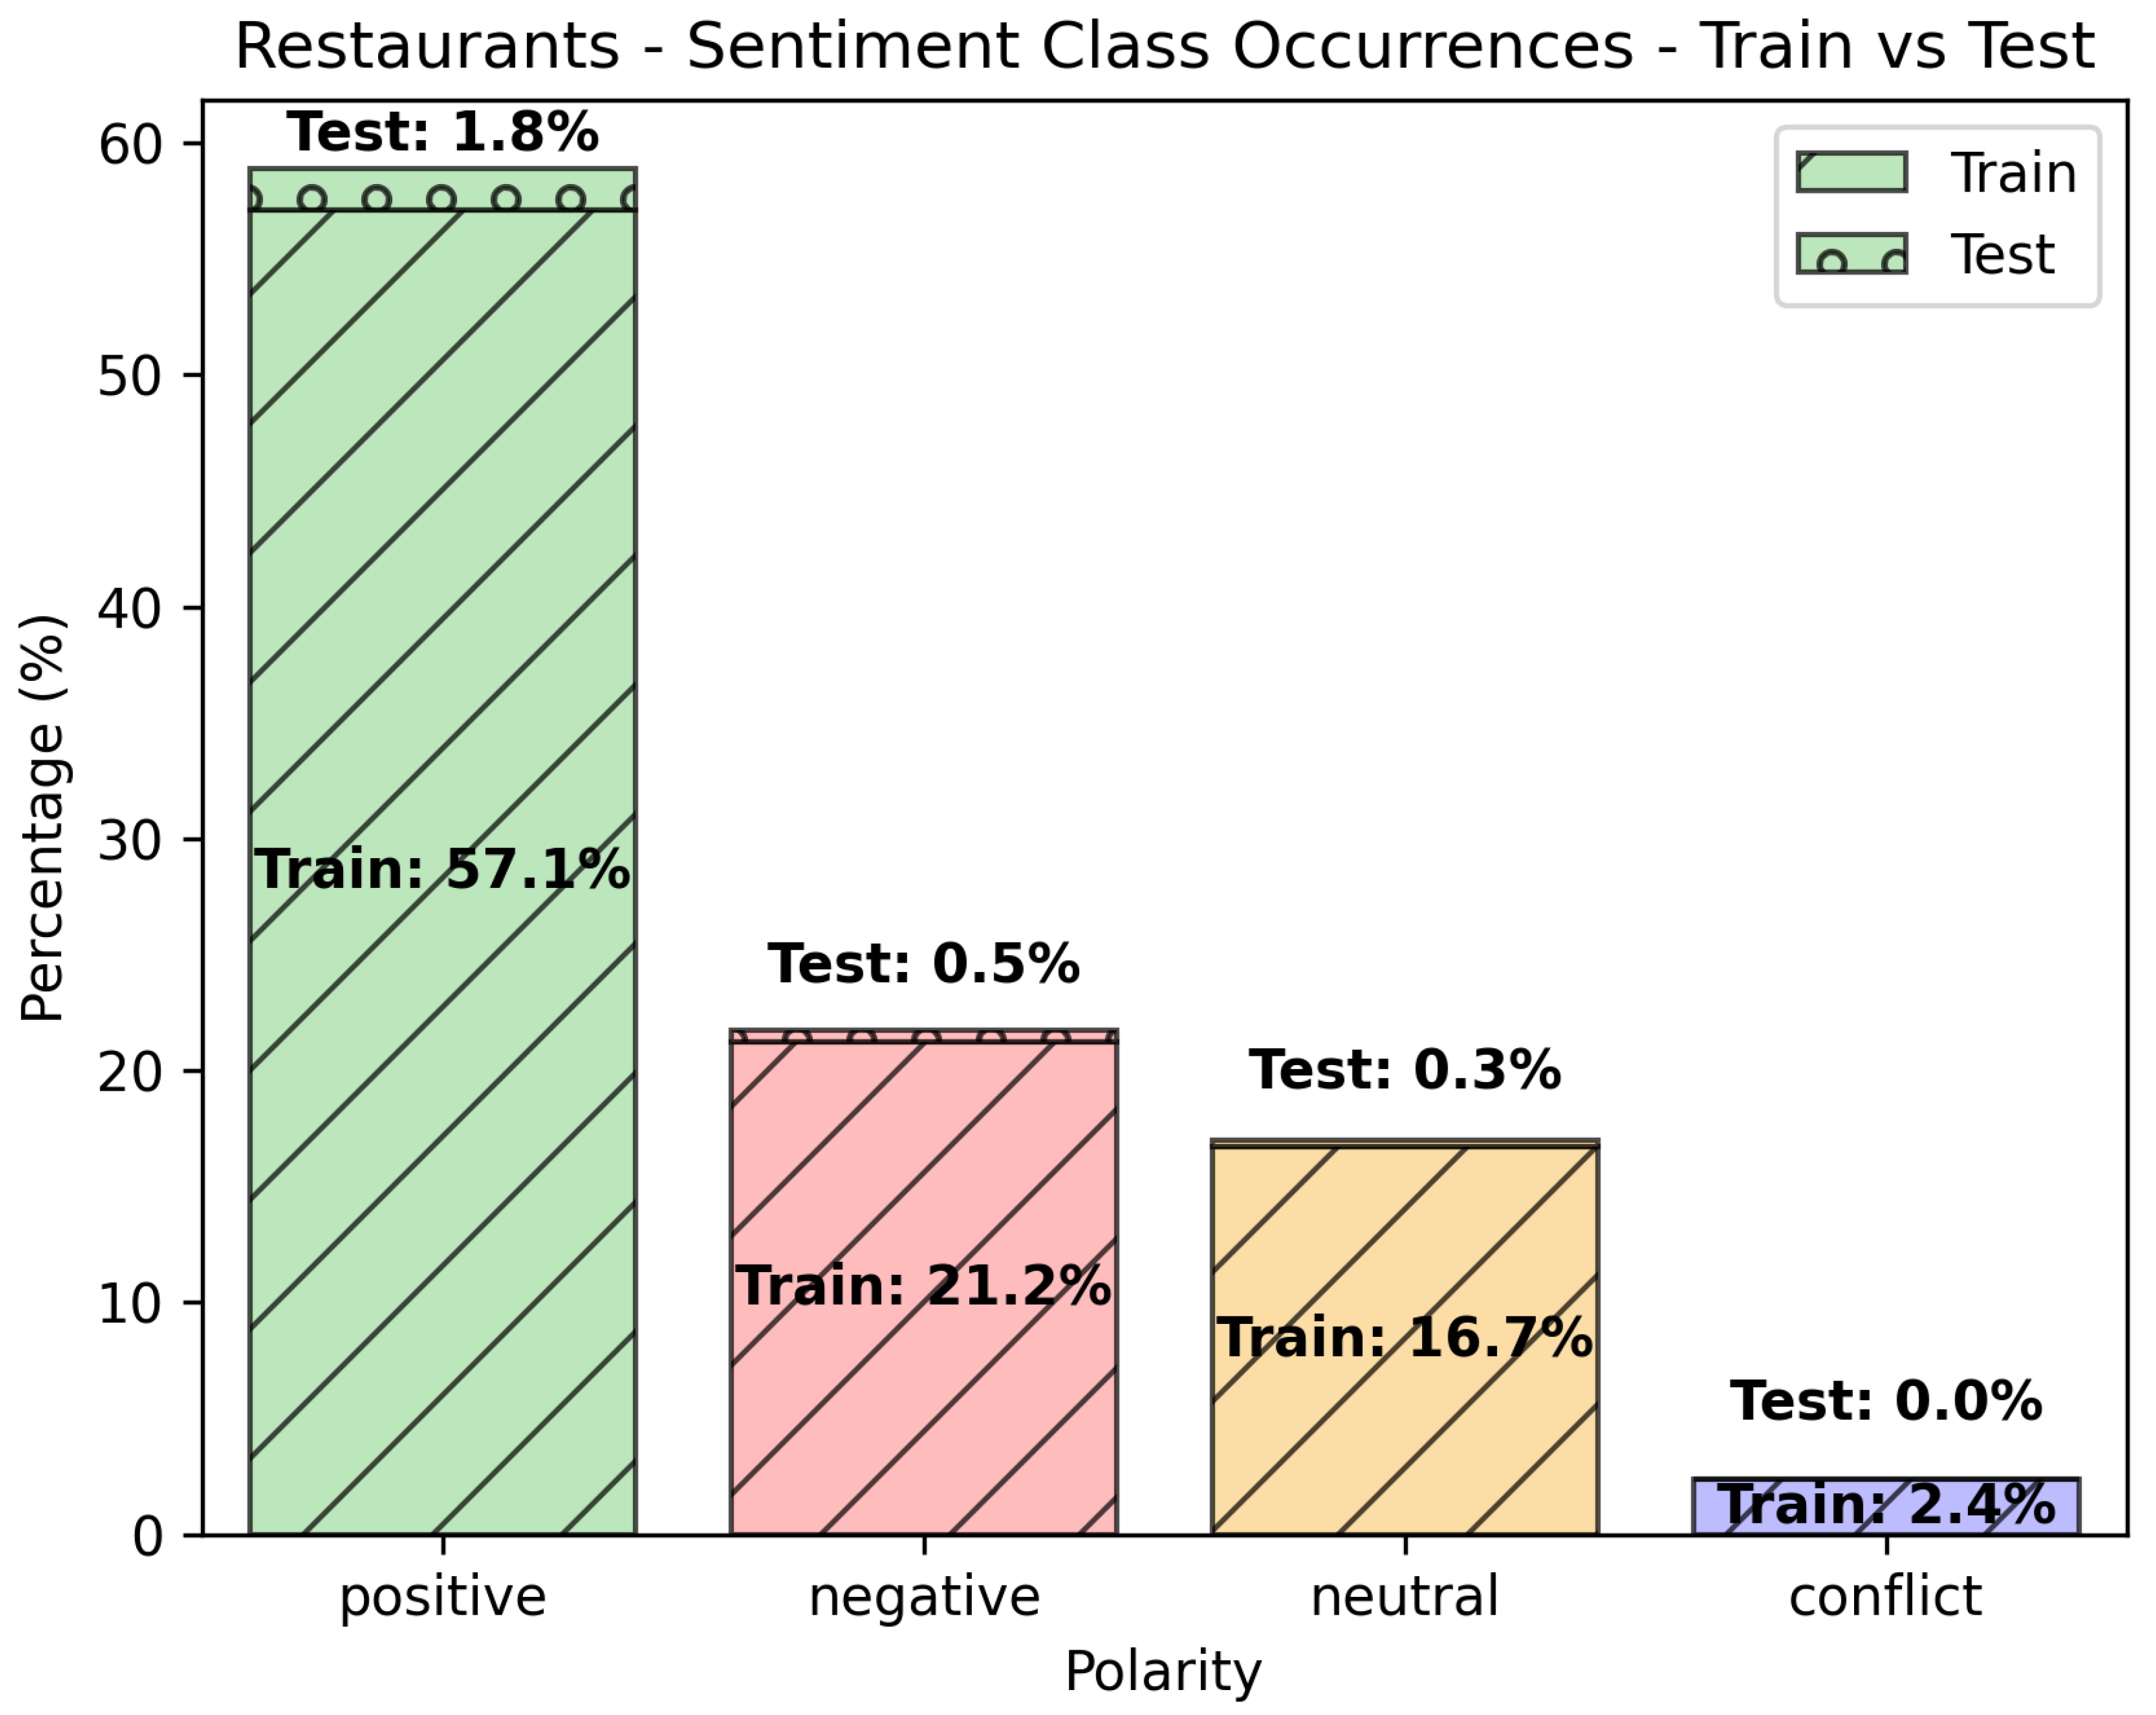
Figure 3.
Class occurrences (Train vs. Test) for the “Restaurants” data set.
Figure 3.
Class occurrences (Train vs. Test) for the “Restaurants” data set.
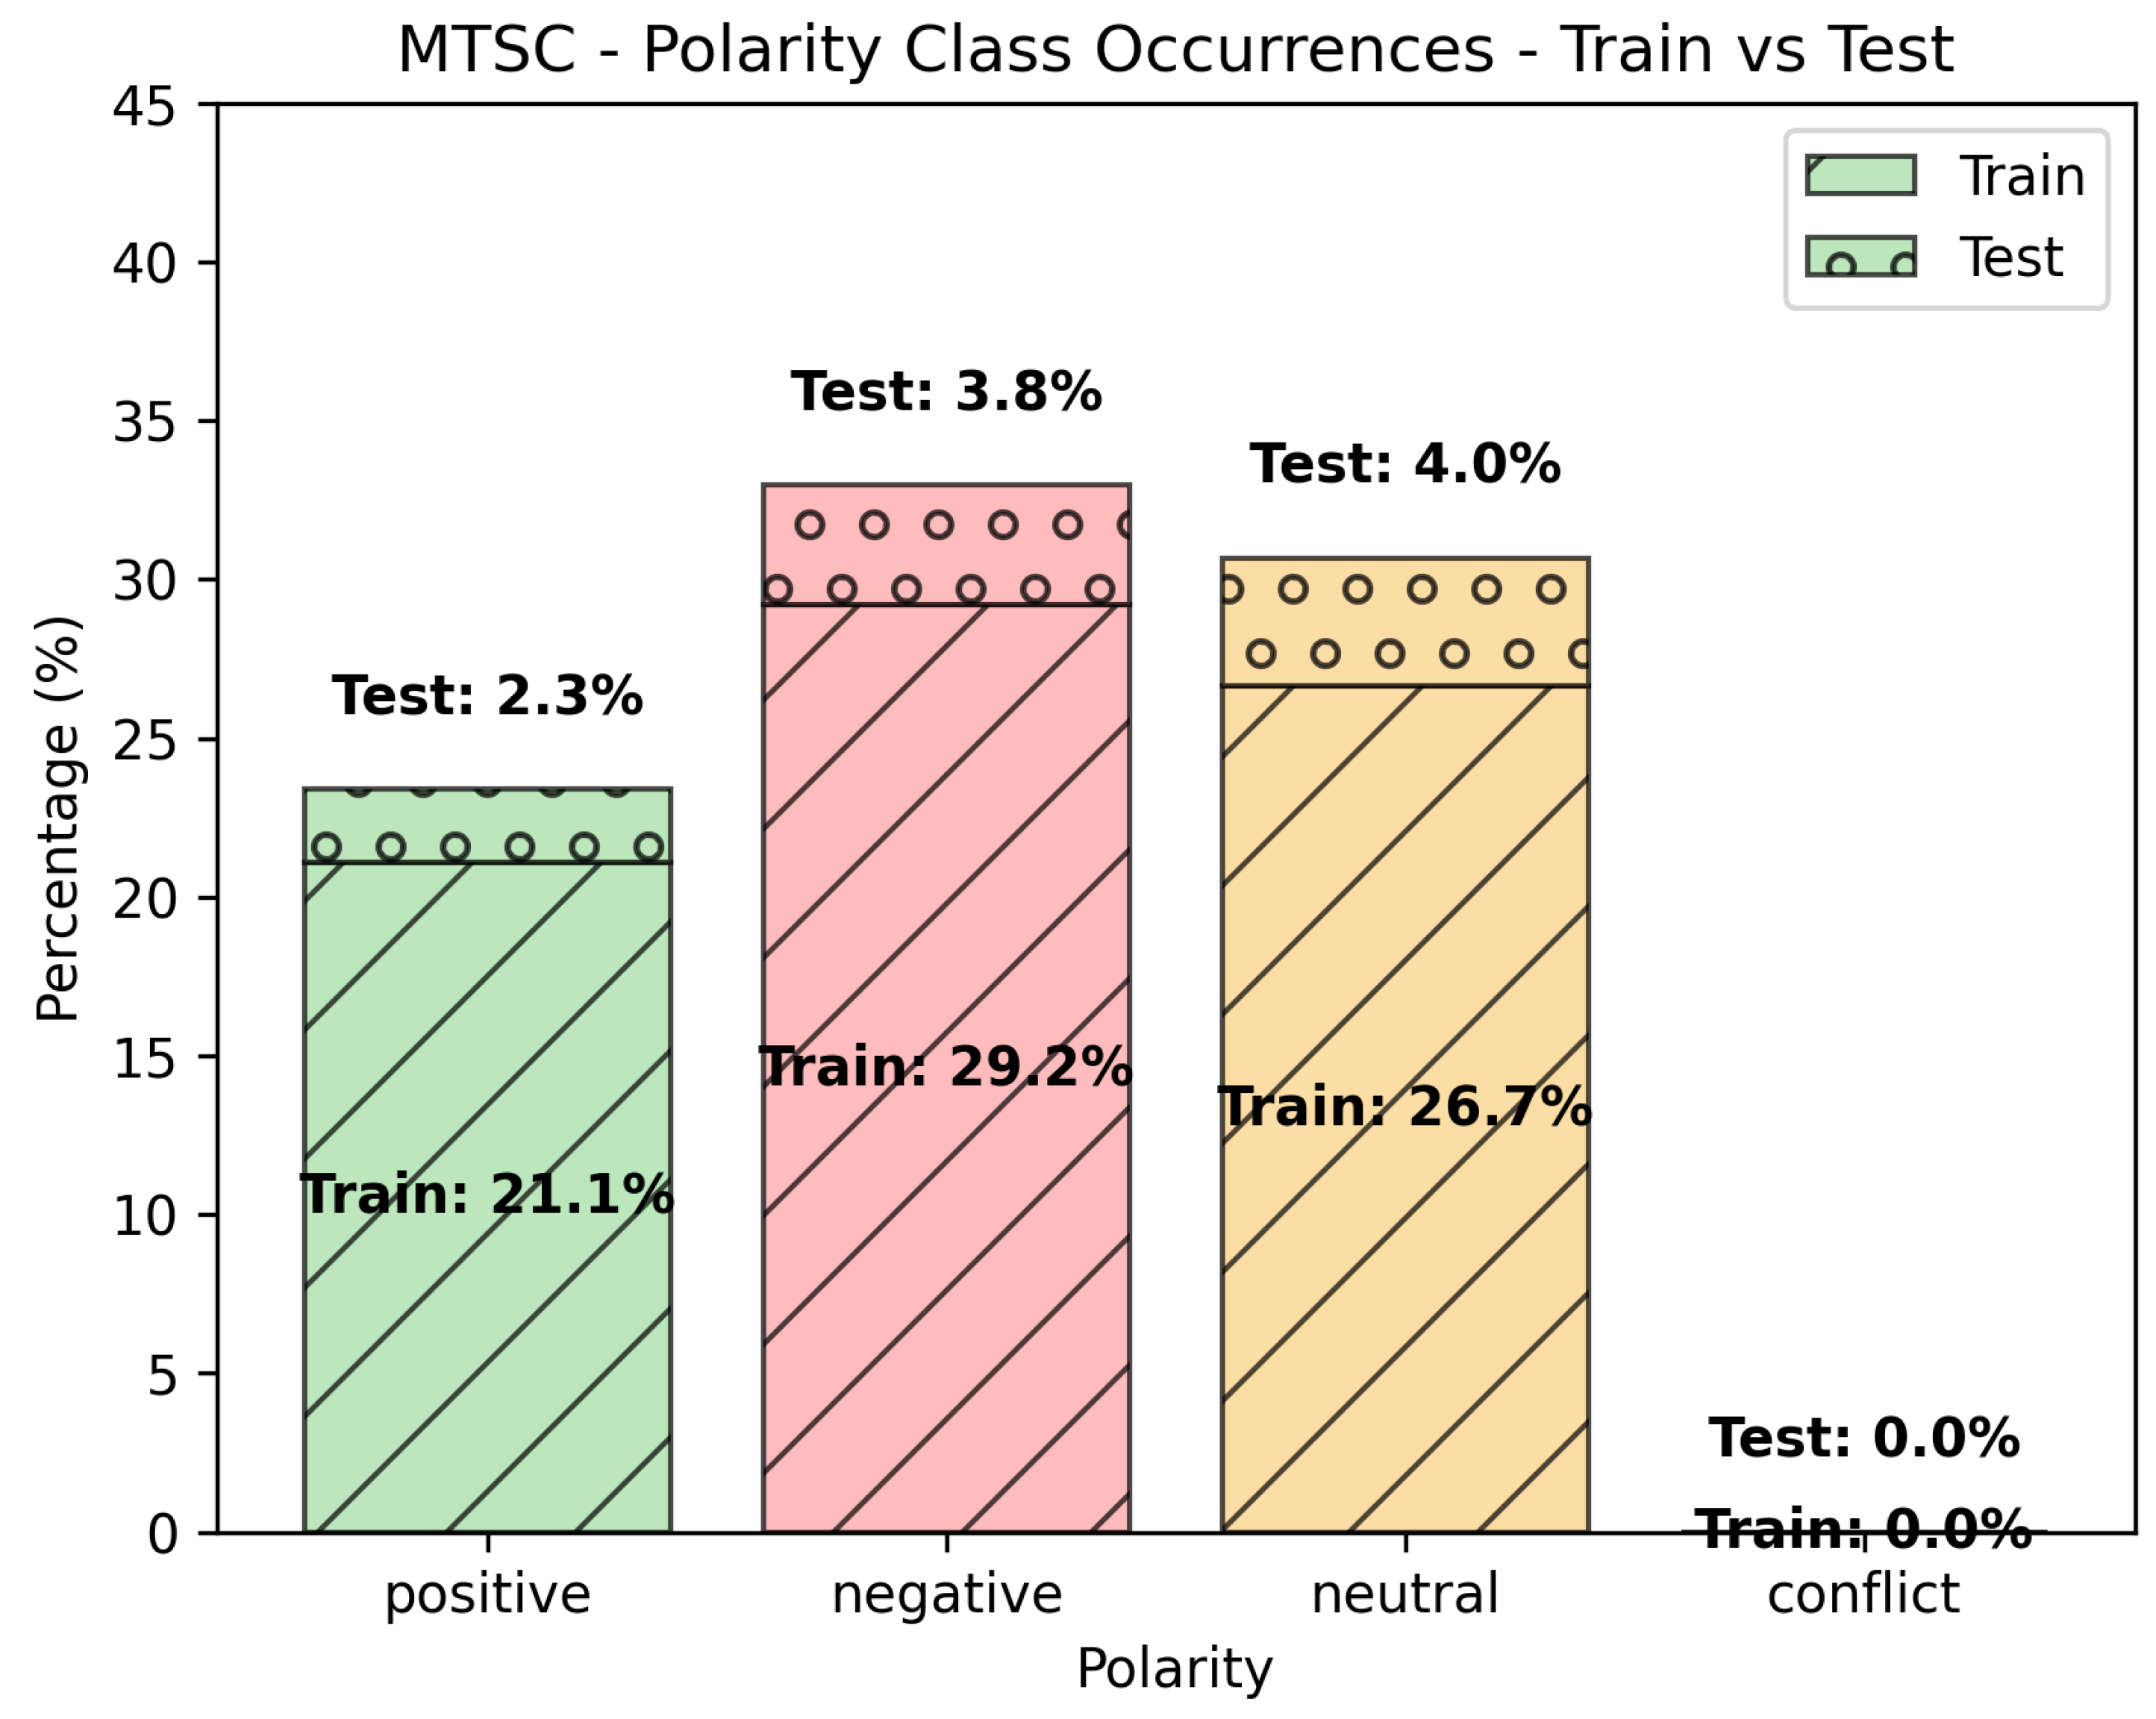
Figure 4.
Class occurrences (Train vs. Test) for the MTSC data set.
Figure 4.
Class occurrences (Train vs. Test) for the MTSC data set.
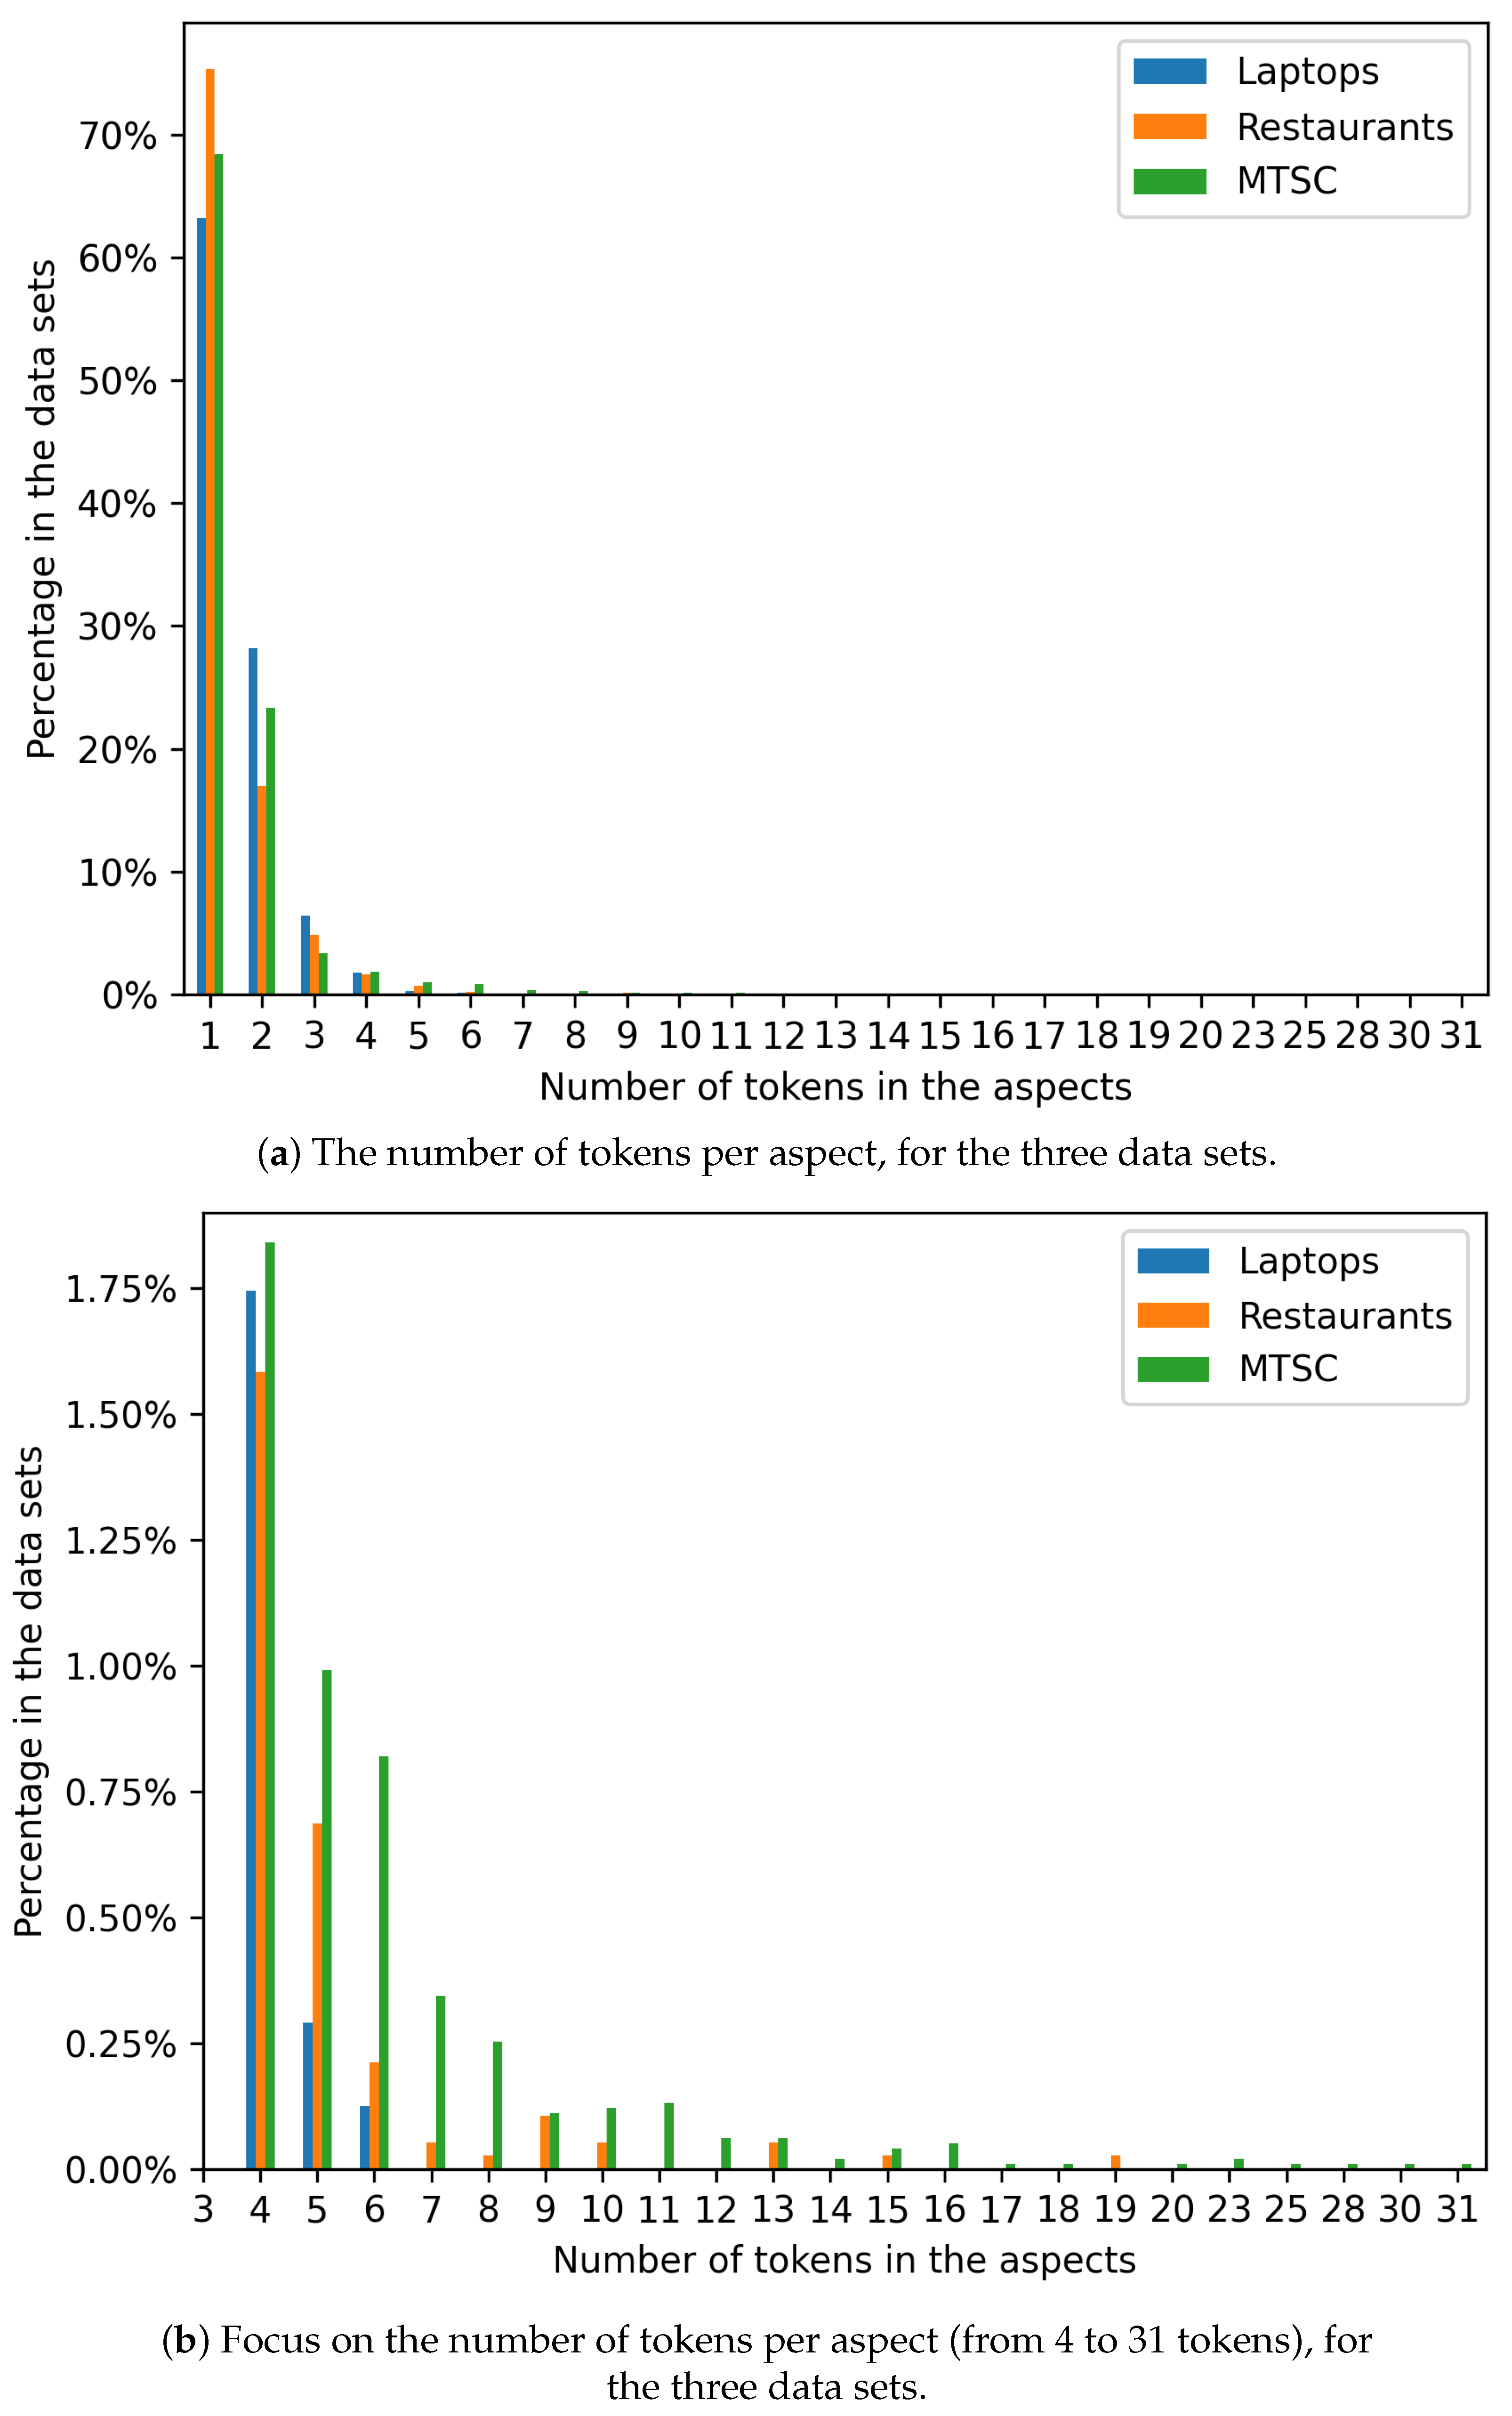
Figure 5.
Number of tokens per aspect, for the three data sets.
Figure 5.
Number of tokens per aspect, for the three data sets.
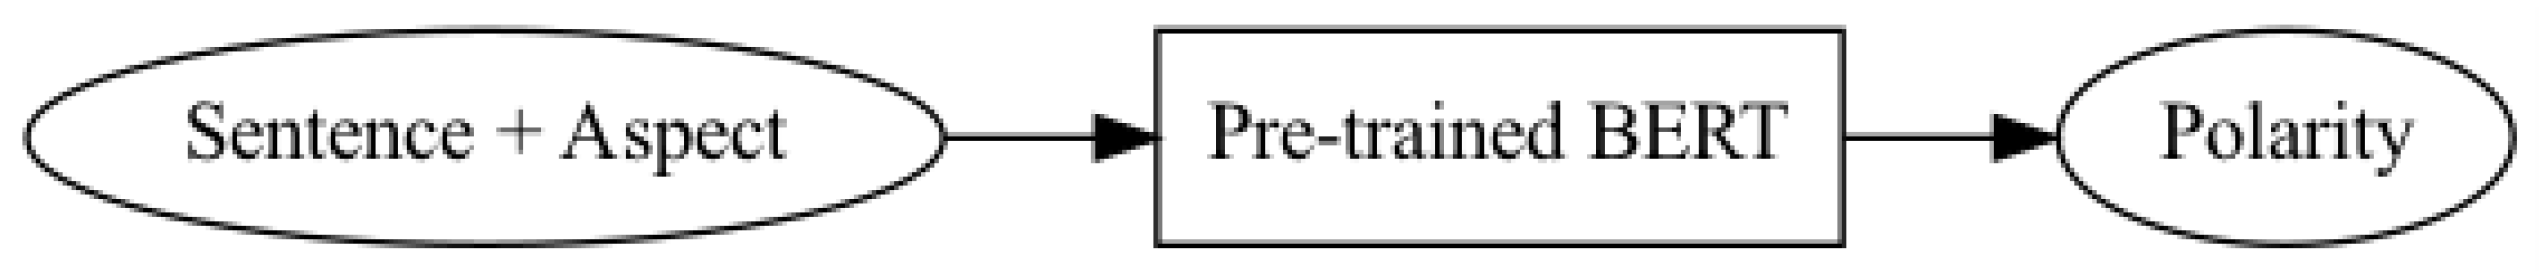
Figure 6.
Sentence processing pipeline based on pretrained BERT.
Figure 6.
Sentence processing pipeline based on pretrained BERT.
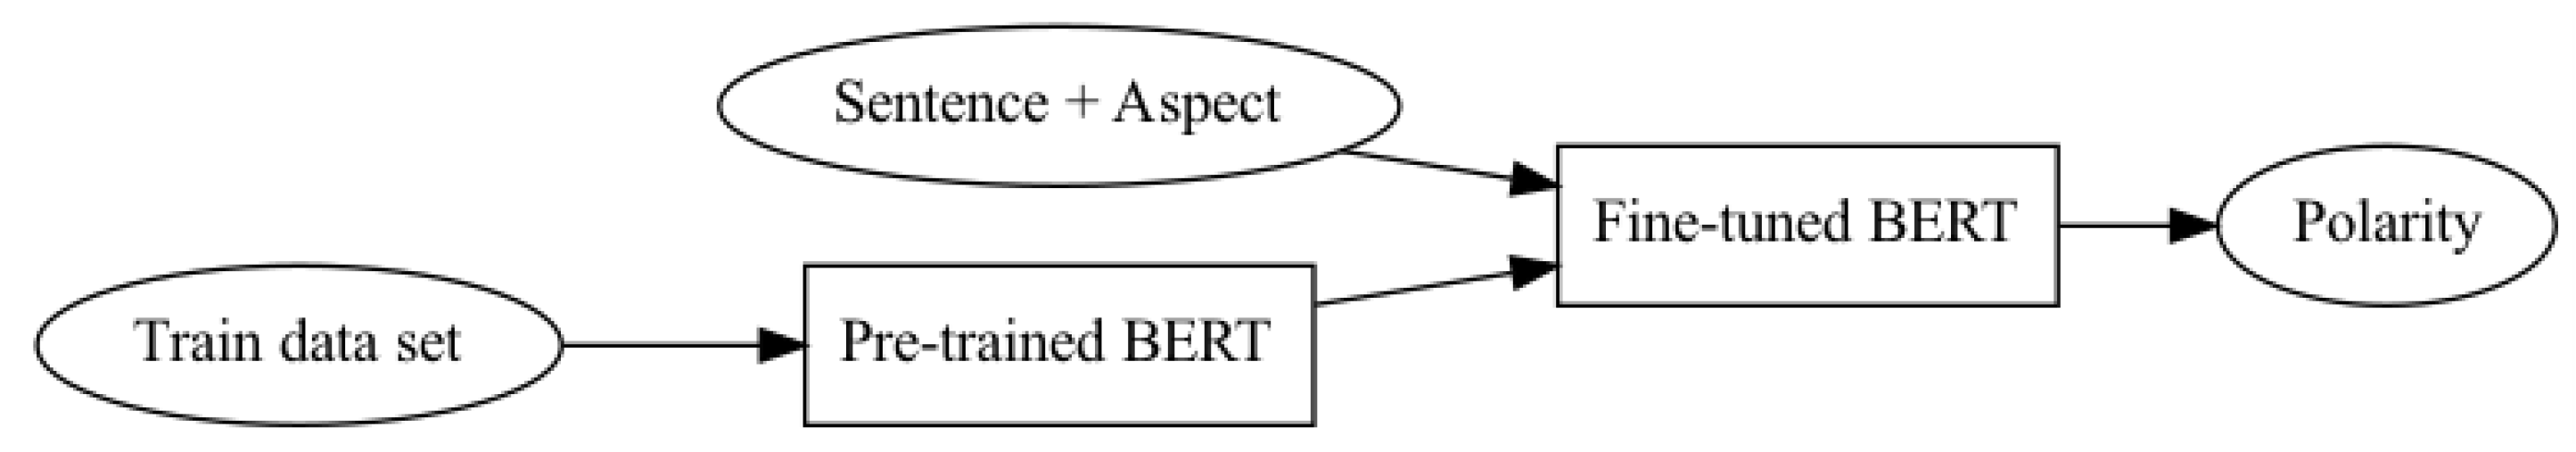
Figure 7.
Sentence processing pipeline based on fine-tuned BERT.
Figure 7.
Sentence processing pipeline based on fine-tuned BERT.
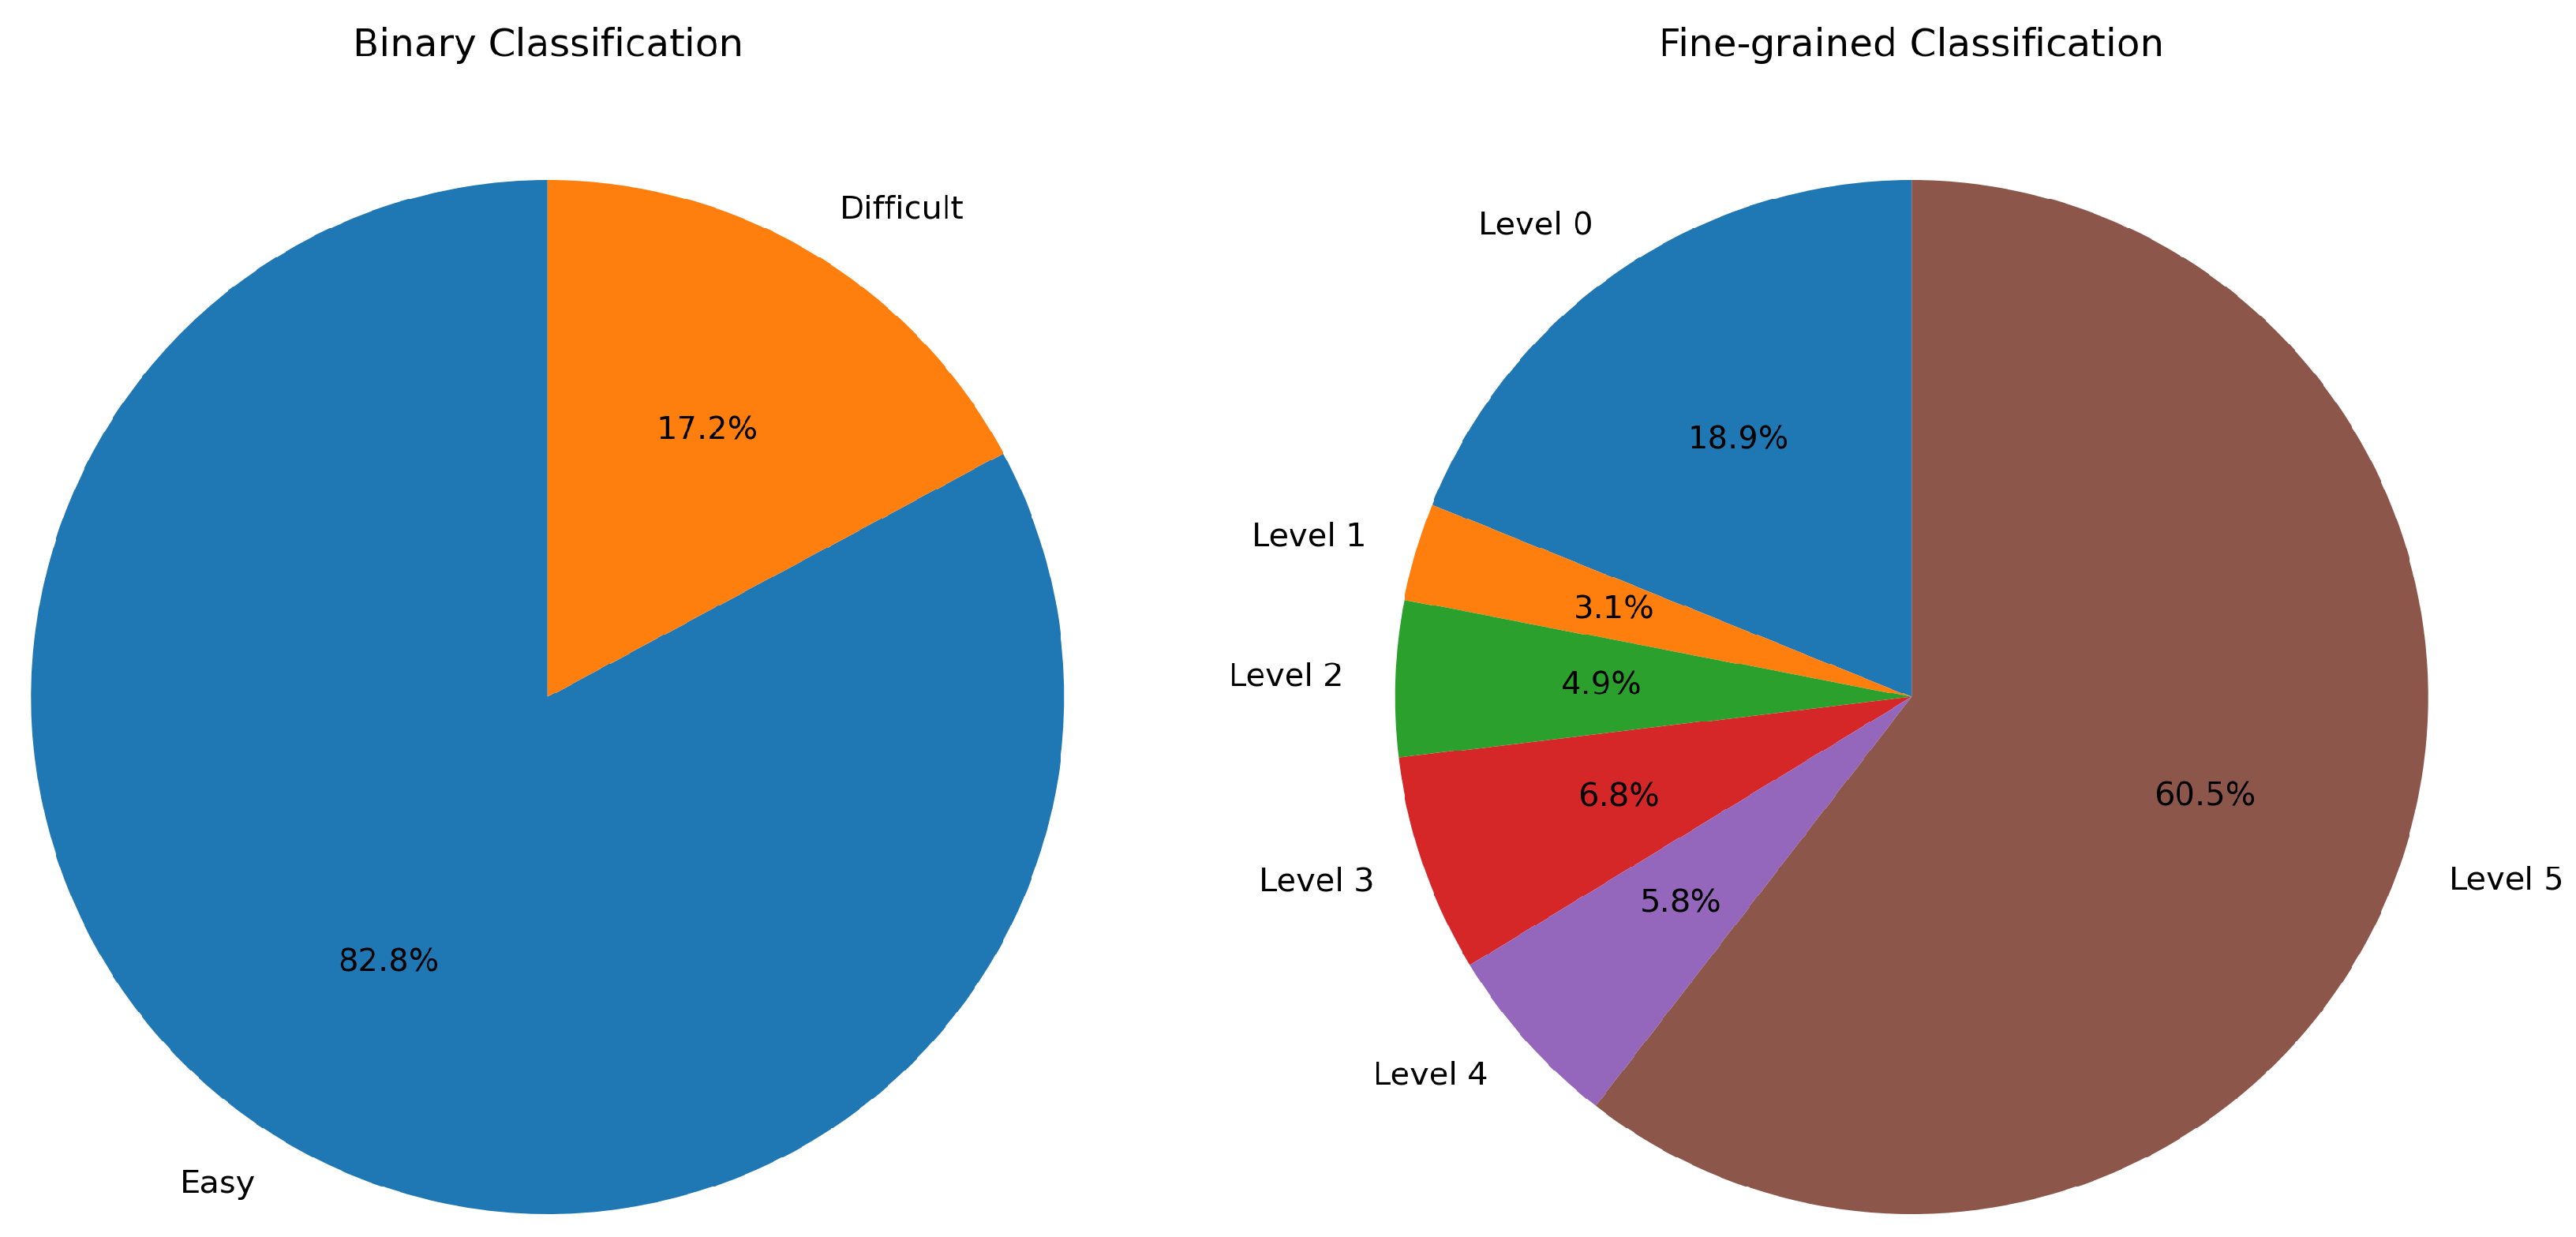
Figure 8.
Class repartition for the binary strategy and for the BERT fine-grained strategy, respectively.
Figure 8.
Class repartition for the binary strategy and for the BERT fine-grained strategy, respectively.
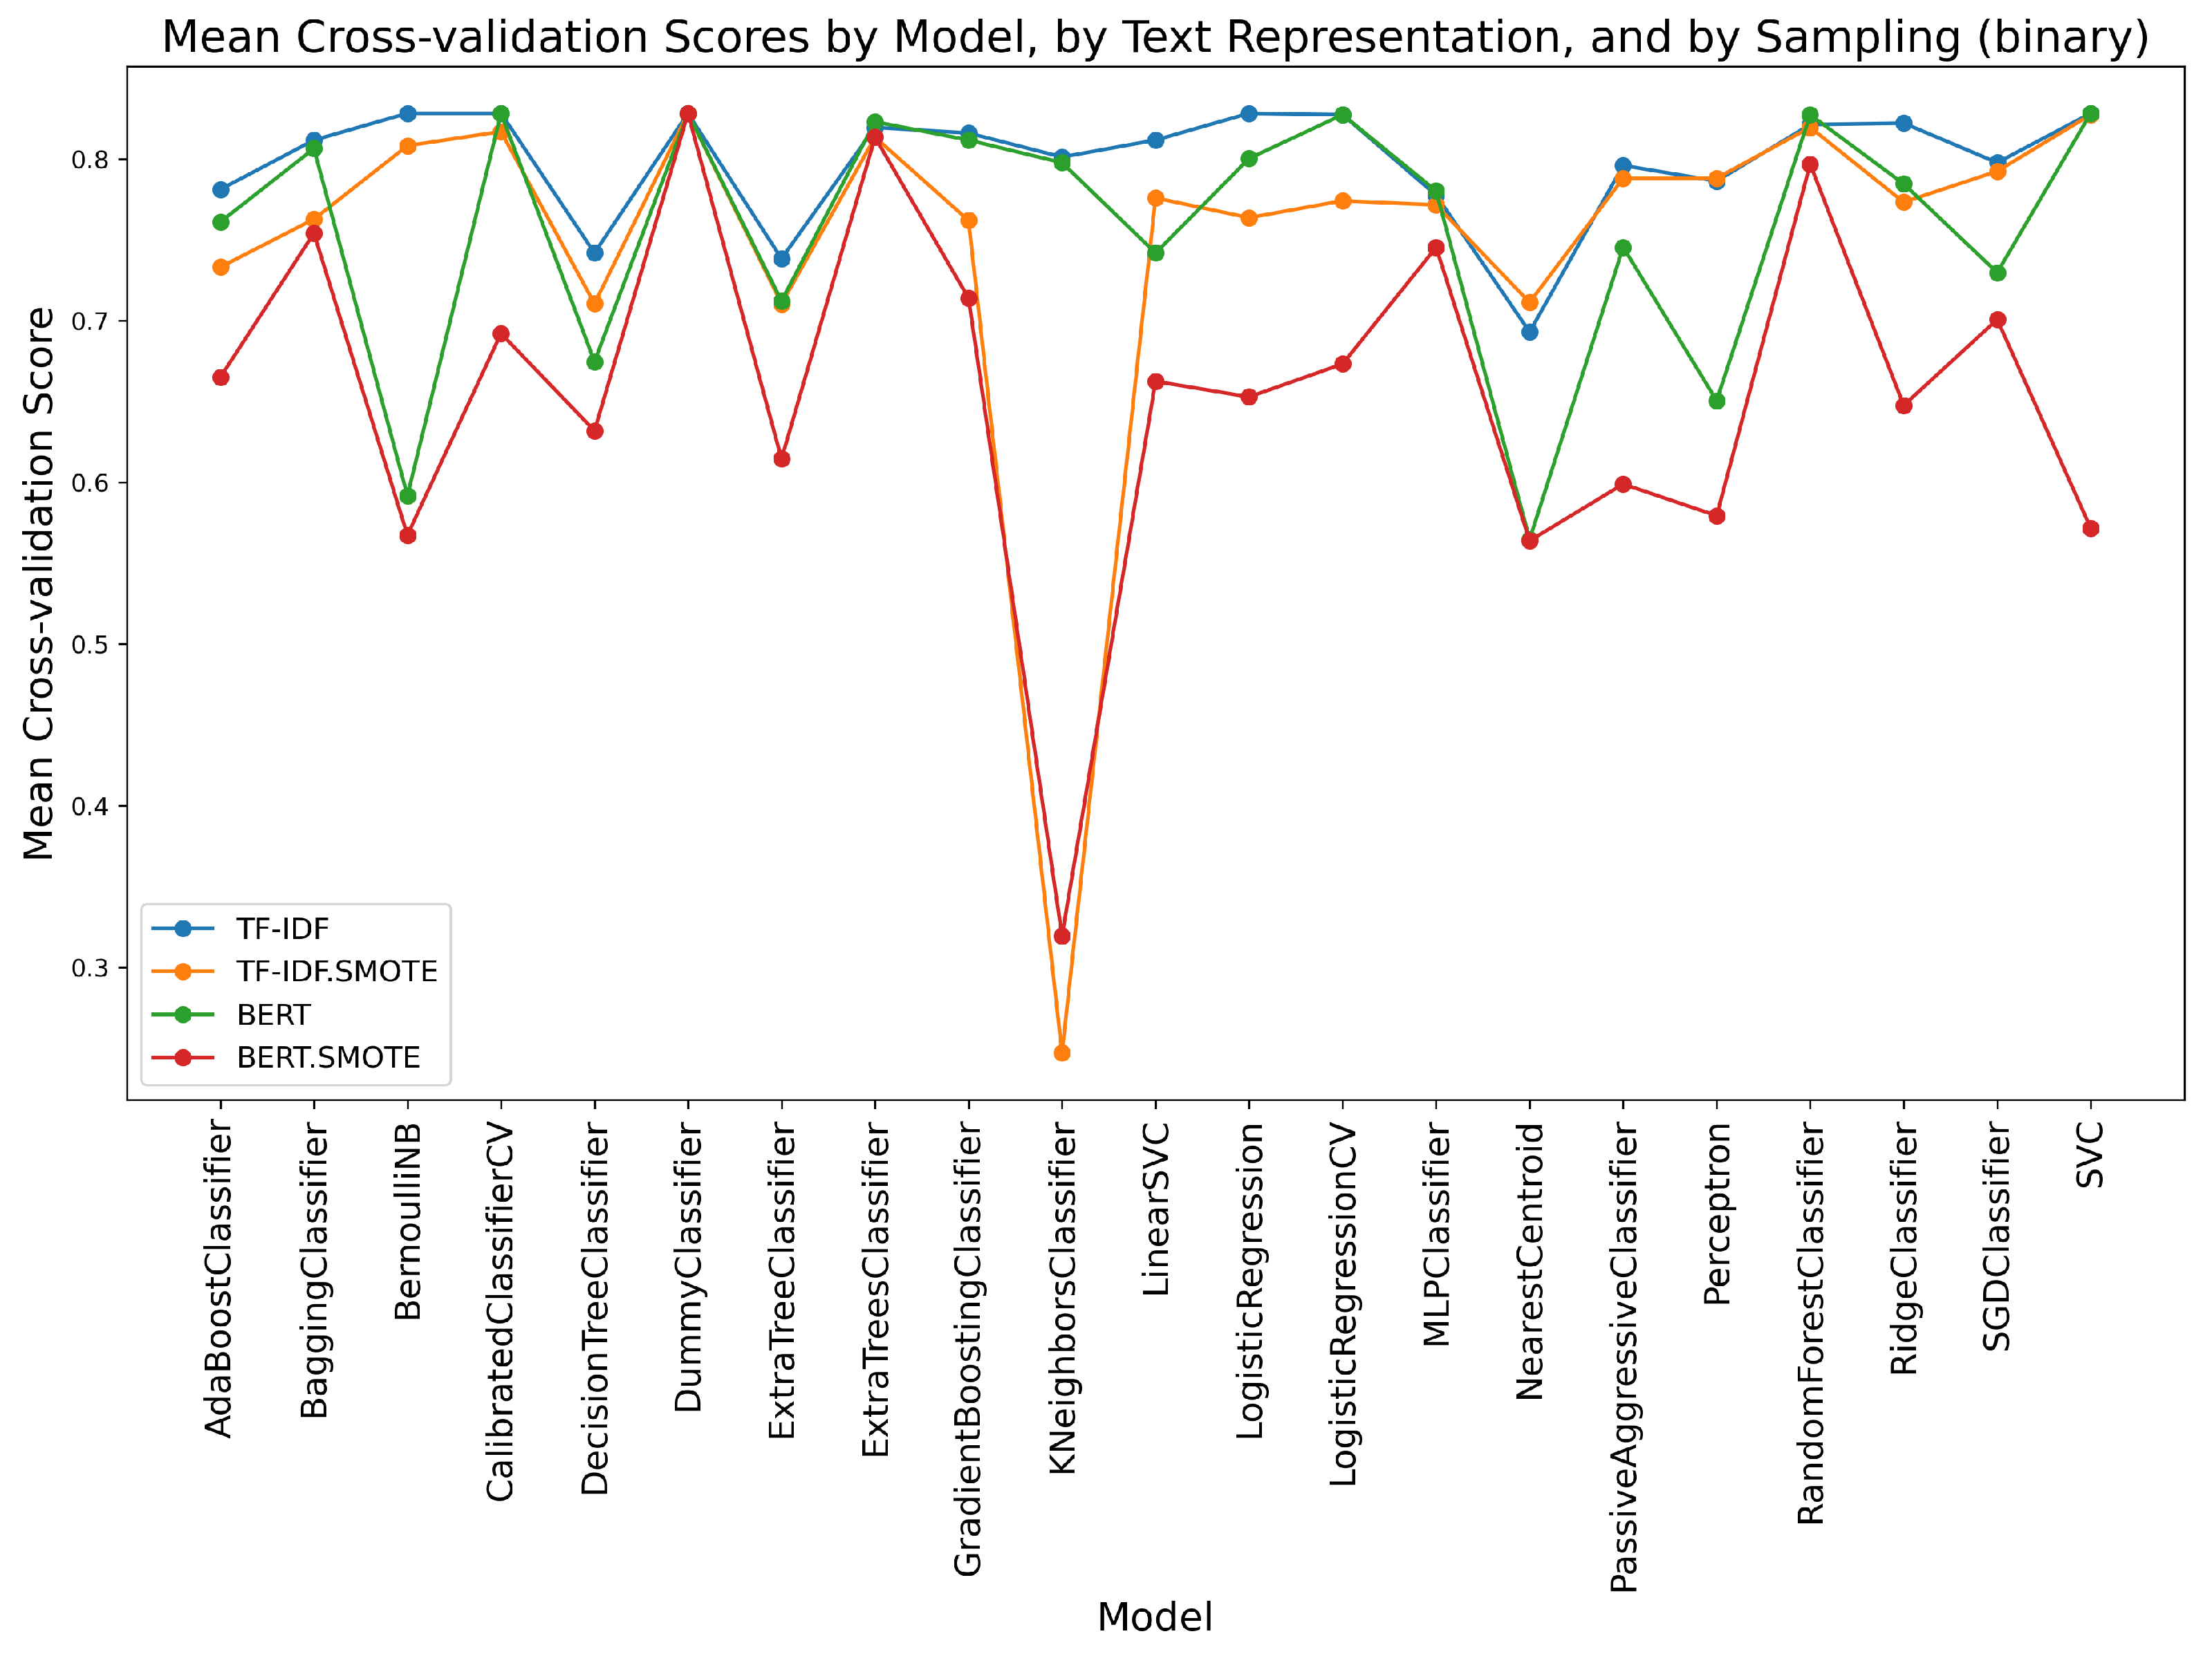
Figure 9.
Mean cross-validation scores by model, by text representation, and by sampling, for difficulty prediction as binary classification.
Figure 9.
Mean cross-validation scores by model, by text representation, and by sampling, for difficulty prediction as binary classification.
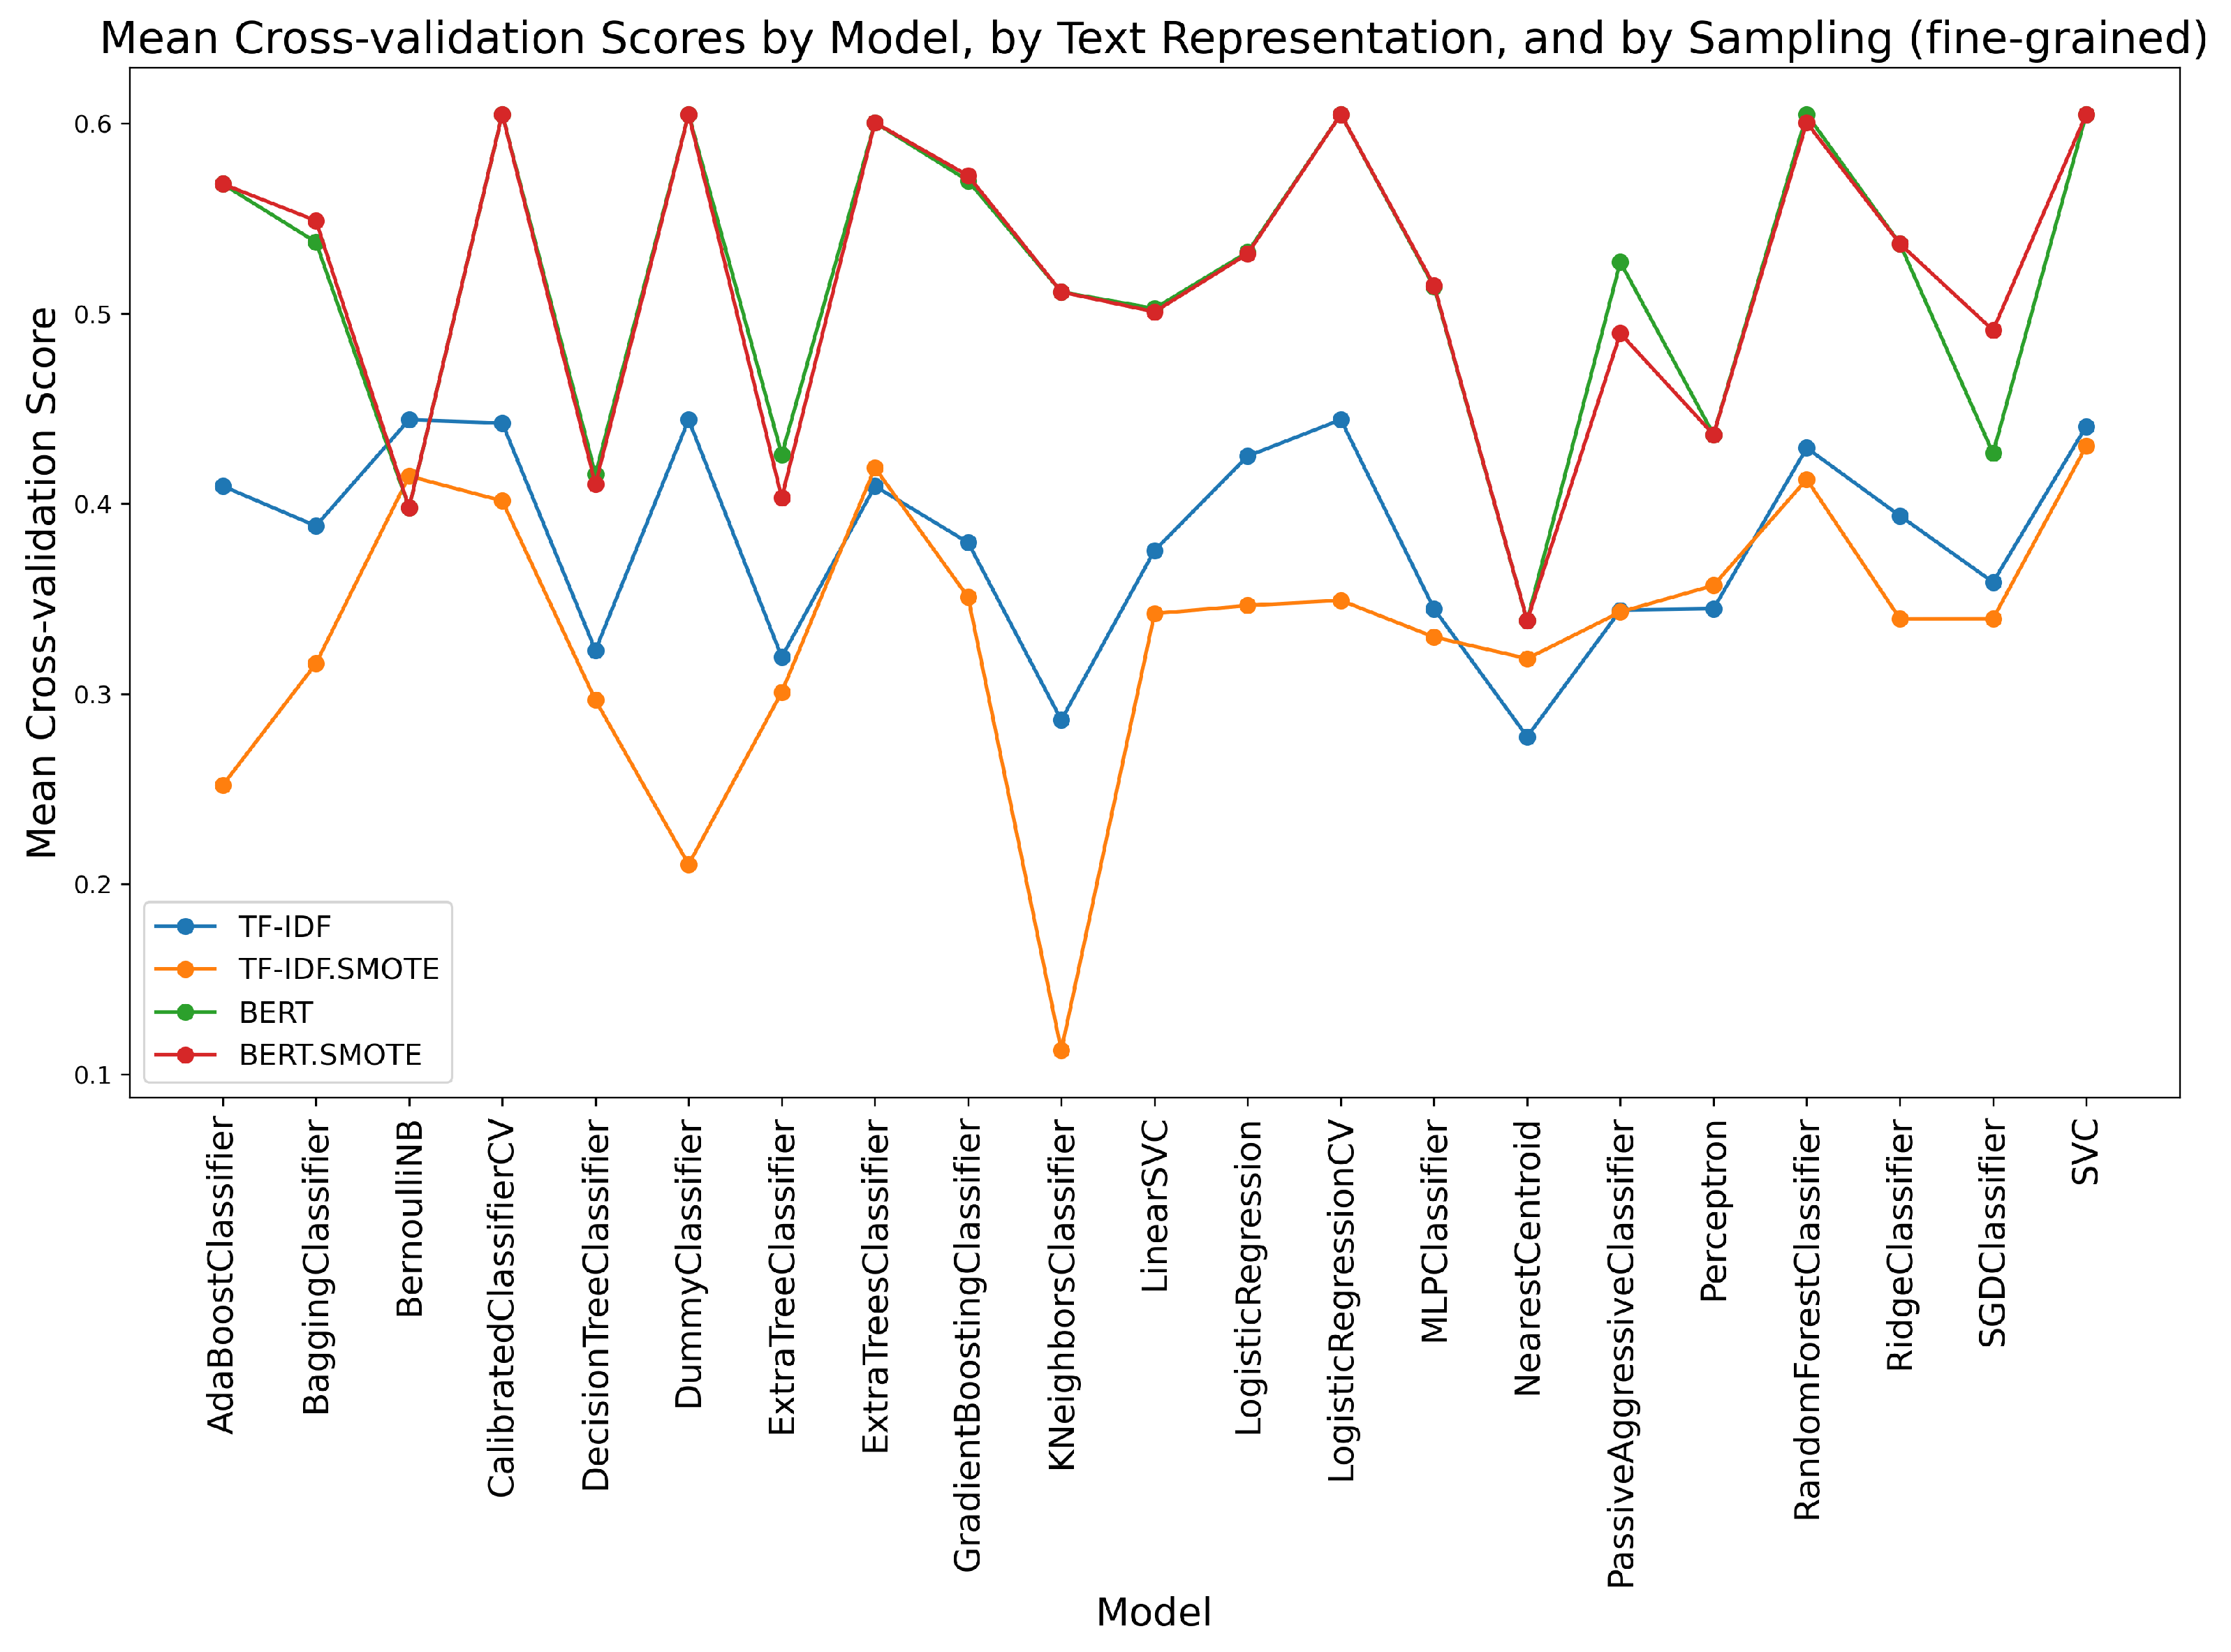
Figure 10.
Mean cross-validation scores by model, by text representation, and by sampling, for difficulty prediction as multi-class, fine-grained classification.
Figure 10.
Mean cross-validation scores by model, by text representation, and by sampling, for difficulty prediction as multi-class, fine-grained classification.
Table 1.
Summary of the data set information.
Table 1.
Summary of the data set information.
| Data Sets | Total | Train | Test | # of Classes |
|---|
| Laptops | 2407 | 2358 | 49 | 4 |
| Restaurants | 3789 | 3693 | 96 | 4 |
| MTSC | 9885 | 8739 | 1146 | 3 |
Table 2.
Token and sentence statistics for the data sets.
Table 2.
Token and sentence statistics for the data sets.
| Data Set | # of Observations | # of Unique Aspects | # of Unique Sentences | Max # of Tokens per Aspect |
|---|
| Laptops | 2407 | 1044 | 1484 | 6 |
| Restaurants | 3789 | 1289 | 2022 | 19 |
| MTSC | 9885 | 3525 | 8802 | 31 |
Table 3.
Average number of tokens, nouns, verbs, named entities, and adjectives per sentence.
Table 3.
Average number of tokens, nouns, verbs, named entities, and adjectives per sentence.
| Data Set/Class | Tokens | Nouns | Verbs | Named Entities | Adjectives |
|---|
| Laptops | Positive | 20.04 | 3.72 | 1.98 | 0.64 | 1.94 |
| Negative | 22.76 | 4.04 | 2.81 | 0.82 | 1.42 |
| Neutral | 25.24 | 4.54 | 2.83 | 1.33 | 1.43 |
| Conflict | 23.84 | 3.82 | 2.69 | 0.84 | 2.02 |
| Restaurants | Positive | 18.81 | 3.77 | 1.41 | 0.54 | 2.20 |
| Negative | 22.50 | 4.10 | 2.18 | 0.50 | 1.99 |
| Neutral | 21.62 | 4.14 | 2.26 | 0.74 | 1.48 |
| Conflict | 22.31 | 3.60 | 1.76 | 0.48 | 2.67 |
| MTSC | Positive | 30.12 | 5.07 | 3.29 | 2.95 | 1.99 |
| Negative | 31.58 | 5.31 | 3.55 | 3.27 | 1.94 |
| Neutral | 27.63 | 4.13 | 3.03 | 3.30 | 1.40 |
| Conflict | 0.00 | 0.00 | 0.00 | 0.00 | 0.00 |
Table 4.
Hardware and software specifications.
Table 4.
Hardware and software specifications.
| Hardware (Computing Cluster Node) | Specification |
|---|
| CPU | 40 Intel(R) Xeon(R) Silver 4114 CPU @ 2.20 GHz |
| RAM | 354 GB |
| GPU | 8 (7 Nvidia A40 and 1 Nvidia GeForce RTX 3090) |
| Software (Conda virtual environment) | Version |
| python | 3.11 |
| Python modules | Version |
| huggingface_hub | 0.14.1 |
| lazy-text-predict | 0.0.11 |
| lazypredict | 0.2.12 |
| lazytext | 0.0.2 |
| matplotlib-base | 3.7.1 |
| nltk | 3.7 |
| numpy | 1.24.3 |
| pandas | 1.3.5 |
| scikit-learn | 1.3.1 |
| scipy | 1.10.1 |
| spacy | 3.5.3 |
| torch | 2.0.1 |
| transformers | 4.29.2 |
Table 5.
Macro Metrics of Classification Models (“Laptops”, TF-IDF representations).
Table 5.
Macro Metrics of Classification Models (“Laptops”, TF-IDF representations).
| Model | Precision (Macro) | Recall (Macro) | F1 (Macro) |
|---|
| AdaBoostClassifier | 0.351852 | 0.356681 | 0.333003 |
| BaggingClassifier | 0.734375 | 0.725754 | 0.729989 |
| BernoulliNB | 0.888616 | 0.613506 | 0.663075 |
| CalibratedClassifierCV | 0.968750 | 0.875000 | 0.913765 |
| DecisionTreeClassifier | 0.750000 | 0.734375 | 0.741935 |
| DummyClassifier | 0.197279 | 0.333333 | 0.247863 |
| ExtraTreeClassifier | 0.750000 | 0.734375 | 0.741935 |
| ExtraTreesClassifier | 0.750000 | 0.734375 | 0.741935 |
| GradientBoostingClassifier | 0.648674 | 0.542026 | 0.567858 |
| KNeighborsClassifier | 0.604725 | 0.544540 | 0.560063 |
| LinearSVC | 0.725000 | 0.656250 | 0.685855 |
| LogisticRegression | 0.783127 | 0.801006 | 0.786207 |
| LogisticRegressionCV | 0.620202 | 0.571839 | 0.584436 |
| MLPClassifier | 0.750000 | 0.734375 | 0.741935 |
| NearestCentroid | 0.410417 | 0.382543 | 0.377963 |
| PassiveAggressiveClassifier | 0.750000 | 0.734375 | 0.741935 |
| Perceptron | 0.700000 | 0.718750 | 0.705556 |
| RandomForestClassifier | 0.750000 | 0.734375 | 0.741935 |
| RidgeClassifier | 0.671371 | 0.640625 | 0.653305 |
| SGDClassifier | 0.725000 | 0.656250 | 0.685855 |
| SVC | 0.740385 | 0.717672 | 0.725551 |
Table 6.
Weighted Metrics of Classification Models (“Laptops”, TF-IDF representations).
Table 6.
Weighted Metrics of Classification Models (“Laptops”, TF-IDF representations).
| Model | Precision (Weighted) | Recall (Weighted) | F1 (Weighted) |
|---|
| AdaBoostClassifier | 0.695389 | 0.612245 | 0.615577 |
| BaggingClassifier | 0.979592 | 0.959184 | 0.969209 |
| BernoulliNB | 0.826355 | 0.795918 | 0.776692 |
| CalibratedClassifierCV | 0.944515 | 0.938776 | 0.937463 |
| DecisionTreeClassifier | 1.000000 | 0.979592 | 0.989467 |
| DummyClassifier | 0.350271 | 0.591837 | 0.440084 |
| ExtraTreeClassifier | 1.000000 | 0.979592 | 0.989467 |
| ExtraTreesClassifier | 1.000000 | 0.979592 | 0.989467 |
| GradientBoostingClassifier | 0.856602 | 0.795918 | 0.808693 |
| KNeighborsClassifier | 0.671202 | 0.673469 | 0.668267 |
| LinearSVC | 0.958503 | 0.938776 | 0.946707 |
| LogisticRegression | 0.859837 | 0.857143 | 0.854516 |
| LogisticRegressionCV | 0.738157 | 0.755102 | 0.734680 |
| MLPClassifier | 1.000000 | 0.979592 | 0.989467 |
| NearestCentroid | 0.684864 | 0.551020 | 0.602253 |
| PassiveAggressiveClassifier | 1.000000 | 0.979592 | 0.989467 |
| Perceptron | 0.983673 | 0.959184 | 0.969161 |
| RandomForestClassifier | 1.000000 | 0.979592 | 0.989467 |
| RidgeClassifier | 0.941409 | 0.918367 | 0.926085 |
| SGDClassifier | 0.958503 | 0.938776 | 0.946707 |
| SVC | 0.834969 | 0.836735 | 0.831855 |
Table 7.
Macro Metrics of Classification Models (“Restaurants”, TF-IDF representations).
Table 7.
Macro Metrics of Classification Models (“Restaurants”, TF-IDF representations).
| Model | Precision (Macro) | Recall (Macro) | F1 (Macro) |
|---|
| AdaBoostClassifier | 0.798309 | 0.413617 | 0.416818 |
| BaggingClassifier | 0.995169 | 0.981481 | 0.988043 |
| BernoulliNB | 0.828750 | 0.613617 | 0.672518 |
| CalibratedClassifierCV | 0.912913 | 0.791394 | 0.836613 |
| DecisionTreeClassifier | 1.000000 | 1.000000 | 1.000000 |
| DummyClassifier | 0.236111 | 0.333333 | 0.276423 |
| ExtraTreeClassifier | 1.000000 | 1.000000 | 1.000000 |
| ExtraTreesClassifier | 1.000000 | 1.000000 | 1.000000 |
| GradientBoostingClassifier | 0.936508 | 0.600000 | 0.674314 |
| KNeighborsClassifier | 0.724537 | 0.674292 | 0.696110 |
| LinearSVC | 0.924901 | 0.919826 | 0.920608 |
| LogisticRegression | 0.866234 | 0.702505 | 0.756657 |
| LogisticRegressionCV | 0.873585 | 0.819826 | 0.843531 |
| MLPClassifier | 1.000000 | 1.000000 | 1.000000 |
| NearestCentroid | 0.482186 | 0.450817 | 0.445678 |
| PassiveAggressiveClassifier | 0.930936 | 0.839542 | 0.879074 |
| Perceptron | 0.688576 | 0.700980 | 0.689108 |
| RandomForestClassifier | 1.000000 | 1.000000 | 1.000000 |
| RidgeClassifier | 0.924984 | 0.824728 | 0.865804 |
| SGDClassifier | 0.924901 | 0.919826 | 0.920608 |
| SVC | 0.933455 | 0.707407 | 0.771812 |
Table 8.
Weighted Metrics of Classification Models (“Restaurants”, TF-IDF representations).
Table 8.
Weighted Metrics of Classification Models (“Restaurants”, TF-IDF representations).
| Model | Precision (Weighted) | Recall (Weighted) | F1 (Weighted) |
|---|
| AdaBoostClassifier | 0.772796 | 0.729167 | 0.645017 |
| BaggingClassifier | 0.989734 | 0.989583 | 0.989473 |
| BernoulliNB | 0.834485 | 0.833333 | 0.810978 |
| CalibratedClassifierCV | 0.915634 | 0.916667 | 0.910002 |
| DecisionTreeClassifier | 1.000000 | 1.000000 | 1.000000 |
| DummyClassifier | 0.501736 | 0.708333 | 0.587398 |
| ExtraTreeClassifier | 1.000000 | 1.000000 | 1.000000 |
| ExtraTreesClassifier | 1.000000 | 1.000000 | 1.000000 |
| GradientBoostingClassifier | 0.865079 | 0.833333 | 0.806849 |
| KNeighborsClassifier | 0.803964 | 0.812500 | 0.806575 |
| LinearSVC | 0.950264 | 0.947917 | 0.948238 |
| LogisticRegression | 0.873782 | 0.875000 | 0.862497 |
| LogisticRegressionCV | 0.913046 | 0.916667 | 0.913535 |
| MLPClassifier | 1.000000 | 1.000000 | 1.000000 |
| NearestCentroid | 0.824674 | 0.562500 | 0.650863 |
| PassiveAggressiveClassifier | 0.928760 | 0.927083 | 0.924641 |
| Perceptron | 0.965389 | 0.947917 | 0.953627 |
| RandomForestClassifier | 1.000000 | 1.000000 | 1.000000 |
| RidgeClassifier | 0.926900 | 0.927083 | 0.923168 |
| SGDClassifier | 0.950264 | 0.947917 | 0.948238 |
| SVC | 0.895795 | 0.885417 | 0.871685 |
Table 9.
Macro Metrics of Classification Models (“MTSC”, TF-IDF representations).
Table 9.
Macro Metrics of Classification Models (“MTSC”, TF-IDF representations).
| Model | Precision (Macro) | Recall (Macro) | F1 (Macro) |
|---|
| AdaBoostClassifier | 0.536569 | 0.511031 | 0.511124 |
| BaggingClassifier | 0.546274 | 0.539847 | 0.542036 |
| BernoulliNB | 0.620338 | 0.609301 | 0.613077 |
| CalibratedClassifierCV | 0.598696 | 0.590106 | 0.591621 |
| DecisionTreeClassifier | 0.483979 | 0.483880 | 0.482779 |
| DummyClassifier | 0.124782 | 0.333333 | 0.181587 |
| ExtraTreeClassifier | 0.449816 | 0.446374 | 0.446124 |
| ExtraTreesClassifier | 0.610337 | 0.597893 | 0.601791 |
| GradientBoostingClassifier | 0.584919 | 0.547793 | 0.550139 |
| KNeighborsClassifier | 0.483402 | 0.473172 | 0.474578 |
| LinearSVC | 0.589215 | 0.584575 | 0.586015 |
| LogisticRegression | 0.605643 | 0.594484 | 0.597691 |
| LogisticRegressionCV | 0.609529 | 0.602939 | 0.605218 |
| MLPClassifier | 0.539425 | 0.537760 | 0.538246 |
| NearestCentroid | 0.480083 | 0.437883 | 0.416298 |
| PassiveAggressiveClassifier | 0.562594 | 0.558242 | 0.559689 |
| Perceptron | 0.569177 | 0.551341 | 0.554123 |
| RandomForestClassifier | 0.582065 | 0.564524 | 0.567516 |
| RidgeClassifier | 0.602595 | 0.597642 | 0.599191 |
| SGDClassifier | 0.599942 | 0.602576 | 0.600953 |
| SVC | 0.578846 | 0.562540 | 0.565638 |
Table 10.
Weighted Metrics of Classification Models (“MTSC”, TF-IDF representations).
Table 10.
Weighted Metrics of Classification Models (“MTSC”, TF-IDF representations).
| Model | Precision (Weighted) | Recall (Weighted) | F1 (Weighted) |
|---|
| AdaBoostClassifier | 0.544459 | 0.537522 | 0.527558 |
| BaggingClassifier | 0.556988 | 0.560209 | 0.557818 |
| BernoulliNB | 0.626705 | 0.629145 | 0.626609 |
| CalibratedClassifierCV | 0.610622 | 0.615183 | 0.610546 |
| DecisionTreeClassifier | 0.497215 | 0.496510 | 0.495555 |
| DummyClassifier | 0.140135 | 0.374346 | 0.203929 |
| ExtraTreeClassifier | 0.463308 | 0.465969 | 0.462460 |
| ExtraTreesClassifier | 0.617598 | 0.620419 | 0.617156 |
| GradientBoostingClassifier | 0.586393 | 0.586387 | 0.573521 |
| KNeighborsClassifier | 0.494559 | 0.500000 | 0.494082 |
| LinearSVC | 0.602032 | 0.605585 | 0.603095 |
| LogisticRegression | 0.614704 | 0.618674 | 0.614889 |
| LogisticRegressionCV | 0.621267 | 0.624782 | 0.622249 |
| MLPClassifier | 0.554007 | 0.556719 | 0.555062 |
| NearestCentroid | 0.500953 | 0.457243 | 0.430506 |
| PassiveAggressiveClassifier | 0.575761 | 0.579407 | 0.577021 |
| Perceptron | 0.578566 | 0.583770 | 0.576333 |
| RandomForestClassifier | 0.590895 | 0.595986 | 0.588793 |
| RidgeClassifier | 0.615804 | 0.619546 | 0.616933 |
| SGDClassifier | 0.617770 | 0.615183 | 0.616206 |
| SVC | 0.587705 | 0.592496 | 0.586000 |
Table 11.
Macro Metrics of Classification Models (“Laptops”, BERT representations).
Table 11.
Macro Metrics of Classification Models (“Laptops”, BERT representations).
| Model | Precision (Macro) | Recall (Macro) | F1 (Macro) |
|---|
| AdaBoostClassifier | 0.811111 | 0.597701 | 0.628514 |
| BaggingClassifier | 0.750000 | 0.734375 | 0.741935 |
| BernoulliNB | 0.579808 | 0.550647 | 0.563304 |
| CalibratedClassifierCV | 0.956944 | 0.884339 | 0.914598 |
| DecisionTreeClassifier | 0.741667 | 0.718750 | 0.729096 |
| DummyClassifier | 0.197279 | 0.333333 | 0.247863 |
| ExtraTreeClassifier | 0.750000 | 0.734375 | 0.741935 |
| ExtraTreesClassifier | 0.750000 | 0.734375 | 0.741935 |
| GradientBoostingClassifier | 0.741667 | 0.671875 | 0.701984 |
| KNeighborsClassifier | 0.707283 | 0.713362 | 0.709995 |
| LinearSVC | 0.967672 | 0.967672 | 0.967672 |
| LogisticRegression | 0.915535 | 0.738506 | 0.794381 |
| LogisticRegressionCV | 0.866071 | 0.778017 | 0.814312 |
| MLPClassifier | 0.988889 | 0.979167 | 0.983598 |
| NearestCentroid | 0.443548 | 0.394397 | 0.414286 |
| PassiveAggressiveClassifier | 0.752381 | 0.729167 | 0.686800 |
| Perceptron | 0.703680 | 0.808190 | 0.705096 |
| RandomForestClassifier | 0.750000 | 0.734375 | 0.741935 |
| RidgeClassifier | 0.915323 | 0.768678 | 0.813889 |
| SGDClassifier | 0.700893 | 0.692888 | 0.696820 |
| SVC | 0.840404 | 0.611351 | 0.649462 |
Table 12.
Weighted Metrics of Classification Models (“Laptops”, BERT representations).
Table 12.
Weighted Metrics of Classification Models (“Laptops”, BERT representations).
| Model | Precision (Weighted) | Recall (Weighted) | F1 (Weighted) |
|---|
| AdaBoostClassifier | 0.753061 | 0.734694 | 0.724577 |
| BaggingClassifier | 1.000000 | 0.979592 | 0.989467 |
| BernoulliNB | 0.785871 | 0.755102 | 0.767912 |
| CalibratedClassifierCV | 0.940136 | 0.938776 | 0.937837 |
| DecisionTreeClassifier | 0.980272 | 0.959184 | 0.968200 |
| DummyClassifier | 0.350271 | 0.591837 | 0.440084 |
| ExtraTreeClassifier | 1.000000 | 0.979592 | 0.989467 |
| ExtraTreesClassifier | 1.000000 | 0.979592 | 0.989467 |
| GradientBoostingClassifier | 0.980272 | 0.959184 | 0.967774 |
| KNeighborsClassifier | 0.797805 | 0.795918 | 0.796472 |
| LinearSVC | 0.959184 | 0.959184 | 0.959184 |
| LogisticRegression | 0.870440 | 0.857143 | 0.850731 |
| LogisticRegressionCV | 0.819060 | 0.816327 | 0.813943 |
| MLPClassifier | 0.980272 | 0.979592 | 0.979436 |
| NearestCentroid | 0.703094 | 0.673469 | 0.683382 |
| PassiveAggressiveClassifier | 0.851895 | 0.795918 | 0.779637 |
| Perceptron | 0.828240 | 0.775510 | 0.783489 |
| RandomForestClassifier | 1.000000 | 0.979592 | 0.989467 |
| RidgeClassifier | 0.882818 | 0.877551 | 0.872789 |
| SGDClassifier | 0.916910 | 0.897959 | 0.907268 |
| SVC | 0.787384 | 0.775510 | 0.760764 |
Table 13.
Macro Metrics of Classification Models (“Restaurants”, BERT representations).
Table 13.
Macro Metrics of Classification Models (“Restaurants”, BERT representations).
| Model | Precision (Macro) | Recall (Macro) | F1 (Macro) |
|---|
| AdaBoostClassifier | 0.537594 | 0.456618 | 0.486397 |
| BaggingClassifier | 1.000000 | 1.000000 | 1.000000 |
| BernoulliNB | 0.512220 | 0.512418 | 0.508235 |
| CalibratedClassifierCV | 0.909456 | 0.585185 | 0.641217 |
| DecisionTreeClassifier | 1.000000 | 1.000000 | 1.000000 |
| DummyClassifier | 0.236111 | 0.333333 | 0.276423 |
| ExtraTreeClassifier | 1.000000 | 1.000000 | 1.000000 |
| ExtraTreesClassifier | 1.000000 | 1.000000 | 1.000000 |
| GradientBoostingClassifier | 0.968889 | 0.811111 | 0.870047 |
| KNeighborsClassifier | 0.718704 | 0.645861 | 0.674860 |
| LinearSVC | 0.926190 | 0.640741 | 0.688251 |
| LogisticRegression | 0.891105 | 0.598802 | 0.647447 |
| LogisticRegressionCV | 0.903175 | 0.566667 | 0.623642 |
| MLPClassifier | 0.923077 | 0.985294 | 0.949003 |
| NearestCentroid | 0.512138 | 0.395915 | 0.425557 |
| PassiveAggressiveClassifier | 0.879584 | 0.511111 | 0.563584 |
| Perceptron | 0.727431 | 0.720153 | 0.716450 |
| RandomForestClassifier | 1.000000 | 1.000000 | 1.000000 |
| RidgeClassifier | 0.918724 | 0.637037 | 0.702541 |
| SGDClassifier | 0.780556 | 0.529630 | 0.578348 |
| SVC | 0.900000 | 0.533333 | 0.571188 |
Table 14.
Weighted Metrics of Classification Models (“Restaurants”, BERT representations).
Table 14.
Weighted Metrics of Classification Models (“Restaurants”, BERT representations).
| Model | Precision (Weighted) | Recall (Weighted) | F1 (Weighted) |
|---|
| AdaBoostClassifier | 0.787320 | 0.791667 | 0.781311 |
| BaggingClassifier | 1.000000 | 1.000000 | 1.000000 |
| BernoulliNB | 0.778746 | 0.739583 | 0.756588 |
| CalibratedClassifierCV | 0.854942 | 0.833333 | 0.802002 |
| DecisionTreeClassifier | 1.000000 | 1.000000 | 1.000000 |
| DummyClassifier | 0.501736 | 0.708333 | 0.587398 |
| ExtraTreeClassifier | 1.000000 | 1.000000 | 1.000000 |
| ExtraTreesClassifier | 1.000000 | 1.000000 | 1.000000 |
| GradientBoostingClassifier | 0.933889 | 0.927083 | 0.922239 |
| KNeighborsClassifier | 0.800064 | 0.812500 | 0.802541 |
| LinearSVC | 0.880357 | 0.864583 | 0.837967 |
| LogisticRegression | 0.848726 | 0.833333 | 0.804811 |
| LogisticRegressionCV | 0.846329 | 0.822917 | 0.789030 |
| MLPClassifier | 0.975962 | 0.968750 | 0.970436 |
| NearestCentroid | 0.800187 | 0.614583 | 0.682193 |
| PassiveAggressiveClassifier | 0.818521 | 0.791667 | 0.746228 |
| Perceptron | 0.810547 | 0.791667 | 0.797258 |
| RandomForestClassifier | 1.000000 | 1.000000 | 1.000000 |
| RidgeClassifier | 0.870692 | 0.854167 | 0.832109 |
| SGDClassifier | 0.800174 | 0.802083 | 0.762642 |
| SVC | 0.839583 | 0.812500 | 0.769105 |
Table 15.
Macro Metrics of Classification Models (“MTSC”, BERT representations).
Table 15.
Macro Metrics of Classification Models (“MTSC”, BERT representations).
| Model | Precision (Macro) | Recall (Macro) | F1 (Macro) |
|---|
| AdaBoostClassifier | 0.617579 | 0.607600 | 0.611387 |
| BaggingClassifier | 0.583002 | 0.570900 | 0.574723 |
| BernoulliNB | 0.594007 | 0.599098 | 0.594284 |
| CalibratedClassifierCV | 0.717618 | 0.697904 | 0.704669 |
| DecisionTreeClassifier | 0.502683 | 0.506414 | 0.503590 |
| DummyClassifier | 0.124782 | 0.333333 | 0.181587 |
| ExtraTreeClassifier | 0.420560 | 0.422548 | 0.420626 |
| ExtraTreesClassifier | 0.652450 | 0.637024 | 0.641867 |
| GradientBoostingClassifier | 0.674504 | 0.659606 | 0.664726 |
| KNeighborsClassifier | 0.575093 | 0.552326 | 0.554446 |
| LinearSVC | 0.706773 | 0.694961 | 0.699503 |
| LogisticRegression | 0.719955 | 0.700226 | 0.707067 |
| LogisticRegressionCV | 0.726826 | 0.700067 | 0.708159 |
| MLPClassifier | 0.692743 | 0.686242 | 0.688107 |
| NearestCentroid | 0.574224 | 0.574224 | 0.574224 |
| PassiveAggressiveClassifier | 0.657355 | 0.629713 | 0.582214 |
| Perceptron | 0.630884 | 0.547369 | 0.446289 |
| RandomForestClassifier | 0.670888 | 0.659953 | 0.663928 |
| RidgeClassifier | 0.710743 | 0.692509 | 0.698889 |
| SGDClassifier | 0.687735 | 0.672053 | 0.659408 |
| SVC | 0.720193 | 0.690442 | 0.698967 |
Table 16.
Weighted Metrics of Classification Models (“MTSC”, BERT representations).
Table 16.
Weighted Metrics of Classification Models (“MTSC”, BERT representations).
| Model | Precision (Weighted) | Recall (Weighted) | F1 (Weighted) |
|---|
| AdaBoostClassifier | 0.619690 | 0.620419 | 0.619124 |
| BaggingClassifier | 0.587681 | 0.589878 | 0.587083 |
| BernoulliNB | 0.607692 | 0.602094 | 0.602517 |
| CalibratedClassifierCV | 0.718311 | 0.718150 | 0.715857 |
| DecisionTreeClassifier | 0.518598 | 0.513089 | 0.515090 |
| DummyClassifier | 0.140135 | 0.374346 | 0.203929 |
| ExtraTreeClassifier | 0.437334 | 0.431065 | 0.433455 |
| ExtraTreesClassifier | 0.654367 | 0.655323 | 0.652600 |
| GradientBoostingClassifier | 0.678232 | 0.679756 | 0.677239 |
| KNeighborsClassifier | 0.578520 | 0.575916 | 0.568944 |
| LinearSVC | 0.710757 | 0.710297 | 0.709302 |
| LogisticRegression | 0.720905 | 0.719895 | 0.717951 |
| LogisticRegressionCV | 0.726504 | 0.724258 | 0.721086 |
| MLPClassifier | 0.696425 | 0.696335 | 0.694988 |
| NearestCentroid | 0.579407 | 0.579407 | 0.579407 |
| PassiveAggressiveClassifier | 0.674502 | 0.608202 | 0.570665 |
| Perceptron | 0.648515 | 0.521815 | 0.417314 |
| RandomForestClassifier | 0.676899 | 0.678883 | 0.676761 |
| RidgeClassifier | 0.712000 | 0.712042 | 0.709899 |
| SGDClassifier | 0.698238 | 0.672775 | 0.661620 |
| SVC | 0.717385 | 0.715532 | 0.711701 |
Table 17.
Classification report for fine-tuned BERT (“Laptops”).
Table 17.
Classification report for fine-tuned BERT (“Laptops”).
| Model | Precision | Recall | F1-Score | Support |
|---|
| negative | 0.97 | 0.97 | 0.97 | 29 |
| neutral | 1.00 | 0.88 | 0.93 | 16 |
| positive | 0.67 | 1.00 | 0.80 | 4 |
| conflict | 0.00 | 0.00 | 0.00 | 0 |
| Accuracy | - | - | 0.94 | 49 |
| Weighted Avg | 0.88 | 0.95 | 0.90 | 49 |
| Macro Avg | 0.95 | 0.94 | 0.94 | 49 |
Table 18.
Classification report for fine-tuned BERT (“Restaurants”).
Table 18.
Classification report for fine-tuned BERT (“Restaurants”).
| Model | Precision | Recall | F1-Score | Support |
|---|
| negative | 0.89 | 0.99 | 0.94 | 68 |
| neutral | 1.00 | 0.50 | 0.67 | 18 |
| positive | 0.64 | 0.70 | 0.67 | 10 |
| conflict | 0.00 | 0.00 | 0.00 | 0 |
| Accuracy | - | - | 0.86 | 96 |
| Weighted Avg | 0.63 | 0.55 | 0.57 | 96 |
| Macro Avg | 0.89 | 0.86 | 0.86 | 96 |
Table 19.
Classification report for fine-tuned BERT (“MTSC”).
Table 19.
Classification report for fine-tuned BERT (“MTSC”).
| Model | Precision | Recall | F1-Score | Support |
|---|
| negative | 0.57 | 0.79 | 0.66 | 262 |
| neutral | 0.93 | 0.68 | 0.79 | 429 |
| positive | 0.72 | 0.75 | 0.73 | 455 |
| Accuracy | - | - | 0.73 | 1146 |
| Weighted Avg | 0.74 | 0.74 | 0.73 | 1146 |
| Macro Avg | 0.77 | 0.73 | 0.74 | 1146 |
Table 20.
Classification Report for Majority Vote (“Laptops”, TF-IDF representations, all models).
Table 20.
Classification Report for Majority Vote (“Laptops”, TF-IDF representations, all models).
| Model | Precision | Recall | F1-Score | Support |
|---|
| conflict | 0.00 | 0.00 | 0.00 | 0 |
| negative | 1.00 | 0.88 | 0.93 | 16 |
| neutral | 1.00 | 1.00 | 1.00 | 4 |
| positive | 0.97 | 1.00 | 0.98 | 29 |
| Accuracy | - | - | 0.96 | 49 |
| Weighted Avg | 0.98 | 0.96 | 0.97 | 49 |
| Macro Avg | 0.74 | 0.72 | 0.73 | 49 |
Table 21.
Top five models with respect to accuracy (“Laptops”, TF-IDF representations).
Table 21.
Top five models with respect to accuracy (“Laptops”, TF-IDF representations).
| Model | Accuracy |
|---|
| DecisionTreeClassifier | 0.9796 |
| ExtraTreeClassifier | 0.9796 |
| ExtraTreesClassifier | 0.9796 |
| MLPClassifier | 0.9796 |
| PassiveAggressiveClassifier | 0.9796 |
Table 22.
Classification report for majority vote (“Laptops”, TF-IDF representations, top five models).
Table 22.
Classification report for majority vote (“Laptops”, TF-IDF representations, top five models).
| Model | Precision | Recall | F1-Score | Support |
|---|
| conflict | 0.00 | 0.00 | 0.00 | 0 |
| negative | 1.00 | 0.94 | 0.97 | 16 |
| neutral | 1.00 | 1.00 | 1.00 | 4 |
| positive | 1.00 | 1.00 | 1.00 | 29 |
| Accuracy | - | - | 0.98 | 49 |
| Weighted Avg | 1.00 | 0.98 | 0.99 | 49 |
| Macro Avg | 0.75 | 0.73 | 0.74 | 49 |
Table 23.
Classification Report for Majority Vote (“Restaurants”, TF-IDF representations, all models).
Table 23.
Classification Report for Majority Vote (“Restaurants”, TF-IDF representations, all models).
| Model | Precision | Recall | F1-Score | Support |
|---|
| negative | 1.00 | 0.89 | 0.94 | 18 |
| neutral | 1.00 | 0.90 | 0.95 | 10 |
| positive | 0.96 | 1.00 | 0.98 | 68 |
| Accuracy | - | - | 0.97 | 96 |
| Weighted Avg | 0.97 | 0.97 | 0.97 | 96 |
| Macro Avg | 0.99 | 0.93 | 0.96 | 96 |
Table 24.
Top five models with respect to accuracy (“Restaurants”, TF-IDF representations).
Table 24.
Top five models with respect to accuracy (“Restaurants”, TF-IDF representations).
| Model | Accuracy |
|---|
| DecisionTreeClassifier | 1.0000 |
| ExtraTreeClassifier | 1.0000 |
| ExtraTreesClassifier | 1.0000 |
| MLPClassifier | 1.0000 |
| RandomForestClassifier | 1.0000 |
Table 25.
Classification report for majority vote (“Restaurants”, TF-IDF representations, top 5 models).
Table 25.
Classification report for majority vote (“Restaurants”, TF-IDF representations, top 5 models).
| Model | Precision | Recall | F1-Score | Support |
|---|
| negative | 1.00 | 1.00 | 1.00 | 18 |
| neutral | 1.00 | 1.00 | 1.00 | 10 |
| positive | 1.00 | 1.00 | 1.00 | 68 |
| Accuracy | - | - | 1.00 | 96 |
| Weighted Avg | 1.00 | 1.00 | 1.00 | 96 |
| Macro Avg | 1.00 | 1.00 | 1.00 | 96 |
Table 26.
Classification Report for Majority Vote (“MTSC”, TF-IDF representations, all models).
Table 26.
Classification Report for Majority Vote (“MTSC”, TF-IDF representations, all models).
| Model | Precision | Recall | F1-Score | Support |
|---|
| negative | 0.64 | 0.67 | 0.66 | 429 |
| neutral | 0.62 | 0.69 | 0.65 | 455 |
| positive | 0.59 | 0.43 | 0.50 | 262 |
| Accuracy | - | - | 0.62 | 1146 |
| Weighted Avg | 0.62 | 0.62 | 0.62 | 1146 |
| Macro Avg | 0.62 | 0.60 | 0.60 | 1146 |
Table 27.
Top five models with respect to accuracy (“MTSC”, TF-IDF representations).
Table 27.
Top five models with respect to accuracy (“MTSC”, TF-IDF representations).
| Model | Accuracy |
|---|
| BernoulliNB | 0.6291 |
| LogisticRegressionCV | 0.6248 |
| ExtraTreesClassifier | 0.6204 |
| RidgeClassifier | 0.6195 |
| LogisticRegression | 0.6187 |
Table 28.
Classification Report for Majority Vote (“MTSC”, TF-IDF representations, top 5 models).
Table 28.
Classification Report for Majority Vote (“MTSC”, TF-IDF representations, top 5 models).
| Model | Precision | Recall | F1-Score | Support |
|---|
| negative | 0.65 | 0.70 | 0.67 | 429 |
| neutral | 0.64 | 0.66 | 0.65 | 455 |
| positive | 0.56 | 0.45 | 0.50 | 262 |
| Accuracy | - | - | 0.63 | 1146 |
| Weighted Avg | 0.62 | 0.63 | 0.62 | 1146 |
| Macro Avg | 0.61 | 0.60 | 0.61 | 1146 |
Table 29.
Classification Report for Majority Vote (“Laptops”, BERT representations, all models).
Table 29.
Classification Report for Majority Vote (“Laptops”, BERT representations, all models).
| Model | Precision | Recall | F1-Score | Support |
|---|
| conflict | 0.00 | 0.00 | 0.00 | 0 |
| negative | 1.00 | 0.81 | 0.90 | 16 |
| neutral | 1.00 | 0.75 | 0.86 | 4 |
| positive | 0.91 | 1.00 | 0.95 | 29 |
| Accuracy | - | - | 0.92 | 49 |
| Weighted Avg | 0.94 | 0.92 | 0.93 | 49 |
| Macro Avg | 0.73 | 0.64 | 0.68 | 49 |
Table 30.
Top five models with respect to accuracy (“Laptops”, BERT representations).
Table 30.
Top five models with respect to accuracy (“Laptops”, BERT representations).
| Model | Accuracy |
|---|
| ExtraTreesClassifier | 0.9796 |
| RandomForestClassifier | 0.9796 |
| DecisionTreeClassifier | 0.9592 |
| ExtraTreeClassifier | 0.9592 |
| GradientBoostingClassifier | 0.9592 |
Table 31.
Classification Report for Majority Vote (“Laptops”, BERT representations, top five models).
Table 31.
Classification Report for Majority Vote (“Laptops”, BERT representations, top five models).
| Model | Precision | Recall | F1-Score | Support |
|---|
| conflict | 0.00 | 0.00 | 0.00 | 0 |
| negative | 1.00 | 0.94 | 0.97 | 16 |
| neutral | 1.00 | 1.00 | 1.00 | 4 |
| positive | 1.00 | 1.00 | 1.00 | 29 |
| Accuracy | - | - | 0.98 | 49 |
| Weighted Avg | 1.00 | 0.98 | 0.99 | 49 |
| Macro Avg | 0.75 | 0.73 | 0.74 | 49 |
Table 32.
Classification Report for Majority Vote (“Restaurants”, BERT representations, all models).
Table 32.
Classification Report for Majority Vote (“Restaurants”, BERT representations, all models).
| Model | Precision | Recall | F1-Score | Support |
|---|
| negative | 0.92 | 0.61 | 0.73 | 18 |
| neutral | 1.00 | 0.30 | 0.46 | 10 |
| positive | 0.84 | 1.00 | 0.91 | 68 |
| Accuracy | - | - | 0.85 | 96 |
| Weighted Avg | 0.87 | 0.85 | 0.83 | 96 |
| Macro Avg | 0.92 | 0.64 | 0.70 | 96 |
Table 33.
Top five models with respect to accuracy (“Restaurants”, BERT representations).
Table 33.
Top five models with respect to accuracy (“Restaurants”, BERT representations).
| Model | Accuracy |
|---|
| BaggingClassifier | 1.0000 |
| DecisionTreeClassifier | 1.0000 |
| ExtraTreeClassifier | 1.0000 |
| ExtraTreesClassifier | 1.0000 |
| RandomForestClassifier | 1.0000 |
Table 34.
Classification Report for Majority Vote (“Restaurants”, BERT representations, top five models).
Table 34.
Classification Report for Majority Vote (“Restaurants”, BERT representations, top five models).
| Model | Precision | Recall | F1-Score | Support |
|---|
| negative | 1.00 | 1.00 | 1.00 | 18 |
| neutral | 1.00 | 1.00 | 1.00 | 10 |
| positive | 1.00 | 1.00 | 1.00 | 68 |
| Accuracy | - | - | 1.00 | 96 |
| Weighted Avg | 1.00 | 1.00 | 1.00 | 96 |
| Macro Avg | 1.00 | 1.00 | 1.00 | 96 |
Table 35.
Classification Report for Majority Vote (“MTSC”, BERT representations, all models).
Table 35.
Classification Report for Majority Vote (“MTSC”, BERT representations, all models).
| Model | Precision | Recall | F1-Score | Support |
|---|
| negative | 0.71 | 0.84 | 0.77 | 429 |
| neutral | 0.75 | 0.70 | 0.73 | 455 |
| positive | 0.71 | 0.58 | 0.64 | 262 |
| Accuracy | - | - | 0.73 | 1146 |
| Weighted Avg | 0.73 | 0.73 | 0.72 | 1146 |
| Macro Avg | 0.72 | 0.71 | 0.71 | 1146 |
Table 36.
Top five models with respect to accuracy (“MTSC”, BERT representations).
Table 36.
Top five models with respect to accuracy (“MTSC”, BERT representations).
| Model | Accuracy |
|---|
| LogisticRegressionCV | 0.7243 |
| LogisticRegression | 0.7199 |
| CalibratedClassifierCV | 0.7182 |
| SVC | 0.7155 |
| RidgeClassifier | 0.7120 |
Table 37.
Classification Report for Majority Vote (“MTSC”, BERT representations, top five models).
Table 37.
Classification Report for Majority Vote (“MTSC”, BERT representations, top five models).
| Model | Precision | Recall | F1-Score | Support |
|---|
| negative | 0.76 | 0.77 | 0.76 | 429 |
| neutral | 0.70 | 0.79 | 0.75 | 455 |
| positive | 0.73 | 0.57 | 0.64 | 262 |
| Accuracy | - | - | 0.73 | 1146 |
| Weighted Avg | 0.73 | 0.73 | 0.73 | 1146 |
| Macro Avg | 0.73 | 0.71 | 0.72 | 1146 |
Table 38.
Selected sentences from the “MTSC” data set that were wrongly classified by the majority vote, with ChatGPT predicted polarities. The wrong predictions are in bold.
Table 38.
Selected sentences from the “MTSC” data set that were wrongly classified by the majority vote, with ChatGPT predicted polarities. The wrong predictions are in bold.
| Sentence | Aspect | True Polarity | ChatGPT Polarity |
|---|
| In an atmosphere where some delegates remain anti-Trump and party leaders like Paul Ryan are barely mentioning Trump in their speeches, Hillary Clinton is a unifying force. | Hillary Clinton | positive | positive |
| A new presidential cabinet will be formed as well as a national reconciliation committee, which will include youth movements that have been behind anti-Morsi demonstrations. | Morsi | negative | negative |
| His persona is generally adult. | His | positive | neutral |
| The more left wing candidate for deputy leader—Julie Morgan, widow of former first minister of Wales, Rhodri—was defeated by Carolyn Harris at the party’s spring conference. | Carolyn Harris | positive | positive |
| In a statement Saturday, London Moore, the president of the Theta Gamma chapter of Delta Delta Delta, condemned the “racist, offensive and disgraceful” behavior seen in the video. | London Moore, the president of the Theta Gamma chapter of Delta Delta Delta | positive | positive |
| President Muhammadu Buhari was poised to win a second term despite falling short on promises to recharge the economy and defeat the Boko Haram insurgents. | President Muhammadu Buhari | negative | neutral |


