Article

Modeling of Junior Servers Approaching a Senior Server in the Retrial Queuing-Inventory System

by
Kathirvel Jeganathan
1,
Thanushkodi Harikrishnan
2,
Kumarasankaralingam Lakshmanan
3,
Agassi Melikov
4 and
Janos Sztrik
5,*
1
Ramanujan Institute for Advanced Study in Mathematics, University of Madras, Chennai 600005, India
2
Guru Nanak College (Autonomous), University of Madras, Chennai 600042, India
3
Department of Mathematics, St. Joseph University, Chümoukedima 797115, India
4
Institute of Control Systems, National Academy of Science, Baku, AZ 1141, Azerbaijan
5
Department of Informatics and Networks, Faculty of Informatics, University of Debrecen, 4032 Debrecen, Hungary
*
Author to whom correspondence should be addressed.
Mathematics 2023, 11(22), 4581; https://doi.org/10.3390/math11224581
Submission received: 17 October 2023 / Revised: 3 November 2023 / Accepted: 6 November 2023 / Published: 8 November 2023
(This article belongs to the Special Issue Advances in Queueing Theory, 2nd Edition)

Abstract

:
This article deals with the queuing-inventory system, composed of c junior servers, a senior server, two finite waiting halls, and an infinite orbit. On occasion, junior servers encounter challenges during customer service. In these instances, they approach the senior server for guidance in resolving the issue. Suppose the senior server is engaged with another junior server. The approaching junior servers await their turn in a finite waiting area with a capacity of c for consultation. Concerning this, we study the performance of junior servers approaching the senior server in the retrial queuing-inventory model with the two finite waiting halls dedicated to the primary customers and the junior servers for consultation. We formulate a level-dependent QBD process and solve its steady-state probability vector using Neuts and Rao’s truncation method. The stability condition of the system is derived and the R matrix is computed. The optimum total cost has been obtained, and the sensitivity analyses, which include the expected total cost, the waiting time of customers in the waiting hall and orbit, the number of busy servers, and a fraction of the successful retrial rate of the model, are computed numerically.

1. Introduction

Over the past two decades, researchers have dedicated significant efforts to developing a range of queuing-inventory models. In this paper, we introduce a distinctive queuing-inventory model characterized by a novel feature: Junior servers can seek guidance from senior servers when facing challenges in customer service. This interactive dynamic injects a fresh perspective into the conventional server–customer relationship. Within this innovative system, junior servers, though proficient in their roles, have the option to consult senior servers when encountering complexities in customer interactions. This collaborative approach, akin to seeking mentorship from a seasoned expert, enhances the efficiency and problem-solving capabilities of the queuing-inventory framework. This research aims to thoroughly investigate this intriguing model, scrutinizing its performance and the intricate interplay between junior and senior servers. Ultimately, it offers invaluable insights into the dynamics of this specialized queuing-inventory system.

1.1. Motivation

The considered queuing-inventory model was developed based on the real-life experience of one of the authors. When the author went to purchase an android from the local multi-brand mobile showroom located in Chennai, junior sales executives received him. While the junior executive explained the features of the mobile, the author asked a query regarding the credit card offer. Unfortunately, the junior executive could not address the issue. So, the junior executive sought help from a senior executive. Then, both junior and senior executives together addressed the author’s query. The incident happened in the author’s life and motivated him to develop the retrial queuing-inventory model where less experienced junior servers assist customers by approaching the experienced senior server.

1.2. Literature Review

Positive service time was originally introduced by Melikov and Molchanov [1] as well as Sigman and Simchi-Levi [2] within the context of inventory modeling. They considered a facility that utilizes inventory to cater to customers, with the service time being distributed arbitrarily. Yadavalli et al. [3] conducted an analysis on a perishable inventory model employing continuous review and a multi-server service configuration with MAP. Additionally, they took into account a separate group of negative customers following an independent MAP. In this setup, a negative customer displaces one of the existing customers in the queue. Under the ( s , S ) ordering policy, Yadavalli et al. [4] examined a multi-server service facility with the inventory system in the finite population in which any arriving customer who finds that all the servers are busy are then sent to the orbit. Nair et al. [5] studied the behavior of a two-dimensional multi-server queuing-inventory system (QIS) with the ( s , S ) ordering policy. When there are at least s + 1 customers in the system, they guarantee a minimal service with rate ( s + 1 ) μ . Krishnamoorthy et al. [6] assumed that the customer may receive an item at the end of the service under Bernoulli’s schedule in the QIS with a multi-server facility. For the original two unbounded level challenges, Wang [7] proposed two modeling approximations. They applied enumerative and quasi-Newton search methods in a heuristic manner to fine-tune the quantity of the stock, servers, reorder thresholds, and both the service and retrial facility. Wang et al. [8] studied a priority-type multi-server inventory model with an identical service time distribution. For the case of non-identical service rates, generalized stochastic Petri net (GSPN) models have been used. When service rates are the same, they demonstrate how the two approaches are equivalent.
Hanukov et al. [9] analyzed an inventory model denoted as M / M / 2 , where customer interest is piqued by observing the quantity of available stocks. Jeganathan et al. [10] conducted a comparative study on a Markovian inventory model employing dual servers, examining both homogeneous and heterogeneous server configurations. Their numerical results underscored the superior efficiency of the heterogeneous system. Suganya and Sivakumar [11] delved into QIS featuring retrials, incorporating two distinct servers and incorporating vacation periods. In this scenario, customers arrive following a MAP, and the two concurrent servers offer services in different phases. Jose and Beena [12] investigated a production inventory system employing two servers of differing capabilities, considering retrial customers and allowing for server vacations. One server had the flexibility for multiple breaks, while the other operated continuously without any time off. The assumption was made that either when the inventory’s stock level reaches zero or when both conditions are met, the servers would go on vacation. Chakravarthy and Rumyantsev [13] explored batch demands within two distinct models. Both models assumed that the demands followed a Markovian point process. In the first model, if a customer arrived and found the inventory level at zero, the customer would be lost. In the second model, any waiting customers would be lost when the inventory reached zero. Jeganathan and Reiyas [14] analyzed delayed and modified working vacations in the QIS with two distinct servers in which the first server is capable of executing a modified working vacation and the second server can engage in a delayed working vacation.
Chakravarthy et al. [15] investigated a QIS with infinite servers and a queue with a size of infinite. They assumed the self-service facility under exponential distribution and MAP for customer arrival in the system. Hanukov et al. [16] studied the preparatory service in order to decrease the waiting time of customers during the idle time in a multi-server QIS with stock-dependent arrival. Jeganathan et al. [17] considered two groups of multi-servers in such a way that each group of servers is designed to operate for two types of customers. The first type of customers can purchase the commodity whereas the second type can receive the service only. Rasmi et al. [18] addressed a multi-server queuing-inventory system featuring diverse customer types (K in total) arriving in accordance with a marked Markovian arrival process. Each customer class seeks a distinct type of service and distinct priorities are allocated to each class. Rasmi and Jacob [19] explored a Markovian QIS with c servers and a self-service feature is optionally available. Service for the customers is initiated whenever an item and a server is available. In the event that a customer arrives to find all servers occupied but free inventory is still accessible, they have the choice to either wait in line for a server or opt for self-service. In the multi-server production inventory system, when the on-hand inventory level drops to zero, an immediate replenishment of one item is initiated as an emergency measure to meet customer demands, with no lead time considered by Shajin et al. [20]. Jeganathan et al. [21] studied a queuing-inventory model offering sales of fresh and refurbished items and services alone to the customers managed by the dedicated servers.
Almaqbali et al. [22] analyzed a batch arrival and service pattern for the customers. If there are j customers in a batch, it is called category j and j = 1 , 2 , , k . A customer in category j can receive service only when j items are in stock. Aghsami et al. [23] proposed a multi-server queuing-inventory model based on the hospital blood bank, considering the request for blood as arrival and blood as inventory. Selvakumar et al. [24] analyzed the home delivery service facility in the QIS considering two distinct servers. The first server was always available in the system in order to maintain the sales of items, and the second server was used for the delivery process of purchased items who is offered the vacation facility. Yue et al. [25] conducted a study on a multi-server QIS with a vacation policy. In this setup, a subset of servers take a collective vacation once the on-hand inventory is exhausted. After each vacation period, if there is still inventory available, these servers return to the system to resume serving customers.
The retrial QIS finds extensive applications across various domains, including supply chain and manufacturing systems. Artalejo et al. [26] pioneered the incorporation of the retry strategy of customers into stochastic inventory systems, examining numerical solutions and optimal decision making. Building upon this work, Ushakumari [27] investigated a QIS with retrials and random lead time, deriving the optimal ordering point. Amirthakodi and Sivakumar [28] examined a QIS with a finite queue and assumed that unsatisfied customers could potentially enter an orbit, where they could attempt service directly if the server is available. The authors investigated the distribution of waiting times for both the queue and retrial queues. Lopez-Herrero and Jesus [29] focused on assessing waiting durations, reorder intervals, and the duration of a pending request within a finite retrial group. Hanukov [30] proposed that customers have the option to move to the orbit during their service, making more efficient use of their time. Sugapriya et al. [31] examined the stock-dependent demand in a retrial QIS. Melikov et al. [32] assumed that in the event of a primary customer arriving when the inventory level is zero, this customer would, according to the Bernoulli scheme, either depart from the system or enter an unbounded buffer to reiterate their request at a later time.
Nithya et al. [33] introduced controlled arrivals in a retrial QIS with an essential interruption and an intermittently available server. Reiyas and Jeganathan [34] conducted a study on a standard retrial QIS that incorporates a two-component demand rate. Jain and Kumar [35] carried out an analysis of the optimization of costs in a QIS with two-level supply modes, retrial demands, and numerous vacations. To achieve this optimization, the researchers employed a genetic algorithm. Jeganatahan et al. [36] studied the classical retrial queuing model with scrap items where the server takes a vacation once the storage becomes full or there are no customers in the queue. Bazizi et al. [37] explored the optimization of an ( s , Q ) retrial inventory system with partial backlogging demands using a generalized stochastic Petri net approach. Very recently, Jeganathan et al. [38] studied the asynchronous vacation policy in the retrial QIS with the ( s , Q ) ordering policy.

1.3. Research Gap

The previously mentioned studies have explored various service configurations within the QIS. However, there is currently no published research in the queuing-inventory domain specifically addressing scenarios where junior servers consult the senior server on behalf of customers. Moreover, there is a scarcity of literature on queuing models involving junior servers approaching the senior server. Chakaravarthy [39] investigated a queuing model where the primary server (senior server) not only serves customers directly but also provides guidance to other servers (junior servers). Junior servers can seek advice only while actively assisting a customer, and the senior server addresses these requests in the order they are received. Priority is given to regular service over consultations, even if it requires interrupting their service to customers. Recently, Hanukov [40] examined a queuing model involving n multi-servers. Initially, a junior server handles the first phase, which may involve gathering information or providing an initial service. The junior server then collaborates with a senior server to complete the service together. However, if the senior server is already assisting another junior server, the latter must join a queue along with other servers awaiting the availability of the senior server. Very recently, Chakravarthy et al. [41] investigated a novel queuing model where the system attempts to recruit secondary servers from the pool of consumers who have already received services and expressed an interest in serving.
To fill this research gap, we present an innovative model featuring a team of c junior servers working alongside a senior server in the QIS, implementing the ( s , Q ) ordering policy. We conduct a thorough examination of its performance and distinctive attributes.

1.4. Novelty and Contribution of the Model

  • Innovative Service Configuration: This research introduces a unique stochastic retrial queuing-inventory system where junior servers provide service to the customers and receive consultation from the senior server as per the specific circumstances.
  • Analysis of the System: The paper contributes by utilizing the Neuts and Rao truncation method to solve the level-dependent QBD and Neuts matrix geometric method to establish the stability condition and calculate the stationary probability vector.
  • Comprehensive Performance Analysis: Through rigorous numerical analysis, the study delves into various critical aspects including the expected total cost, waiting time, and the workload of junior servers. This detailed investigation provides practical insights into the system’s operational efficiency under different modes of operation for junior servers.
Overall, this research advances the understanding of stochastic retrial QIS by proposing an innovative service approach, employing a specialized analytical method, and conducting a thorough performance assessment. It contributes significantly to both theoretical and practical domains within queuing-inventory modeling.
The subsequent sections of this paper are organized as follows: Section 2 outlines the specific assumptions underlying our proposed model. In Section 3, we provide the mathematical formulation and conduct an in-depth analysis of the model. Section 4 calculates the R matrix and the probability vector in a steady state. We establish a set of metrics to evaluate the system’s performance in Section 5. The model’s effectiveness is evaluated via numerical analysis in Section 6, and we conclude with a summarizing section in Section 7.

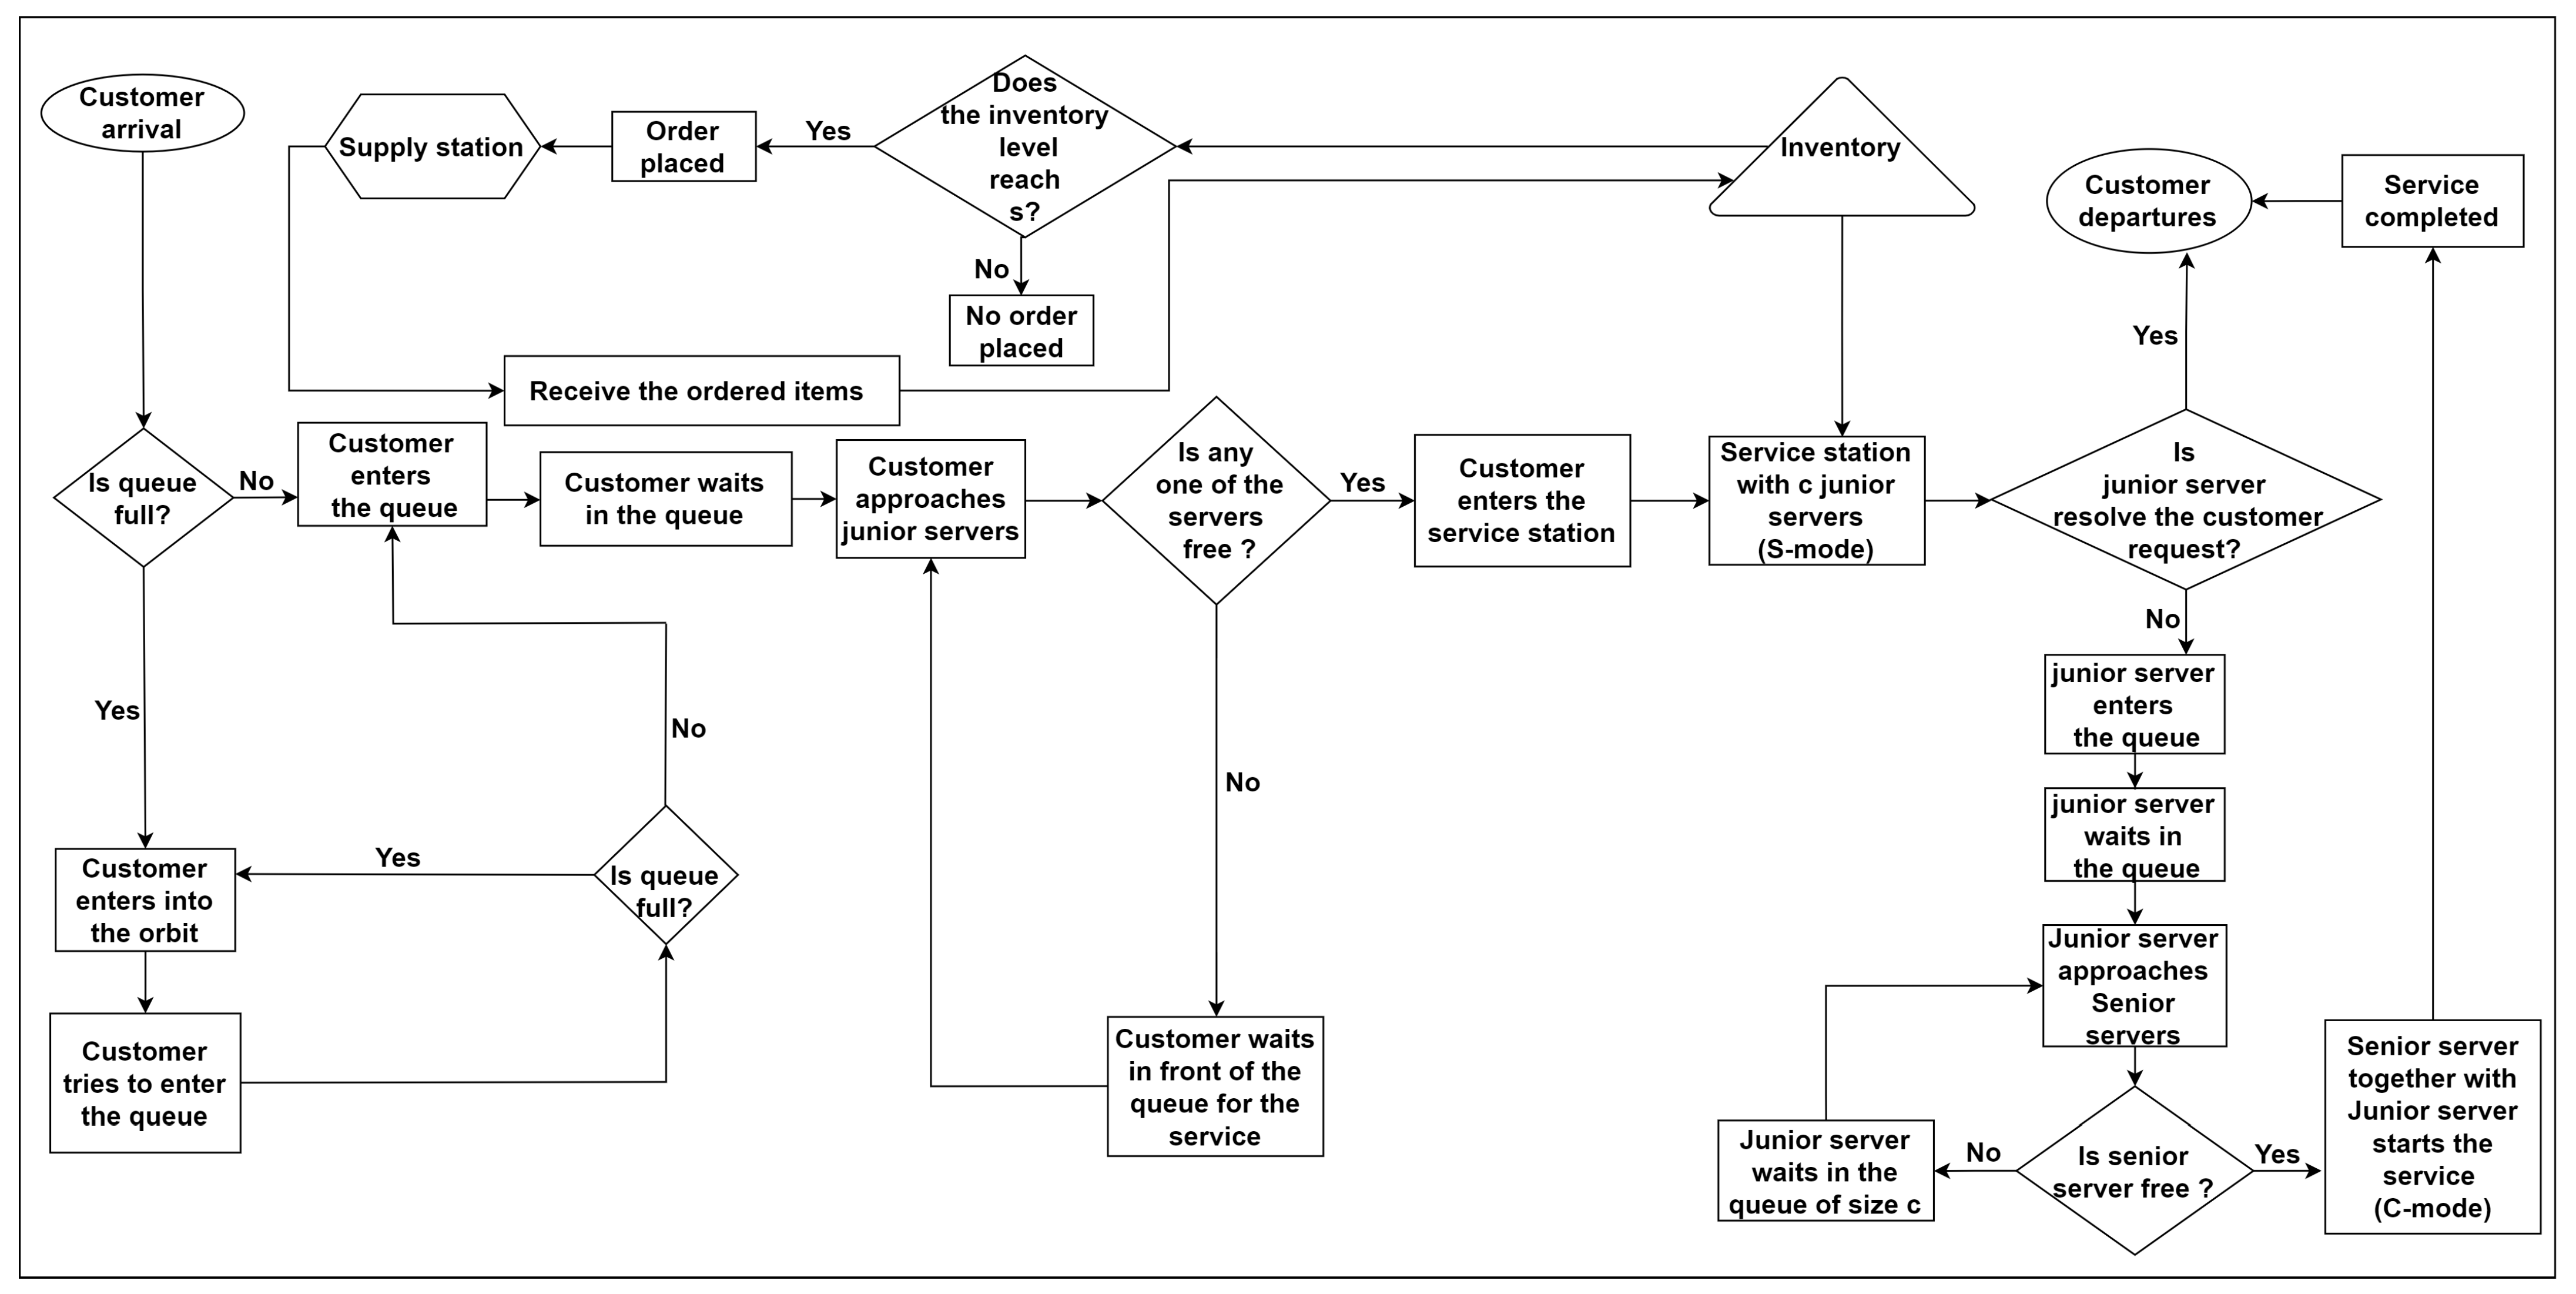
2. Model Description

The study examines an inventory system characterized by a maximum storage capacity of S items, two physical queues with capacities N and c, and an infinite capacity virtual waiting area (Orbit). The primary customers arrive at the waiting area of size N under the Poisson process at a rate of λ . If the waiting hall is full, any arriving customers compulsorily enter the orbit. The customer in the orbit always tries to enter the waiting hall. The retrial is successful when the number of customers in the waiting hall is less than N. The duration between consecutive attempts of orbital customers, known as the inter-retrial time, is estimated via an exponential distribution with the rate θ and it occurs under the classical retrial policy. The system employs a group of c junior servers to serve customers, with an additional senior server available to assist juniors facing difficulties during service. The service time of each junior server follows an exponential distribution with the parameter μ . Junior servers can operate in two modes: server mode (S-mode) and consultant mode (C-mode).
  • When the junior server takes on the duty of offering service to the customers in the waiting hall, he performs the role of a server, known as server mode (S-mode).
  • When a junior server seeks assistance from the senior server in solving the encountered problem in S-mode, the junior server receives consultation from the senior server (Consultant), known as consultant mode (C-mode).
If a customer arrives and the inventory is available with at least one free junior server, the service begins immediately. However, if the inventory is empty or all junior servers are occupied, the customer must wait in the waiting area (if the waiting area is not full). If the junior server successfully serves the customer (i.e., no issues arise), having completed the purchase, the customer exits the system with probability p. In cases where the junior server encounters a problem during service, they approach the senior server for consultation. In such a situation, the customer remains in the waiting area and the junior server, acting on the customer’s behalf, enters the queue of size c dedicated for the junior servers to consult with the senior server with a probability of q. The junior server informs the issue faced in S-mode to the senior server when it is available. Upon providing a comprehensive explanation of the matter to the senior server, a collaborative effort is undertaken by the senior server and the junior server to successfully provide the service. Upon completion, the customer leaves the system after making a purchase of an item, and the junior server transitions back from C-mode to S-mode. The duration of this service follows an exponential distribution with a rate of α . If both the inventory and customer (excluding the servicing customer) are available, the junior server immediately resumes service in S-mode. Otherwise, they remain idle in S-mode. When the junior server approaches the senior server and finds the senior server is assisting some other junior server, the junior server is required to wait in the waiting area of size c until it is their time to be served.
The system follows a ( s , Q ) ordering policy, where an order for Q ( = S s ) items is placed from an external supplier as soon as the inventory level reaches the designated threshold, s. The lead time for orders also follows an exponential distribution with the rate β . The relationship between the number of junior servers and the reorder point is defined as c < s . The flow chart of the considered model is given in Figure 1.

3. Mathematical Analysis

Consider the following random variables A 1 ( t ) , A 2 ( t ) , A 3 ( t ) , and A 4 ( t ) , representing the number of customers in the orbit at time t, the number of customers in the waiting hall at time t, the number of junior servers in C-mode at time t, and the number of items in the inventory at time t, respectively. The collection A ( t ) = { ( A 1 ( t ) , A 2 ( t ) , A 3 ( t ) , A 4 ( t ) ) : t 0 } constitutes a four-dimensional stochastic process with the state space P = i = 1 2 P i where P 1 = { ( a 1 , a 2 , a 3 , a 4 ) a 1 0 , ¯ , a 2 0 , c ¯ , a 3 0 , a 2 ¯ , a 4 a 3 , S ¯ } P 2 = { ( a 1 , a 2 , a 3 , a 4 ) a 1 0 , ¯ , a 2 c + 1 , N ¯ , a 3 0 , c ¯ , a 4 a 3 , S ¯ } .
The stochastic process A ( t ) , which is characterized by discrete state space and continuous time, exhibits the Markov property. Furthermore, it can be shown that any state in P is accessible from any other state. Therefore, we may classify A ( t ) as a continuous time irreducible Markov chain (CTIMC). The CTIMC is described by the infinitesimal generator matrix given below.
T =   0       1       2       3       4 0 1 2 3 ( T 0,0 T 0,1 T 1,0 T 1,1 T 0,1 T 2,0 T 2,2 T 0,1 T 3,0 T 3,3 T 0,1 ) ,
where the T 0 , 1 matrix symbolizes the transitions of the customers joining the orbit. This happens when a primary customer arrives and there is no place for customers in the waiting hall.
T 0 , 1 = λ I ( c + 1 ) S + 1 c ( c 1 ) 2 , a 2 = N ; a 2 = a 2 ; 0 , Otherwise .
The matrices T a 1 , 0 for a 1 = 1 , ¯ represent the transitions of retrial customers entering the waiting hall.
T a 1 , 0 = a 1 θ I S + 1 a 3 , a 2 = 0 , c 1 ¯ ; a 2 = a 2 + 1 ; a 3 = 0 , a 2 ¯ ; a 3 = a 3 ; a 1 θ I S + 1 a 3 , a 2 = c , N 1 ¯ ; a 2 = a 2 + 1 ; a 3 = 0 , c ¯ ; a 3 = a 3 ; 0 , Otherwise .
The matrices T a 1 , a 1 for a 1 = 0 , ¯ represent the transitions of all other remaining parameters, and the entries along the diagonal are populated by the total sum of elements in their respective rows, with an opposite sign to ensure that the sum of all row entries equals zero.
T a 1 , a 1 = D a 2 , a 2 = 0 , c ¯ ; a 2 = a 2 ; D c , a 2 = c + 1 , N 1 ¯ ; a 2 = a 2 ; D N , a 2 = N ; a 2 = a 2 ; F a 2 , a 2 = 0 , c 1 ¯ ; a 2 = a 2 + 1 ; F c , a 2 = c , N 1 ¯ ; a 2 = a 2 + 1 ; E a 2 , a 2 = 1 , c ¯ ; a 2 = a 2 1 ; E c + 1 , a 2 = c + 1 , N ¯ ; a 2 = a 2 1 ; 0 , Otherwise .
For a 2 = 0 , c ¯
D a 2 = β , a 3 = 0 , a 2 ¯ ; a 3 = a 3 ; a 4 = a 3 , s ¯ ; a 4 = a 4 + Q ; δ ¯ a 2 0 ( a 4 a 3 ) q μ , a 3 = 0 , a 2 1 ¯ ; a 3 = a 3 + 1 ; a 4 = a 3 + 1 , a 2 ¯ ; a 4 = a 4 ; δ ¯ a 2 0 ( a 2 a 3 ) q μ , a 3 = 0 , a 2 1 ¯ ; a 3 = a 3 + 1 ; a 4 = a 2 + 1 , S ¯ ; a 4 = a 4 ; [ λ + β + a 1 θ + a 3 = 0 , a 2 ¯ ; a 3 = a 3 ; δ ¯ a 2 0 δ ¯ a 2 a 3 ( a 4 a 3 ) μ + δ ¯ a 2 0 δ ¯ a 3 0 α ] , a 4 = a 3 , a 2 ¯ ; a 4 = a 4 ; [ λ + H ( s a 4 ) β + a 1 θ + a 3 = 0 , a 2 ¯ ; a 3 = a 3 ; δ ¯ a 2 0 ( a 2 a 3 ) μ + δ ¯ a 2 0 δ ¯ a 3 0 α ] , a 4 = a 2 + 1 , S ¯ ; a 4 = a 4 ; 0 , Otherwise .
D N = β , a 3 = 0 , c ¯ ; a 3 = a 3 ; a 4 = a 3 , s ¯ ; a 4 = a 4 + Q ; ( a 4 a 3 ) q μ , a 3 = 0 , c 1 ¯ ; a 3 = a 3 + 1 ; a 4 = a 3 + 1 , c ¯ ; a 4 = a 4 ; ( c a 3 ) q μ , a 3 = 0 , c 1 ¯ ; a 3 = a 3 + 1 ; a 4 = c + 1 , S ¯ ; a 4 = a 4 ; [ λ + β + a 3 = 0 , c ¯ ; a 3 = a 3 ; δ ¯ a 3 c ( a 4 a 3 ) μ + δ ¯ a 3 0 α ] , a 4 = a 3 , c ¯ ; a 4 = a 4 ; [ λ + H ( s a 4 ) β + a 3 = 0 , c ¯ ; a 3 = a 3 ; ( c a 3 ) μ + δ ¯ a 3 0 α ] , a 4 = c + 1 , S ¯ ; a 4 = a 4 ; 0 , Otherwise .
For a 2 = 0 , c ¯
F a 2 = λ , a 3 = 0 , a 2 ¯ ; a 3 = a 3 ; a 4 = a 3 , S ¯ ; a 4 = a 4 ; 0 , Otherwise .
For a 2 = 1 , c ¯
E a 2 = ( a 4 a 3 ) p μ , a 3 = 0 , a 2 1 ¯ ; a 3 = a 3 ; a 4 = a 3 + 1 , a 2 ¯ ; a 4 = a 4 1 ; ( a 2 a 3 ) p μ , a 3 = 0 , a 2 1 ¯ ; a 3 = a 3 ; a 4 = a 2 + 1 , S ¯ ; a 4 = a 4 1 ; α , a 3 = 1 , a 2 ¯ ; a 3 = a 3 1 ; a 4 = a 3 , S ¯ ; a 4 = a 4 1 ; 0 , Otherwise .
E c + 1 = ( a 4 a 3 ) p μ , a 3 = 0 , c 1 ¯ ; a 3 = a 3 ; a 4 = a 3 + 1 , c ¯ ; a 4 = a 4 1 ; ( c a 3 ) p μ , a 3 = 0 , c 1 ¯ ; a 3 = a 3 ; a 4 = c + 1 , S ¯ ; a 4 = a 4 1 ; α , a 3 = 1 , c ¯ ; a 3 = a 3 1 ; a 4 = a 3 , S ¯ ; a 4 = a 4 1 ; 0 , Otherwise .

3.1. Neuts and Rao Matrix Geometric Approximation

The structure of Equation (1) indicates that the assumed Markov chain, denoted as { A ( t ) , t 0 } , conforms to the level-dependent QBD process. To solve this system, we employ Neuts and Rao’s truncation method [42], which involves capping the orbit level at a specified point, denoted as M. This truncation shifts the system from being level-dependent to level-independent. Essentially, the equilibrium of the system is determined by setting T a 1 , 0 = T M , 0 and T a 1 , a 1 = T M , M for all a 1 M . In this scenario, the modified generator matrix for { A ( t ) , t 0 } is given by
T ^ = T 01 T 10 0 0 0 0 0 0 0 0 T 10 T 11 T 10 0 0 0 0 0 0 0 0 T 20 T 22 T 10 0 0 0 0 0 0 0 0 0 0 0 T M 0 T M M T 10 0 0 0 0 0 0 0 0 T M 0 T M M T 10 0 ,
In order to obtain the necessary stationary probability vector, we use the rate matrix T * , which is generated using this equation T * = T M 0 + T M M + T 10 and is given by
T * = D ^ a 2 , a 2 = 0 , c ¯ ; a 2 = a 2 ; D ^ c , a 2 = c + 1 , N 1 ¯ ; a 2 = a 2 ; D ^ N , a 2 = N ; a 2 = a 2 ; F ^ a 2 , a 2 = 0 , c 1 ¯ ; a 2 = a 2 + 1 ; F ^ c , a 2 = c , N 1 ¯ ; a 2 = a 2 + 1 ; E a 2 , a 2 = 1 , c ¯ ; a 2 = a 2 1 ; E c + 1 , a 2 = c + 1 , N ¯ ; a 2 = a 2 1 ; 0 , Otherwise .
For a 2 = 0 , c ¯
D ^ a 2 = β , a 3 = 0 , a 2 ¯ ; a 3 = a 3 ; a 4 = a 3 , s ¯ ; a 4 = a 4 + Q ; δ ¯ a 2 0 ( a 4 a 3 ) q μ , a 3 = 0 , a 2 1 ¯ ; a 3 = a 3 + 1 ; a 4 = a 3 + 1 , a 2 ¯ ; a 4 = a 4 ; δ ¯ a 2 0 ( a 2 a 3 ) q μ , a 3 = 0 , a 2 1 ¯ ; a 3 = a 3 + 1 ; a 4 = a 2 + 1 , S ¯ ; a 4 = a 4 ; [ λ + β + M θ + a 3 = 0 , a 2 ¯ ; a 3 = a 3 ; δ ¯ a 2 0 δ ¯ a 2 a 3 ( a 4 a 3 ) μ + δ ¯ a 2 0 δ ¯ a 3 0 α ] , a 4 = a 3 , a 2 ¯ ; a 4 = a 4 ; [ λ + H ( s a 4 ) β + M θ + a 3 = 0 , a 2 ¯ ; a 3 = a 3 ; δ ¯ a 2 0 ( a 2 a 3 ) μ + δ ¯ a 2 0 δ ¯ a 3 0 α ] , a 4 = a 2 + 1 , S ¯ ; a 4 = a 4 ; 0 , Otherwise .
D ^ N = β , a 3 = 0 , c ¯ ; a 3 = a 3 ; a 4 = a 3 , s ¯ ; a 4 = a 4 + Q ; ( a 4 a 3 ) q μ , a 3 = 0 , c 1 ¯ ; a 3 = a 3 + 1 ; a 4 = a 3 + 1 , c ¯ ; a 4 = a 4 ; ( c a 3 ) q μ , a 3 = 0 , c 1 ¯ ; a 3 = a 3 + 1 ; a 4 = c + 1 , S ¯ ; a 4 = a 4 ; [ λ + β + a 3 = 0 , c ¯ ; a 3 = a 3 ; δ ¯ a 3 c ( a 4 a 3 ) μ + δ ¯ a 3 0 α ] , a 4 = a 3 , c ¯ ; a 4 = a 4 ; [ λ + H ( s a 4 ) β + a 3 = 0 , c ¯ ; a 3 = a 3 ; ( c a 3 ) μ + δ ¯ a 3 0 α ] , a 4 = c + 1 , S ¯ ; a 4 = a 4 ; 0 , Otherwise .
For a 2 = 0 , c ¯
F ^ a 2 = λ + M θ , a 3 = 0 , c ¯ ; a 3 = a 3 ; a 4 = a 3 , S ¯ ; a 4 = a 4 ; 0 , Otherwise .
Theorem 1. 
The steady state probability vector ψ to the matrix T * is given by
ψ ( a 2 ) = ψ ( 0 ) χ a 2 , a 2 0 , N ¯
where
χ 0 = I ; χ i = j = 1 i Γ j
Γ j = F ^ j 1 [ D ^ j + Γ j + 1 E j + 1 ] 1 , j 1 , c ¯ , F ^ c [ D ^ c + Γ j + 1 E c + 1 ] 1 , j c + 1 , N 1 ¯ , F ^ c D ^ N 1 , j = N .
and ψ ( 0 ) is obtained by solving the equations
ψ ( 0 ) ( D ^ 0 + Γ 1 E 1 ) = 0 ,
a 2 = 0 N ψ ( 0 ) e = 1 .
Proof. 
The probability vector ψ in steady state satisfies the below equations:
ψ T * = 0 ,
ψ e = 1 .
In Equation (5), after explicitly expressing ψ and T * and simplifying it, we arrive at the N + 1 set of equations as follows:
ψ ( a 2 ) D ^ a 2 + ψ ( a 2 + 1 ) E a 2 + 1 = 0 , a 2 = 0 ,
ψ ( a 2 1 ) F ^ a 2 1 + ψ ( a 2 ) D ^ a 2 + ψ ( a 2 + 1 ) E a 2 + 1 = 0 , a 2 0 , c ¯ ,
ψ ( a 2 1 ) F ^ c + ψ ( a 2 ) D ^ c + ψ ( a 2 + 1 ) E c + 1 = 0 , a 2 c + 1 , N 2 ¯ ,
ψ ( a 2 1 ) F ^ c + ψ ( a 2 ) D ^ a 2 = 0 , a 2 = N 1 .
The steady-state probability vectors ψ a 2 for all a 2 in the set 0 , N ¯ are obtained by solving the system of Equations (7) and (10) iteratively. This allows us to express these vectors in terms of the steady-state probability vector ψ ( 0 ) as shown in Equation (2). Solving Equations (3) and (4), we obtain ψ ( 0 ) and use the vector ψ ( 0 ) to obtain ψ . □
Theorem 2. 
The inequality
a 3 = 0 c a 4 = a 3 S ψ ( M , N , a 3 , a 4 ) λ < a 2 = 0 c a 3 = 0 a 2 a 4 = a 3 S + a 2 = c + 1 N 1 a 3 = 0 c a 4 = a 3 S ψ ( M , a 2 , a 3 , a 4 ) M θ
gives the stability condition for the infinitesimal generator matrix, T ^ .
Proof. 
Based on the result given by Neuts [43], the existence of a steady-state probability vector ψ for the modified infinitesimal generator matrix T ^ is dependent upon the fulfillment of the following condition.
ψ T 0 , 1 e < ψ T M , 0 e .
Through the above Theorem (1) in inequality (12) and writing elaborately on all ψ , T 0 , 1 , T M , 0 and e and simplifying it, the required stability condition in (11) is obtained. □

3.2. Limiting Probability Distribution

The generating matrix T yields the steady-state probability vector φ = ( φ ( 0 ) , φ ( 1 ) , φ ( 2 ) , ) , which meets the stability requirement. Consequently, the Markov process denoted as
( A 1 ( t ) , A 2 ( t ) , A 3 ( t ) , A 4 ( t ) ) , t 0 ,
with a state space denoted as P is classified as regular. Hence, the ultimate probability distribution is denoted as
φ ( a 1 , a 2 , a 3 , a 4 ) = lim t P r A 1 ( t ) = a 1 , A 2 ( t ) = a 2 , A 3 ( t ) = a 3 , A 4 ( t ) = a 4 | A 1 ( 0 ) = 0 , A 2 ( 0 ) = 0 , A 3 ( 0 ) = 0 , A 4 ( 0 ) = 0 .
It exists and is observed to be independent of the initial state.

4. Computation of R Matrix

To obtain the steady-state probability vector φ = ( φ ( 0 ) , φ ( 1 ) , φ ( 2 ) , ) , it is essential to calculate the rate matrix R .
Theorem 3. 
The rate matrix R is the minimal non-negative solution of the matrix quadratic equation
T M , 0 R 2 + T M , M R + T 0 , 1 = 0 ,
and the R matrix structure is
=                                     0                   1                             S 1           S 0 1 N 1 N 0 0 0 0 0 0 0 0 0 0 0 0 A ( 0 ) A ( 1 ) A ( N 1 ) A ( N )
For a 2 0 , N ¯
A ( a 2 ) =                                       0                     1                                 c 1                 c 0 1 c 1 c a 2 0 , 0 a 2 0 , 1 a 2 0 , c 1 a 2 0 , c a 2 1 , 0 a 2 1 , 1 a 2 1 , c 1 a 2 1 , c a 2 c 1 , 0 a 2 c 1 , 1 a 2 c 1 , c 1 a 2 c 1 , c a 2 c , 0 a 2 c , 1 a 2 c , c 1 a 2 c , c
For u , v 0 , c ¯
a 2 u , v =                                   v             v + 1           S 1             S u u + 1 S 1 S ( ϑ a 2 , u , v u , v ϑ a 2 , u , v u , v + 1 ϑ a 2 , u , v u , S 1 ϑ a 2 , u , v u , S ϑ a 2 , u , v u + 1 , v ϑ a 2 , u , v u + 1 , v + 1 ϑ a 2 , u , v u + 1 , S 1 ϑ a 2 , u , v u + 1 , S ϑ a 2 , u , v S 1 , v ϑ a 2 , u , v S 1 , v + 1 ϑ a 2 , u , v S 1 , S 1 ϑ a 2 , u , v S 1 , S ϑ a 2 , u , v S , v ϑ a 2 , u , v S , v + 1 ϑ a 2 , u , v S , S 1 ϑ a 2 , u , v S , S )
Proof. 
The matrix quadratic Equation (13) is fulfilled by the rate matrix R , which is constructed based on the block tridiagonal structure of the infinitesimal modified generating matrix T ^ . At first, it is presumed that (14) contains the unknown R -matrix. In fact, the R -matrix structure may be determined simply by counting the number of non-zero rows in the T 0 , 1 matrix. Since each row in the final block of the T 0 , 1 matrix contains at least one non-zero element, all of the rows in the final block of the R -matrix should be regarded as non-zero rows. These presumptions lead to the structure of the unknown R -matrix being as shown in (14). The following set of non-linear homogeneous equations is derived by using each block matrix in Equation (13).
If a 2 = N ; a 2 0 , N ¯ ; a 3 0 , c 1 ¯ ; a 3 0 , c ¯ ; a 4 a 3 , c ¯ ; a 4 a 3 , S ¯ ;
λ + β + δ 0 a 4 a 4 μ + δ ¯ a 3 0 α ϑ a 2 , a 3 , a 3 a 4 , a 4 + β ϑ a 2 , a 3 , a 3 Q + a 4 , a 4 + δ a 4 0 q ( a 4 a 3 ) μ ϑ a 2 , a 3 , a 3 a 4 , a 4 + λ δ a 2 N = 0 .
If a 2 = N ; a 2 0 , N ¯ ; a 3 0 , c 1 ¯ ; a 3 0 , c ¯ ; a 4 c + 1 , S ¯ ; a 4 a 3 , S ¯ ;
λ + H ( s a 4 ) β + c μ + δ ¯ a 3 0 α ϑ a 2 , a 3 , a 3 a 4 , a 4 + H ( s a 4 ) β ϑ a 2 , a 3 , a 3 Q + a 4 , a 4 + q ( c a 3 ) μ ϑ a 2 , a 3 , a 3 a 4 , a 4 + λ δ a 2 N = 0 .
If a 2 = N ; a 2 0 , N ¯ ; a 3 = c ; a 3 0 , c ¯ ; a 4 a 3 , c ¯ ; a 4 a 3 , S ¯ ;
λ + β + α ϑ a 2 , a 3 , a 3 a 4 , a 4 + β ϑ a 2 , a 3 , a 3 Q + a 4 , a 4 + λ δ a 2 N = 0 .
If a 2 = N ; a 2 0 , N ¯ ; a 3 = c ; a 3 0 , c ¯ ; a 4 c + 1 , S ¯ ; a 4 a 3 , S ¯ ;
λ + H ( s a 4 ) β + α ϑ a 2 , a 3 , a 3 a 4 , a 4 + H ( s a 4 ) β ϑ a 2 , a 3 , a 3 Q + a 4 , a 4 + λ δ a 2 N = 0 .
Solving the above set of Equations (17)–(20) via Gauss–Seidel Method, we obtain the exact entries of the rate matrix R . □
Theorem 4. 
The probability vector φ ( a 1 ) , a 1 = 1 , 2 , 3 , of the Markov chain can be derived by φ ( a 1 ) = φ ( 0 ) Λ a 1 , a 1 = 0 , M ¯ , φ ( 0 ) Λ M R a 1 M , a 1 > M .  where R is the solution of the matrix quadratic Equation (13) and
Λ a 1 = I , i f a 1 = 0 , i = 0 a 1 T 0 , 1 A i , i f a 1 = 1 , M ¯ .
X j = ( T 0 , 1 X j + 1 T j + 2 , 0 + T ( j + 1 ) , ( j + 1 ) ) 1 , j = 0 , M 2 ¯ , [ ( T M , M + R T M , 0 ) ] 1 , j = M 1 . and
φ ( 0 ) = I + a 1 = 1 M 1 j = 0 i 1 T 0 , 1 X j + j = 0 M 1 T 0 , 1 X j ( I R ) 1 1
Proof. 
Let φ = ( φ ( 0 ) , φ ( 1 ) , φ ( 2 ) , ) be a probability vector which satisfies
φ T ^ = 0 and φ e = 1 .
Let us use the matrix geometric method to solve (21). Let us consider a rate matrix R which is the solution of the matrix quadratic equation R 2 T M , 0 + R T M , M + T 0 , 1 = 0 . Let us assume that
φ ( a 1 ) = φ ( M ) R ( a 1 M ) a 1 = M , ¯ .
By solving φ T * = 0 , we obtain the following system of equations
φ ( 0 ) T 0 , 0 + φ ( 1 ) T 1 , 0 = 0
φ ( a 1 1 ) T 0 , 1 + φ ( a 1 ) T a 1 , a 1 + φ ( a 1 + 1 ) T a 1 + 10 = 0 a 1 = 1 , n 1 ¯
φ ( M 1 ) T 0 , 1 + φ ( M ) ( T M , M + R T M , 0 ) = 0
and a 1 = 0 M 1 φ ( a 1 ) + φ ( M ) ( I R ) 1 e = 1 .
From (25) φ ( M ) = φ ( M 1 ) T 0 , 1 X M 1 , where X M 1 = [ ( T M , M + R T M , 0 ) ] 1 .
From (24) φ ( M 1 ) = φ ( M 2 ) T 0 , 1 X M 2 , where X M 2 = [ ( T ( M 1 ) × ( M 1 ) + T 0 , 1 G M 1 T M , 0 ) ] 1 .
Using (24) again, similarly we obtain φ ( M 2 ) = φ ( M 3 ) T 0 , 1 X M 3
where X M 3 = [ ( T ( M 2 ) , ( M 2 ) + T 0 , 1 X M 2 T M , 0 ) ] 1 .
In general
φ ( a 1 ) = φ ( a 1 1 ) T 0 , 1 X a 1 1 a 1 = 1 , M ¯
where X a 1 = [ ( T M , M + R T M , 0 ) ] 1 a 1 = M 1 [ ( T a 1 , a 1 + T 0 , 0 A a 1 T a 1 + 1 , 1 ) ] 1 a 1 = 1 , M 2 ¯ From (27)
φ ( a 1 ) = φ ( 0 ) Λ a 1 a 1 = 0 , M ¯
a 1 = I if a 1 = 0 i = 0 a 1 T 0 , 1 A i if a 1 = 1 , M ¯
By substituting (28) in (25), we obtain
φ ( 0 ) I + a 1 = 0 M 1 a 1 + M ( I R ) 1 e = 1
By substituting (29) in (30), we obtain
φ ( 0 ) = I + a 1 = 1 M 1 i = 0 a 1 1 T 0 , 1 X i + i = 0 M 1 T 0 , 1 X i ( I R ) 1 1 .
Using (31) in (28), we can obtain each φ ( i ) . □

5. System Performance Measures

In this section, various performance measures of the system are defined to construct the total cost function and to illustrate numerical examples.
  • Mean Inventory level:
    Z 1 = a 1 = 0 a 2 = 0 c a 3 = 0 a 2 a 4 = a 3 S a 4 φ ( a 1 , a 2 , a 3 , a 4 ) + a 1 = 0 a 2 = c + 1 N a 3 = 0 c a 4 = a 3 S a 4 φ ( a 1 , a 2 , a 3 , a 4 )
  • Mean Reorder Rate:
    Z 2 = a 1 = 0 a 2 = 1 c a 3 = 0 a 2 1 ( a 2 a 3 ) p μ φ ( a 1 , a 2 , a 3 , s + 1 ) + a 1 = 0 a 2 = c + 1 N a 3 = 0 c 1 ( c a 3 ) p μ φ ( a 1 , a 2 , a 3 , s + 1 ) + a 1 = 0 a 2 = 1 c a 3 = 1 a 2 α φ ( a 1 , a 2 , a 3 , s + 1 ) + a 1 = 0 a 2 = c + 1 N a 3 = 1 c α φ ( a 1 , a 2 , a 3 , s + 1 )
  • Mean Number of Customers in Waiting Hall:
    Z 3 = a 1 = 1 a 2 = 0 c a 3 = 0 a 2 a 4 = a 3 S a 2 φ ( a 1 , a 2 , a 3 , a 4 ) + a 1 = 0 a 2 = c + 1 N a 3 = 0 c a 4 = a 3 S a 2 φ ( a 1 , a 2 , a 3 , a 4 )
  • Mean Number of Customers Enter into the Waiting Hall:
    Z 4 = a 1 = 0 a 2 = 0 c a 3 = 0 a 2 a 4 = a 3 S λ φ ( a 1 , a 2 , a 3 , a 4 ) + a 1 = 0 a 2 = c + 1 N 1 a 3 = 0 c a 4 = a 3 S λ φ ( a 1 , a 2 , a 3 , a 4 )
  • Mean Waiting Time of Customers in Waiting Hall:
    Z 5 = Z 3 Z 4
  • Mean Number of Junior Servers in C-mode:
    Z 6 = a 1 = 1 a 2 = 1 c a 3 = 1 a 2 a 4 = a 3 S a 3 φ ( a 1 , a 2 , a 3 , a 4 ) + a 1 = 0 a 2 = c + 1 N a 3 = 1 c a 4 = a 3 S a 3 φ ( a 1 , a 2 , a 3 , a 4 )
  • Mean Number of Junior Servers Enter into C-mode:
    Z 7 = q μ [ a 1 = 0 a 2 = 1 c a 3 = 0 a 2 1 a 4 = a 3 + 1 a 2 ( a 4 a 3 ) φ ( a 1 , a 2 , a 3 , a 4 ) + a 1 = 0 a 2 = 1 c a 3 = 0 a 2 1 a 4 = a 2 + 1 S ( a 2 a 3 ) φ ( a 1 , a 2 , a 3 , a 4 ) + a 1 = 0 a 2 = c + 1 N a 3 = 0 c 1 a 4 = a 3 + 1 c ( a 4 a 3 ) φ ( a 1 , a 2 , a 3 , a 4 ) + a 1 = 0 a 2 = c + 1 N a 3 = 0 c 1 a 4 = c + 1 S ( c a 3 ) φ ( a 1 , a 2 , a 3 , a 4 ) ]
  • Mean Waiting Time of Junior Servers in C-mode:
    Z 8 = Z 6 Z 7
  • Mean Number of Busy Junior Servers in S-mode:
    Z 9 = a 1 = 0 a 2 = 1 c a 3 = 0 a 2 1 a 4 = a 3 + 1 a 2 ( a 4 a 3 ) φ ( a 1 , a 2 , a 3 , a 4 ) + a 1 = 0 a 2 = 1 c a 3 = 0 a 2 1 a 4 = a 2 + 1 S ( a 2 a 3 ) φ ( a 1 , a 2 , a 3 , a 4 ) + a 1 = 0 a 2 = c + 1 N a 3 = 0 c 1 a 4 = a 3 + 1 c ( a 4 a 3 ) φ ( a 1 , a 2 , a 3 , a 4 ) + a 1 = 0 a 2 = c + 1 N a 3 = 0 c 1 a 4 = c + 1 S ( c a 3 ) φ ( a 1 , a 2 , a 3 , a 4 )
  • Mean Number of Idle Junior Servers in S-mode:
    Z 10 = c ( Z 6 + Z 9 )
  • Mean Number of Customers in the Orbit:
    Z 11 = a 1 = 1 M 1 φ ( a 1 ) e + ( M φ ( M ) ( I R ) 1 + φ ( M ) R ( I R ) 2 ) e
  • Mean Number of Customers Enter into Orbit:
    Z 12 = a 1 = 0 a 3 = 0 a 2 a 4 = a 3 S λ φ ( a 1 , N , a 3 , a 4 )
  • Mean Waiting Time of Customers in Orbit:
    Z 13 = Z 11 Z 12
  • Successful Rate of Retrial:
    Z 14 = a 1 = 1 M 1 a 2 = 0 c a 3 = 0 a 2 a 4 = a 3 S a 1 θ φ ( a 1 , a 2 , a 3 , a 4 ) + a 1 = 1 M 1 a 2 = c + 1 N 1 a 3 = 0 c a 4 = a 3 S a 1 θ φ ( a 1 , a 2 , a 3 , a 4 ) + ( M θ φ ( M ) ( I R ) 1 + φ ( M ) θ R ( I R ) 2 ) e
  • Overall Rate of Retrial:
    Z 15 = θ Z 11
  • Fraction of Successful Rate of Retrial:
    Z 16 = Z 14 Z 15

The Expected Total Cost

The expected total expenditure of the considered queuing-inventory system is defined as
E T C = c 1 Z 1 + c 2 Z 2 + c 3 Z 3 + c 4 Z 6 + c 5 Z 11 + c 6 Z 9 + c 7 Z 10
where
c1
refers to the expense associated with holding each unit of an item.
c2
signifies the cost incurred for setting up each unit of an item.
c3
represents the cost accrued for each customer in the waiting hall per unit of time.
c4
denotes the cost incurred for each junior server in C-mode per unit of time.
c5
pertains to the cost accrued for each customer in orbit per unit of time.
c6
represents the expenditure linked to each engaged junior server.
c7
signifies the cost associated with each idle junior server.

6. Cost Analysis and Numerical Illustration

The study will employ the system’s cost and parameter values to analyze the four-dimensional stochastic multi-server QIS under examination. The investigation will involve the study of the total cost, active servers, proportion of the successful retrial rate, and waiting times for customers in the orbit, waiting area, and servers in both S-mode and C-mode, by varying the parameters. Based on the results obtained from the stability conditions and normalizing property, the following parameters and costs of the Markov process are assumed: S = 28 ; s = 10 ; c 1 = 0.008 ; c 2 = 1 ; c 3 = 2 ; c 4 = 2 ; c 5 = 0.1 ; c 6 = 2 ; c 7 = 1 ;   Q = S s ; N = 6 ; c = 3 ; M = 100 ; p = 0.5 ; q = 1 p ; θ = 0.9 ; λ = 1 ; μ = 3 ; α = 8 ;  and  β = 2 ;  for the analysis of the numerical discussions.

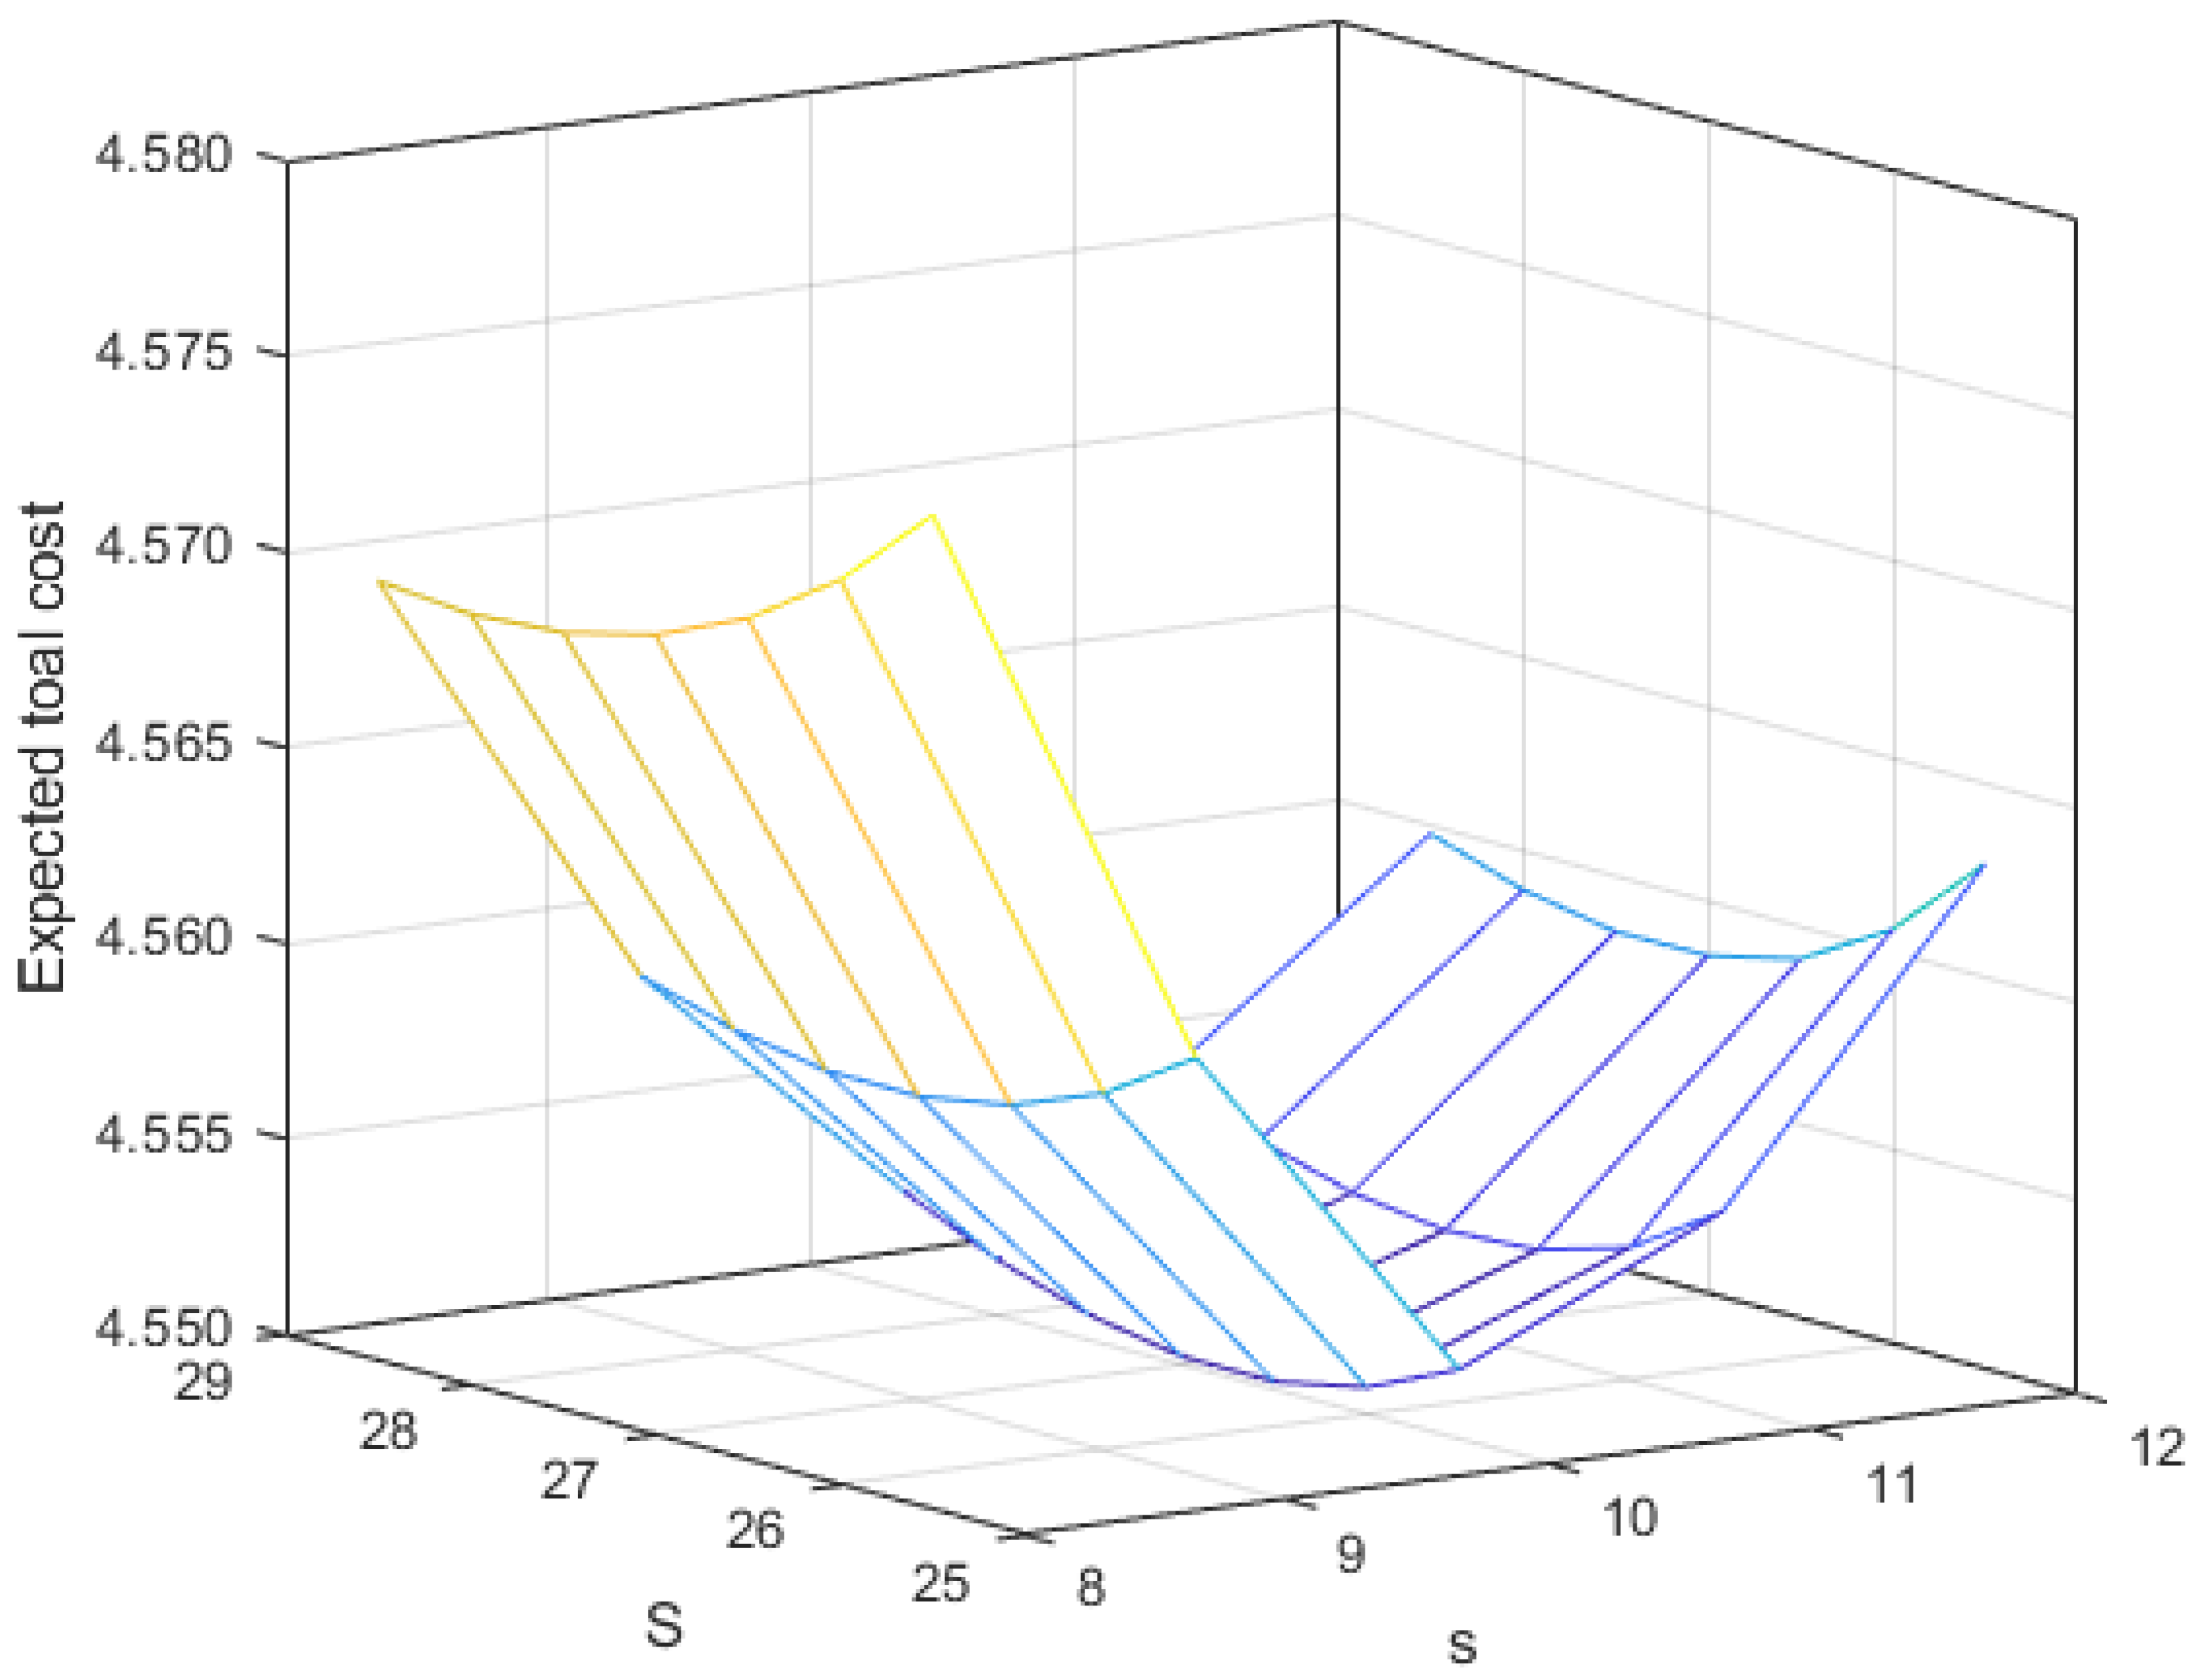
6.1. Analysis on the Expected Total Cost

In this section, the expected total cost is analyzed under the parameters. The obtained convex in Figure 2 ensures the model’s efficiency. The impacts of each parameter on E T C are given in Table 1, Table 2 and Table 3. The characteristics of the parameters are listed below:
  • As the arrival rate λ rises, there is a notable upswing in E T C due to the increased presence of customers inside the waiting hall.
  • Elevating the probability value p hinders junior servers from approaching their senior counterparts. As a result, customers inside the waiting hall tend to depart promptly at the end of service in S-mode, resulting in a decrease in E T C .
  • With an increase in the retry rate θ , the anticipated orbit level diminishes as an increasing number of customers enter the waiting area. Since the expected orbit level correlates with the total cost, this leads to a reduction in E T C .
  • Higher service rates μ and α lead to a drop in each customer’s mean service duration. Consequently, Z 3 decreases, contributing to a decrease in E T C .
  • Raising the rate β results in a decrease in the average lead time per order. Consequently, the expected total cost decreases.
  • Altering the number of junior servers in the system incurs additional expenses. Hence, an increase in c leads to an increase in E T C .
  • An expansion in the waiting hall size corresponds to a rise in Z 3 . As a result, the overall cost exhibits a positive correlation with the parameter N.
Expected total cost is a pivotal measure utilized to assess and enhance the effectiveness of a system. The efficiency of the model is significantly influenced by factors like the service rate, reorder rate, and the quantity of servers.

6.2. Analysis on Mean Waiting Time of Customers in the Waiting Hall

This section analyzes the customer’s waiting time in the waiting hall under the parameter variation shown in Table 4, Table 5 and Table 6. Each parameter is varied under the probability p.
  • As the waiting hall size N is enlarged, there is an observed rise in waiting time attributable to an increase in Z 4 .
  • Augmenting the service rates for both junior and senior servers reduces their average service period. Hence, customer’s waiting time decreases.
  • An escalation in the arrival rate λ corresponds to an uptick in primary arrivals, leading to an increase in Z 3 . Likewise, as the retry rate θ rises, orbiting customers transition into the waiting hall, influencing Z 5 .
  • It is a well-established fact that an augmentation in the number of servers generally leads to a decrease in waiting time. Accordingly, the parameter c is reflected in Z 5 .
  • Increasing the rate β results in a reduction in the average lead time per order and Z 5 diminishes.
By thoroughly analyzing waiting times in a waiting hall, businesses and organizations can implement strategies to enhance customer satisfaction, optimize operations, and improve overall service quality.

6.3. Analysis of Mean Waiting Time for Customer in the Orbit

The mean waiting time for the customers in the orbit is analyzed in this section for each parameter under the variation in P shown in Table 7, Table 8 and Table 9. The impact of the parameters is listed below:
  • By increasing N, the waiting hall offers more space, allowing orbital customers to transition into the waiting hall. As a result, their waiting time is reduced.
  • Elevating the service rates for both junior and senior servers leads to a reduction in their average service time. Consequently, customers in the waiting hall tend to leave promptly, creating room for orbital customers to enter. This leads to a reduction in the waiting time for orbital customers.
  • An increase in λ signifies a rise in primary arrivals, causing Z 3 to also increase. This, in turn, results in an extended Z 13 .
  • Similarly, as the rate θ rises, orbital customers move into the waiting hall, decreasing Z 13 .
  • It is a well-established fact that augmenting the number of servers generally leads to a decrease in waiting time. Therefore, the parameter c contributes to optimizing Z 13 .
  • The rate of parameter β is being increased. It is associated with a reduction in the lead time per order that minimizes Z 13 .
The examination provides valuable insights into minimizing the waiting time for customers in the orbit. Ultimately, these parameters impact the efficiency of waiting times for customers in the waiting hall and also affect the orbit. A decrease in the waiting time for orbital customers leads to an increase in the business’s profitability.

6.4. Analysis on Mean Waiting Time of Junior Servers in C-Mode

This section analyzes a parameter analysis on the mean waiting time of junior servers in C-mode. The impact of parameters can be seen in Table 10, Table 11 and Table 12 and is listed below
  • As the rate of customer arrival increases, there is a corresponding growth in the quantity of customers present in the waiting area. As a result, there is an increased probability of junior servers operating in C-mode, hence resulting in a corresponding rise in their waiting duration.
  • Similarly, an increase in the retrial rate θ allows orbital customers to transition into the waiting hall, resulting in an increase in Z 8
  • Increasing the value of c leads to a rise in the average number of busy junior servers. Additionally, the number of junior servers in C-mode also increases with an increase in c.
  • An expansion in the capacity of the waiting area corresponds to a proportional increase in the number of busy servers in C-mode, as there is a rise in Z 8 .
  • The reduction in the number of servers in C-mode is seen when there is an increase in the service rate for the senior server. However, this relationship is reversed for junior servers.
  • A reduction in the rate β always leads to a decrease in lead time, consequently resulting in a decrease in Z 8 .
  • Upon observing the effects of varying the probability p, there is a notable reduction in the waiting time of junior servers in C-mode.
The importance of the number of servers lies in its direct impact on the system’s capacity to serve customers. A higher number of servers increases the system’s capacity to process customers simultaneously, reducing waiting times and congestion. Conversely, a lower number of servers can lead to longer waiting times and potentially dissatisfied customers.

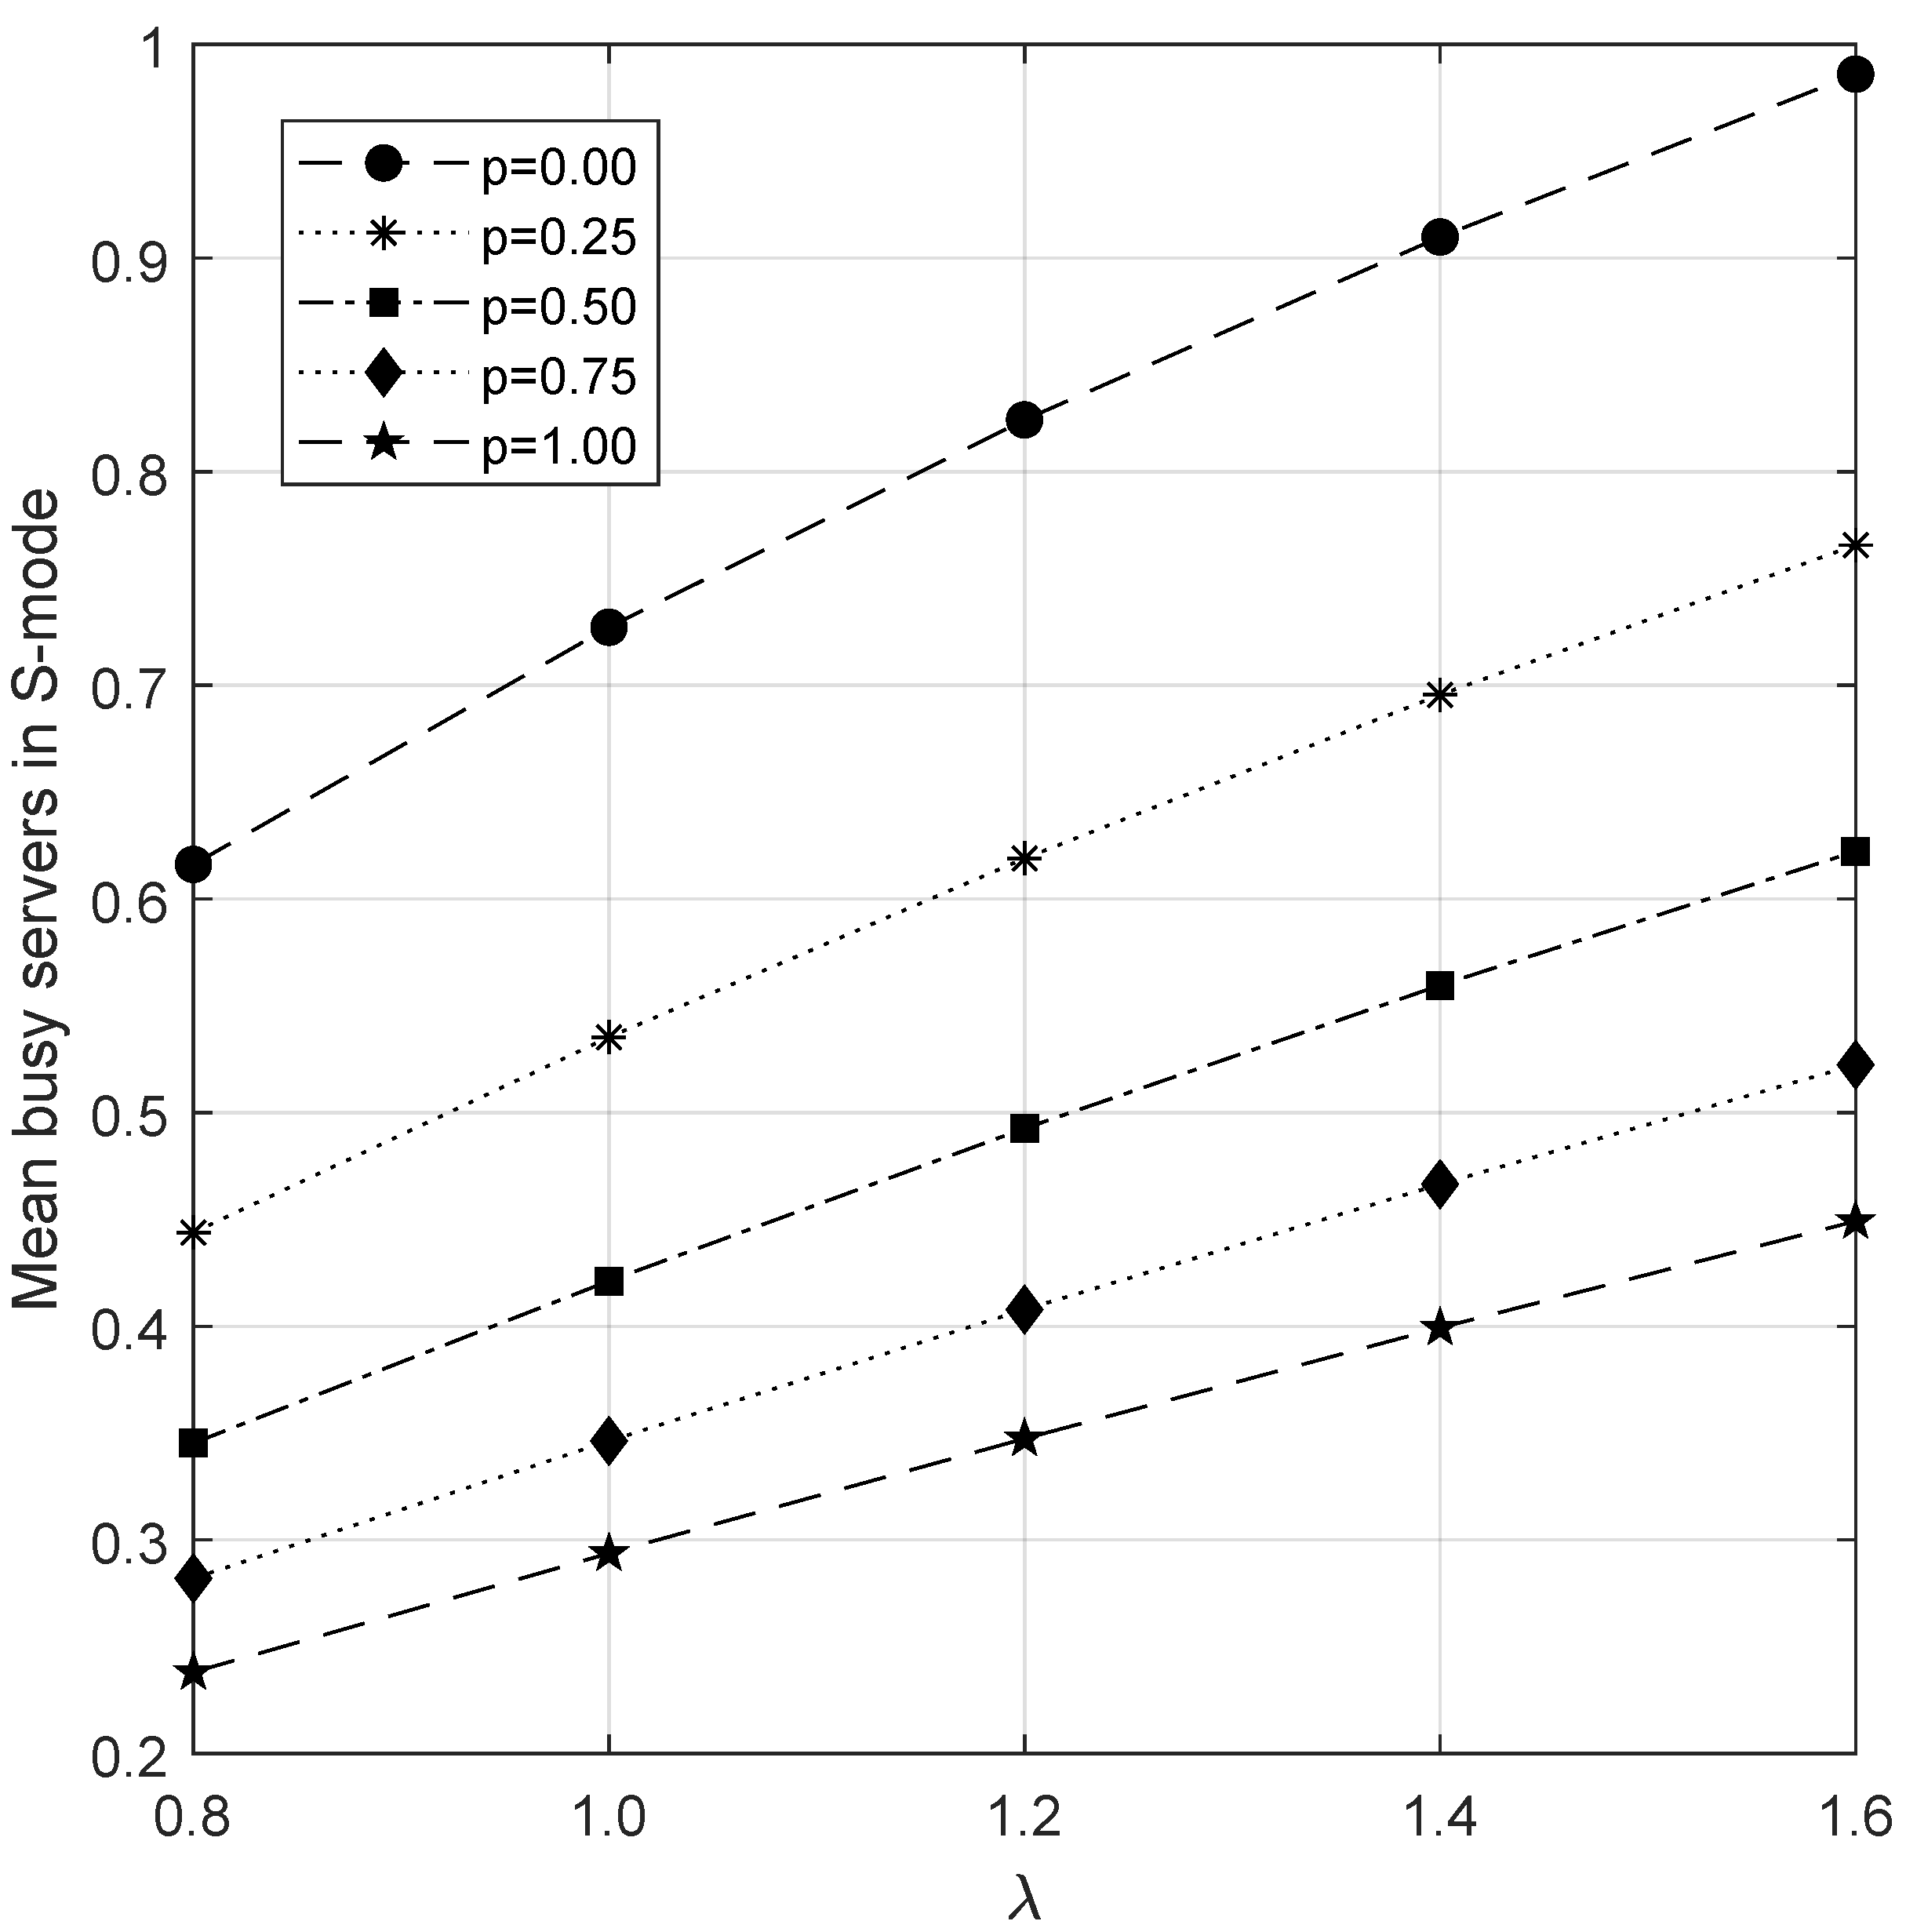
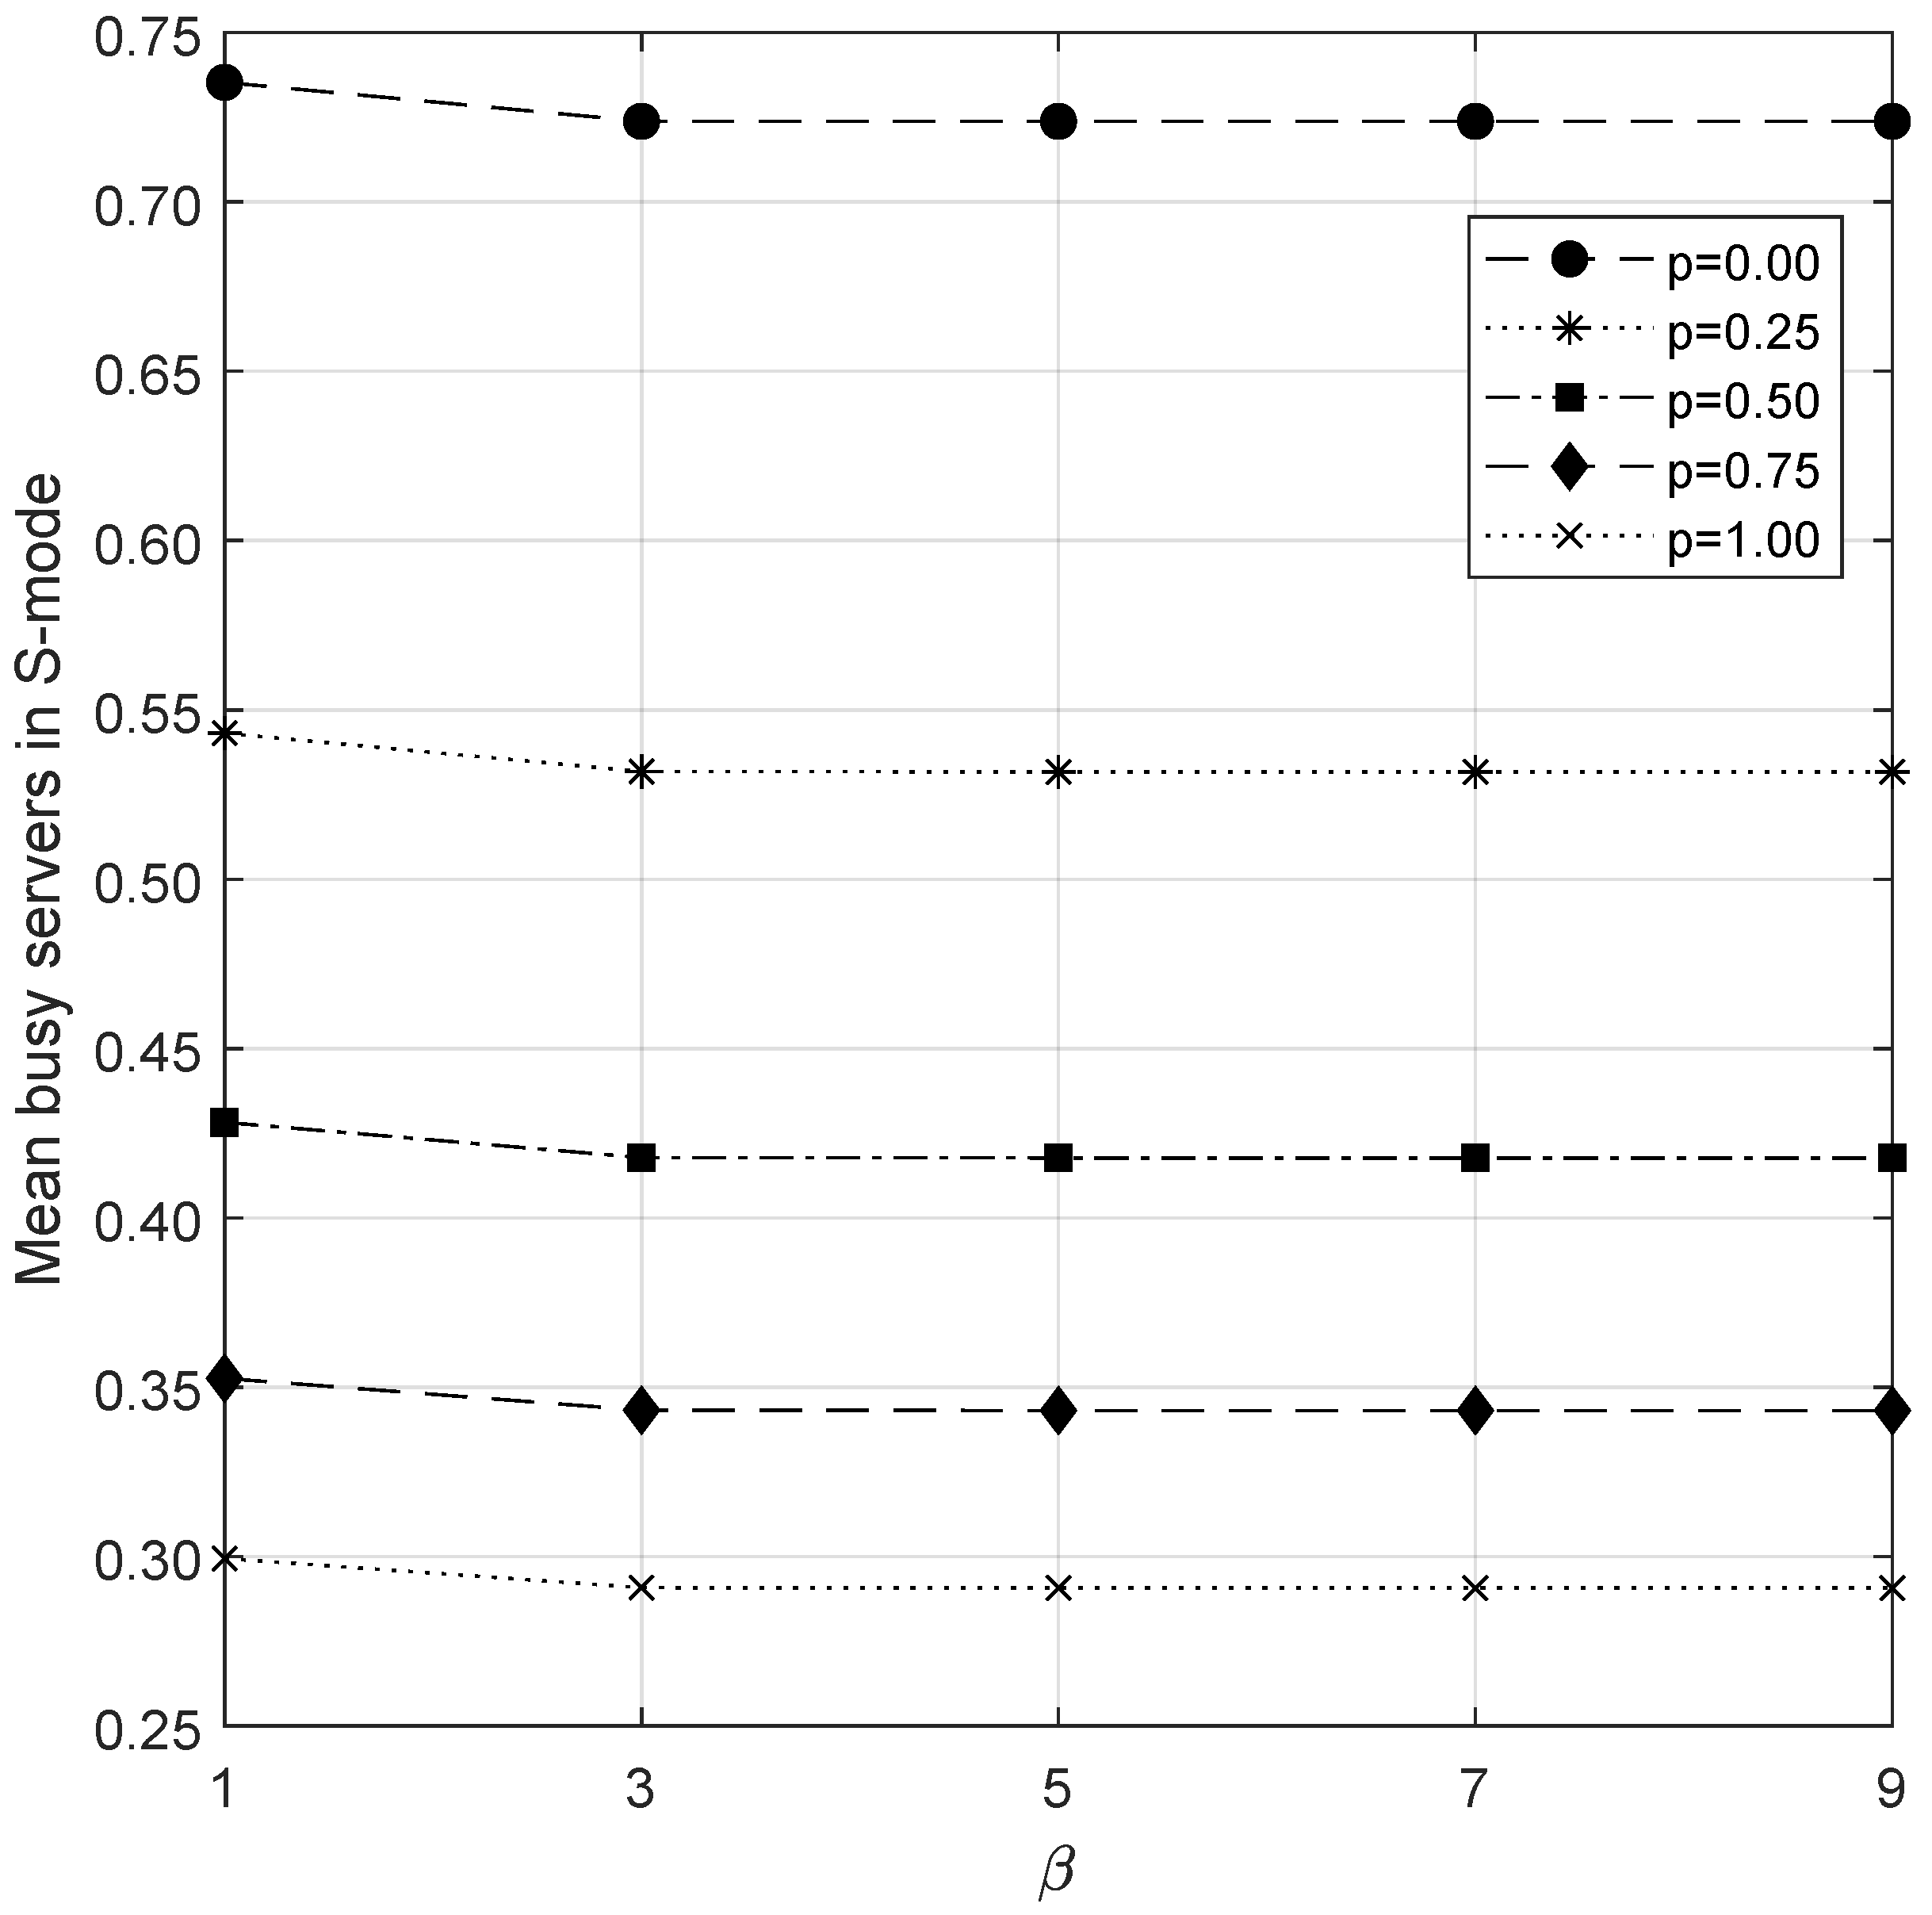
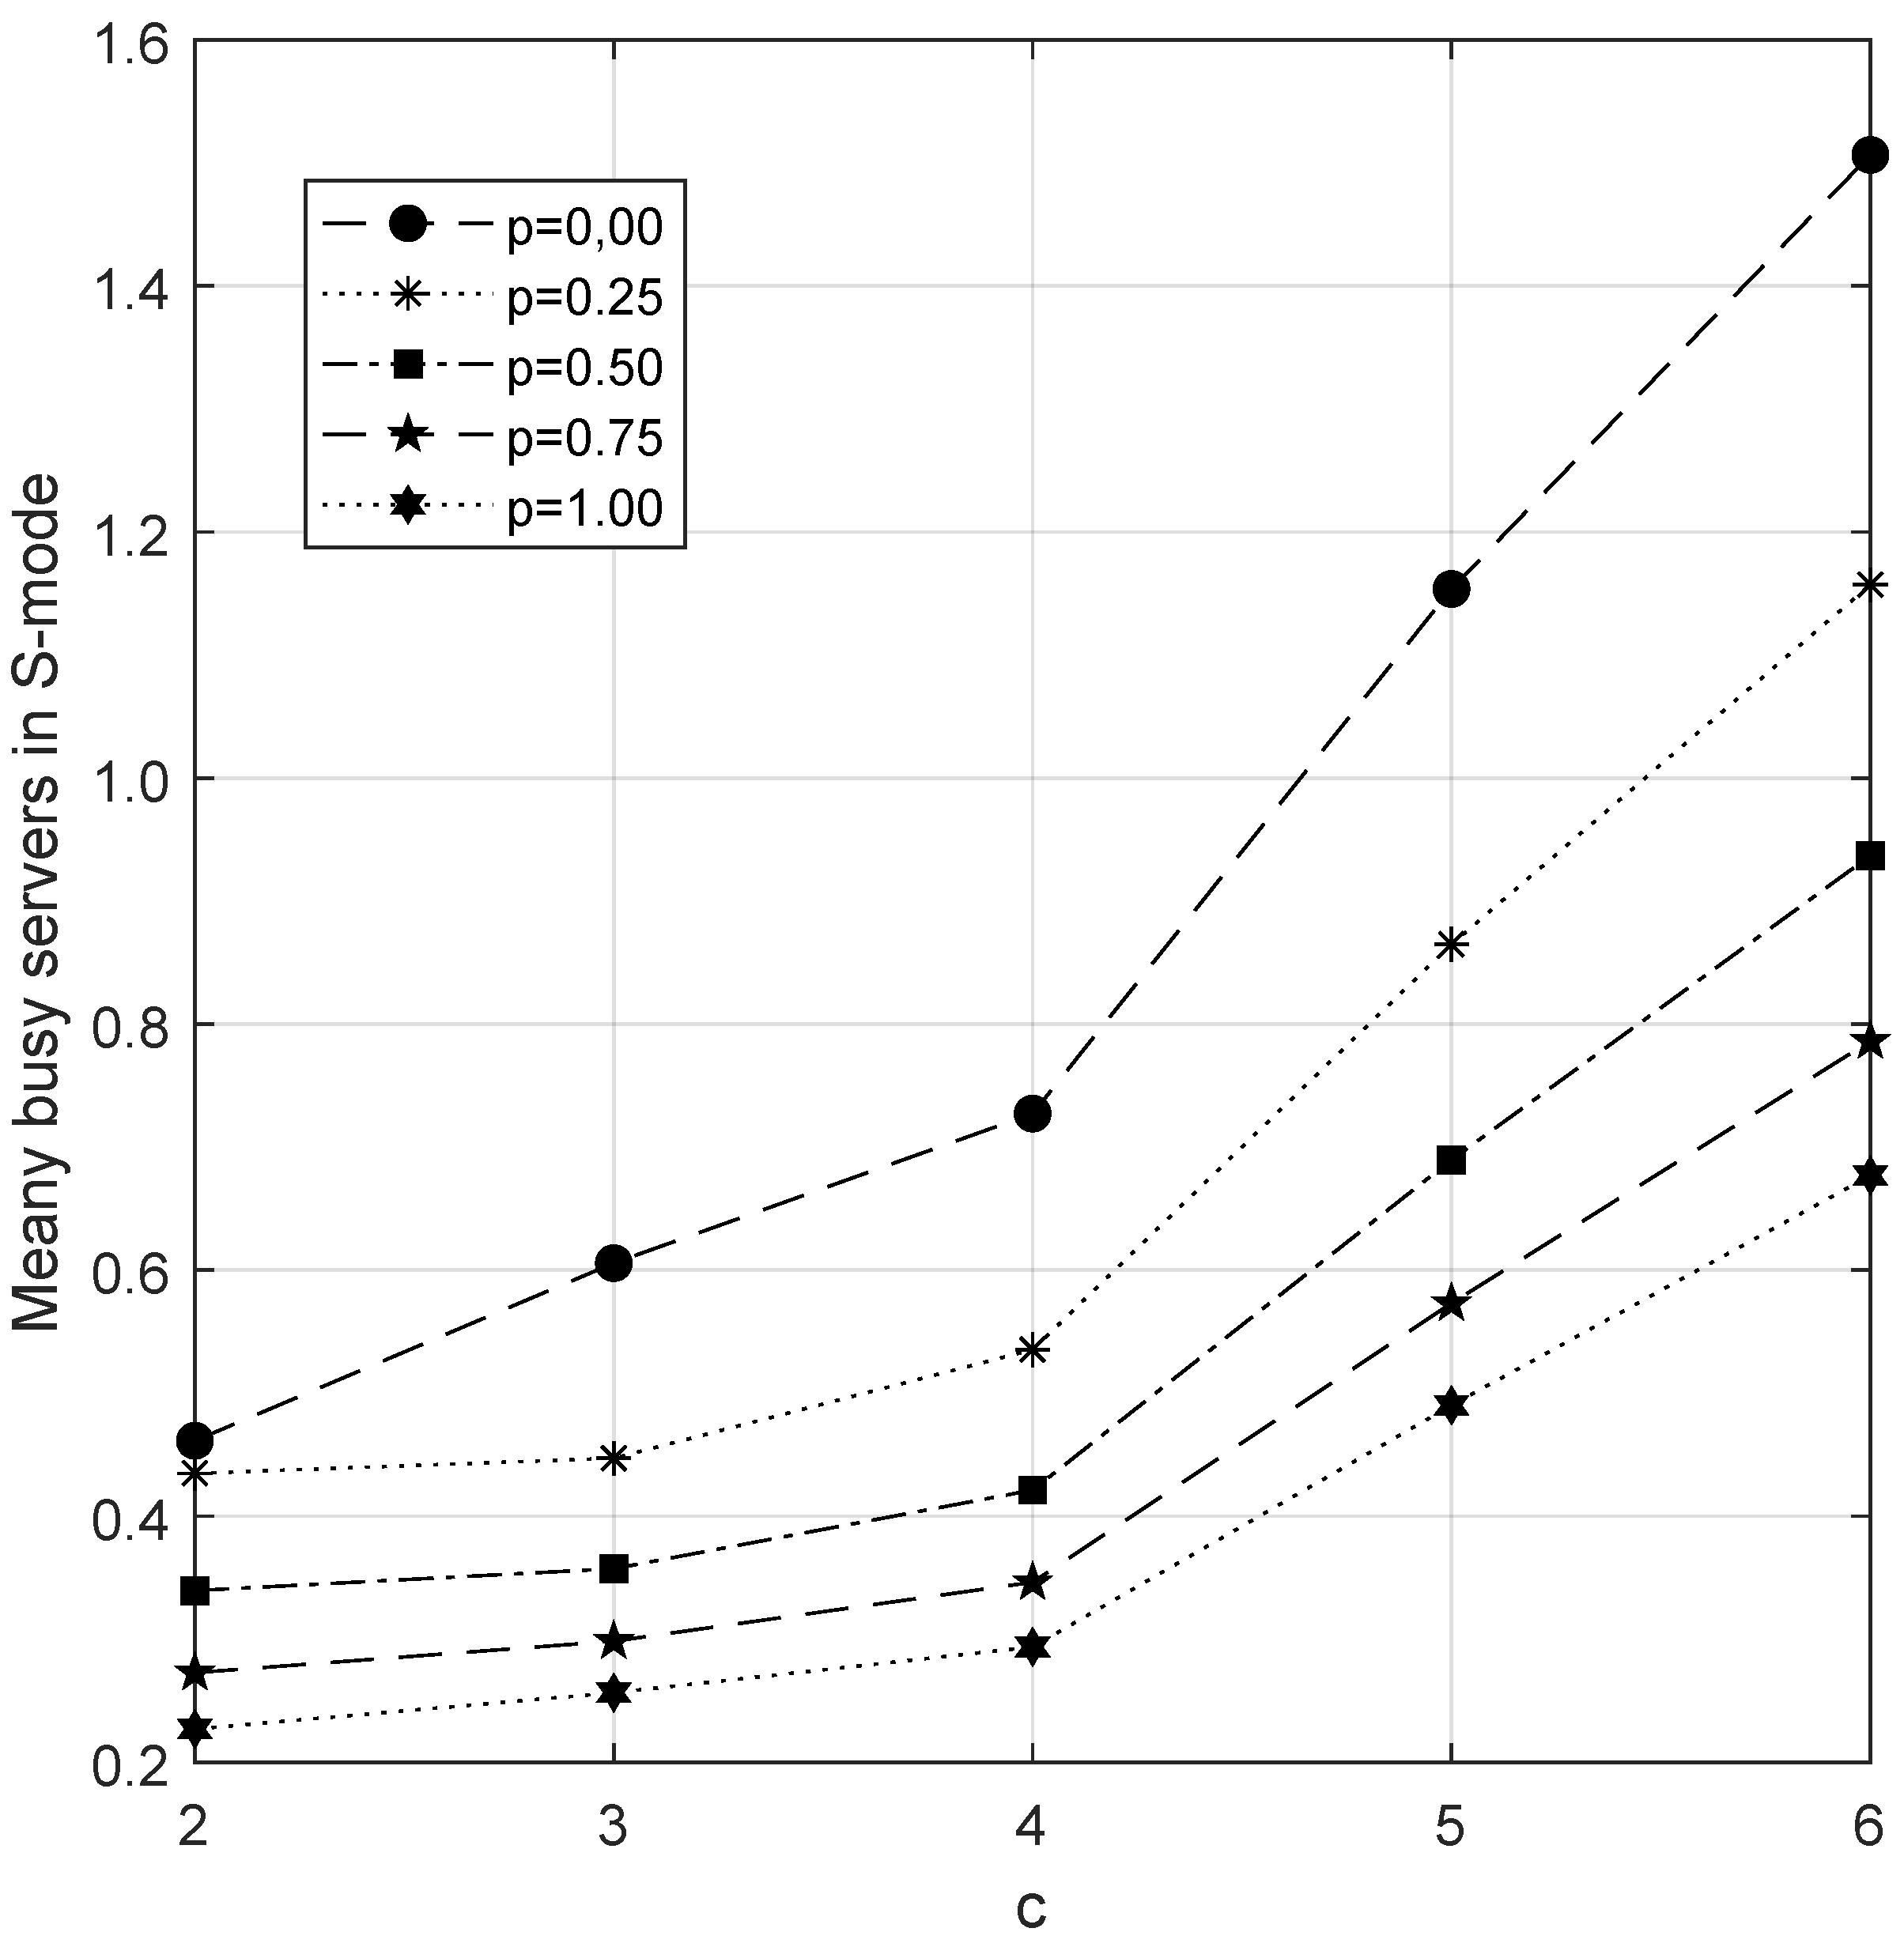
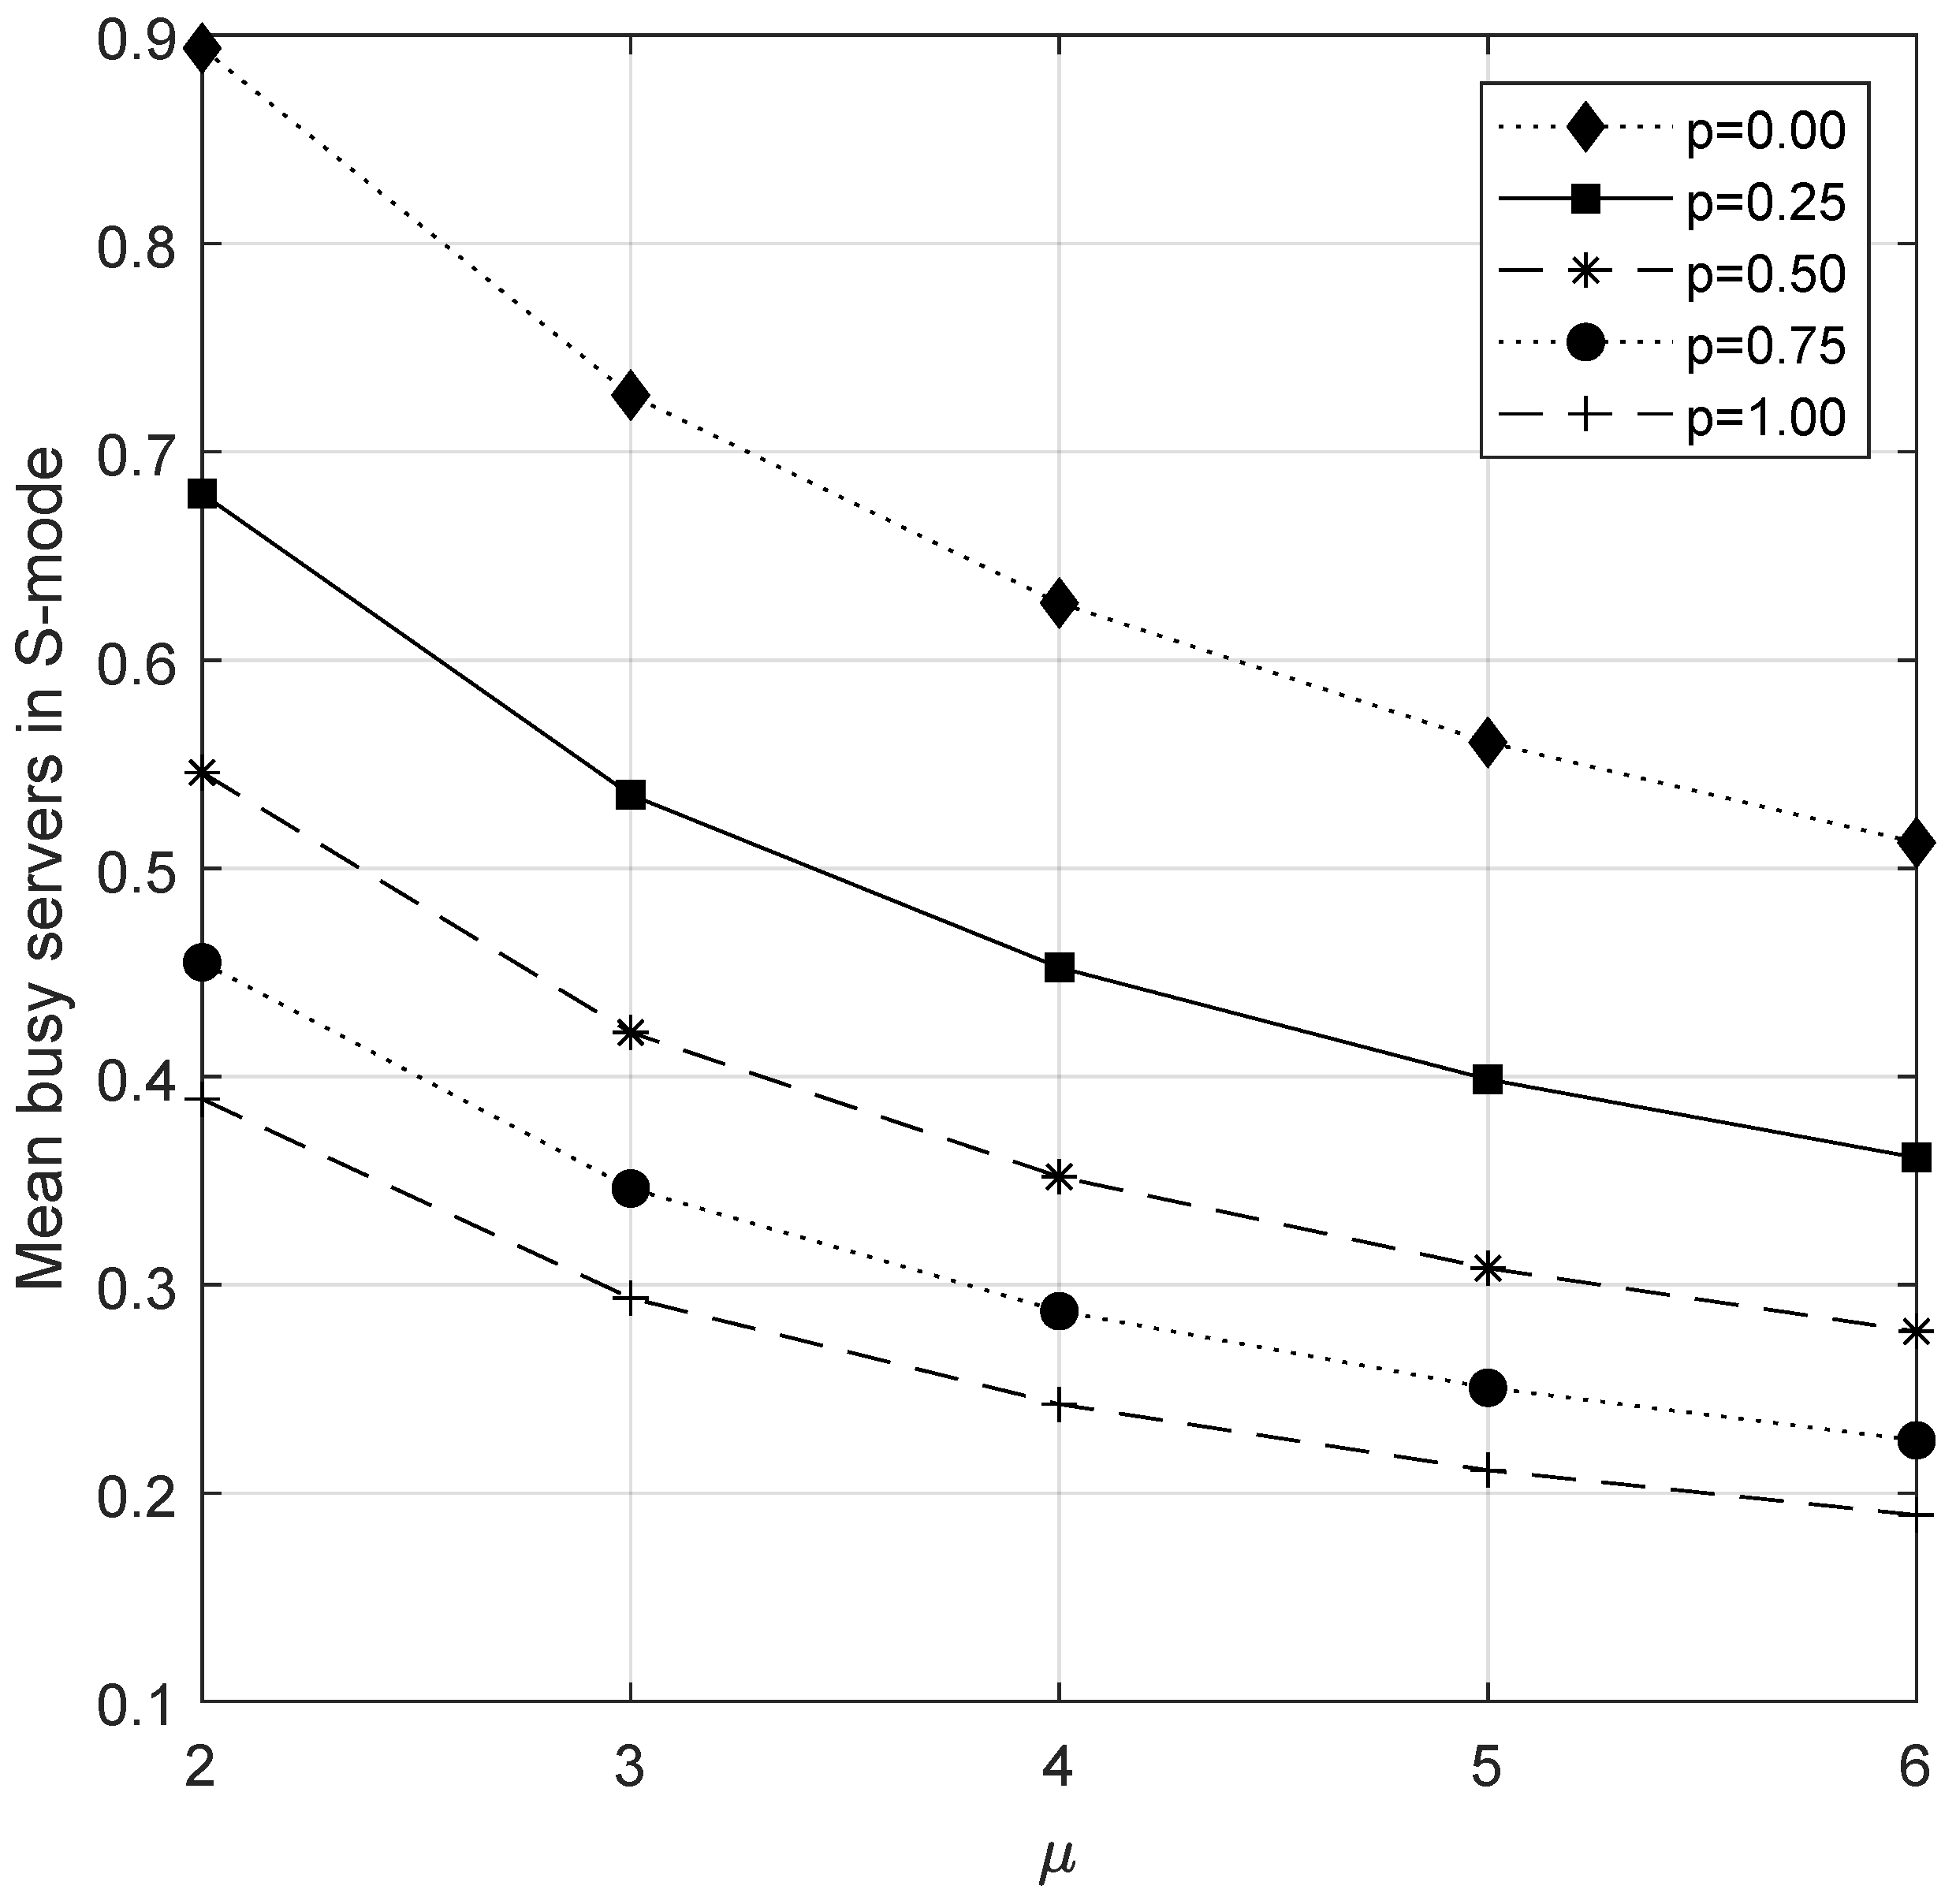
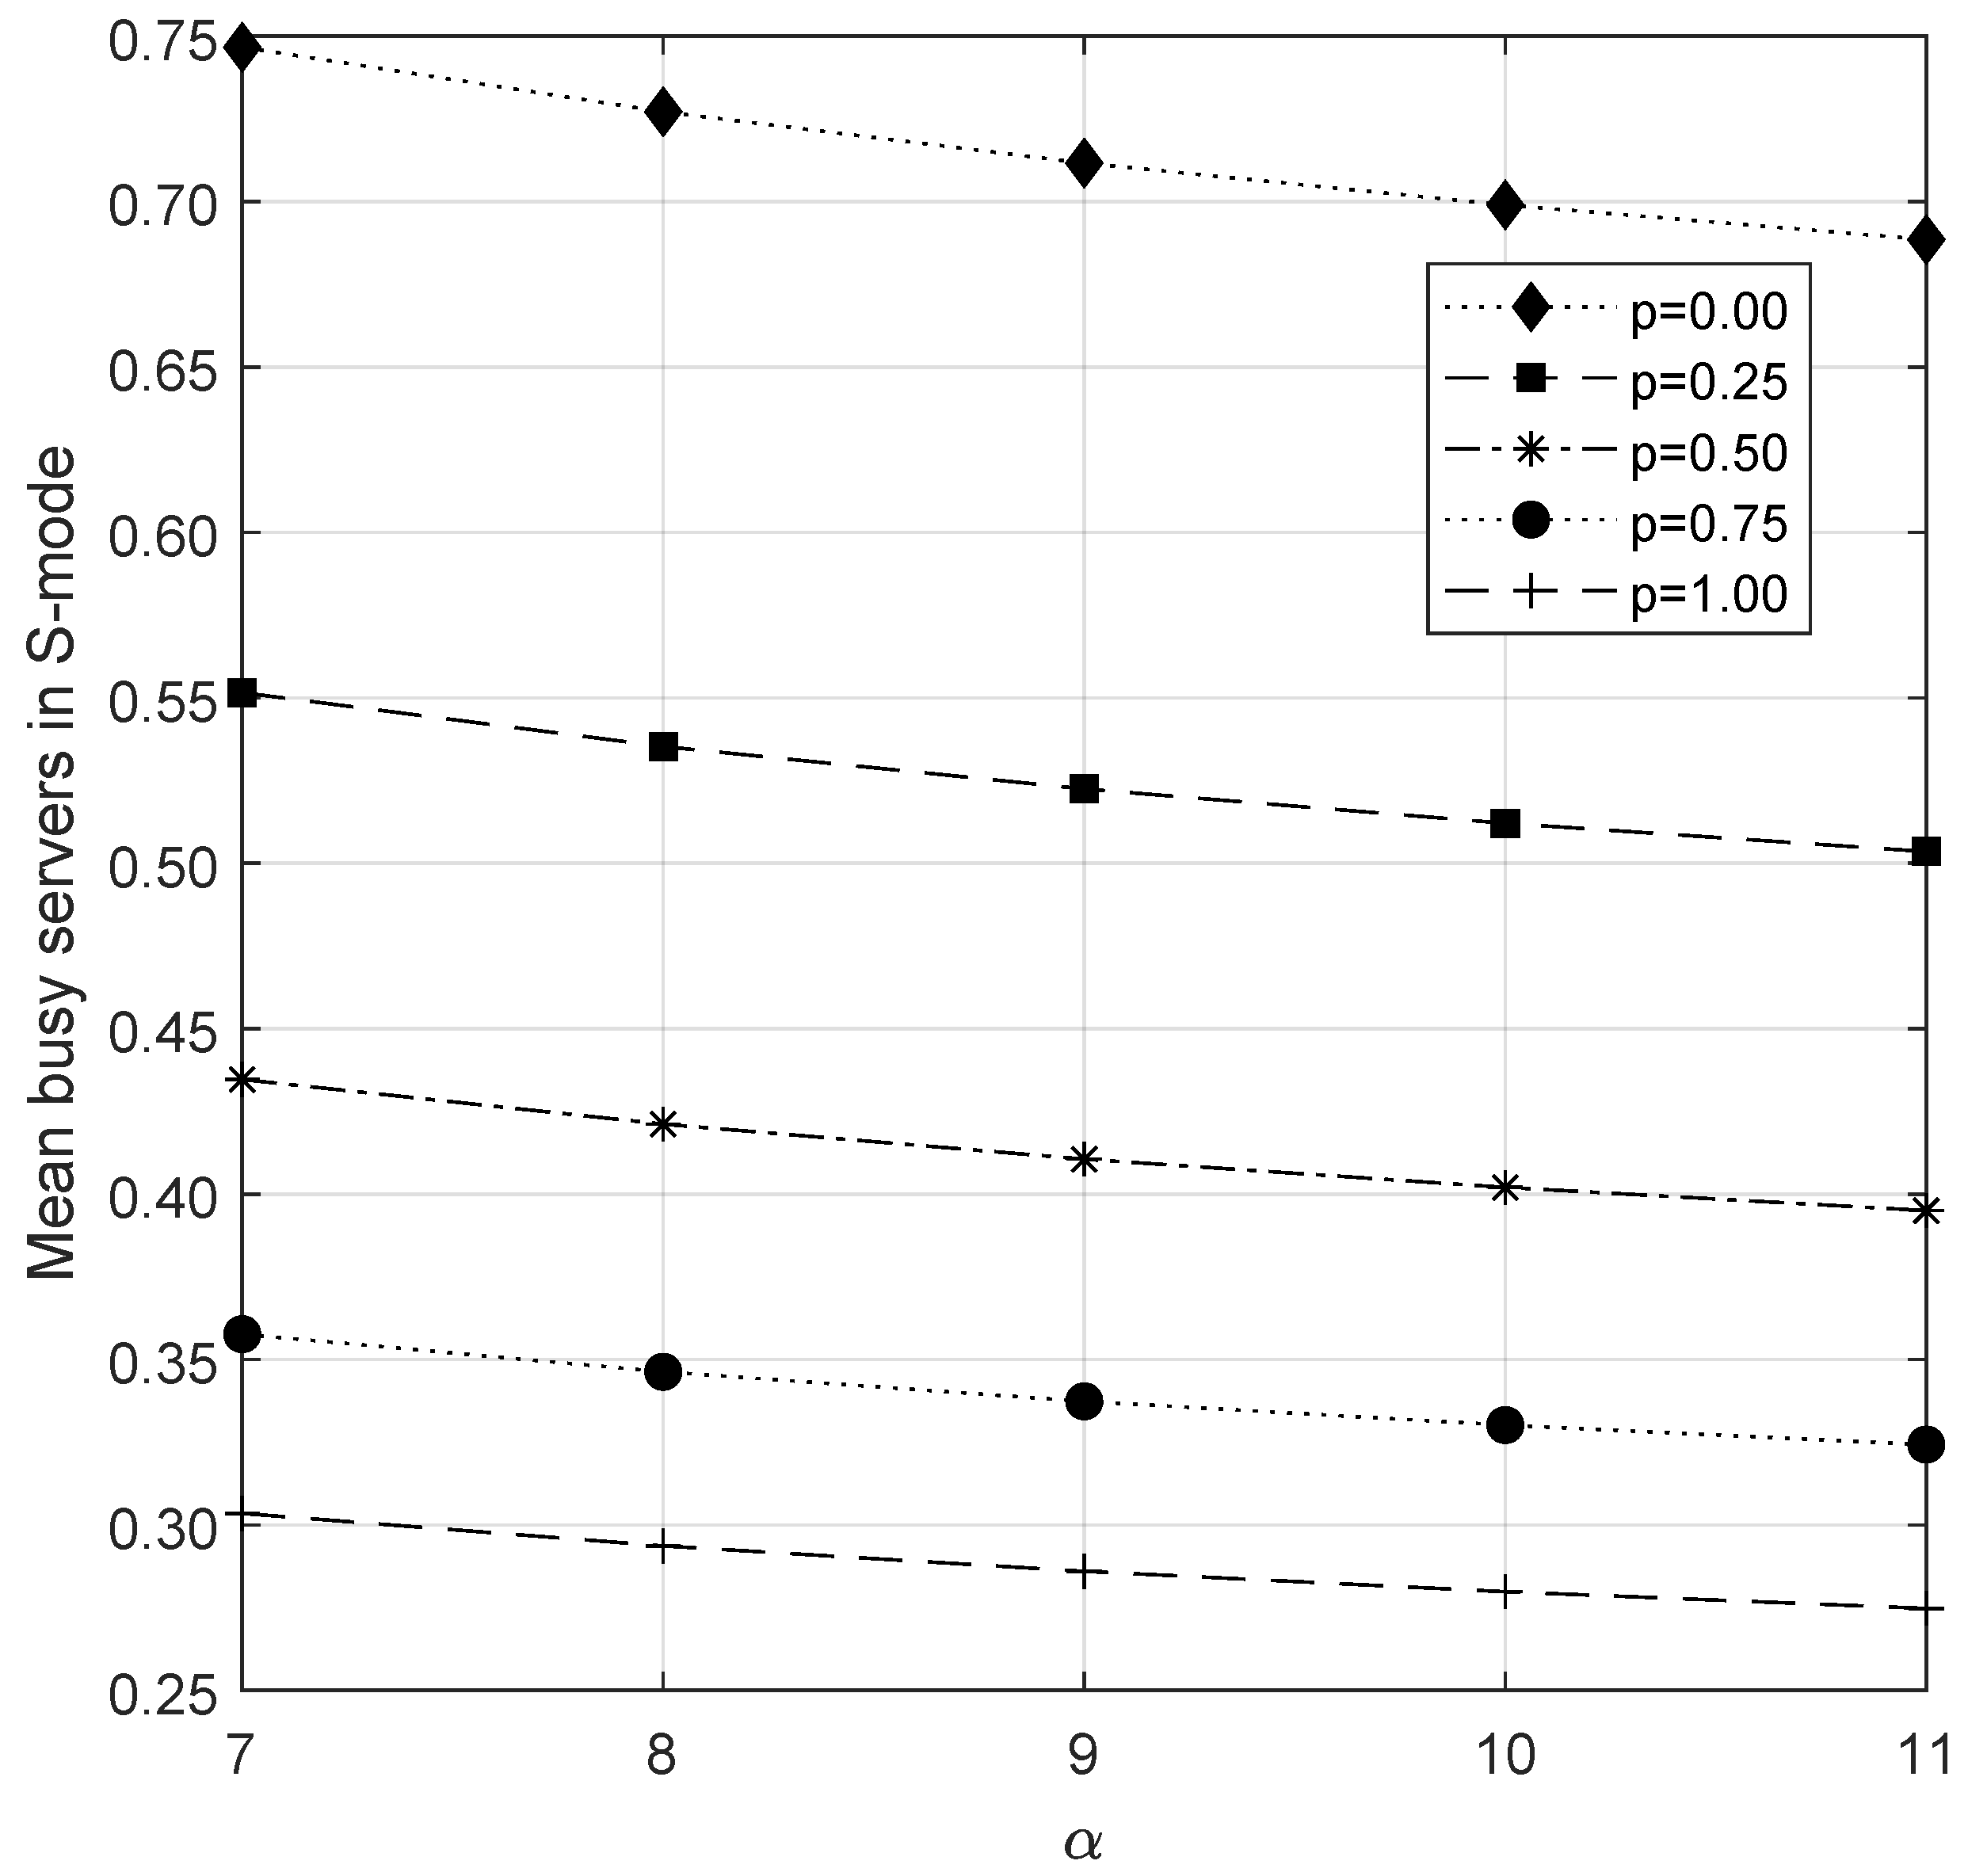
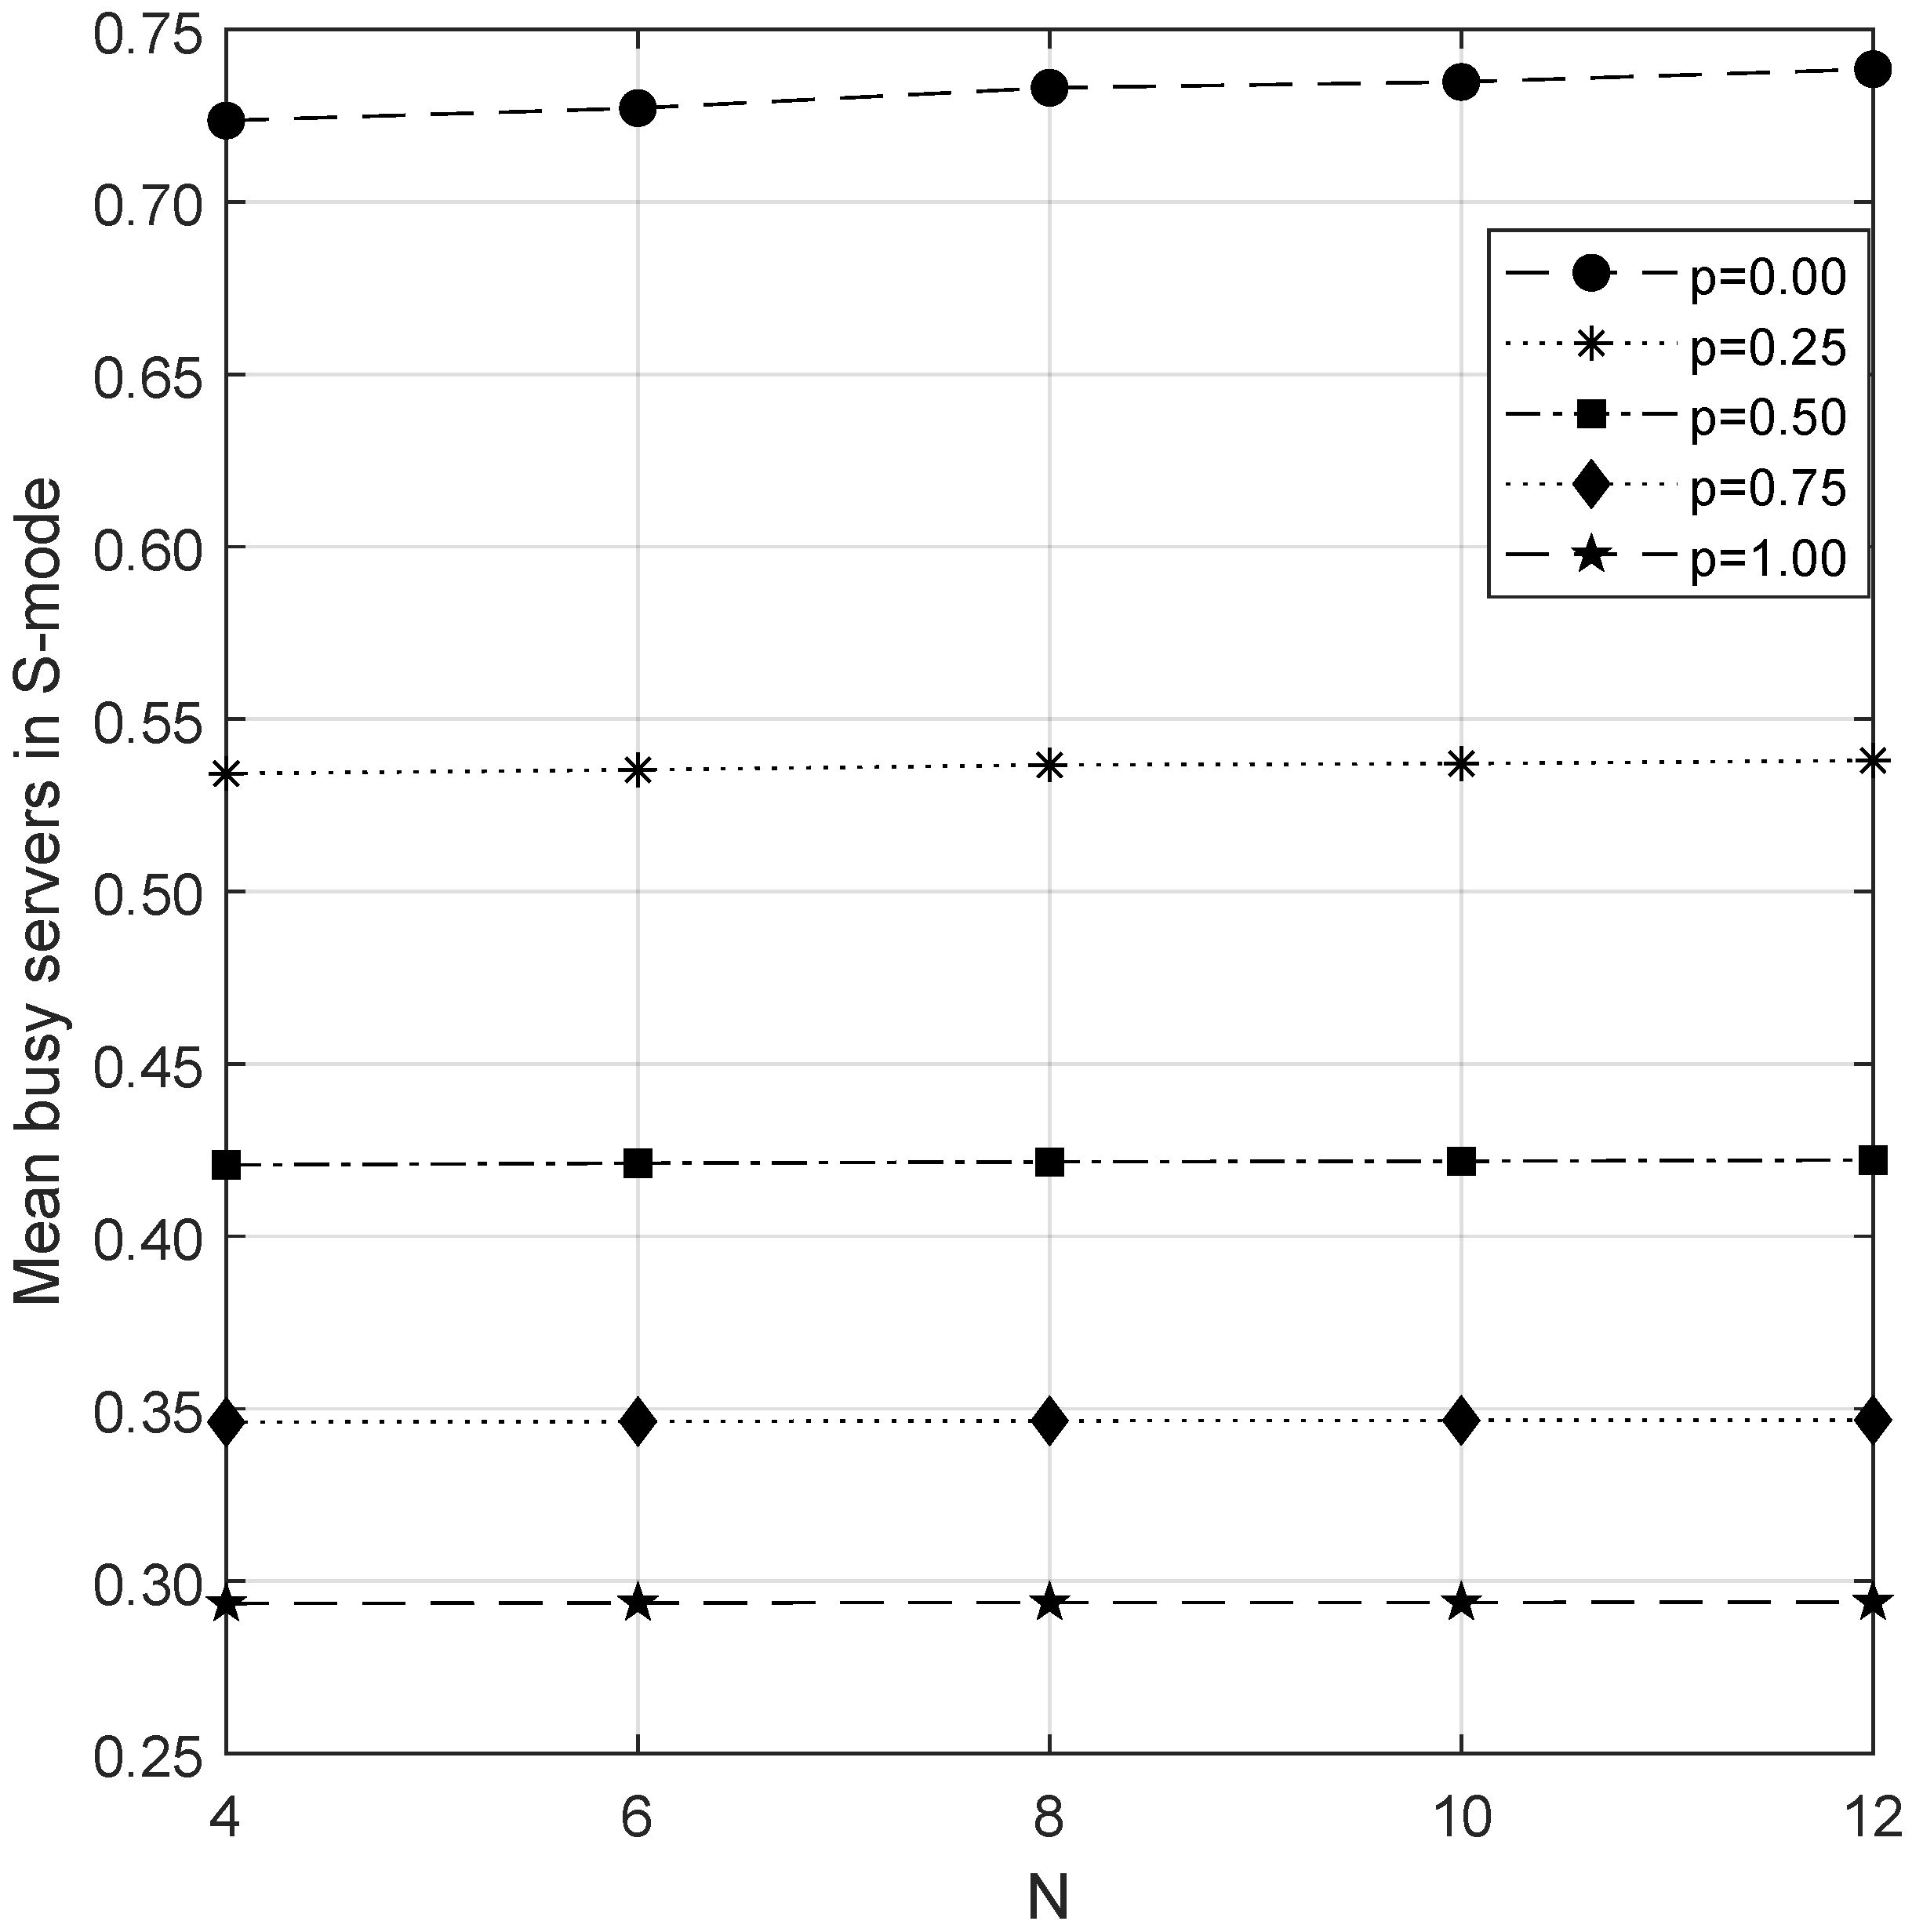
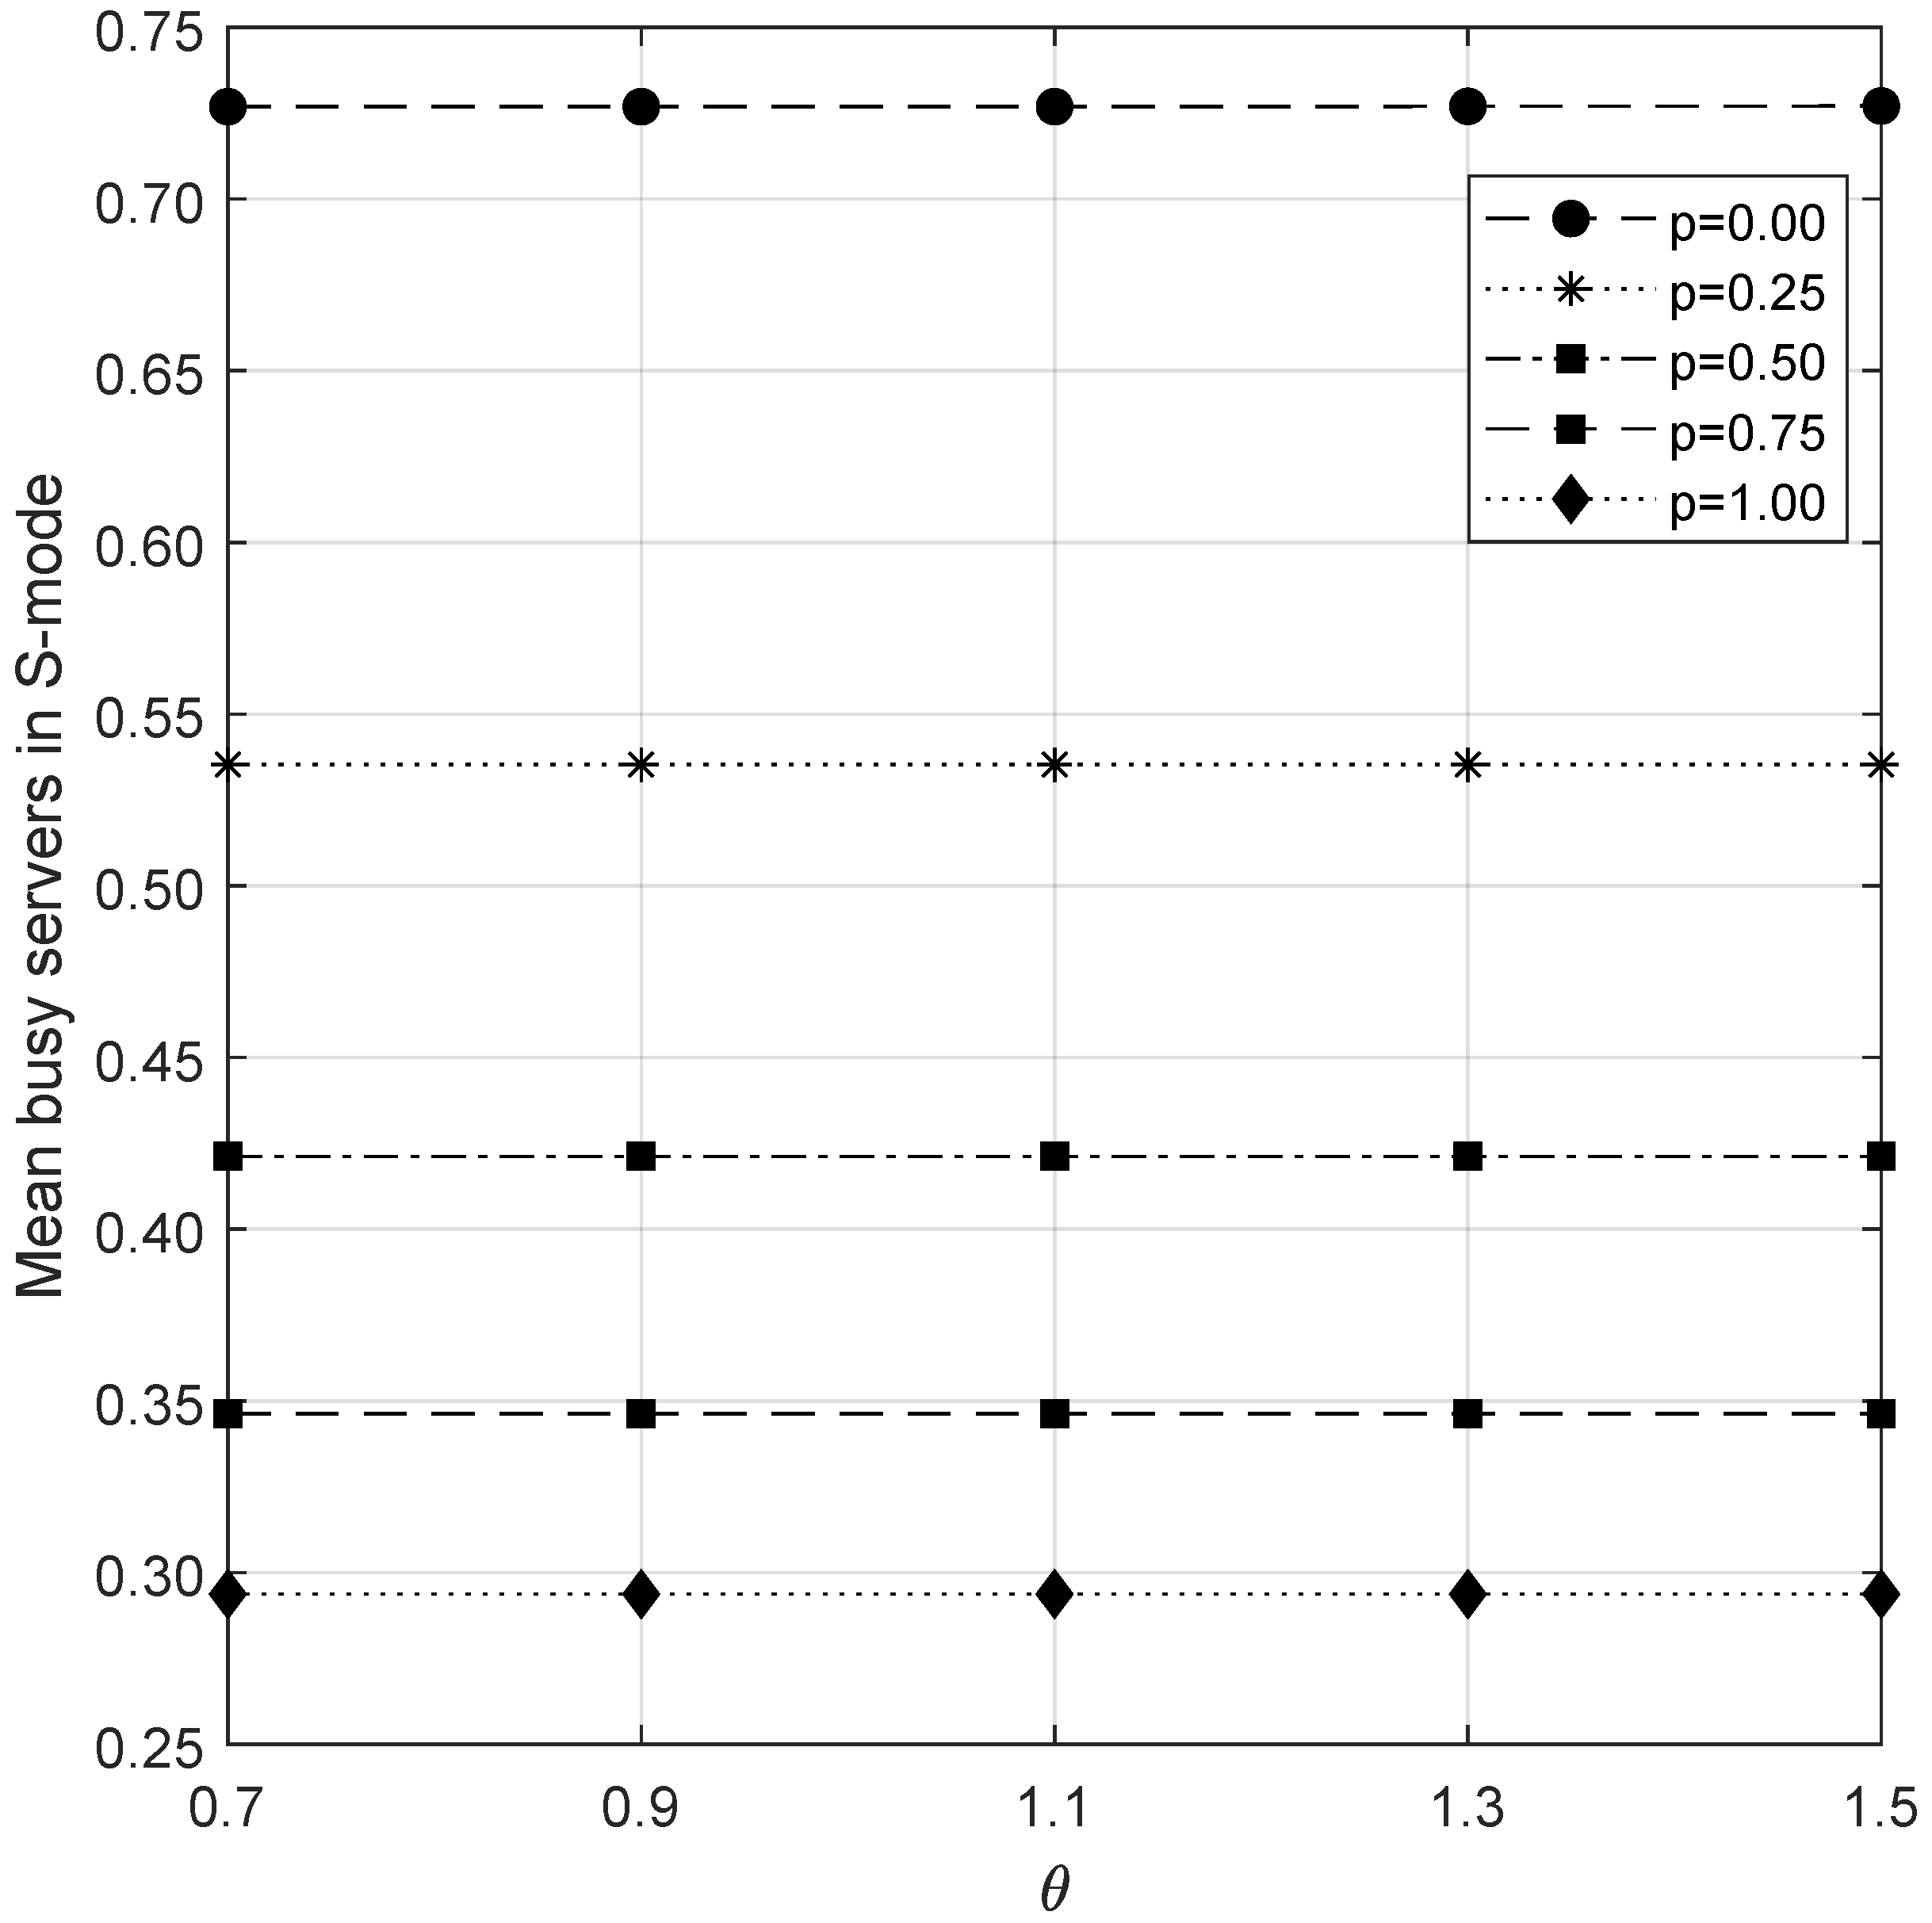
6.5. Analysis of Busy Junior Servers in S-Mode

This section analyzes the impact of parameters on the busy junior servers in server mode, which are displayed in Figure 3, Figure 4, Figure 5, Figure 6, Figure 7, Figure 8 and Figure 9. The observation of the parameters are given below:
  • As arrivals increase, Z 3 rises. This, in turn, raises the probability of junior servers being in S-mode.
  • Similarly, when the retrial rate θ is raised, orbital customers have a higher chance of entering the waiting hall. Consequently, there is an uptick in the count of junior servers in S-mode.
  • Increasing the value of c results in a higher average of occupied junior servers. Simultaneously, there is a rise in Z 9 with an increase in c.
  • Expanding the capacity of the waiting hall leads to a corresponding increase in the number of occupied servers in S-mode due to the upswing in the average number of servers in S-mode.
  • With an increase in the service rates for both senior and junior servers, Z 9 decreases due to the reduction in average service time per customer.
  • An increase in the rate β consistently leads to a reduction in lead time. Consequently, there is a decrease that can be seen in Z 9 .
  • An examination of the effect of varying the probability p in combination with each parameter consistently reveals a decrease in the number of junior servers in S-mode.
In service mode, the number of servers can vary based on factors such as demand patterns, time of day, or operational decisions. Having the flexibility to adjust the number of servers allows for responsiveness to the changing levels of demand. Increasing the number of servers during high-demand periods can help manage waiting times and improve customer satisfaction. Conversely, reducing the number of servers during low-demand periods can help optimize resource utilization.

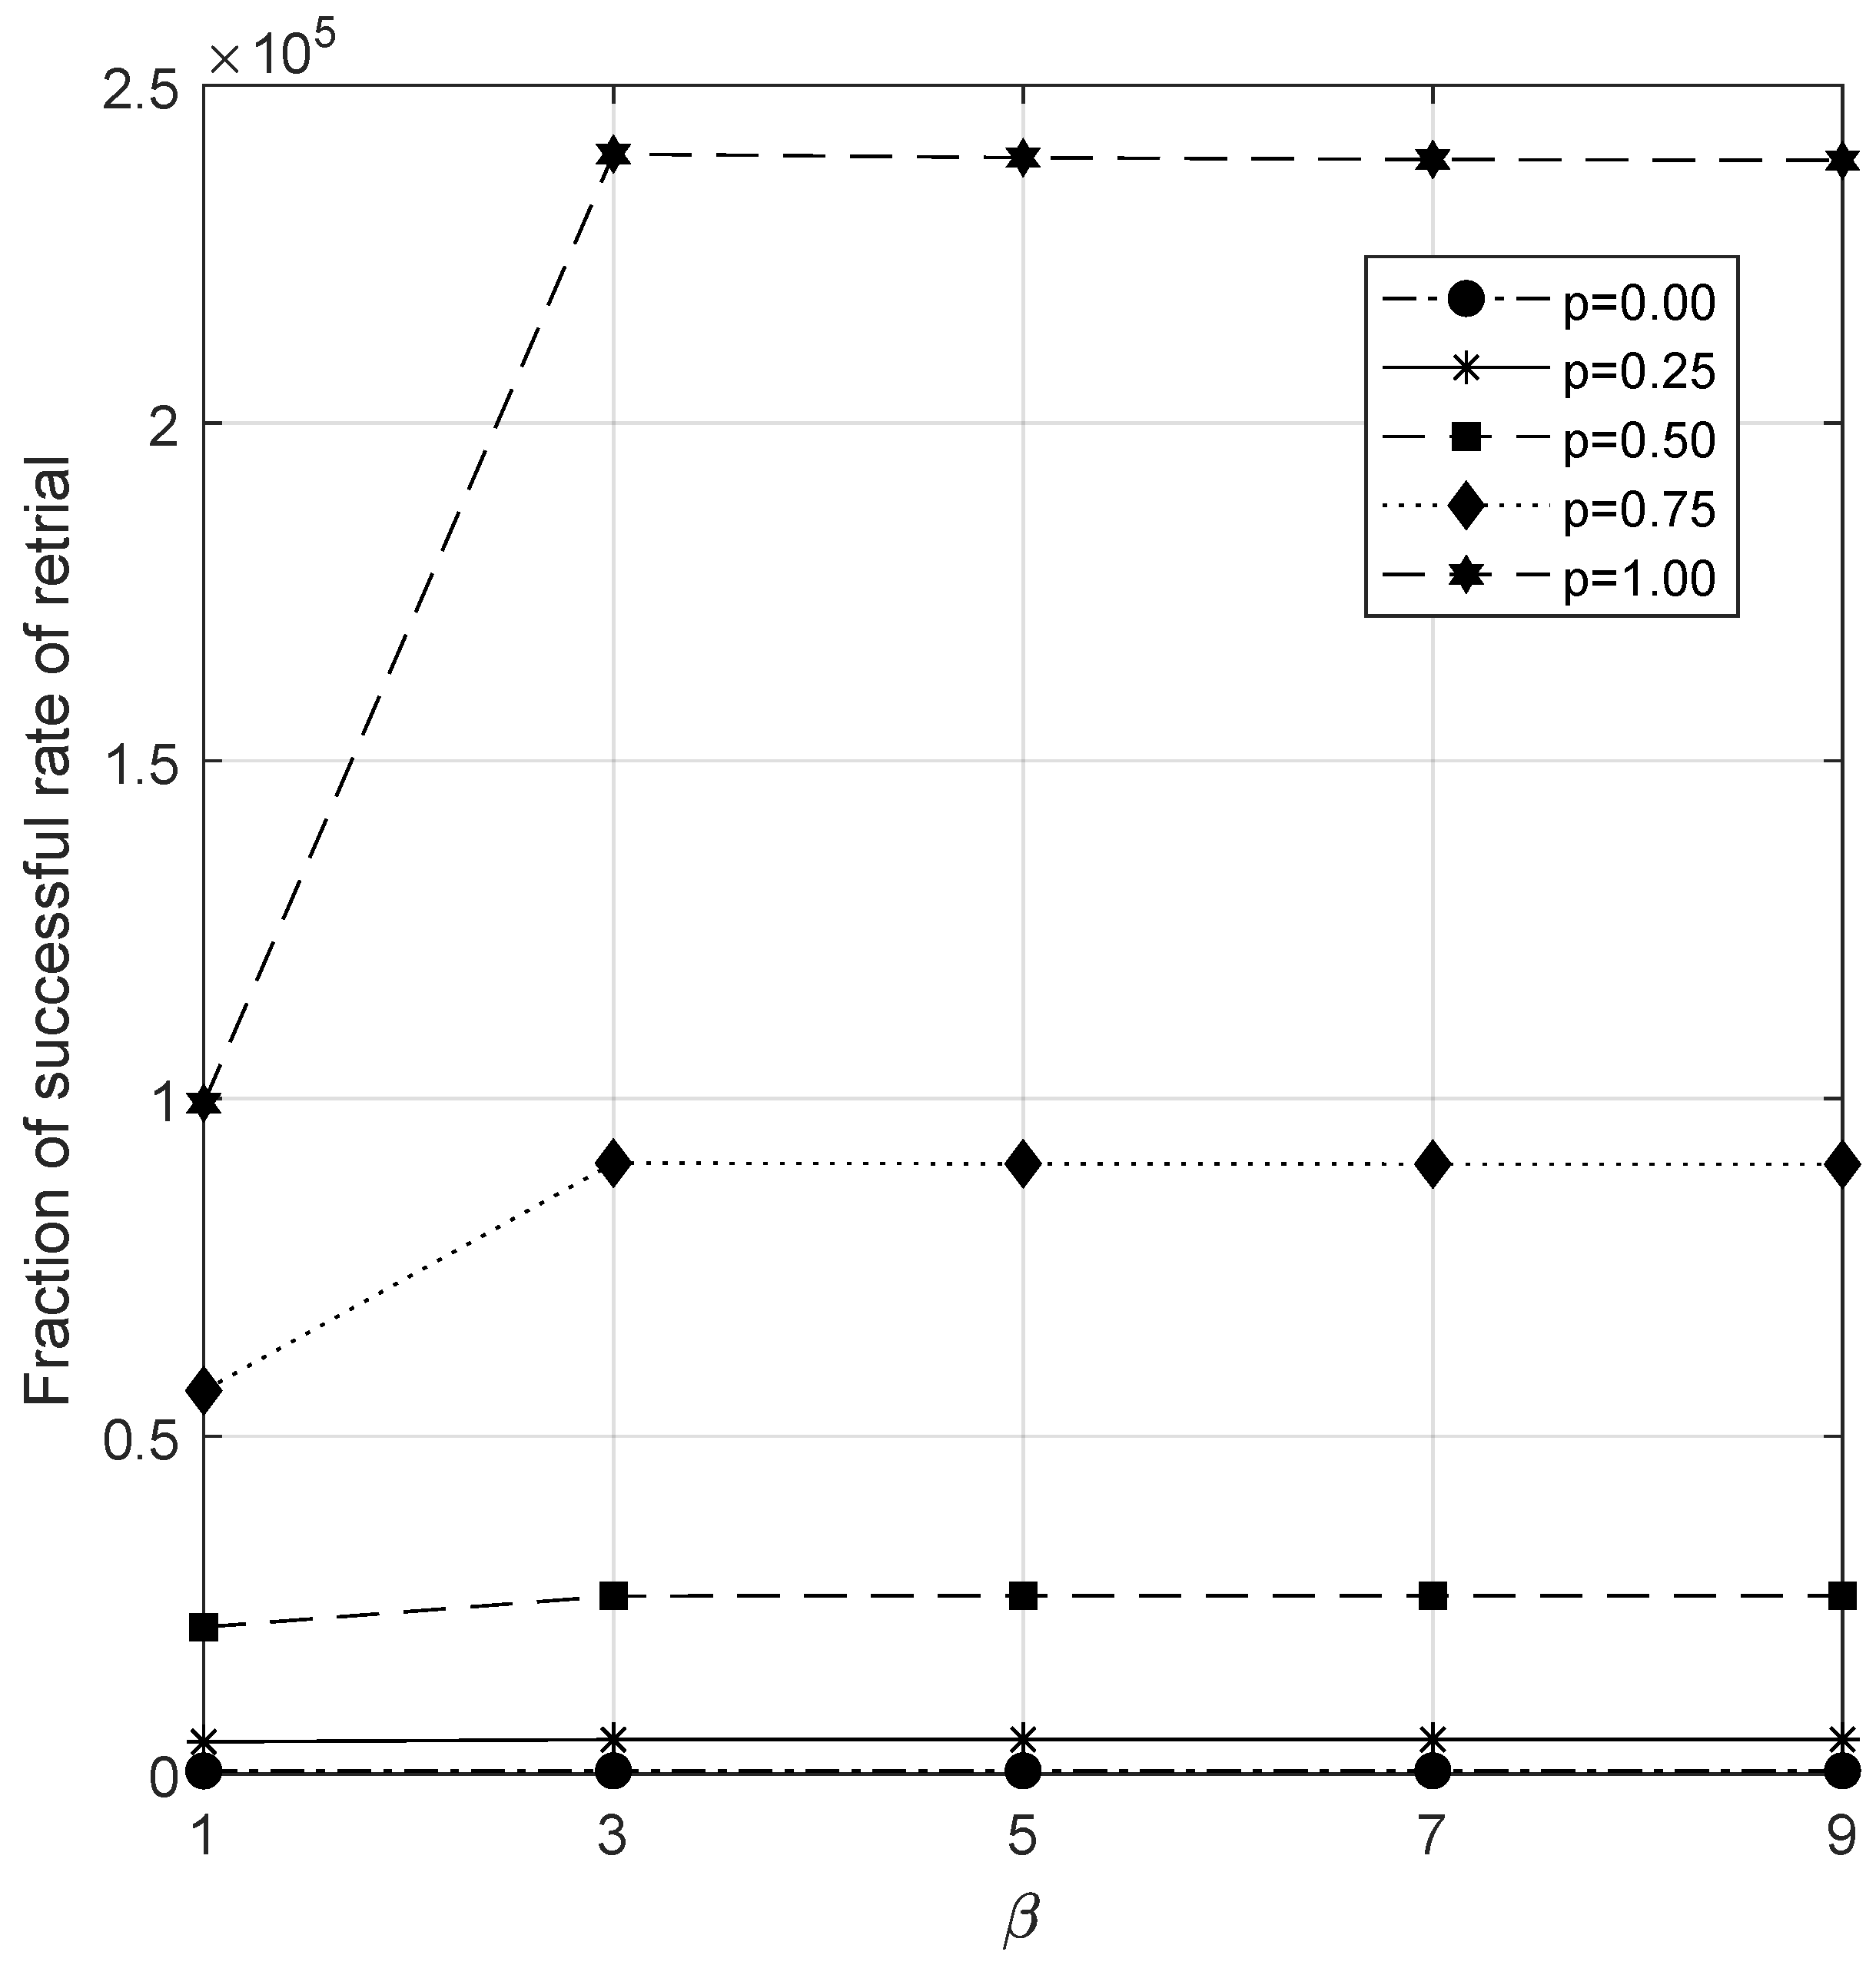
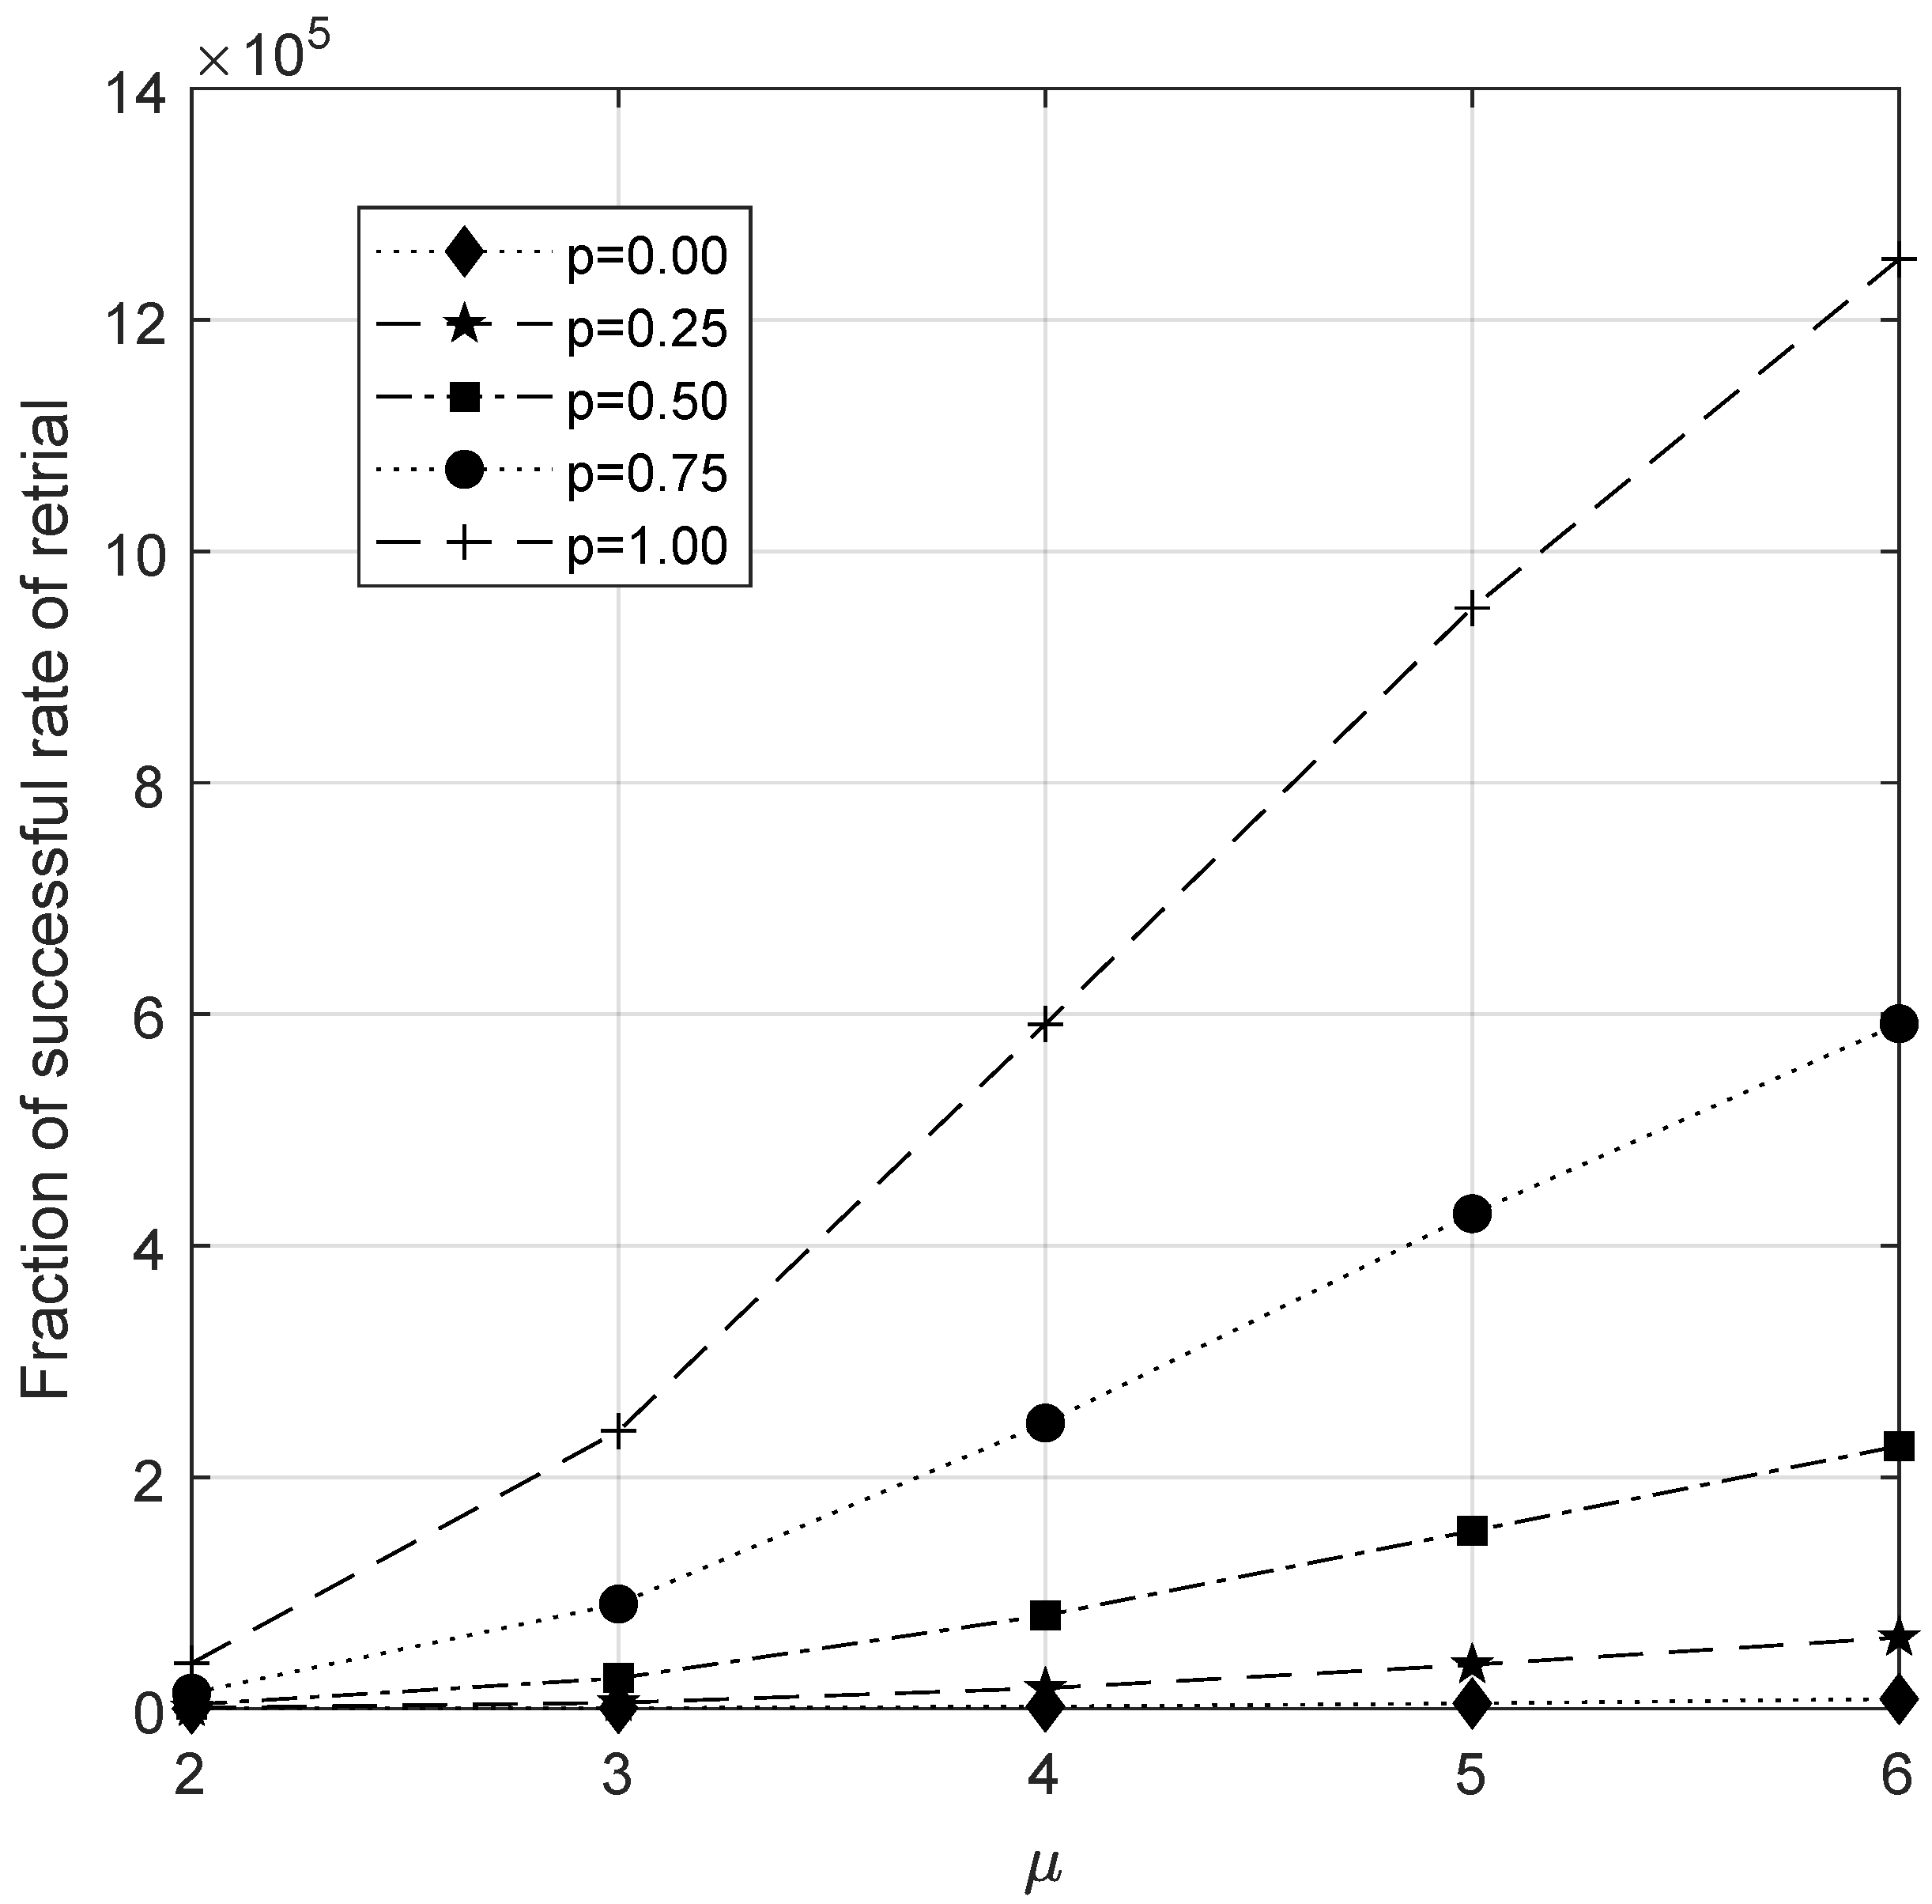
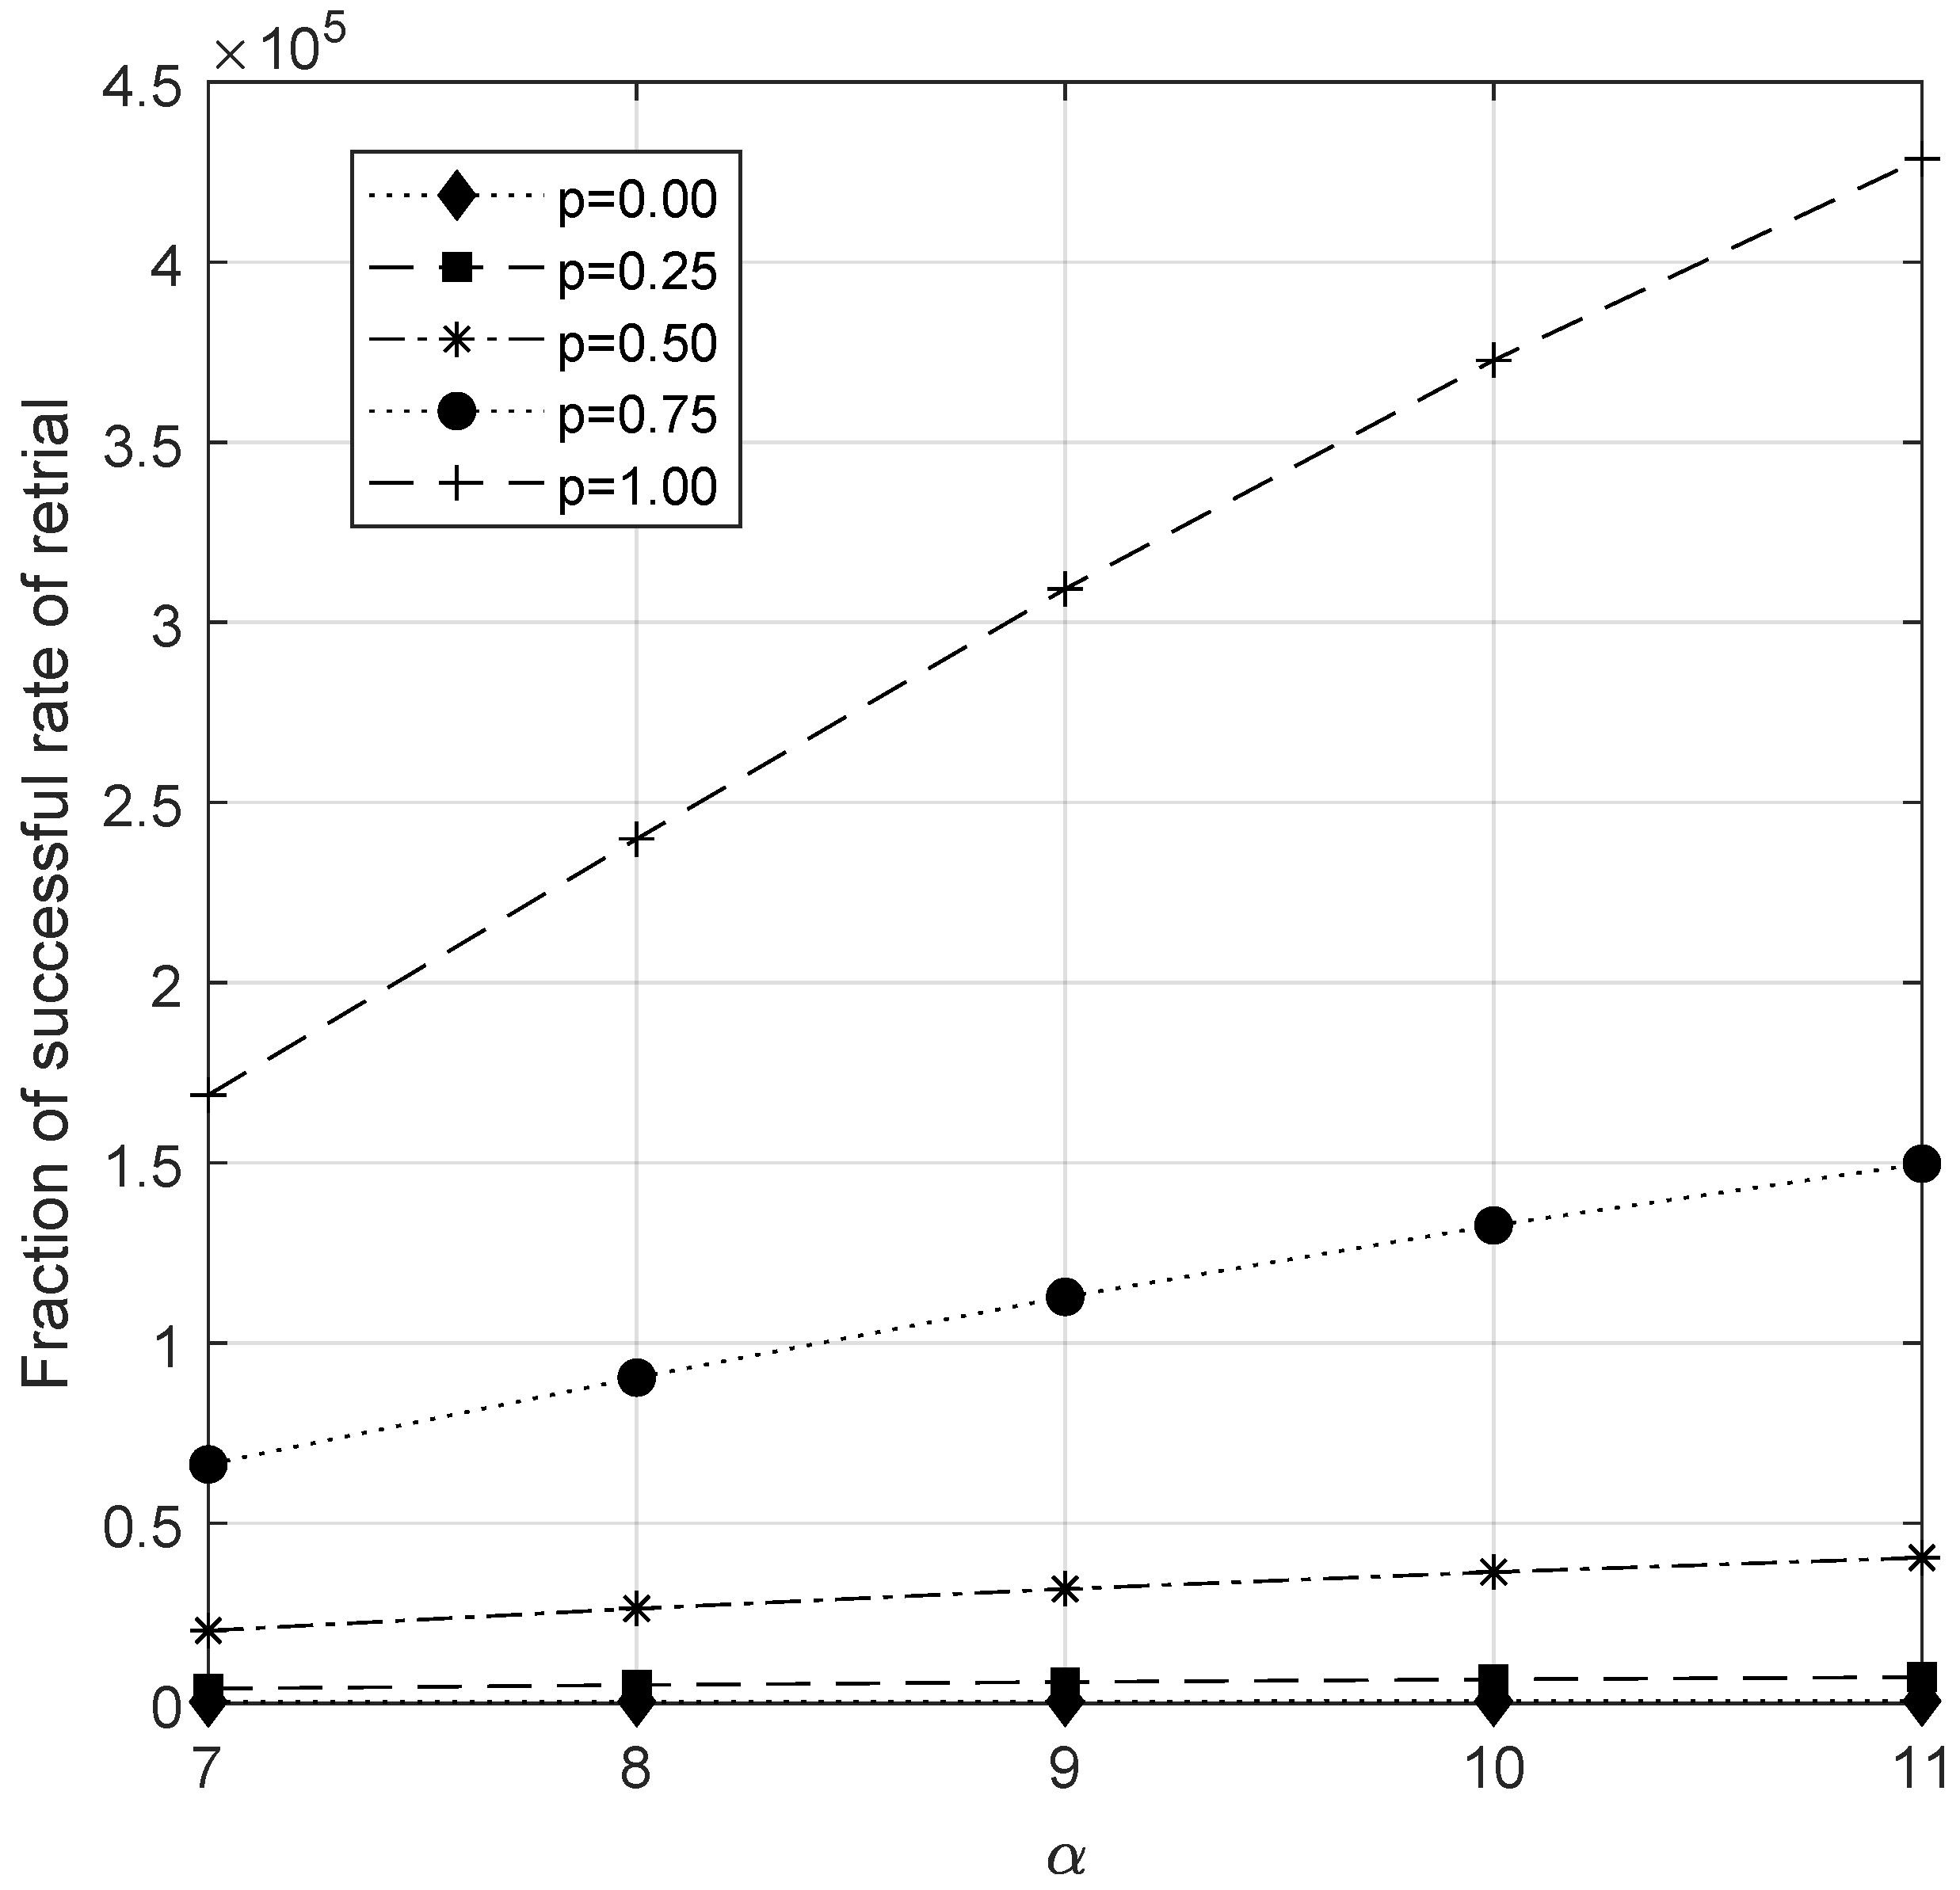
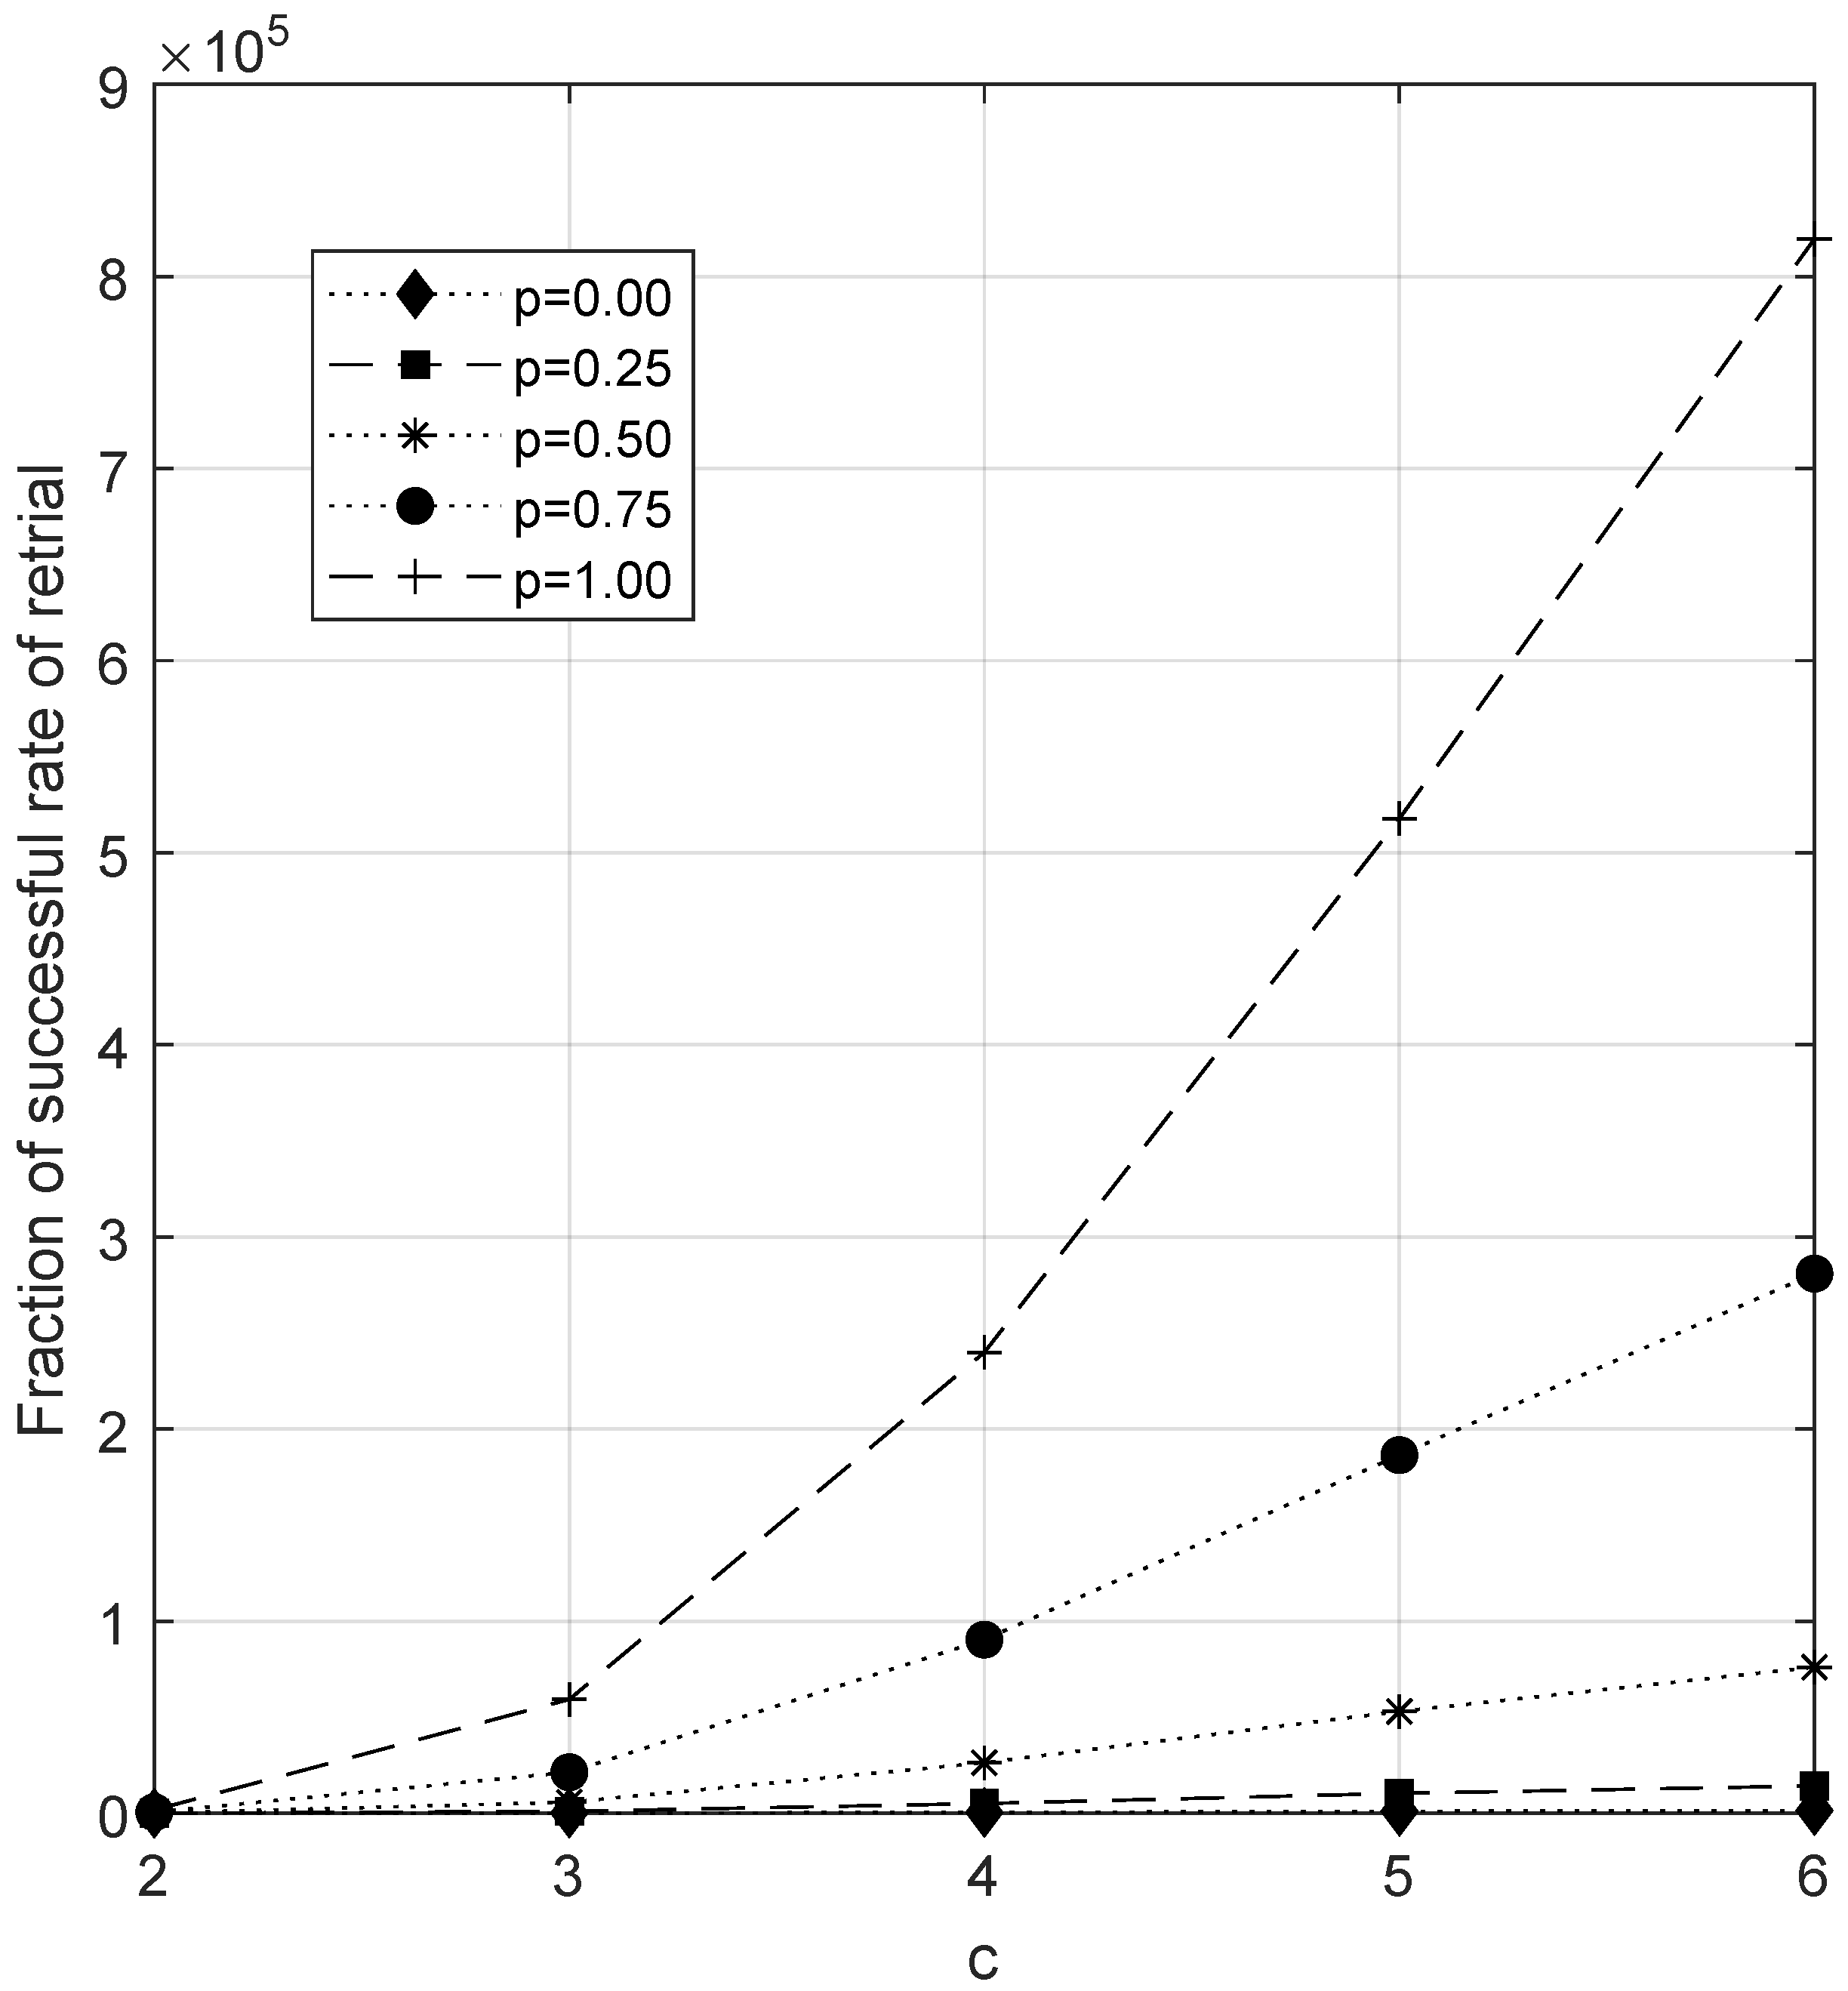
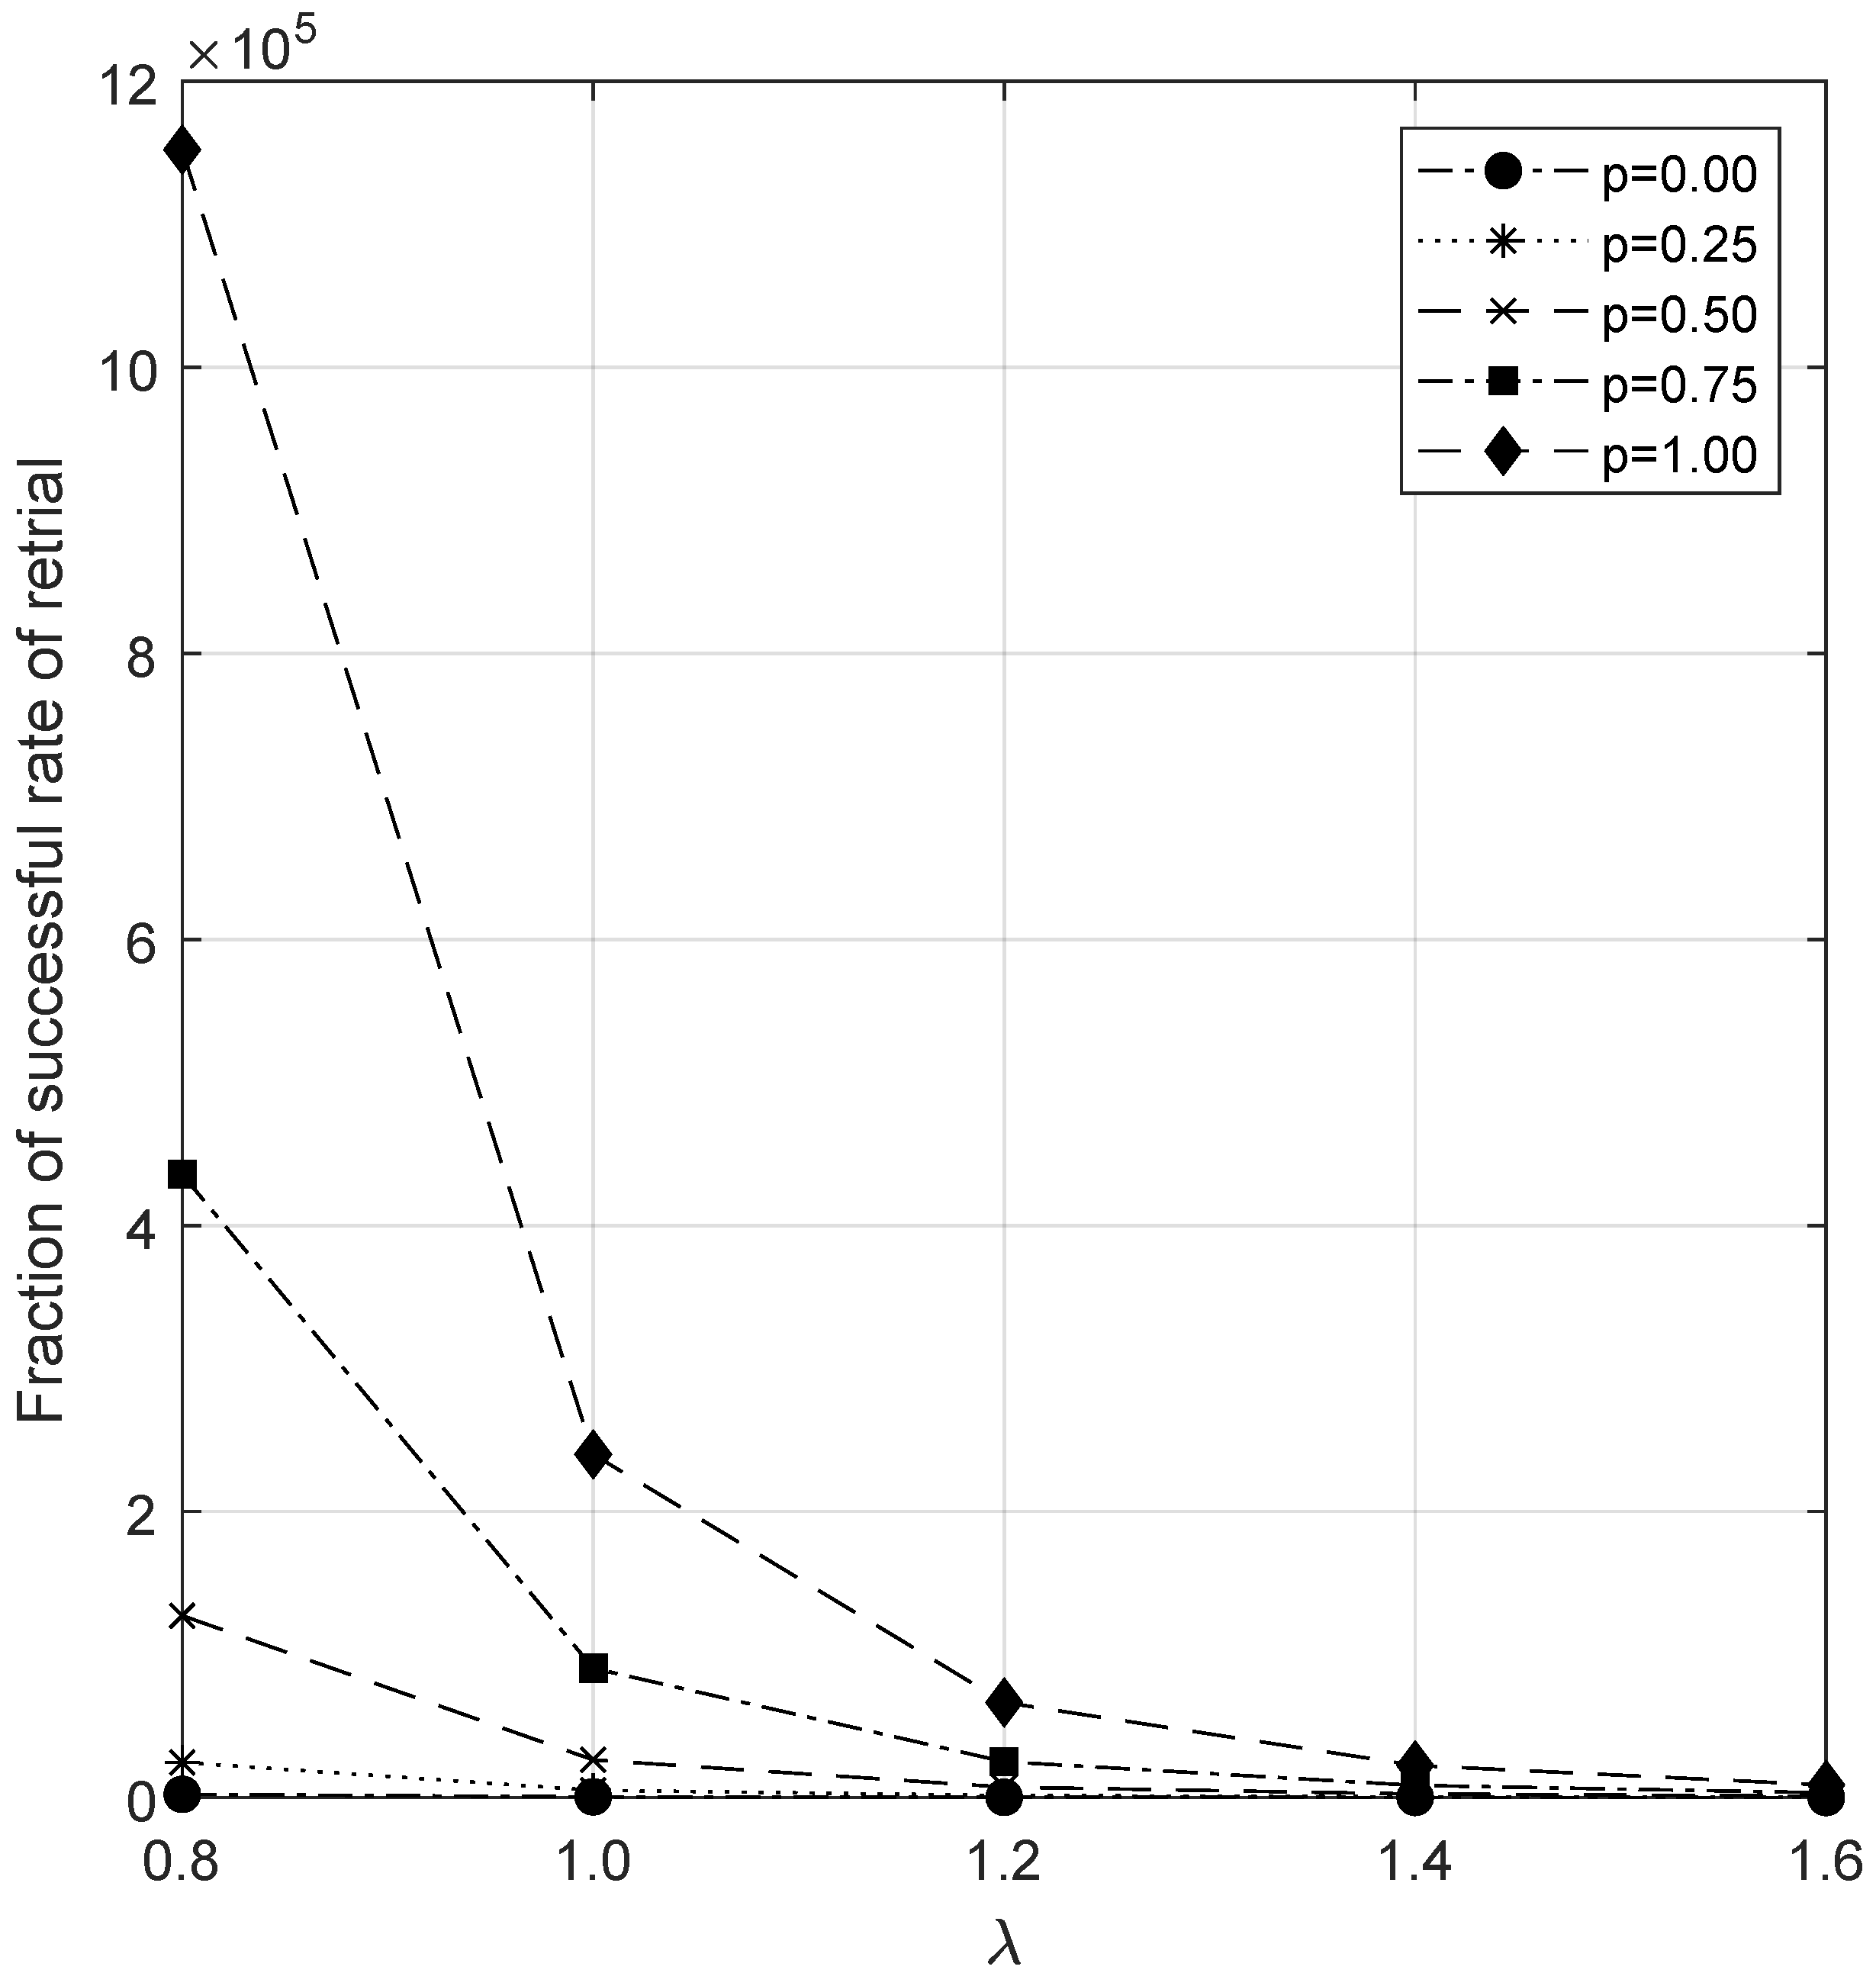
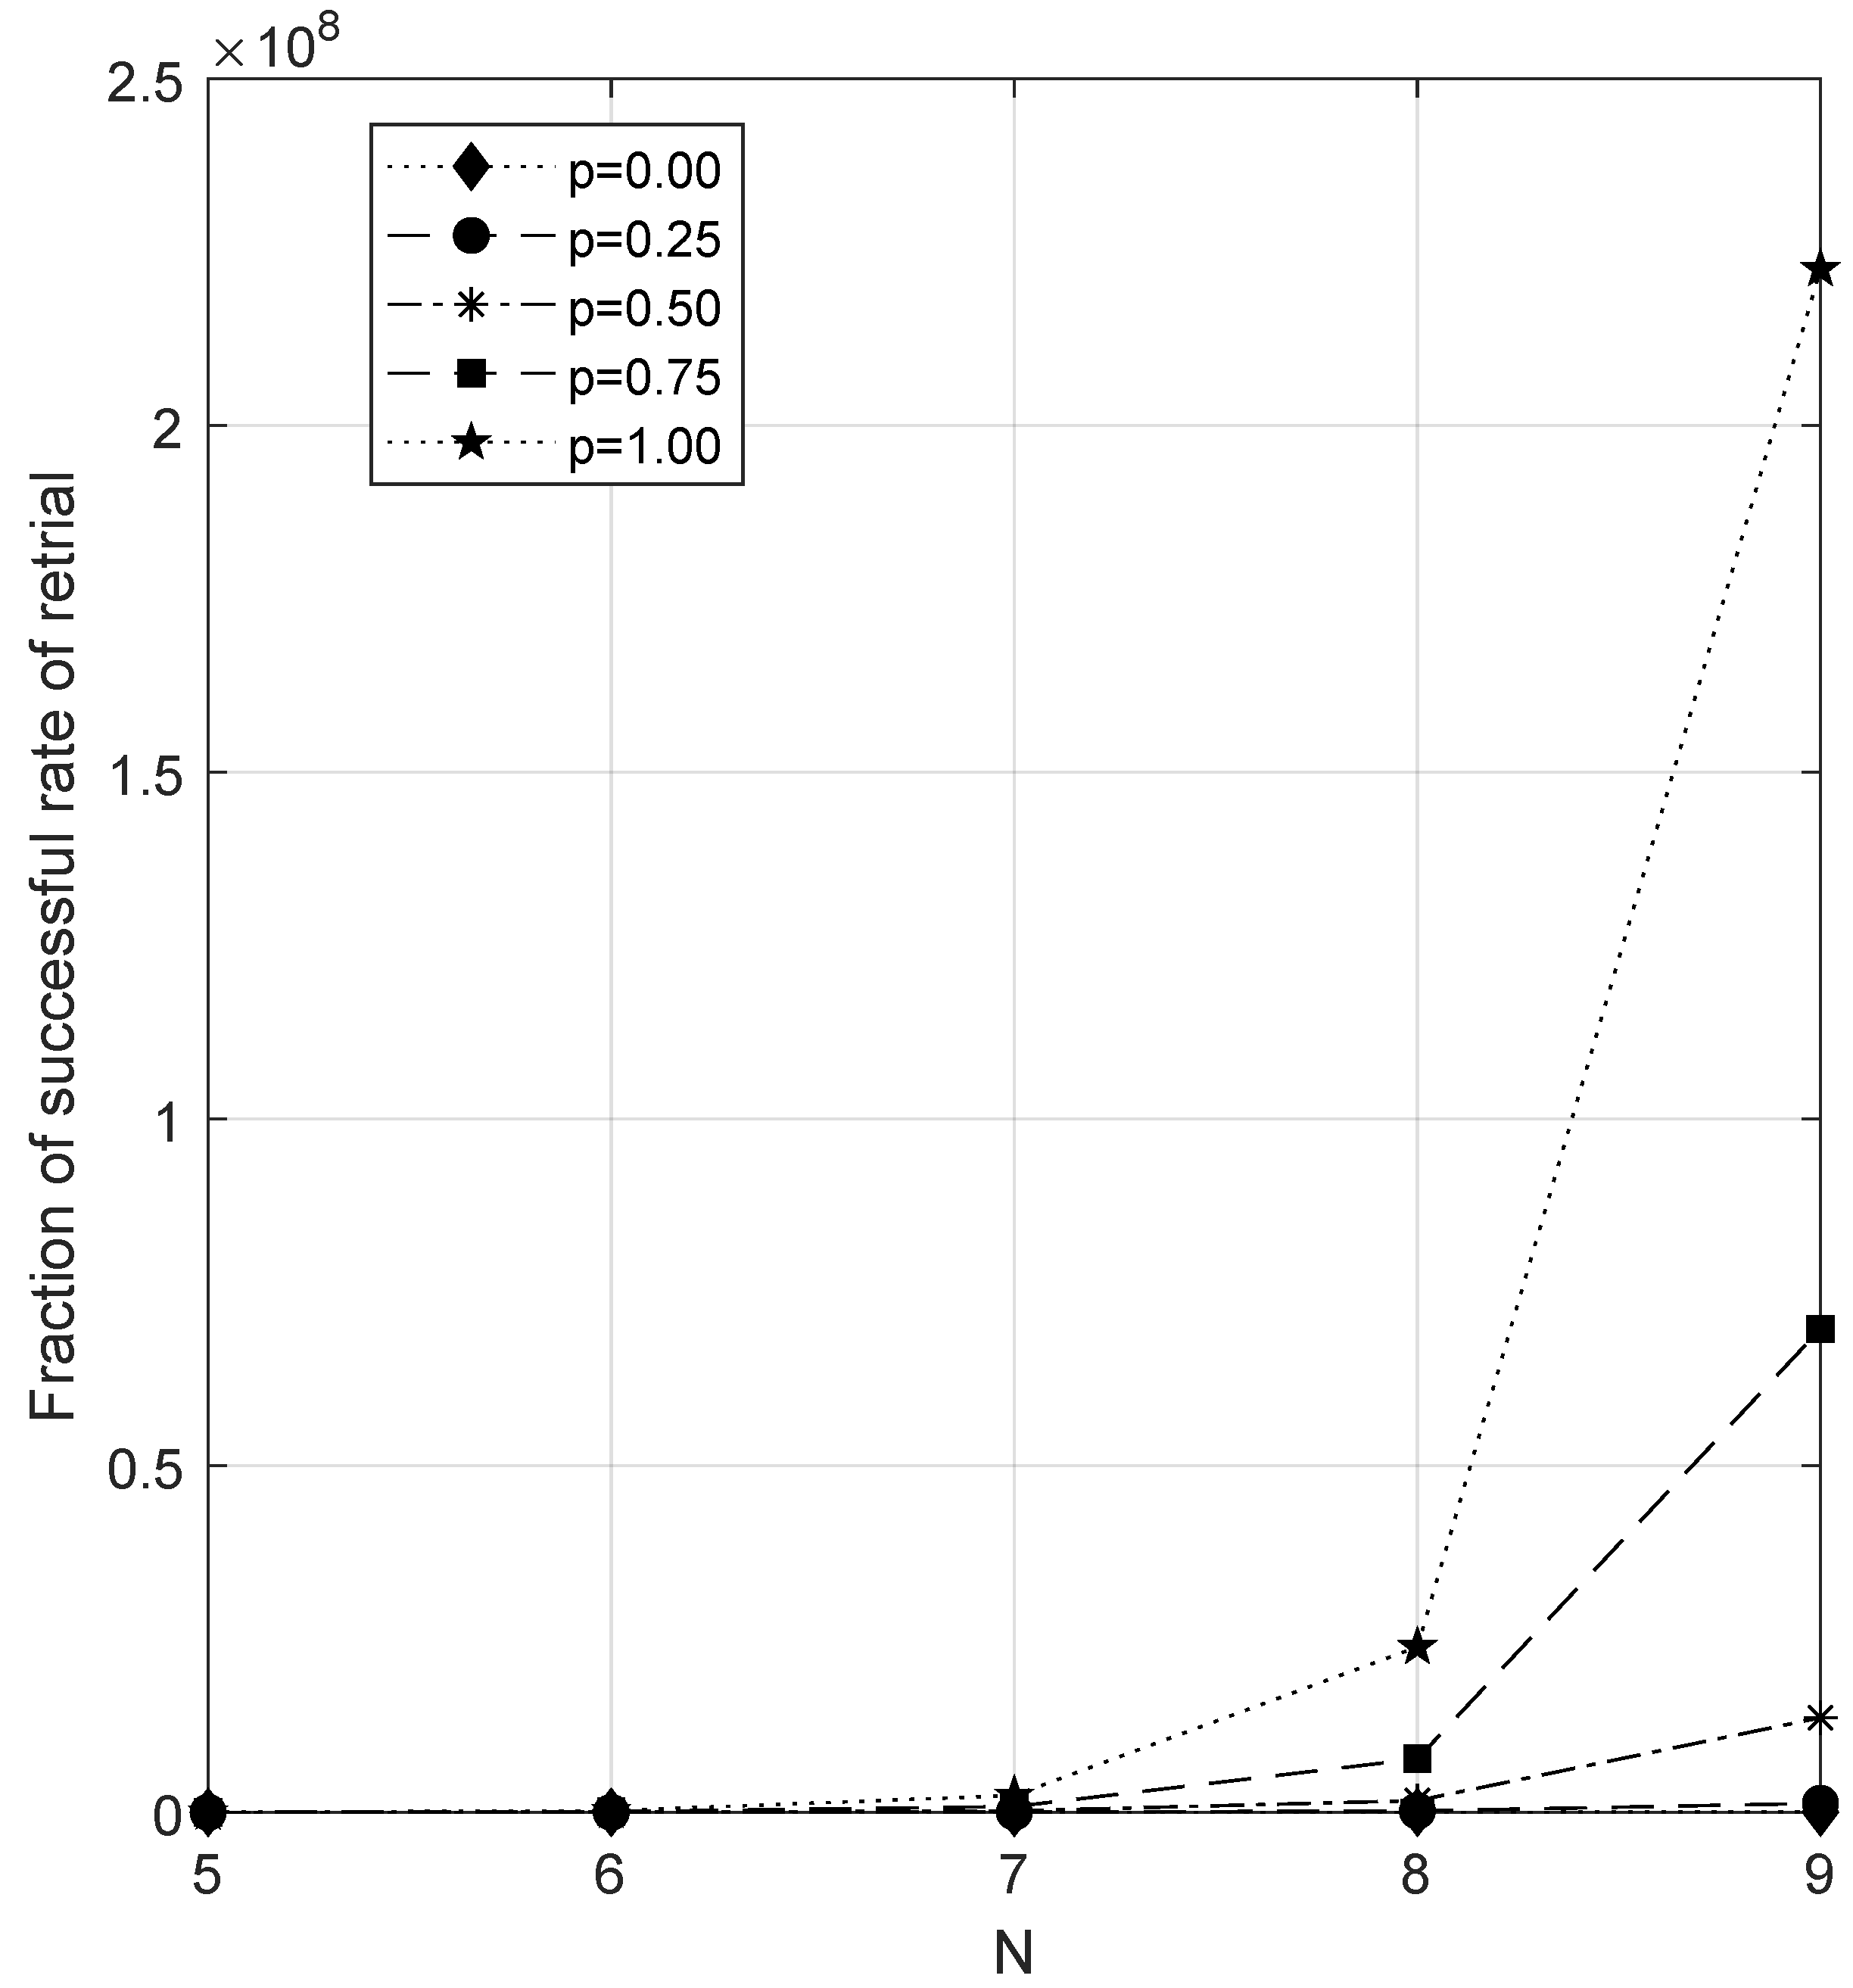
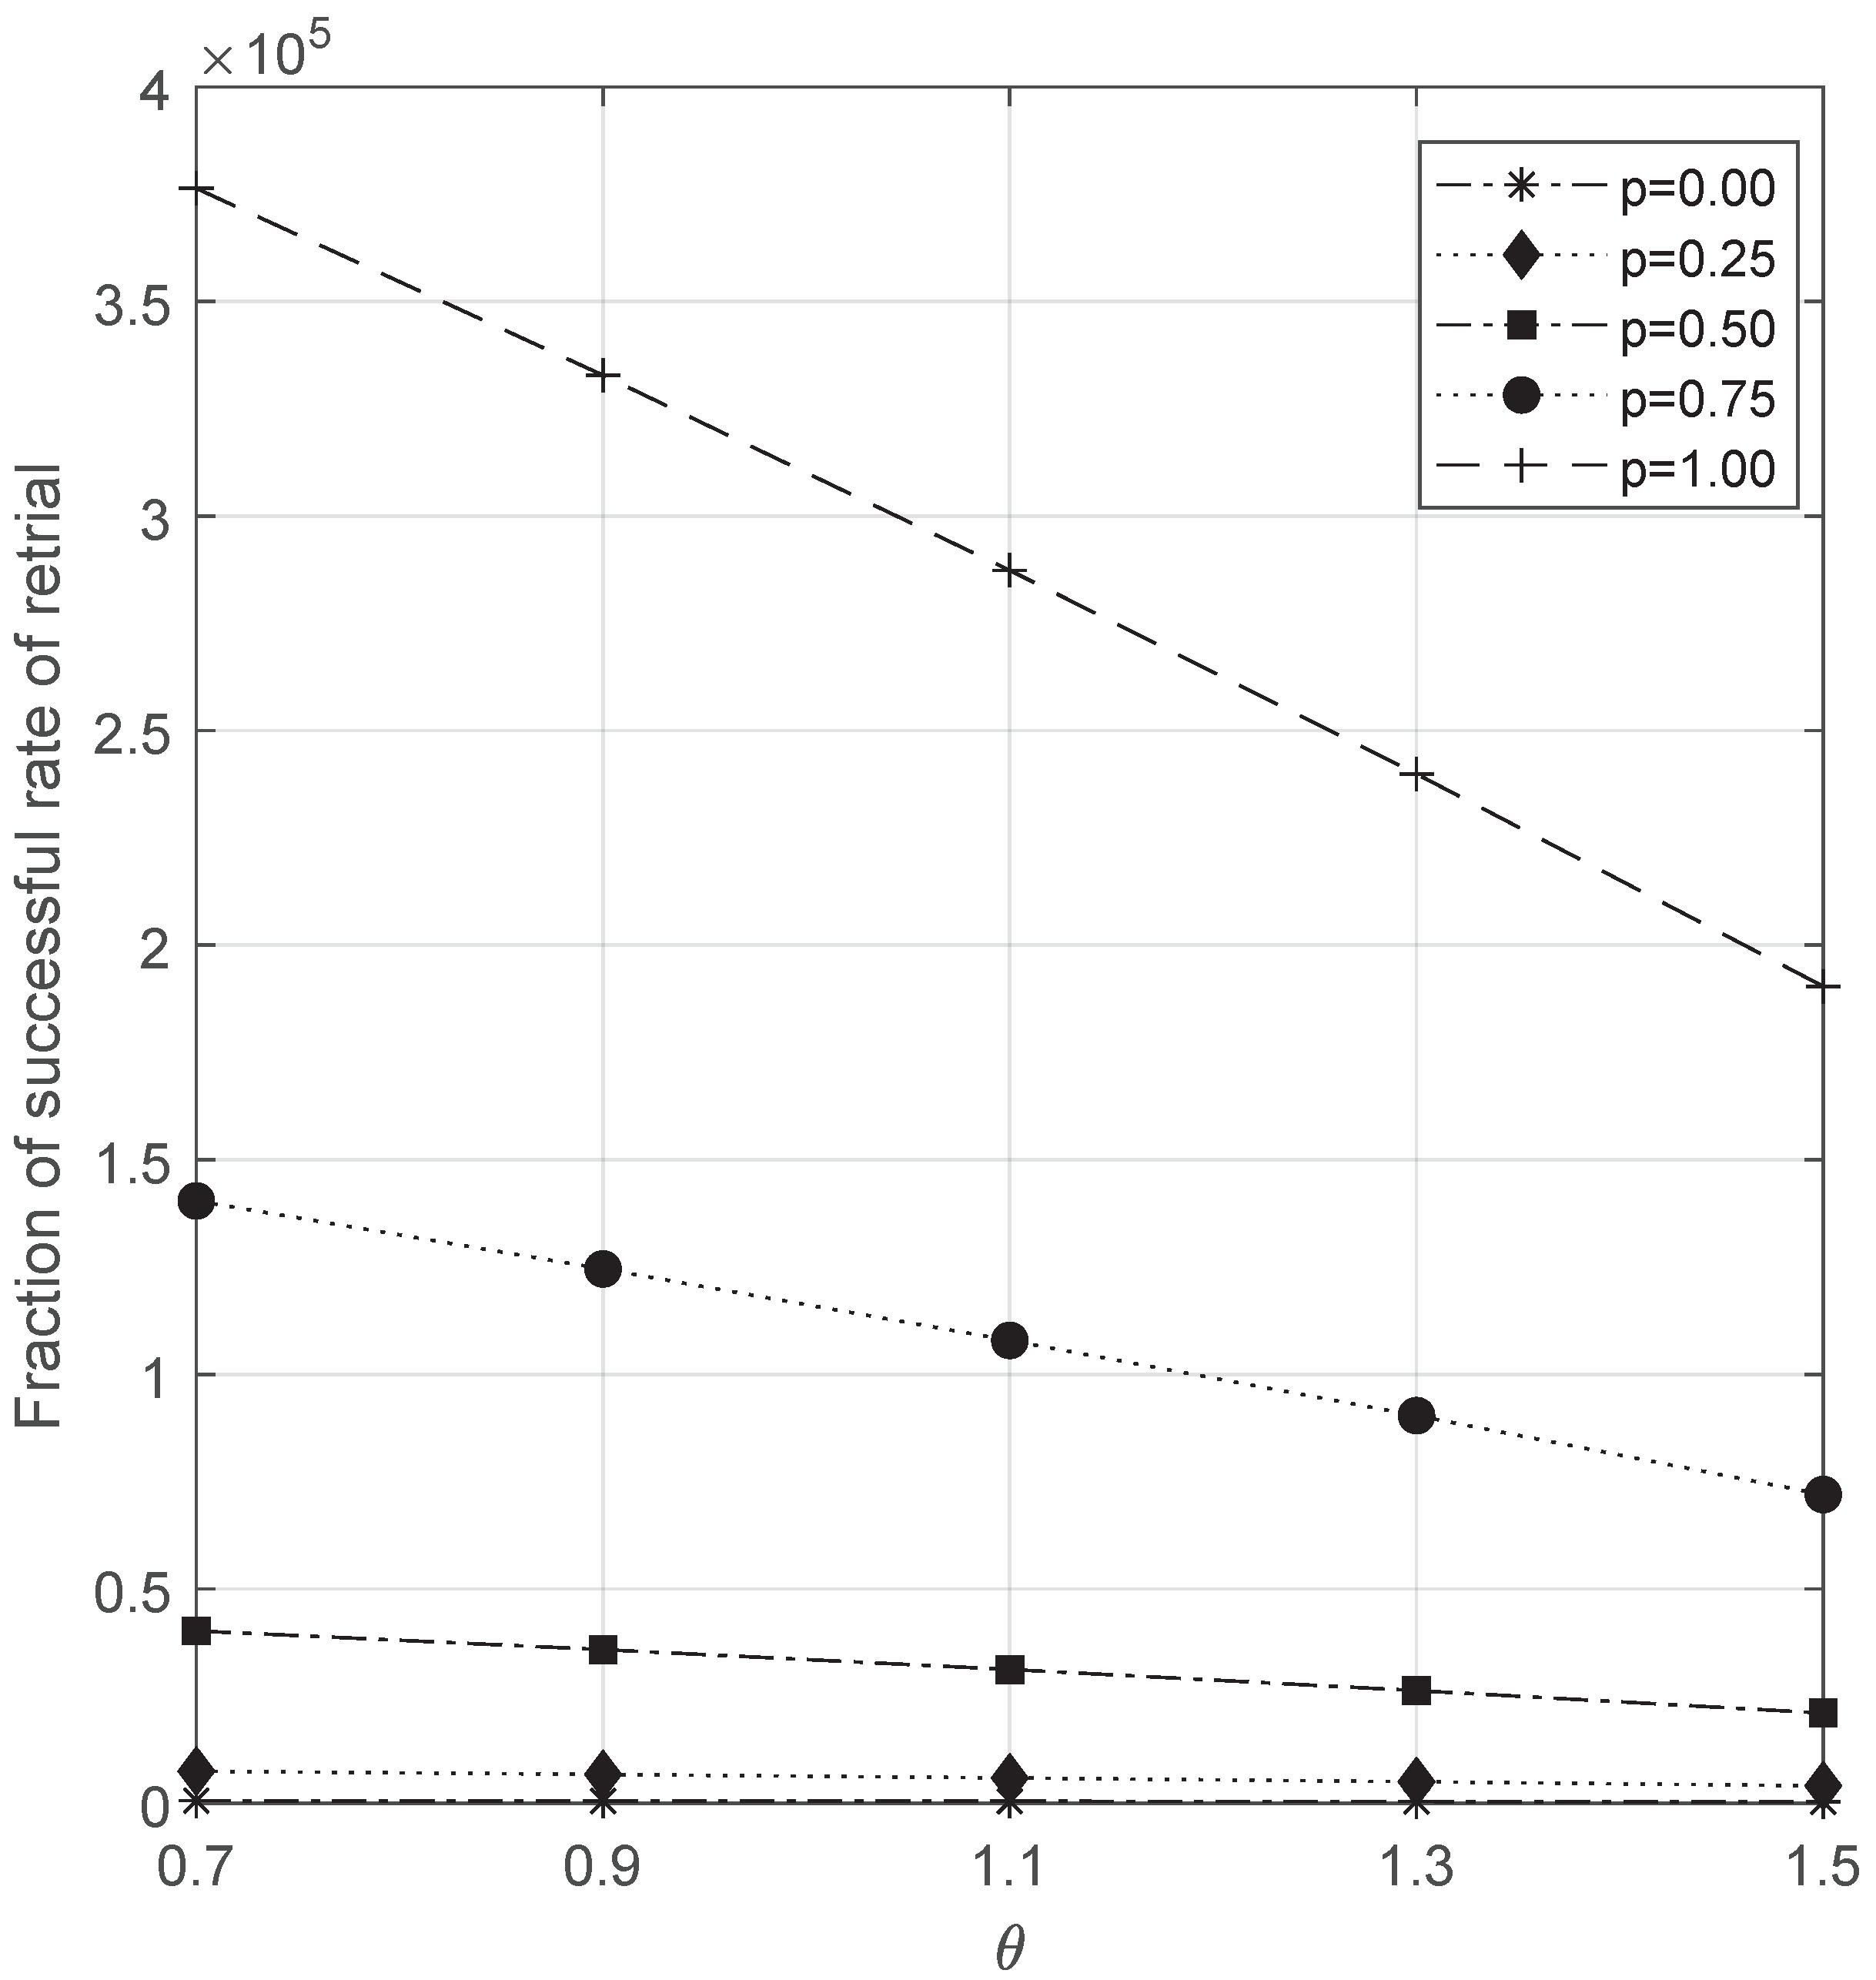
6.6. Analysis of Fraction of Successful Retrial Rate

The fraction of the successful retrial rate is analyzed in this section under the parameter variation, shown in Figure 10, Figure 11, Figure 12, Figure 13, Figure 14, Figure 15 and Figure 16. The observations are listed below:
  • There is a gradual increase in Z 16 while varying the parameter β . However, after some point, the increase is not notably significant.
  • An immediate response of increasing c can be observed in Z 16 as it increases.
  • The fraction of the successful retrial rate decreases when the arrival rate of the customer increases. After some values, it moves faster towards the value zero.
  • An increase in the service rate directly decreases the service time per customer. It is suitable for the service rates of both junior and senior servers. As a result, they increase the rate of successful retrials.
  • Increasing the capacity of the waiting hall increases the chance of a retrial’s success. Hence Z 16 increases when we increase N.
  • As similar to lambda, while increasing the rate θ , the waiting hall soon becomes full, which decreases the chance of a successful retrial.
Analyzing the fraction of the successful retrial rate provides valuable insights into the performance and effectiveness of a system in handling retrials. The service rates, number of servers, waiting hall size, and reorder rate directly influence it.

6.7. Observations

We present the observations that we saw in each numerical analysis.
  • The obtained convexity of the total cost helps in identifying efficient configurations that minimize the overall costs.
  • The parameters β , μ , and α expose a favorable output for each analysis.
  • Though the parameters N and c increase the total cost, they are actually helpful in increasing the fraction of successful retrials.
  • When p = 0 , the model turns out to be the standard QIS without consultation.
  • When p = 1 , the model turns out to be the QIS with compulsory consultation as [40]. Also, with the inventory and retrial facility, the model looks like an extension version of [40].
  • The rate θ decreases the waiting time of customers in the orbit when it increases. But, in the case of customers in the waiting hall, it acts inversely.
  • The rate λ increases the total cost, waiting time of customers, and number of junior servers in C and S mode.
  • An increase in p means that the junior servers are developed as experienced servers.

7. Conclusions

In this article, we have investigated the queuing-inventory model, where junior servers occasionally encounter challenges while serving customers. When faced with such situations, they seek advice from the senior server to resolve the issue. Initially, primary customers meet junior servers to set up service. If the junior server faces no issues while providing service, a customer leaves the system successfully with an item. Suppose that the junior server faces an issue. He enters C-mode for consultation with a senior server. Following this consultation, the senior and junior servers collaborate to finalize the service. When the senior server is engaged with other junior servers, the latter joins a line and waits for their turn. Essentially, in the second phase, junior servers assume the role of customers.
To evaluate this system, a Markovian queuing-inventory model is employed, necessitating the creation of a four-dimensional state space. By applying Neuts and Rao’s truncation method, the study calculates the steady-state probability vector of the system and various performance metrics. The investigation also scrutinizes customer waiting times and the average count of active junior servers in both S-mode and C-mode. By varying the probabilities, we gain insight into the impact of the necessity for junior server consultations at the end of service, ranging from compulsory consultation to no consultation. As junior servers accumulate experience from the senior server over time, the need for consultations ultimately decreases. These analyses offer valuable insights into the model’s performance and effectiveness. In the future, this model could be extended to incorporate more complex arrival processes (MAP) and phase-type distributions, replacing the current Poisson and exponential distributions.

Author Contributions

Conceptualization, K.J. and T.H.; Software, T.H.; Investigation, K.L., (Section 1 and Section 2); A.M. and J.S., (Section 3, Section 4, Section 5 and Section 6); Writing—original draft preparation, review, and editing, K.J., T.H., K.L., A.M. and J.S. All authors have read and agreed to the published version of the manuscript.

Funding

This research received no external funding.

Data Availability Statement

Not applicable.

Conflicts of Interest

The authors declare no conflict of interest.

Notations

The following abbreviations are used in this manuscript:
0A matrix where all entries are zero
eA column vector of appropriate dimensions, with each coordinate set to one
IAn identity matrix
δ i j Kronecker Delta
δ ¯ i j 1 δ i j
H ( x ) Heaviside function
a , b ¯ a , a + 1 , , b , where a and b are integers
a , ¯ a , a + 1 , where a is an integer

References

  1. Melikov, A.Z.; Molchanov, A.A. Stock optimization in transportation/storage systems. Cybern. Syst. Anal. 1992, 28, 484–487. [Google Scholar] [CrossRef]
  2. Sigman, K.; Simchi-Levi, D. Light traffic heuristic for an M/G/1 queue with limited inventory. Ann. Oper. Res. 1992, 40, 371–380. [Google Scholar] [CrossRef]
  3. Yadavalli, V.S.; Sivakumar, B.; Arivarignan, G.; Adetunji, O. A multi-server perishable inventory system with negative customer. Comput. Ind. Eng. 2011, 61, 254–273. [Google Scholar] [CrossRef]
  4. Yadavalli, V.S.; Sivakumar, B.; Arivarignan, G.; Adetunji, O. A finite source multi-server inventory system with service facility. Comput. Ind. Eng. 2012, 63, 739–753. [Google Scholar] [CrossRef]
  5. Nair, A.N.; Jacob, M.J.; Krishnamoorthy, A. The multi server M/M/(s,S) queueing inventory system. Ann. Oper. Res. 2015, 233, 321–333. [Google Scholar] [CrossRef]
  6. Krishnamoorthy, A.; an Manik, R.; Shajin, D. Analysis of a multiserver queueing-inventory system. Adv. Oper. Res. 2015, 2015, 747328. [Google Scholar] [CrossRef]
  7. Wang, F.F. Approximation and optimization of a multi-server impatient retrial inventory-queueing system with two demand classes. Qual. Technol. Quant. Manag. 2015, 12, 269–292. [Google Scholar] [CrossRef]
  8. Wang, F.F.; Bhagat, A.; Chang, T.M. Analysis of priority multi-server retrial queueing inventory systems with MAP arrivals and exponential services. Opsearch 2017, 54, 44–66. [Google Scholar] [CrossRef]
  9. Hanukov, G.; Avinadav, T.; Chernonog, T.; Yechiali, U. A multi-server queueing-inventory system with stock-dependent demand. IFAC PapersOnLine 2019, 52, 671–676. [Google Scholar] [CrossRef]
  10. Jeganathan, K.; Reiyas, M.A.; Lakshmi, K.P.; Saravanan, S. Two server Markovian inventory systems with server interruptions: Heterogeneous vs. homogeneous servers. Math. Comput. Simul. 2019, 155, 177–200. [Google Scholar] [CrossRef]
  11. Suganya, C.; Sivakumar, B. MAP/PH (1), PH (2)/2 finite retrial inventory system with service facility, multiple vacations for servers. Int. J. Math. Oper. Res. 2019, 15, 265–295. [Google Scholar] [CrossRef]
  12. Jose, K.P.; Beena, P. On a retrial production inventory system with vacation and multiple servers. Int. J. Appl. Comput. Math. 2020, 6, 108. [Google Scholar] [CrossRef]
  13. Chakravarthy, S.R.; Rumyantsev, A. Analytical and simulation studies of queueing-inventory models with MAP demands in batches and positive phase-type services. Simul. Model. Pract. Theory 2020, 103, 102092. [Google Scholar] [CrossRef]
  14. Jeganathan, K.; Reiyas, M.A. Two parallel heterogeneous servers Markovian inventory system with modified and delayed working vacations. Math. Comput. Simul. 2020, 172, 273–304. [Google Scholar] [CrossRef]
  15. Chakravarthy, S.R.; Shajin, D.; Krishnamoorthy, A. Infinite server queueing-inventory models. J. Indian Soc. Probab. Stat. 2020, 21, 43–68. [Google Scholar] [CrossRef]
  16. Hanukov, G.; Avinadav, T.; Chernonog, T.; Yechiali, U. A multi-server system with inventory of preliminary services and stock-dependent demand. Int. J. Prod. Res. 2021, 59, 4384–4402. [Google Scholar] [CrossRef]
  17. Jeganathan, K.; Harikrishnan, T.; Selvakumar, S.; Anbazhagan, N.; Amutha, S.; Acharya, S.; Rajendra, D.; Joshi, G.P. Analysis of interconnected arrivals on queueing-inventory system with two multi-server service channels and one retrial facility. Electronics 2021, 10, 576. [Google Scholar] [CrossRef]
  18. Rasmi, K.; Jacob, M.J.; Rumyantsev, A.S.; Krishnamoorthy, A. A multi-server heterogeneous queuing-inventory system with class-dependent inventory access. Mathematics 2021, 9, 1037. [Google Scholar] [CrossRef]
  19. Rasmi, K.; Jacob, M.J. Analysis of a multiserver queueing inventory model with self-service. Int. J. Math. Model. Numer. Optim. 2021, 11, 275–291. [Google Scholar] [CrossRef]
  20. Shajin, D.; Krishnamoorthy, A.; Melikov, A.Z.; Sztrik, J. Multi-server queuing production inventory system with emergency replenishment. Mathematics 2022, 10, 3839. [Google Scholar] [CrossRef]
  21. Jeganathan, K.; Selvakumar, S.; Saravanan, S.; Anbazhagan, N.; Amutha, S.; Cho, W.; Joshi, G.P.; Ryoo, J. Performance of stochastic inventory system with a fresh item, returned item, refurbished item, and multi-class customers. Mathematics 2022, 10, 1137. [Google Scholar] [CrossRef]
  22. Almaqbali, K.A.; Joshua, V.C.; Krishnamoorthy, A. Multi-class, multi-server queueing inventory system with batch service. Mathematics 2023, 11, 830. [Google Scholar] [CrossRef]
  23. Aghsami, A.; Samimi, Y.; Aghaie, A. A combined continuous-time Markov chain and queueing-inventory model for a blood transfusion network considering ABO/Rh substitution priority and unreliable screening laboratory. Expert Syst. Appl. 2023, 215, 119360. [Google Scholar] [CrossRef]
  24. Selvakumar, S.; Jeganathan, K.; Srinivasan, K.; Anbazhagan, N.; Lee, S.; Joshi, G.P.; Doo, I.C. An optimization of home delivery services in a stochastic modeling with self and compulsory vacation interruption. Mathematics 2023, 11, 2044. [Google Scholar] [CrossRef]
  25. Yue, D.; Ye, Z.; Yue, W. Analysis of a Queueing-Inventory System with Synchronous Vacation of Multiple Servers. Queueing Models Serv. Manag. 2023, 6, 1–26. [Google Scholar]
  26. Artalejo, J.R.; Krishnamoorthy, A.; Lopez-Herrero, M.J. Numerical analysis of (s,S) inventory systems with repeated attempts. Ann. Oper. Res. 2006, 141, 67–83. [Google Scholar] [CrossRef]
  27. Ushakumari, P.V. On (s,S) inventory system with random lead time and repeated demands. J. Appl. Math. Stoch. Anal. 2006, 2006, 81508. [Google Scholar] [CrossRef]
  28. Amirthakodi, M.; Sivakumar, B. An inventory system with service facility and feedback customers. Int. J. Ind. Syst. Eng. 2019, 33, 374–411. [Google Scholar] [CrossRef]
  29. Lopez-Herrero, M.J. Waiting time and other first-passage time measures in an (s,S) inventory system with repeated attempts and finite retrial group. Comput. Oper. Res. 2010, 37, 1256–1261. [Google Scholar] [CrossRef]
  30. Hanukov, G. A queueing-inventory system in which customers can orbit during the service. IFAC PapersOnLine 2022, 55, 619–624. [Google Scholar] [CrossRef]
  31. Sugapriya, C.; Nithya, M.; Jeganathan, K.; Anbazhagan, N.; Joshi, G.P.; Yang, E.; Seo, S. Analysis of stock-dependent arrival process in a retrial stochastic inventory system with server vacation. Processes 2022, 10, 176. [Google Scholar] [CrossRef]
  32. Melikov, A.; Aliyeva, S.; Nair, S.S.; Kumar, B.K. Retrial queuing-inventory systems with delayed feedback and instantaneous damaging of items. Axioms 2022, 11, 241. [Google Scholar] [CrossRef]
  33. Nithya, N.; Anbazhagan, N.; Amutha, S.; Jeganathan, K.; Park, G.-C.; Joshi, G.P.; Cho, W. Controlled arrivals on the retrial queueing–inventory system with an essential interruption and emergency vacationing server. Mathematics 2023, 11, 3560. [Google Scholar] [CrossRef]
  34. Reiyas, M.A.; Jeganathan, K. A classical retrial queueing inventory system with two component demand rate. Int. J. Oper. 2023, 47, 508–533. [Google Scholar] [CrossRef]
  35. Jain, M.; Kumar, I. Cost optimization of a queueing inventory system with two-level supply mode, retrial demands and multiple vacations using a genetic algorithm. Int. J. Appl. Comput. Math. 2023, 9, 51. [Google Scholar] [CrossRef]
  36. Jeganathan, K.; Koffer, V.A.; Sugapriya, C.; Nagarajan, D. A matrix-analytic method for the steady-state analysis of a Markovian queueing system with scrap items. Decis. Anal. J. 2023, 7, 100244. [Google Scholar] [CrossRef]
  37. Bazizi, L.; Rahmoune, F.; Lekadir, O.; Labadi, K. Modelling, performance evaluation and optimisation of (s,Q) retrial inventory system with partial backlogging demands: A gspn approach. Eur. J. Ind. Eng. 2023, 17, 529–569. [Google Scholar] [CrossRef]
  38. Jeganathan, K.; Harikrishnan, T.; Lakshmi, K.P.; Nagarajan, D. A multi-server retrial queueing-inventory system with asynchronous multiple vacations. Decis. Anal. J. 2023, 9, 100333. [Google Scholar] [CrossRef]
  39. Chakravarthy, S.R. A multi-server queueing model with server consultations. Eur. J. Oper. Res. 2014, 233, 625–639. [Google Scholar] [CrossRef]
  40. Hanukov, G. A service system where junior servers approach a senior server on behalf of customers. Int. J. Prod. Econ. 2022, 244, 108351. [Google Scholar] [CrossRef]
  41. Chakravarthy, S.R.; Dudin, A.N.; Dudin, S.A.; Dudina, O.S. Queueing System with Potential for Recruiting Secondary Servers. Mathematics 2023, 11, 624. [Google Scholar] [CrossRef]
  42. Neuts, M.F.; Rao, B.M. Numerical investigation of a multiserver retrial model. Queueing Syst. 1990, 7, 169–189. [Google Scholar] [CrossRef]
  43. Neuts, M.F. Matrix-Geometric Solutions in Stochastic Models: An Algorithmic Approach; Courier Corporation: North Chelmsford, MA, USA, 1994. [Google Scholar]
Figure 1. Model flow chart.
Mathematics 11 04581 g001
Figure 2. Expected total cost for S vs. s.
Mathematics 11 04581 g002
Figure 3. Mean busy servers in S-mode vs. p and β .
Mathematics 11 04581 g003
Figure 4. Mean busy servers in S-mode vs. p and c.
Mathematics 11 04581 g004
Figure 5. Mean busy servers in S-mode vs. p and λ .
Mathematics 11 04581 g005
Figure 6. Mean busy servers in S-mode vs. p and μ .
Mathematics 11 04581 g006
Figure 7. Mean busy servers in S-mode vs. p and α .
Mathematics 11 04581 g007
Figure 8. Mean busy servers in S-mode vs. p and N.
Mathematics 11 04581 g008
Figure 9. Mean busy servers in S-mode vs. p and θ .
Mathematics 11 04581 g009
Figure 10. Fraction of successful rate of retrial vs. p and β .
Mathematics 11 04581 g010
Figure 11. Fraction of successful rate of retrial vs. p and c.
Mathematics 11 04581 g011
Figure 12. Fraction of successful rate of retrial vs. p and λ .
Mathematics 11 04581 g012
Figure 13. Fraction of successful rate of retrial vs. p and μ .
Mathematics 11 04581 g013
Figure 14. Fraction of successful rate of retrial vs. p and α .
Mathematics 11 04581 g014
Figure 15. Fraction of successful rate of retrial vs. p and N.
Mathematics 11 04581 g015
Figure 16. Fraction of successful rate of retrial vs. p and θ .
Mathematics 11 04581 g016
Table 1. E T C vs. μ , α , and p.
μ α p0.000.250.500.751.00
376.0317365.0658064.5941734.3132324.126693
85.9399205.0067624.5502074.2781554.097510
95.8703374.9615194.5163744.2511004.074969
475.4888904.7148224.3329034.1050233.953676
85.3968554.6550794.2884804.0696523.924297
95.3267364.6091594.2542194.0423233.901571
575.1712904.5060304.1769823.9806513.850284
85.0787404.4458754.1323233.9451393.820815
95.0080454.3995724.0978443.9176773.798003
Table 2. E T C vs. λ , θ , β , and p.
λ θ β p0.000.250.500.751.00
1.00.125.9417775.0069244.5502384.2781634.097513
35.9351945.0027734.5473784.2761044.095999
45.9316835.0006434.5459624.2751204.095300
0.525.9402245.0067864.5502124.2781564.097510
35.9336475.0026354.5473514.2760974.095996
45.9301385.0005054.5459364.2751124.095297
0.925.9399205.0067624.5502074.2781554.097510
35.9333465.0026124.5473474.2760964.095995
45.9298385.0004814.5459324.2751114.095297
1.50.127.5393865.9707855.2631474.8488074.575142
37.5247845.9609695.2556804.8428714.570300
47.5168445.9557035.2517784.8398414.567878
0.527.5144705.9684125.2626894.8486744.575092
37.4999935.9586075.2552244.8427384.570250
47.4921035.9533445.2513224.8397084.567828
0.927.5090995.9679825.2626134.8486534.575084
37.4946795.9581845.2551494.8427184.570243
47.4868095.9529245.2512484.8396884.567821
2.00.129.6526357.0226966.0006565.4298785.058704
39.6238827.0053695.9872055.4187265.049210
49.6091026.9960625.9800505.4128935.044321
0.529.5638977.0053785.9972395.4288805.058325
39.5345456.9882065.9838255.4177445.048842
49.5194826.9789435.9766765.4119115.043953
0.929.5325917.0022515.9966675.4287205.058266
39.5033646.9851425.9832695.4175905.048786
49.4882876.9758985.9761245.4117585.043898
Table 3. E T C vs. c , N , and p.
cNp0.000.250.500.751.00
365.9399205.0067624.5502074.2781554.097510
75.9432705.0076064.5504994.2782804.097572
85.9451905.0080964.5506724.2783564.097610
467.3285086.3290895.8166265.5042025.293634
77.3289496.3291975.8166585.5042145.293639
87.3291146.3292235.8166655.5042165.293640
568.6785037.6214547.0639536.7174196.480568
78.6783047.6214467.0639536.7174196.480568
88.6783747.6214567.0639556.7174206.480568
Table 4. Z 5 vs. λ , θ , and p.
λ θ p0.000.250.500.751.00
10.70.8180340.6763000.5768690.5030960.446129
0.90.8180770.6763090.5768720.5030960.446130
1.10.8181220.6763220.5768760.5030980.446130
1.50.70.8530100.6936960.5873040.5100870.451152
0.90.8535830.6938160.5873310.5100930.451153
1.10.8540160.6939420.5873720.5101080.451159
20.70.9443250.7308110.6061900.5213270.458600
0.90.9497290.7318740.6064480.5213920.458614
1.10.9523030.7325820.6066870.5214790.458648
Table 5. Z 5 vs. c, β , and p.
c β p0.000.250.500.751.00
210.8947070.7181200.6031220.5210380.459102
20.8942160.7179070.6029880.5209320.459009
30.8941380.7178890.6029840.5209320.459010
310.8182230.6764290.5769760.5031910.446218
20.8180400.6763000.5768700.5030960.446129
30.8180260.6762960.5768680.5030950.446129
410.8108040.6724720.5746040.5016610.445179
20.8106540.6723540.5745020.5015680.445092
30.8106460.6723510.5745010.5015670.445092
Table 6. Z 5 vs. N, μ , α , and p.
N μ α p0.000.250.500.751.00
5271.2036480.7797070.5798050.4619530.384052
81.1781650.7650300.5694070.4539020.377485
91.1590690.7538810.5614600.4477270.372437
370.8416190.5518960.4111140.3276810.272442
80.8175360.5374080.4007870.3196670.265897
90.7994420.5264000.3928940.3135200.260864
470.6698330.4395530.3273140.2607960.216771
80.6459640.4251180.3170120.2527960.210233
90.6280290.4141500.3091380.2466590.205206
6271.2082930.7801370.5798730.4619680.384057
81.1822380.7654000.5694640.4539140.377489
91.1627590.7542110.5615100.4477380.372440
370.8422900.5519480.4111220.3276830.272442
80.8180720.5374480.4007930.3196680.265897
90.7998960.5264320.3928990.3135210.260864
470.6700110.4395670.3273170.2607970.216771
80.6460910.4251280.3170130.2527960.210233
90.6281280.4141570.3091390.2466590.205207
7271.2230240.7821660.5802910.4620860.384098
81.1953850.7671760.5698250.4540150.377524
91.1748080.7558170.5618340.4478270.372471
370.8453650.5522840.4111890.3277010.272449
80.8206020.5377170.4008450.3196830.265902
90.8020760.5266600.3929430.3135330.260869
470.6710080.4396740.3273380.2608030.216773
80.6468490.4252060.3170290.2528000.210235
90.6287430.4142190.3091510.2466620.205208
Table 7. Z 13 vs. N, μ , α , and p.
N μ α p0.000.250.500.751.00
52717.97459116.12691815.13428114.55783014.196432
817.38510215.68036814.76917214.24619613.923038
916.95171215.34846514.49455214.00818713.709900
3715.49617914.68828814.21448713.81912913.354706
815.03979314.34299413.94054113.57717013.084691
914.69796814.07333213.71196913.35754012.824969
4714.82326314.19599913.60303512.87603911.961140
814.46444913.93815613.34004612.46058211.545646
914.17549513.69979613.05964712.00492211.494981
62715.39844413.83322812.98742312.50286012.217659
814.88613813.44396712.67081412.23593611.988846
914.50928613.15446112.43237612.03170511.810049
3713.29011512.61150012.26090012.05100011.885700
812.89922712.32480012.05190011.90490011.787000
912.60657212.10190011.87910011.77110011.680400
4712.72164112.27948711.98388111.70788811.390321
812.43291812.11453711.90619611.67248211.338833
912.20515511.96833811.81508111.59899611.229460
72712.98223711.65510010.92720010.50800010.264500
812.53766211.31650010.65340010.27940010.070800
912.21064711.06490010.44750010.1049009.920400
3711.17123610.58046810.28744610.14244310.073247
810.83605110.33832710.11475410.02823710.010985
910.58648010.1525669.9763799.9298209.918257
4710.65410510.29754510.11562710.04268710.05909
810.41030510.16320210.06951010.03428910.00849
910.22421310.0539759.0240849.00775148.925115
Table 8. Z 13 vs. λ , θ , and p.
λ θ p0.000.250.500.751.00
10.76.1685424.4114383.4109602.3485331.446406
0.95.0396753.4940772.6707021.8395681.137603
1.14.3386112.9327332.2173291.5249890.944842
1.50.79.0048007.4635006.4380004.9784003.376200
0.97.1493005.7594004.9236003.8200002.612900
1.16.0167004.7334004.0104003.1139002.141300
20.716.81676915.98878115.69386214.62532012.438549
0.912.89922711.96979111.63485710.8407199.288518
1.110.5649239.6017469.2467758.6012857.401879
Table 9. Z 13 vs. c , β , and p.
c β p0.000.250.500.751.00
2135.94178529.67453128.50737528.60309529.006031
216.67620913.58235312.92363112.73490612.420229
34.4177842.6373201.1753580.4800750.234289
3128.54332627.07563327.30976627.75941128.048548
212.89922711.96979111.63485710.8407199.288518
32.6564020.9454740.3000750.1314140.080402
4126.15525325.88273226.40448626.97685827.352461
211.63961811.12419210.4584588.8035756.357663
31.7704590.4664860.1457410.0715840.049899
Table 10. Z 8 vs. N , μ , α , and p.
N μ α p0.000.250.500.751.00
5270.2141680.1737850.1531790.1406720.132265
80.2052320.1653570.1449300.1325150.124167
90.1978410.1583270.1380300.1256850.117382
370.3110160.2436140.2083360.1867550.172203
80.3001230.2335100.1985030.1770560.162586
90.2912430.2252000.1903920.1690470.154639
470.5486560.4208170.3480250.3021730.270858
80.5346600.4082280.3359480.2903390.259165
90.5234500.3980530.3261530.2807280.249662
6270.2145740.1738740.1532110.1406870.132273
80.2056500.1654510.1449640.1325320.124176
90.1982640.1584240.1380660.1257020.117391
370.3127230.2439740.2084620.1868130.172234
80.3018140.2338740.1986310.1771150.162617
90.2929170.2255630.1905210.1691060.154671
470.5609530.4232950.3488570.3025390.271048
80.5465750.4106710.3367720.2907030.259353
90.5350720.4004640.3269690.2810880.249849
7270.2155710.1740740.1532760.1407140.132287
80.2064970.1656280.1450230.1325570.124189
90.1990100.1585830.1381200.1257260.117403
370.3157260.2446210.2086790.1869060.172281
80.3043830.2344450.1988260.1772000.162661
90.2951900.2260810.1907000.1691850.154712
470.5718280.4264410.3499840.3030370.271302
80.5556400.4134670.3377920.2911570.259587
90.5428750.4030130.3279130.2815110.250067
Table 11. Z 8 vs. λ , θ , and p.
λ θ p0.000.250.500.751.00
10.70.2986730.2305650.1953580.1739210.159507
0.90.3018140.2338740.1986310.1771150.162617
1.10.3026690.2347940.1995520.1780190.163501
1.50.70.3913620.2954370.2446050.2133240.192213
0.90.3955400.3003390.2496390.2183020.197071
1.10.3968140.3018380.2512180.2198960.198652
20.70.4842580.3579940.2930370.2525620.225074
0.90.4872760.3632840.2987530.2582760.230623
1.10.4887410.3652340.3009150.2605220.232891
Table 12. Z 8 vs. c , β , and p.
c β p0.000.250.500.751.00
210.2001410.1492980.1238460.1086410.098556
20.2001250.1492980.1238460.1086410.098556
30.2001170.1492970.1238450.1086400.098555
310.3018200.2338740.1986310.1771150.162617
20.3018100.2338730.1986300.1771140.162616
30.3018180.2338720.1986290.1771130.162615
410.3159770.2492500.2129100.1899680.174199
20.3156220.2492280.2129080.1899670.174199
30.3154020.2492120.2129050.1899660.174198
Disclaimer/Publisher’s Note: The statements, opinions and data contained in all publications are solely those of the individual author(s) and contributor(s) and not of MDPI and/or the editor(s). MDPI and/or the editor(s) disclaim responsibility for any injury to people or property resulting from any ideas, methods, instructions or products referred to in the content.

