Article

Simulation Cognitive Modeling Approach to the Regional Sustainable Complex System Development for Improving Quality of Life

1
Faculty of Economics, Saratov State University, 83, Astrakhanskaya Str., 410600 Saratov, Russia
2
Institute of Management in Economic, Environmental and Social Systems, Southern Federal University, 105/42 Bolshaya Sadovaya Str., 344006 Rostov-on-Don, Russia
3
Faculty of Psychology, Pedagogies and Defectology, Don State Technical University, 1 Gagarin Sq., 344000 Rostov-on-Don, Russia
4
Faculty of Computer Science and Information Technologies, Saratov State University, 83, Astrakhanskaya Str., 410600 Saratov, Russia
*
Author to whom correspondence should be addressed.
Mathematics 2023, 11(20), 4369; https://doi.org/10.3390/math11204369
Submission received: 9 September 2023 / Revised: 4 October 2023 / Accepted: 9 October 2023 / Published: 20 October 2023

Abstract

:
This article presents study results of the region’s sustainable development possibility, thus improving the population’s life quality using cognitive simulation methods of complex systems. The main theoretical provisions of cognitive modeling developed and tested earlier in various socioeconomic system modeling are briefly outlined. The cognitive modeling application’s mathematical apparatus and CMCS software No. 2018661506 system were developed using quantitative data from one of Russia’s southern regions (Rostov oblast). The task was to study the region, model, understand, explain, and develop possible situation development scenarios, and foresee this complex system’s possible future outcome. The main statistical socioeconomic indicators of the state region were studied and processed. Data analysis necessary for developing and researching a cognitive model is given. The regional economic mechanism cognitive model is a functional graph consisting of quantitative and qualitative concepts. Between them, relationships are given in the form of functions, which is the novelty of research. The results of several scenarios of impulse modeling are presented, making it possible to predict future desirable and undesirable processes in the system. Scenario analysis was carried out, making it possible to propose a number of recommendations for the region’s sustainable development. A direction for the region’s development of further cognitive research is proposed.

1. Introduction

Among many modern approaches to the study of complex systems, preference was given to the cognitive approach and the use of models in the form of cognitive maps and even more complex cognitive models, since it allows taking into account not only the quantitative characteristics of the object but also the qualitative ones that are specified verbally. The cognitive model has the advantage of describing, explaining, and structuring existing knowledge about a particular complex system, but, most importantly, it generates and implements new knowledge about the system and scientific predictions of possible options for its future development. The latter is especially important when implementing development strategies for individual organizations, territories, regions, and countries.
Cognitive modeling of complex systems is multi-stage, and at each stage, various techniques and methods, both well-formalized and insufficiently formalized expert methods of research and decision-making, are used. A special role is played by decision makers and various expert methods at the first stage—the stage of determining the purpose of cognitive research and choosing and collecting necessary methodology and empirical data about the object. These processes are essential in order to develop a cognitive model of the system under investigation, which is represented graphically. At the initial stage, it is also often necessary to use modern methods of working with big data methods of neural network modeling in order to develop blocks of a cognitive model based on statistical data. The study of the developed model carried out at the second stage can be carried out by formal mathematical methods, which, together with expert opinions, give reason to accept the developed model as not contradicting the features, properties, and purpose of the real system as an adequate model in a certain sense. At the final stage of the study, the cognitive model is used to predict the possible development of situations in the system by formal methods and to substantiate the proposed strategies for its development.
Cognitive modeling enables the study of the influence of factors in complex semi-structured systems, imitating their progress and predicting the chain of events within the system and its relationship with the external environment. The methodology of cognitive modeling was first proposed to support the decision-making process in semi-structured systems [1]. The possibilities and advantages of the cognitive approach are now clearly presented [2,3,4,5]. Complex socioeconomic systems have been successfully evaluated as cognitive models for various applied problem solutions; this method is widely applied in many spheres of human life, science, and education [6,7,8]. Researchers use the cognitive approach and applications of cognitive mapping for decision making and project management in various broad areas and complexly structured systems [9,10,11]. There is a certain author’s experience in cognitive modeling of complex semi-structured systems [12,13,14,15,16].
This study continues the scientific discussion about assessing the quality of life and modeling regional sustainable development. The main research aim was to define the relevant, effective indicators and develop the tools of cognitive modeling for regional sustainable development modeling.
In the study of the regional socioeconomic system, some of the results of which are presented for the first time in this article, cognitive approach and cognitive simulation tools were used to identify possible scenarios for the sustainable development of the region, determining the improvement in the population quality of life.
An approach based on simulation modeling of a regional system was used since an experiment in a complex system, including a socioeconomic one, is either impossible for various reasons or simply dangerous. One of the advantages of the cognitive approach is the fact that in the process of research, there is a structuring and refinement of the knowledge of expert decision makers who influence the course of the study, modifying it and going back if necessary. One of the southern regions of Russia (Rostov oblast) was chosen as a specific object of this study, for which cognitive modeling tools were used, and some theoretical conclusions were tested.
Since the toolkit of cognitive modeling developed in this work is new in comparison with its close counterpart and is supplemented with new functions and Cognitive Modeling and Analysis of Socio-Economic Systems of the Regional Level’(CMCS) software, we considered it necessary to briefly present its main elements in the article.

2. Materials and Methods

2.1. Object Definition

2.1.1. Sustainability

In this cognitive study, the goal was to determine possible scenarios for the sustainable development of the region since it is assumed that sustainable socioeconomic development is one of the essential generalizing conditions for improving the quality of life of the population of the region. There is a set of studies devoted to the definition of the “sustainability” concept, such as the economic stability of the region, financial stability, and others [17,18,19,20]. Often, the concept of “sustainable development” is supplemented by the concept of “safe development.” In the definitions of sustainable development of a complex system, various criteria for sustainable and safe development are proposed. In this case, for the region, we will use the model based on the system of criteria for sustainable development [21]. The system of criteria for sustainable development includes:
First criterion—not to exit the trajectory of development of the socioeconomic system in the forecast time interval from a certain set of safe states;
Second criterion—an almost monotonous increase in some indicators of the development of the socioeconomic system over a certain period of time, followed by their preservation within the specified intervals of acceptable values;
Third criterion—the hit of the development trajectory for a certain time in the target set of states;
Fourth criterion is perturbation resistance, including the program trajectory and system structural stability asymptotic stability.
The application of the first and second criteria can be considered traditional for socioeconomic systems. In fact, these are criteria for open systems. Applying the third and fourth criteria requires knowledge in the field of stability theory, which is well-developed for technical and cybernetic systems (systems with feedback) and has been increasingly used in the study of nonlinear economic systems since the second half of the 20th century.

2.1.2. Quality of Life

“Quality of life” as a multidimensional concept takes into account indicators of demography, health care, education, environmental situation, economic growth, population satisfaction with the government, constitutional rights, and freedoms. Quality of life as an interdisciplinary concept characterizes many factors influencing happiness in all aspects of human life; these are technical and scientific progress, financial independence, spiritual, intellectual, and cultural growth, availability of education in society, dwelling comfort, and everyday needs satisfaction, and security and safety of life [20]. In our study, to develop a cognitive model in the form of a parametric functional graph—a model more complex than a cognitive map—we used the life quality model proposed in [21]. We have already tested this model in the cognitive modeling of regional systems [22]. It is assumed that the dependence of the quality-of-life Qi is not linear but has “saturation levels.” A smooth nonlinear function sign is used for a mathematical description of such a process. Using this function, the following relationship describes Qi in the region.
Q i = s i g n s ( 2 F i ( t ) q F X ( t ) ) s i g n s ( 2 S i ( t ) q S X ( t ) ) s i g n s ( 2 q R P i ( t ) ) ,
where qF is the coefficient of quality of life dependence upon the level of provision with fixed assets, qS is the coefficient of quality of life dependence upon the level of wages, qR is the coefficient of quality of life dependence upon the population density, F i ( t ) X ( t ) is the number of fixed assets in accordance with the current level of prices per inhabitant of the region, S i ( t ) X ( t ) is the number of goods a resident in the particular region can buy with the money earned, and Pi(t) is the population density.

2.1.3. Complex System Development

The development of any models of sustainable development, regardless of the scale of the task (country, region), should be preceded by an analysis of the current state of the country, region, the establishment of criteria and indicators—indicators of sustainable development [23]—as well as the definition of sustainable development priorities.
When modeling a complex socioeconomic system, we proceed from its representation in the form of a diagram (Figure 1). Note that when developing a cognitive model of a complex system, its feature is that it necessarily includes parameters not only of the system itself but also of its environment.
Control factors X—parameters that can be controlled and changed within certain limits in order to control the course of the process
X = { x 1 , x 2 , x i , x k } , x i X
Disturbing factors Z—parameters that can be controlled, but there is no possibility to control them under these conditions
Z = { z 1 , z 2 , z g , z h } , z g Z
Interference W—uncontrollable and uncontrollable factors that generate uncertainty.
Output parameters Y—economic, social, political, environmental, and other indicators; U—performance indicators of the object
Y = { y 1 , y 2 , , y j , , y m } , y j Y ; U = { u 1 , u 2 , u j , u m } , u U
The model of a complex system should contain all the above groups of parameters and elements in their relationship
M = { X , Z , Y , U , W , F x z y u }
The model of such a complex system as a socioeconomic one should consist of several models reflecting various aspects and problems; i.e., it must be a metamodel.

2.1.4. Metamodel System

Under the metamodel, we understand the following. A metamodel is an information model of a higher level of abstraction than a specific domain model. The metamodel describes not a single task but a wide range of tasks by highlighting the general rules for processing data and managing complex processes in these tasks. For each specific case, a metamodel adapts to its environment at the time of performance; that is, the ideas of building metamodels or even meta-meta-models are built into the ideas of artificial intelligence and are based on a systematic approach [24]. In our study, the model [25] was used as a metamodel of the study.
The systematizing base for the methodology of cognitive modeling is the research [22] metamodel into which the model of the observer MH is entered.
M = {MO (Y, U, P), ME(X), MOE, MD(Q), MMO, MME, MU, A, MH}
In the M: MO (Y, U, P) identify system (object) model, the Y vector shows the endogenous variables that characterize the object’s phase condition and is a vector of operated variables; P is an allocated resources vector. MO (Y, U, P) = {Mm, Stat }, Stat are statistical models. Mm is a modified parametrical vector graph; ME is a model of the environment; X indicates exogenous sizes. MoE = {MYSχ, MYS } is an object and environment interaction model (M, MYS are a communication system with environment models on an input and an output); MD (Q) is a system behavior model; Q is revolt influences; MMO and MME are models of a system and an environment condition measurement; MU is a control system model; A is a rule of choice for object processes change. In this metamodel, the account is essential for a system and an environment.
Inserting «an observer» into a metamodel allows for building research and decision-making methodology; considering the process development of object knowledge in the researcher’s consciousness is also important [26].

2.2. Cognitive Modeling Approach

Working out a cognitive model demanded the solution of a set of system problems: object identification in the form of a cognitive model, analysis of paths and cycles of a cognitive map, scenario analysis (impulse modeling), analysis of stability, controllability, optimization, connectivity and complexity (structural analysis of systems), analysis properties of adaptability, and research of sensitivity of solutions. The possibility of solving some of these tasks is supported by a CMCS software system of cognitive modeling [27].
A researcher makes decisions concerning the most studied object and most research processes. In the course of research and consecutive decision-making by an expert, a meta-set model and the researcher’s level of object knowledge could naturally change. Such cognitive modeling is «subject–objective»; “perfection” exists not only in object–complex systems but also in the majority of researchers. The association of the majority of enumerated problems in a uniform system is most likely due to the cognitive model being a mathematical matrix [22], for example, RG:
R G =   V 1 V 2 V j 1 V j V j + 1 V k 1 V k V 1 0 + 1 1 w 1 , j 0 1 0 V 2 0 0 + 1 0 w 2 , j + 1 0 w 2 , k V i 1 + 1 + 1 0 1 0 + 1 w i 1 , k V i f i , 1 f i , 2 0 f i j w i , j + 1 0 w i , k V i + 1 f i + 1 , 1 f i + 1 , 2 f i + 1 , j 1 0 0 0 0 V k 1 f k 1 , 2 f k 1 , 2 0 f k 1 , j + 1 0 + 1 V k f k , 1 0 f k , j 1 f k , j 0 0 0
The RG matrix represents the cognitive model in the form of a parametrical vector functional graph FG, which allows for various operations to be performed on a matrix to obtain answers regarding the stability of the system, its connectivity, development of pulse processes, etc. A methodology for cognitive modeling of complex systems has been developed and approved [26].
The parametric vector function graph is:
FG < G, X, F, θ>,
where G is a cognitive model, i = 1,2, …, n is the set of vertices (objects in the system studied; for example, production, population, resources, etc.), the set of arcs, and the relationship between objects in the system (positive, negative, or zero in this situation), and g = 1,2, …, k, F = F (X, E) = F (xi, xj, eij) is a functional transformation of arcs involving a sign («+», «−») and a weighting function ωij, f (xi, xj, eij) = fij.
The dependence of fij could not only be functional but also stochastic. In addition, in a simpler version, it could exist as a weight factor of wij; i.e., in a matrix of the functional graph, there could be blocks (subgraphs) in the form of a cognitive card (the sign focus graph), blocks of type «the weigh graph» with relations of wij, and “functional” blocks with relations of type function of f(xi, xj, eij).
On the basis of cognitive modeling, it appears possible to unite existing quantitative models of complex systems, including models of system dynamics, with quantitatively–qualitative cognitive models, receiving a model in the form of functional graphs as a result.
The hierarchical cognitive map model has the form
I G = < G k 1 ,   G k ,   E k > , k 2 ,
where G k and G k 1 are cognitive models, k− and (k − 1) are levels accordingly, and E k = {   e i ( k ) j ( p ) } P k are relationships between vertices of k − и p−levels.
The k-level cognitive model is a directed graph.
G k = < V ( k ) ,   E ( k ) > , where V ( k ) = {   v i ( k ) |   v i ( k ) V ( k ) ,   i = 1 ,   2 , , n } is a set of k-level vertices E ( k ) = {   e i j ( k ) |   e i j ( k ) E ( k ) ;   i , j = 1 ,   2 , , n } reflecting the relationship between vertices within a level.
The structural union of a hierarchical cognitive model in the form of a functional graph will look like
I Φ = < I G ,   X k ,   F k > , k 2 ,
where I G = < G k 1 ,   G k ,   E k > , k 2 is a cognitive hierarchy model, X k = i = 1 k X ( k ) is a set of parameters for the vertices of a hierarchical cognitive model, and F k = { F ( X k ,   E k ) ;   i = 1 k F ( k ) } is arc transformation functionality in a hierarchical cognitive model.
Control actions (situation management) are being developed at the stage of developing possible scenarios for the development of the system under the influence of changes in internal and external factors [28,29,30]. To determine the processes of the development of situations in the model, the impulse process model is used [31,32]. Let us present it in the Formula (11):
x v i n + 1 = x v i n + v j : e = e i j E k 1 f ( x i ,   x j , e i j ) P j n + Q i ( n )
where xvi(n), xvi(n+1) are the values of the indicator xvi at the vertex vi at the steps of the simulation at the moment t = n and following it t = n = 1; Pj(n) is the magnitude of the impulse at the vertex vj; Qj(n) is the vector of external disturbances introduced at the moment t = n.
The final stage of cognitive modeling of complex systems is the stage of making decisions on the choice and subsequent implementation of the desired scenario for the development of a complex system.
Programs complex of cognitive modeling support are the tools that help the experts to structure knowledge and, the main thing is that systems comprehensively research various aspects of complex system functioning that remain out of sight more often and could lead to incorrect and even dangerous decisions.
In the research, cognitive simulation is supported by the program complex of cognitive modeling, ‘Program for Cognitive Modeling and Analysis of Socio-Economic Systems of the Regional Level’ (CMCS) [33].

3. Results

3.1. Cognitive Map Development

Cognitive modeling in analyzing and managing a socioeconomic system is a study of the functioning and development of weakly structured systems and situations by building a model based on a cognitive map.
The development of a regional socioeconomic system cognitive map in the research was based on the scheme of the regional economic mechanism [34], statistical quantitative data of indicators of the socioeconomic, industrial–technological, and environmental block for assessing the state of the region [35], some of which are given above. The parameters of the life quality equation reflect the functional relationship between some vertices of the cognitive model (Figure 2).
The cognitive model in Figure 2 was made in the CMCS software system [33]. There are functional connections between the model vertices, only two of which, for illustrative purposes, are indicated in the figure as “Quality of life formula (Qi)”—this is Formula (1) and “Migration flow formula”:
d d t P i ( t ) = f P i ( t ) + M t o i ( t ) M o u t i ( t ) ,
where i = 1,…,9, f is the population reproduction rate, Pi is the population of the region at time t, Mito is migration to the region from other regions of the Russian Federation (arrival), and Miout is migration from the region to other regions of the Russian Federation (departure).
Based on the use of the indicated information about a complex regional system, the presence of many levels of management, and causal relationships in it, it was decided that it was necessary to develop a hierarchical cognitive map. For example, this article provides a top-level cognitive map containing vertices in the form of generalizing integral characteristics of the system, e.g., GRP, population, interregional and foreign economic exchange, etc. Table 1 shows the coding of the vertices, their name, and their role.
In accordance with Table 1 and based on the studies of the regional economic mechanism, a cognitive map was built, shown in Figure 3, which is a composition of the cognitive map of the regional mechanism and cognitive map of the quality of life.
The dashed lines in Figure 3 show the negative connection between the vertices, i.e., when the increase/decrease of the signal at the vertex Vi leads to the decrease/increase of the signal at the vertex Vj.

3.2. Analysis of Cognitive Map Properties

In the cognitive modeling process, the graph properties was studied, including its paths and cycles, complexity, connectivity, and stability analysis. Let us present a number of results of these studies. Figure 4 shows a fragment of data on the valence of vertices (by the number of arcs entering and leaving the vertices) of the studied cognitive map G.
As seen in Figure 4, the V10 industrial production vertex (highlighted) has the largest number of arcs so that we can judge its special importance for the system. Changes in it can immediately affect 15 elements (Figure 5) of the system, and one can expect that management actions aimed at developing regional production can provide the greatest effect on the regional system.
Since the main task of the study was to determine the possibility of sustainable development of the regional system, we will show the results obtained in cognitive modeling according to the above sustainability criteria.

3.3. Perturbation Robustness Analysis

To determine the resistance to disturbances (the fourth criterion), the well-known Nyquist criterion in control theory [2,6,16,32] was applied to study the stability of a cognitive map. According to this criterion, the maximum root of the characteristic equation of the matrix RG should not exceed 1 in absolute value. Figure 6 shows the results of calculating the roots of the equation.
The result of the computational experiment shows the instability of such a model to perturbations since |M| = 2.91 > 1. The decision on the need to change the model can only be made after the entire research cycle has been carried out.

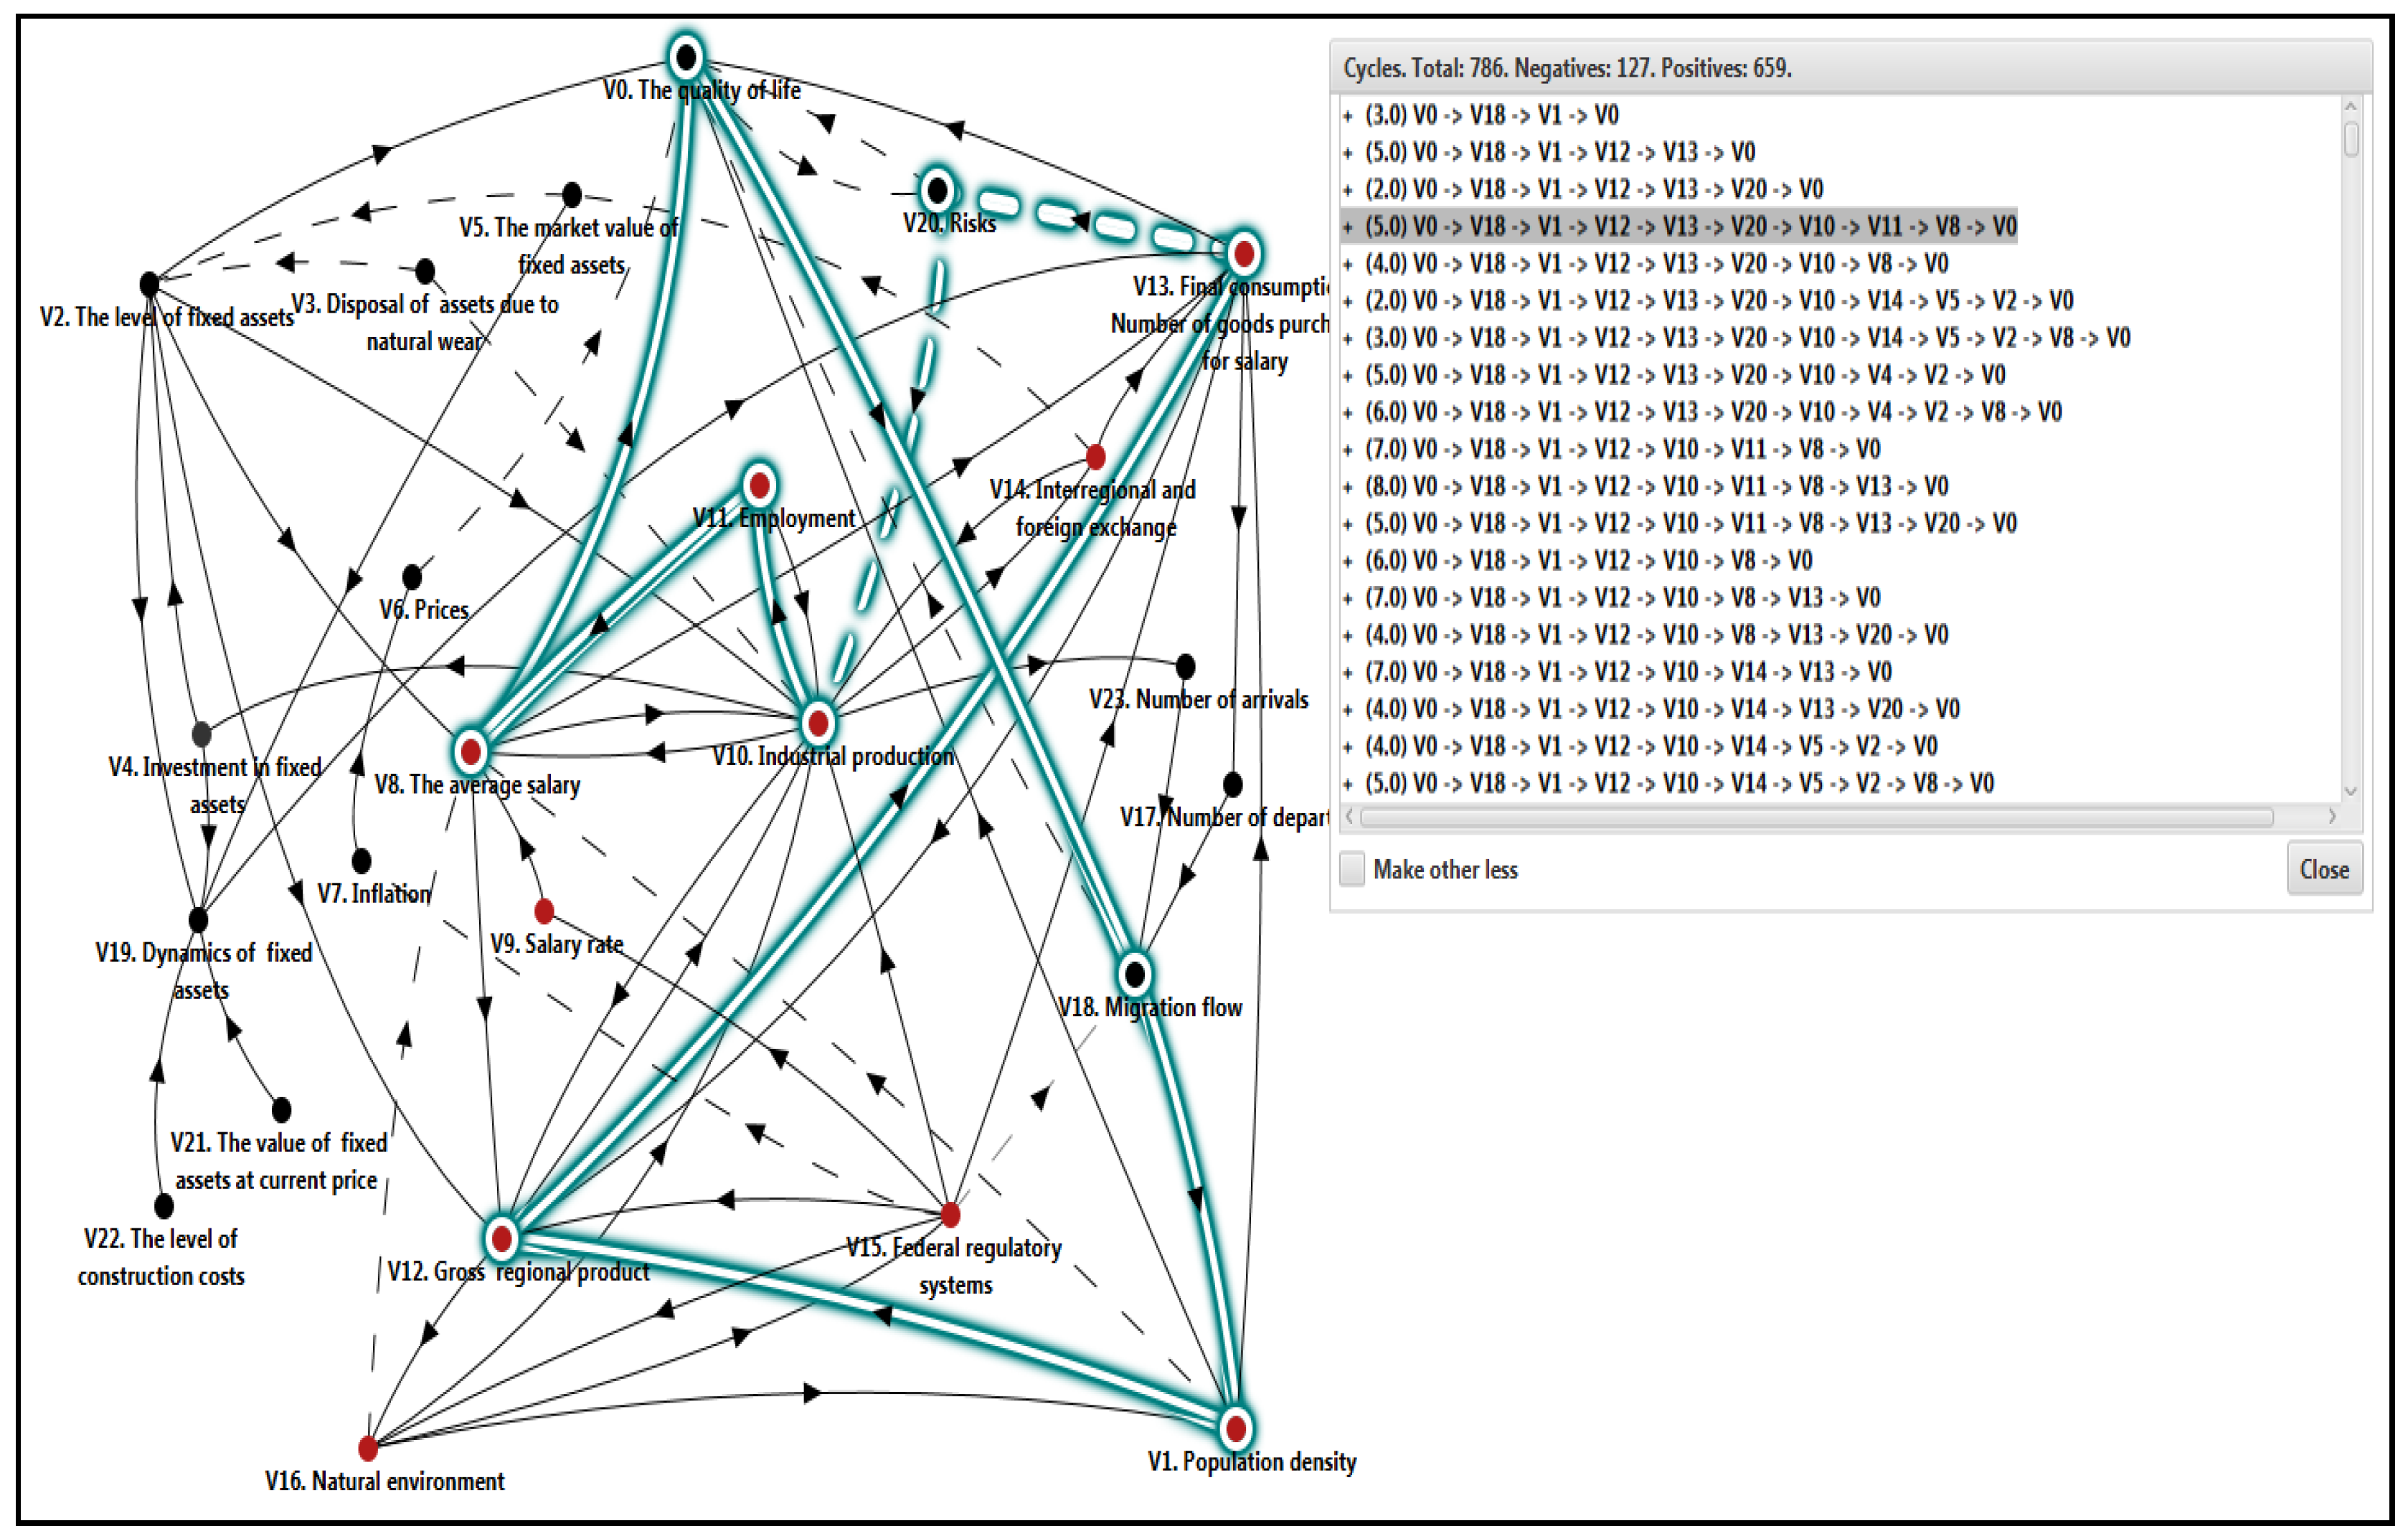
3.4. Analysis of Paths, Cycles and Structural Stability

The conclusion about the structural stability of the system on the simulation model is made after the analysis of the cycles of the graph—the cognitive model. A criterion of structural stability is used in the analysis of cognitive maps [2,6,30,36]; a system model is considered structurally stable if it contains an odd number of negative (stabilizing) feedback loops. Figure 7 and Figure 8 show the analysis of the cognitive model G results cycles.
As we can see (Figure 7 and Figure 8), there are 786 cycles in the model; of these, an odd number of 127 are negative. Therefore, the system is structurally stable, i.e., four criteria are fulfilled.

4. Discussion

4.1. Scenario Modeling

Scenario modeling is carried out by introducing perturbations into the vertices of the cognitive map, which leads to their distribution over the map according to Formula (11). The beginning of scenario modeling requires the preliminary development of an experiment plan—a test program carried out by experts when experiment planning methods can be applied in addition to informal expert decisions [37].
The CMCS software system [33] enables modeling by introducing perturbations into individual vertices and combining them into two, three, or four at the same time. However, introducing perturbations into many vertices at once significantly complicates the interpretation of the results obtained. More than 30 scenarios were developed in this study, and we present three results as the most significant.

4.2. Introducing Perturbations into One Vertex

What will happen if production begins to develop in the region? The model control impulse q10 = + 1 is introduced into the V10 industrial production vertex: impact vector Q1 = {q1 = 0;… q10 = +1; …q23 = 0}. Figure 9 shows the setting of the initiating impulse simulation q10= + 1 to the vertex V10, which is highlighted in Figure 10 by the color, frame, and size of the circle. The results of impulse simulation in CMCS [33] are presented in Figure 10, Figure 11, Figure 12, Figure 13, Figure 14, Figure 15 and Figure 16. Graphs of impulse processes are built according to the data in Figure 10. Due to the conditions of visualization of the trends presentation in the development of processes, the graphs shown reflect the results of 5 modeling steps. Figure 11 highlights the graph of changes in impulses only along the top of V10, into which a control impulse is introduced; in Figure 11a, the graph is shown by a line; in Figure 11b, the graph is in the form of an area characterizing the “volume” of the phenomenon.
Impulse q10 = +1 initiates changes in all vertices of the cognitive map. In Figure 12, Figure 13, Figure 14 and Figure 15, graphs of impulse processes for sets of vertices are shown (the results are divided into parts for clarity). The graphs reflect possible trends in the development of processes in the system of the regional economic mechanism. Figure 16 shows a cognitive model with the vertex weights changed at the fifth cycle of modeling.
The use of a CMCS software system for cognitive modeling of complex systems [33], which allows displaying the results of impulse modeling of scenarios in the form of graphs, areas, histograms, stacks, and a cognitive map with varying vertex weights, expands the ability of an expert to analyze the results obtained based on their various visualization, activates its intuitive abilities, and allows seeing the picture as a whole without losing detail. An analysis of the modeling results of scenario No. 1 allows us to come to the following main conclusion: the development of production (Figure 11) in the region contributes to the improvement of its socioeconomic condition, which is reflected in the positive trends in the development of situations at the tops of the model. For example, as can be seen from Figure 12, Figure 13, Figure 14 and Figure 15, the quality of life tends to improve, final consumption and gross regional product are growing, and risks are decreasing. Such a conclusion of modeling according to the first scenario may seem trivial since it is in accordance with the well-known provisions of economic theory and practice, but in this case, it also confirms the non-contradiction of the developed cognitive model to a real complex system. That is, the model has good predictive capabilities.

4.3. Introducing Perturbations in Two Vertexs

Let the level of fixed assets increase. The acting impulse q2 = + 1 is introduced into the regulated peak V2. The level of fixed assets is represented by impact vector Q2 = {q1 = 0; q2 = +1; …q23 = 0}.
The results of impulse simulation in CMCS are presented in Figure 17, Figure 18, Figure 19, Figure 20 and Figure 21.
Figure 18 shows a graph of changes in the level of fixed assets (Figure 18a), which is compared with a graph of changes in this indicator in the region. As shown in Figure 18, the trends in model changes do not contradict those observed in reality.
Figure 19 shows graphs of changes in the rest of the model vertices.
As can be seen in Figure 15 and Figure 19, an increase in fixed asset level has a positive effect on the development of processes in the region, as in scenario 1. But if we compare the magnitude of possible changes, comparing the histograms of the first and second scenarios (Figure 15 and Figure 19), we see that the direction of efforts to develop production through different methods leads to a greater effect than only by increasing the level of fixed assets.

4.4. Introducing Perturbations in Three Vertexs

Let us assume that risks are growing in the regional system, q20 = +1, but they are opposed by the development of production, q10 = + 1, and the growth of interregional and foreign economic exchange, q14 = +1; impact vector: Q1 = {q1 = 0;… q10 = +1; …q14 = +1;…q20 = +1; …q23 = 0}. Graphs of impulse processes are constructed according to the data in Figure 20. The results of impulse simulation in CMCS [33] are presented in Figure 21 and Figure 22.
Analyzing the graphs in Figure 21, we see that despite the growth of risks up to the third cycle of modeling, their negative impact can be overcome through purposeful, reasonable actions of federal regulatory systems and the development of production. So, after the drop in the first cycles of modeling the impulse at the top quality of life, after the third cycle, the trend of changes in the top becomes positive and increases. This effect is achieved due to the rapidly growing positive trend in the development of production.
As can be seen in Figure 22, an increase in the development of production and the growth of interregional and foreign economic exchange neutralize the negative effect of the risk growing and has a positive effect on the development of processes in the region, Scenario 3. Moreover, if we compare the data of Figure 10, Figure 17 and Figure 20 and the histograms in Figure 15, Figure 19, and Figure 21, scenario 3 shows the best results.

5. Conclusions

The population life quality factors are the most important indicators for the socioeconomic consequences of the ongoing transformations and the degree of tension in society assessment. Improving the population life quality is the most important strategic task in society development at present.
The population’s quality of life is a complex and multidimensional category expressing the level of physical, spiritual, and social needs development and their satisfaction degree, as well as the conditions in society for the development and satisfaction of these needs. Goods that have a real or symbolic form of existence and service are considered as means of satisfying needs.
The issues of the population’s life quality do not lose their relevance since they are the most important component of the modern economy. This study aimed to simulate the cognitive modeling approach in the context of regional sustainable complex system development. The objective was to enhance the quality-of-life outcomes associated with regional sustainable development by employing cognitive simulation methods for complex systems. The models presented in the research have good predictive capabilities.

Author Contributions

Conceptualization, A.F., G.G. and E.L.M.; methodology, G.G.; software, G.G.; validation, A.F., G.G. and E.L.M.; formal analysis, G.G. and E.L.M.; investigation, G.G., E.L.M., A.F. and G.C.; resources, A.F., E.L.M. and E.A.M.; data curation, A.F., E.L.M. and G.C.; writing—original draft preparation, A.F., G.G., E.L.M., E.A.M. and G.C.; writing—review and editing A.F., G.G., E.L.M., E.A.M. and G.C.; visualization, G.G., G.C. and E.L.M.; supervision, A.F.; project administration, A.F.; funding acquisition, A.F. and G.C. All authors have read and agreed to the published version of the manuscript.

Funding

This research received no external funding.

Data Availability Statement

https://61.rosstat.gov.ru/, accessed on 7 September 2023.

Acknowledgments

A.F. and G.C. would like to thank for the support of Saratov State University; G.G. and E.L.M. would like to thank for the support of Southern Federal University; E.A.M. would like to thank for the support of Don State Technical University.

Conflicts of Interest

The authors declare no conflict of interest.

References

  1. Axelrod, R. The Structure of Decision: Cognitive Maps of Political Elites; Princeton University Press: Princeton, NJ, USA, 1976. [Google Scholar]
  2. Casti, J. Connectivity, Complexity and Catastrophe in Large-Scale Systems; John Wiley & Sons: Toronto, ON, Canada, 1979; 216p. [Google Scholar]
  3. Eden, C. Cognitive Mapping. Eur. J. Oper. Res. 1998, 36, 1–13. [Google Scholar] [CrossRef]
  4. Kosko, B. Fuzzy Cognitive Maps. Int. J. Man-Mach. Stud 1986, 24, 65–75. [Google Scholar] [CrossRef]
  5. Langley, P. Cognitive architectures: Research Issues and Challenges. Cogn. Syst. Res. 2009, 10, 141–160. [Google Scholar] [CrossRef]
  6. Roberts, F. Graph Theory and Its Applications to Problems of Society; Society for Industrial and Applied Mathematics: Philadelphia, PA, USA, 1978. [Google Scholar]
  7. Atkin, R.H. Combinatorial Connectivies in Social Systems. An Application of Simplicial Complex Structures to the Study of Large Organisations. In Interdisciplinary Systems Research; Springer: Berlin/Heidelberg, Germany, 1997. [Google Scholar]
  8. Carvalho, J.P. Rule Based Fuzzy Cognitive Maps in Humanities, Social Sciences and Economics. Soft Computing in Humanities and Social Sciences; Volume 273 of the Series Studies in Fuzziness and Soft Computing; Springer: Berlin/Heidelberg, Germany, 2012; pp. 289–300. [Google Scholar]
  9. Abramova, N.A.; Avdeeva, Z.K. Cognitive analysis and management of the development of situations: The problems of methodology, theory and practice. Probl. Manag. 2008, 3, 85–87. [Google Scholar]
  10. Ginis, L.A.; Kolodenkova, A.E. Fuzzy cognitive modeling for the prevention of risk situations at critical infrastructure facilities. Izv. Ufa State Aviat. Tech. Univ. 2017, 4, 113–120. [Google Scholar]
  11. Avdeeva, Z.K.; Kovriga, S.V. On Governance Decision Support in the Area of Political Stability Using Cognitive Maps. IFAC Pap. OnLine 2018, 51, 498–503. [Google Scholar] [CrossRef]
  12. Gorelova, G.V. Cognitive Modeling of Complex Systems: State and Prospects. In Proceedings of the International Conference System Analysis in Engineering and Control, St. Petersburg, Russia, 13–14 October 2021; Lecture Notes in Networks and Systems. Volume 442 LNNS, pp. 212–224. [Google Scholar]
  13. Firsova, A.A.; Makarova, E.L.; Tugusheva, R.R. Institutional Management Elaboration through Cognitive Modeling of the Balanced Sustainable Development of Regional Innovation Systems. J. Open Innov. Technol. Mark. Complex. 2020, 6, 32. [Google Scholar] [CrossRef]
  14. Gorelova, G.; Melnik, E.; Safronenkova, I. The Problem Statement of Cognitive Modeling in Social Robotic Systems. In Interactive Collaborative Robotics, Proceedings of the 6th International Conference, ICR 2021, St. Petersburg, Russia, 27–30 September 2021; Lecture Notes in Computer Science; Springer International Publishing: Cham, Switzerland, 2021; Volume 12998 LNAI, pp. 62–75. [Google Scholar]
  15. Makarova, E.L.; Firsova, A.A. Computer Cognitive Modeling of the Innovative System for the Exploration of the Regional Development Strategy. In Proceedings of the CEUR-WS Second Workshop on Computer Modelling in Decision Making (CMDM 2017), Saratov, Russia, 9–10 November 2017; Volume 2018, pp. 113–125. [Google Scholar]
  16. Gorelova, G.V.; Pankratova, N.D.; Borisova, D.V. Problems of interregional integration, cognitive modeling. IFAC-PapersOnLine 2019, 52, 168–173. [Google Scholar] [CrossRef]
  17. Bell, S.; Morse, S. Sustainability Indicators: Measuring the immeasurable? 2nd ed.; Routledge: London, UK, 2008; 256p. [Google Scholar] [CrossRef]
  18. Shelekhov, A.M. (Ed.) Basic Provisions of the Strategy of Sustainable Development of Russia; Commission of the State Dumas on the Problems of Sustainable Development: Moscow, Russia, 2002; 161p. [Google Scholar]
  19. Gorodnova, N.V.; Samarskaya, N.A. Improving the quality of life of the population in the current economic conditions of Russia. Discussion 2019, 3, 48–58. [Google Scholar]
  20. Bobylev, S. Sustainable Development: Paradigm for the Future. World Economy Int. Relat. 2017, 61, 107–113. [Google Scholar] [CrossRef]
  21. Matrosov, V.M.; Koptyuga, V.A.; Levashova, V.K. A New Paradigm of Russia’s Development (Comprehensive Studies of Sustainable Development Problems); Academia RITs GP «Oblinformpechat»: Moscow/Irkutsk, Russia, 2000; 460p. [Google Scholar]
  22. Gorelova, G.V.; Maslennikova, A.V. Simulation Based Cognitive Methodology and System Dynamics, Analysis of the “South of Russia” System. In Proceedings of the Scientific and Practical Conference “System Analysis in Economics—2012”, Section 2, Moscow, Russia, 27–28 November 2012; CEMI RAN: Moscow, Russia, 2012. 172p. [Google Scholar]
  23. Indicators of Sustainable Development: Guidelines and Methodologies, 3rd ed.; Nations Publication Sales No. E.08.II.A.2; United Nations: New York, NY, USA, 2007.
  24. Volkova, V.N.; Denisov, A.A. Systems Theory and System Analysis: Textbook; Yurayt Publishing: Moscow, Russia, 2014; 616p. [Google Scholar]
  25. Kulba, V.V.; Kononov, D.A.; Kovalevsky, S.S.; Kosyachenko, S.A.; Nizhegorodtsev, R.M.; Chernov, I.V. Scenario Analysis of the Dynamics of the Behavior of Socio-Economic Systems; IPU RAS: Moscow, Russia, 2002; p. 122. [Google Scholar]
  26. Gorelova, G.V. The system of models and methods for cognitive modeling of complex systems. In Proceedings of the XVIII International Scientific and Practical Conference “Systems Analysis in Engineering and Management”, Saint Petersburg, Russia, 1–3 July 2014; St. Petersburg Polytechnic University of Peter the Great: Saint Petersburg, Russia, 2015; pp. 41–51. [Google Scholar]
  27. Gorelova, G.V.; Makarova, E.L. Cognitive modeling of the evaluation characteristics for innovative projects to substantiate management decisions. In the System Analysis in Design and Management, Proceedings of the Collection of Scientific Papers of the XXVI International Scientific and Practical Conference, St. Petersburg, Russia, 13–14 October 2022; Polytech-Press: St. Petersburg, Russia, 2023; pp. 225–234. [Google Scholar] [CrossRef]
  28. Makarova, E.L.; Firsova, A.A. Factors affecting the innovative development of the region. Izv. Saratov Univ. Econ. Manag. Law 2017, 17, 141–147. [Google Scholar]
  29. Makarova, E.L.; Firsova, A.A. Cognitive analysis of the structural stability for the knowledge-intensive sectors of the regional economy. Izv. Saratov Univ. Math. Mech. Inform. 2022, 22, 401–412. [Google Scholar]
  30. Gasitashvili, Z.; Kiknadze, M.; Zhvania, T.; Kapanadze, D. Factors Affecting Sustainable Development and Modelling. In Proceedings of the Recent Developments in Mathematical, Statistical and Computational Sciences, AMMCS 2019, Waterloo, ON, Canada, 18–23 August 2021; Kilgour, D.M., Kunze, H., Makarov, R., Melnik, R., Wang, X., Eds.; Springer Proceedings in Mathematics & Statistics. Springer: Cham, Switzerland, 2021; Volume 343. [Google Scholar]
  31. Tuzhyk, K.; Hewelke, E.; Hewelke, P. Dynamic simulation of sustainable farm development scenarios using cognitive modeling. Ann. Wars. Univ. Life Sci.—SGGW Land Reclam 2017, 49, 43–53. [Google Scholar]
  32. Zgurovsky, M.Z.; Romanenko, V.D.; Milyavskiy, Y.L. Principles and methods of impulse processes control in cognitive maps of complex systems Part I. J. Autom. Inf. Sci. 2016, 48, 36–45. [Google Scholar] [CrossRef]
  33. Gorelova, G.V.; Kalinichenko, A.I.; Kuzminov, A.N. Program for Cognitive Modeling and Analysis of Socio-Economic Systems of the Regional Level, Certificate of Registration of a Computer Program RU 2018661506; Rospatent: Moscow, Russia, 2018. [Google Scholar]
  34. Granberg, A.G. Fundamentals of Regional Economics: Textbook for Universitie, 4th ed.; House of the State University Higher School of Economics: Moscow, Russia, 2004; 495p. [Google Scholar]
  35. Regiony Rossii. Social’no-Ekonomicheskie Pokazateli (Regions of Russia. Socio-Economic Indicators 2019). 2019. Available online: https://gks.ru/bgd/regl/b19_14p/Main.htm (accessed on 12 April 2023).
  36. Kulba, V.; Zaikin, O.; Shelkov, A.; Chernov, I. Scenario analysis of management processes in the prevention and the elimination of consequences of man-made disasters. Procedia Comput. Sci. 2017, 112, 2066–2075. [Google Scholar] [CrossRef]
  37. Adler, Y.P.; Markova, E.V.; Granovsky, Y.V. Planning an Experiment in the Search for Optimal Conditions, 2nd ed.; Nauka: Moscow, Russia, 1976; 139p. [Google Scholar]
Figure 1. Model of a complex system in its environment.
Mathematics 11 04369 g001
Figure 2. Cognitive model (functional digraph) based on the quality-of-life formula.
Mathematics 11 04369 g002
Figure 3. Cognitive model G of the regional socioeconomic system.
Mathematics 11 04369 g003
Figure 4. Determining the number of arcs entering and leaving vertices.
Mathematics 11 04369 g004
Figure 5. A fragment of the relationship matrix RG of the cognitive map G.
Mathematics 11 04369 g005
Figure 6. Calculation of the roots of the characteristic equation of a matrix RG.
Mathematics 11 04369 g006
Figure 7. Highlighting one of the positive cycles of the cognitive map.
Mathematics 11 04369 g007
Figure 8. Highlighting one of the negative cycles of the cognitive map.
Mathematics 11 04369 g008
Figure 9. Impulse process q10 = + 1 in V10 vertex.
Mathematics 11 04369 g009
Figure 10. Results of a computational experiment on the G1 model according to scenario No. 1.
Mathematics 11 04369 g010
Figure 11. Impulse process at the top of V10; (a) line, (b) area.
Mathematics 11 04369 g011
Figure 12. Graphs of impulse processes at the vertices V4, V18, V19, V20, V23, V17, V3, V4.
Mathematics 11 04369 g012
Figure 13. Graphs of impulse processes at the vertices V15, V17, V13, V6, V7, V5, V3, and V9.
Mathematics 11 04369 g013
Figure 14. Graphs of impulse processes at the vertices V2, V0, V10, V11, V8, V22, V1, and V6.
Mathematics 11 04369 g014
Figure 15. Scenario 1: Histogram and stack of results on the fifth cycle of simulation.
Mathematics 11 04369 g015
Figure 16. Changes in vertex weights on the fifth cycle of modeling.
Mathematics 11 04369 g016
Figure 17. Results of a computational experiment on the G1 model according to scenario 2.
Mathematics 11 04369 g017
Figure 18. Changes in vertex weights on the fifth cycle of modeling (a) graph line, (b) statistical data of the region.
Mathematics 11 04369 g018
Figure 19. Graphs of impulse processes for cognitive model G of the regional socioeconomic system, scenario 2.
Mathematics 11 04369 g019
Figure 20. Results of the computational experiment on the G1 model according to scenario 3.
Mathematics 11 04369 g020
Figure 21. Graphs of impulse processes at the vertices V20, V10, V13, and V0; scenario 3.
Mathematics 11 04369 g021
Figure 22. Graphs of impulse processes for cognitive model G of the regional socioeconomic system, scenario 3.
Mathematics 11 04369 g022aMathematics 11 04369 g022b
Table 1. Top-level G cognitive map vertices.
CodeVertice NameVertice Role
V0The quality of lifeGoal
V1Population densityBasic
V2The level of fixed assetsManaged
V3Disposal of assets due to natural wearBasic
V4Investment in fixed assetsBasic
V5The market value of fixed assetsPerturb
V6The current price levelIndicator
V7InflationPerturb
V8The average salaryManaged
V9Salary rateManaged
V10Industrial productionControl
V11EmploymentManaged
V12Gross regional productIndicator, goal
V13Final consumption. Number of goods purchased for salaryBasic
V14Interregional and currency foreign currency exchangeControl
V15Federal regulatory systemControl
V16Nature environmentBasic
V17Number of departuresPerturb
V18Migration flowPerturb
V19Dynamics of fixed assetsBasic
V20Economic and political risksPerturb
V21The value of fixed assets at current priceBasic
V22The level of costs for the construction of fixed assetsBasic, Indicator
V23Number of arrivalsManaged
Disclaimer/Publisher’s Note: The statements, opinions and data contained in all publications are solely those of the individual author(s) and contributor(s) and not of MDPI and/or the editor(s). MDPI and/or the editor(s) disclaim responsibility for any injury to people or property resulting from any ideas, methods, instructions or products referred to in the content.

