Article

Optimal Control Theory and Calculus of Variations in Mathematical Models of Chemotherapy of Malignant Tumors

by
Nina Subbotina
1,2,
Natalia Novoselova
1 and
Evgenii Krupennikov
1,2,*
1
N. N. Krasovskii Institute of Mathematics and Mechanics, 16 S. Kovalevskaya Str., Yekaterinburg 620108, Russia
2
Ural Federal University, 19 Mira Street, Ekaterinburg 620002, Russia
*
Author to whom correspondence should be addressed.
Mathematics 2023, 11(20), 4301; https://doi.org/10.3390/math11204301
Submission received: 19 August 2023 / Revised: 8 October 2023 / Accepted: 11 October 2023 / Published: 16 October 2023

Abstract

:
This paper is devoted to the analysis of mathematical models of chemotherapy for malignant tumors growing according to the Gompertz law or the generalized logistic law. The influence of the therapeutic agent on the tumor dynamics is determined by a therapy function depending on the time-varying concentration of the drug in the patient’s body. The case of a non-monotonic therapy function with two maxima is studied. It reflects the use of two different therapeutic agents. The state variables of the dynamics are the tumor volume and the amount of the therapeutic agent able to suppress malignant cells (concentration of the drug in the body). The treatment protocol (the rate of administration of the therapeutic agent) is the control in the dynamics. The optimal control problem for this models is considered. It is the problem of the construction of treatment protocols that provide the minimal tumor volume at the end of the treatment. The solution of this problem was obtained by the authors in previous works via the optimal control theory. The form of the considered therapy functions provides a specific structure for the optimal controls. The managerial insights of this structure are discussed. In this paper, the structure of the viability set is described for the model according to the generalized logistic law. It is the set of the initial states of the model for which one can find a treatment protocol that guarantees that the tumor volume remains within the prescribed limits throughout the treatment. The description of the viability set’s structure is based on the optimal control theory and the theory of Hamilton–Jacobi equations. An inverse problem of therapy is also considered, namely the problem of reconstruction of the treatment protocol and identification of the unknown parameter of the intensity of the tumor growth. Reconstruction is carried out by processing information about the observations of the tumor volume dynamics and the measurements of the drug concentration in the body. A solution to this problem is obtained through the use of a method based on the calculus of variations. The results of the numerical simulations are presented herein.

1. Introduction

This paper is devoted to the study of mathematical models of chemotherapy of malignant tumors with different laws of the growth of the tumor volume (the generalized logistic law and Gompertz’s law). The research focuses on solid tumors, such as breast, lung, liver, colon, pancreas and prostate cancers. As known, a malignant tumor formed in an organ is capable of uncontrolled or poorly controlled rapid growth of its cells and can penetrate into adjacent tissues, damage them and penetrate further into other organs, resulting in metastases. Spatially homogeneous mathematical models of the growth of solid avascular tumors are considered (on this theme, see, for example, [1,2]).
Usually, in such mathematical models, the total volume of the tumor is considered. The tumor’s dynamics are described using ordinary or partial differential equations. In this paper, we consider tumors with dynamics described by ordinary differential equations that obey the generalized logistic law or the Gompertz law [2,3,4].
Chemotherapy is one of the most effective ways to fight cancer. The effect of a therapeutic agent on a tumor is defined by adding a therapy function to equations of the tumor’s dynamics. This function depends on the time-varying concentration of the drug in the body. The case of a non-monotonic therapy function with two maxima is studied. It reflects the use of two different therapeutic agents. This case has not been previously considered. The infusion and the dissipation of the drug in the body are described in the considered model by ordinary differential equations.
Let us also note another well-known mathematical model of cancer therapy: the Lotka–Volterra predator–prey model. In this model, the therapeutic agent plays the role of the predator, and the tumor plays the role of the victim. For further information on this model, see, for example, [5,6,7].
The tumor growth dynamics are considered over a certain fixed period of time. At the final time instant (the control point), the total tumor volume is estimated. The state variables of the dynamics are the tumor volume and the amount of the therapeutic agent able the to suppress malignant cells (concentration of the drug in the body). The treatment protocol (the rate of administration of the therapeutic agent) is the control in the dynamics.
The optimal control problem is considered. The problem is to construct a treatment protocol (a control) for any initial state of the model (the tumor volume and the concentration of the drug in the body at the beginning of the treatment) such that the tumor volume is minimal at the control point. An optimal treatment strategy and optimal protocols were suggested in [8,9]. Their construction is based on the results of the optimal control theory [10] and the theory of generalized solutions of partial differential equations of the first order [11,12]. The optimal treatment strategy is a feedback depending on the current state of the model: the tumor volume and the concentration of the drug in the body. The optimal treatment protocol is formed on the basis of information about the current state of the model according to the optimal strategy. For any fixed initial state of the model, the optimal treatment protocol ensures the minimal tumor volume at the end of the treatment. It is has been proven that the optimal protocol has a piecewise constant structure with no more than one switch. Construction of optimal therapy strategies and optimal treatment protocols has been previously discussed, for example, in [3,5,6,7,13,14,15,16,17,18]. The innovation of the research presented in this paper is that a new type of therapy function is considered, namely a non-monotonic therapy function with two maxima. It reflects the use of two different therapeutic agents. Such a therapy function provides a specific structure of the optimal control. The managerial insights of such an optimal control are discussed in this paper.
The viability set [19] is described for the model according to the generalized logistic law. It is the set of initial states of the model for which one can find a treatment protocol that guarantees that the tumor volume remains within the prescribed limits and is compatible with life throughout the treatment. In this paper, we propose and substantiate the description of the structure of the viability set for the model according to the generalized logistic law. The justifications of the constructions are based on the theory of generalized solutions of partial differential equations of the first order [11,12]. The viability set for the dynamics according to the Gompertz law was described in [20].
Research on models of chemotherapy of malignant tumors is also of interest to solve inverse problems, for example, identification of the parameter of the model characterizing the intensity of the tumor’s growth and reconstruction of the treatment protocol (the control) for a given patient using the observations of the tumor volume dynamics and the current measurements of the concentration of the drug in the body.
The results of the numerical simulations of the solution of such inverse problems are presented in this paper. They were obtained using a numerical method [21] based on the theory of calculus of variations [22].
It should be noted that a process as complex as the growth and suppression of malignant cells is presented in the models in a simplified, idealized form. Still, the obtained results may be of use for the analysis of experimental data or for the study of new effective therapy methods.

2. Materials and Methods

2.1. Dynamics of the Model

The state variables of the dynamics are the tumor volume ( m ( t ) ) and the amount of the chemotherapy drug ( h ( t ) ) that is able to suppress malignant cells. The therapy function ( f ( h ) ) describes the effect of the drug on the malignant cells. The control (the treatment protocol) ( u ( t ) ) is the amount of the drug injected within the time unit.
The dynamics of the malignant tumor and the concentration of the drug are described by the known model [2,3,4]:
d m ( t ) d t = g ( m ( t ) ) γ m ( t ) f ( h ( t ) ) , d h ( t ) d t = α h ( t ) + u ( t ) , m ( t 0 ) = m 0 , h ( t 0 ) = h 0 , t [ t 0 , T ] .
where 0 t 0 < T < are the starting and control points, γ > 0 is the effectiveness coefficient of the therapy and α > 0 is the dissipation coefficient. The feasible controls are measurable (piecewise constant) bounded functions:
u ( · ) : [ t 0 , T ] U [ 0 , Q ] ,
where Q is the maximum allowed value.
In the model (1), the function g ( m ) describes the law of the tumor’s growth. In this paper, two different models of this law are considered.
  • The Gompertz law:
    g 1 ( m ) = r m θ m ln ( m ) ,
    where the parameter r > 0 characterizes the speed of the tumor’s growth, and θ > 0 characterizes the speed of tumor suppression.
  • The generalized logistic law:
    g 2 ( m ) = r m 1 m θ β ,
    where the parameter r > 0 again characterizes the speed of the tumor’s growth, θ > 0 characterizes the threshold tumor volume and 0 < β 1 changes the steepness of the model’s curve.
These models are described in [2,3,4].
In the both models, the following restrictions are considered:
0 m 0 M , 0 h 0 L ,
where M is the threshold tumor volume compatible with life, and L is the maximum allowed amount of the drug in the body.

2.2. The Therapy Function

The therapy function ( f ( h ) ) describes the effect of the drug on the malignant cells and is an important part of the considered model (1). In this paper, we consider a non-monotonic, continuously differentiable, positive therapy function such that its derivative ( f ( h ) ) has three different roots:
0 < h ^ 1 < h ^ 2 < h ^ 3 L , f ( h ^ 1 , 2 , 3 ) = 0 .
We assume that f ( h ) satisfies the following conditions:
A1.
f ( h ) > 0 h < h ^ 1 , f ( h ) < 0 h > h ^ 3 .
A2.
0 < α h ^ 1 , 2 , 3 < Q .
A3.
f ( h ^ 1 ) = f ( h ^ 3 ) .
A4.
f ( h ) < 0 h ( h ^ 1 , h ^ 2 ) , f ( h ) > 0 h ( h ^ 2 , h ^ 3 ) .
It follows from conditions A 1 A 4 that the roots h ^ 1 and h ^ 3 are the maximum points and that root h ^ 2 is the minimum point of the therapy function ( f ( h ) ).

2.3. Optimal Control Problem

The optimal control problem consists of constructing feasible (piecewise constant) feedback that minimizes the terminal therapy quality index (the value function) ( σ ( m ( T ) ) ). It is different for the two considered models.
  • For the Gompertz law (3):
    σ 1 ( m 1 ( T ) ) = m 1 2 ( T ; t 0 , h 0 , m 0 , u ( · ) ) min u ( · ) .
  • For the generalized logistic law (4):
    σ 2 ( m 2 ( T ) ) = m 2 β ( T ; t 0 , h 0 , m 0 , u ( · ) ) min u ( · ) .
    where m 1 , 2 ( t ) = m 1 , 2 ( t ; t 0 , h 0 , m 0 , u ( · ) ) are the solutions of the system (1), that are generated by a feasible control ( u ( t ) ) for g ( m ) = g 1 ( m ) (3) and g ( m ) = g 2 ( m ) (4), respectively, for the boundary conditions ( t 0 , h 0 , m 0 ) .
The system (1) can be integrated analytically for both g 1 and g 2 . The solutions are:
  • For the Gompertz law (3):
    m 1 ( t ) = m 0 θ ( t t 0 ) exp t 0 t e θ ( t τ ) r γ f ( h ( τ ) ) d τ .
  • For the generalized logistic law (4):
    m 2 ( t ) = θ m 0 exp t 0 t [ r γ f ( h ( τ ) ) ] d τ θ β + β m 0 β r t 0 t exp β τ T [ r γ f ( h ( y ) ) ] d y d τ 1 β .
In each case, h ( t ) = h ( t ; t 0 , h 0 , u ( · ) ) is the solution of the second independent equation of (1).

2.4. Value Function and Optimal Synthesis

We introduce the value function in problems (1), (5) and (1), (6). It matches each boundary condition ( ( t 0 , h 0 , m 0 ) [ 0 , T ] × [ 0 , L ] × [ 0 , M ] ) with the optimal values V a l 1 , 2 respectively for (5) and (6):
V a l 1 , 2 ( t 0 , h 0 , m 0 ) = min u ( · ) σ 1 , 2 ( m 1 , 2 ( T ) )
According to [8,9],:
  • For the Gompertz law (3) [8]:
    V a l 1 ( t 0 , h 0 , m 0 ) = m 0 2 e θ ( T t 0 ) exp 2 r θ ( 1 e θ ( T t 0 ) ) exp 2 γ V 1 ( t 0 , h 0 ) ;
  • For the generalized logistic law (4) [8]:
    V a l 2 ( t 0 , h 0 , m 0 ) = θ β m 0 β e β γ V 2 ( t 0 , h 0 ) θ β e β ( r ( T t 0 ) ) + β m 0 β r t 0 T exp β ( r ( τ t 0 ) + γ V 2 ( τ , h 0 ( τ ) ) ) d τ .
Here,
V 1 , 2 ( t 0 , h 0 ) = max u ( · ) J 1 , 2 ( t 0 , h 0 , u ( · ) )
is the optimal value in the reduced optimal control problem:
d h ( t ) d t = α h ( t ) + u ( t ) , h ( t 0 ) = h 0 .
For the Gompertz law (3), the cost value functional is
J 1 ( t 0 , h 0 , u ( · ) ) = t 0 T e θ ( T τ ) f ( h ( t ; t 0 , h 0 , u ( · ) ) ) d t max u ( · ) .
For the generalized logistic law (4),
J 2 ( t 0 , h 0 , u ( · ) ) = t 0 T f ( h ( t ; t 0 , h 0 , u ( · ) ) ) d t max u ( · ) .
The value functions (10) are constructed piecewise from several functions ( φ i ( · ) ):
V 1 , 2 ( t , h ) = φ 1 ( t , h ) , ( t , h ) G 1 , φ 2 ( t , h ) , ( t , h ) G 2 , φ 3 ( t , h ) , ( t , h ) Π 1 , φ 4 ( t , h ) , ( t , h ) Π 2 , φ 5 ( t , h ) , ( t , h ) Π 3 .
The geometric regions are
G 1 = { ( t , h ) : t [ 0 , T ] , h = h ^ 1 } , G 2 = { ( t , h ) : t [ 0 , T ] , h = h ^ 3 } , Π 1 = [ 0 , T ] × [ 0 , h ^ 1 ) , Π 2 = [ 0 , T ] × ( h ^ 3 , L ] , Π 3 = [ 0 , T ] × ( h ^ 1 , x ( t ) ] , Π 4 = [ 0 , T ] × ( x ( t ) , h ^ 3 ) .
For visualization, see Figure 1. The graph of the x ( · ) function is the Rankine–Hugoniot line
Γ = { ( t , x ( t ) ) : t [ 0 , T ] , x ( T ) = h ^ 2 } ,
as defined by the points where
φ 5 ( t , x ( t ) ) = φ 6 ( t , x ( t ) ) .
It is shown in [9] that the Γ line satisfies the Rankine–Hugoniot conditions with a boundary condition of x ( T ) = h ^ 2 and has the following form:
d x d t = α x ( t ) + Q s h 6 ( t ) s h 6 ( t ) s h 5 ( t ) ,
where
s h 5 ( t ) = φ 5 ( t , x ( t ) ) h , s h 6 ( t ) = φ 6 ( t , x ( t ) ) h .
The functions φ i ( t , h ) , i = 1 , 6 ¯ are constructed by the Cauchy characteristic method for the auxiliary linear Hamilton–Jacobi equations with boundary conditions of the special form [9].
It was proven in [8,20] that the optimal strategy in problems (1), (5) and (1), (6) has the following form:
u 0 ( t , h ) = α h ^ 1 , ( t , h ) G 1 , α h ^ 3 , ( t , h ) G 2 , Q , ( t , h ) Π 1 , 0 , ( t , h ) Π 2 , 0 , ( t , h ) Π 3 , Q , ( t , h ) Π 4 Γ .
Note that all optimal controls ( u 0 ( t ) = u 0 ( t , h 0 ( t ) ) ) satisfy the Pontryagin maximum principle.
Remark 1. 
The process of construction of the optimal treatment strategy (16) is explained and justified in [8,20]. The optimal strategy is a feedback, so the optimal protocols are defined by the current state of the system ( m ( t ) , h ( t ) ) . Their values are chosen following (16).
When the state of the system is in each of the regions ( Π 1 , Π 2 , Π 3 , Π 4 ), the control is either minimal (0) or maximal (Q). When the state of the model transfers from one region to another, the control is switched. The specifics are that the border between regions Π 3 and Π 4 is defined by the Rankine-Hugoniot line (Γ). The conditions that determine this line are non-trivial (15).
The other feature is that the optimal control does not always have a maximal or minimal value. If the state of the system belongs to lines G 1 and G 2 , the optimal control corresponds to special regimes u 0 ( t , h ) = α h ^ 1 and u 0 ( t , h ) = α h ^ 3 . These regimes are stable and provide the optimal effect of the drug, which is achieved at the maximum points of the therapy function.
It follows from Pontryagin’s maximum principle, which provides the basis for the optimal strategy construction, that this control provides the optimal terminal therapy quality index (5) and (6). In other words, it minimizes the tumor volume ( m ( T ) ) at the control point.
The Rankine-Hugoniot line (Γ) plays an important role in the construction of the optimal protocols. The selection of the therapeutic agent depends on what regions the initial state of the model belongs to: Π 2 , Π 4 , G 2 or Π 1 , Π 3 , G 1 .

2.5. The Viability Set

We now define the viability set for the generalized logistic law (1), (6).
Let m 2 0 ( t ) = m ( t ; t 0 , h 0 , m 0 , u 0 ( · ) ) ) be the solution of system (1), (6) with boundary conditions ( t 0 , h 0 , m 0 ) that is generated by the optimal control ( u 0 ( t ) ).
Definition 1. 
The viability set for problem (1), (6) according to the generalized logistic law is a set of the points ( ( t 0 , h 0 , m 0 ) [ 0 , T ] × [ 0 , L ] × [ 0 , M 2 ] ) such that
m 2 0 ( t ; t 0 , h 0 , m 0 , u 0 ( · ) ) M 2 , t [ t 0 , T ] ,
where M 2 is the threshold tumor volume compatible with life specified for the model according to the generalized logistic law.
The parameter M 2 is the stable equilibrium point of the dynamics (1) when the drug effectiveness (that is, the therapy function ( f ( h ) )) is maximal [3]. Thus, consider the following equation:
d m d t = r m 1 m θ β γ m F ,
where
F = f ( h ^ 1 ) = f ( h ^ 3 ) = max h [ 0 , L ] f ( h ) .
Let us find the roots of the right side of (17). The trivial zero root provides an unstable equilibrium. Stable equilibrium takes place when m = m ˜ ,
m ˜ = θ 1 γ F r 1 β .
Therefore, we assume
M 2 = m ˜ .
We introduce set W 2 :
W 2 = ( t 0 , h 0 , m 0 ) [ 0 , T ] × [ 0 , L ] × [ 0 , M 2 ] : V a l 2 ( t 0 , h 0 , m 0 ) [ 0 , M 2 β ] .
We will show that this set is the maximal viability set for problem (1), (6).
Definition 2. 
Set W is the maximal viability set for problem (1), (6) if, for any point ( w = ( t 0 , h 0 , m 0 ) W ) and any measurable function ( u ( · ) : [ t 0 , T ] [ 0 , Q ] ), there exists t * ( t 0 , T ) such that
m ( t * ; t 0 , h 0 , m 0 , u ( · ) ) > M 2 .

3. Results

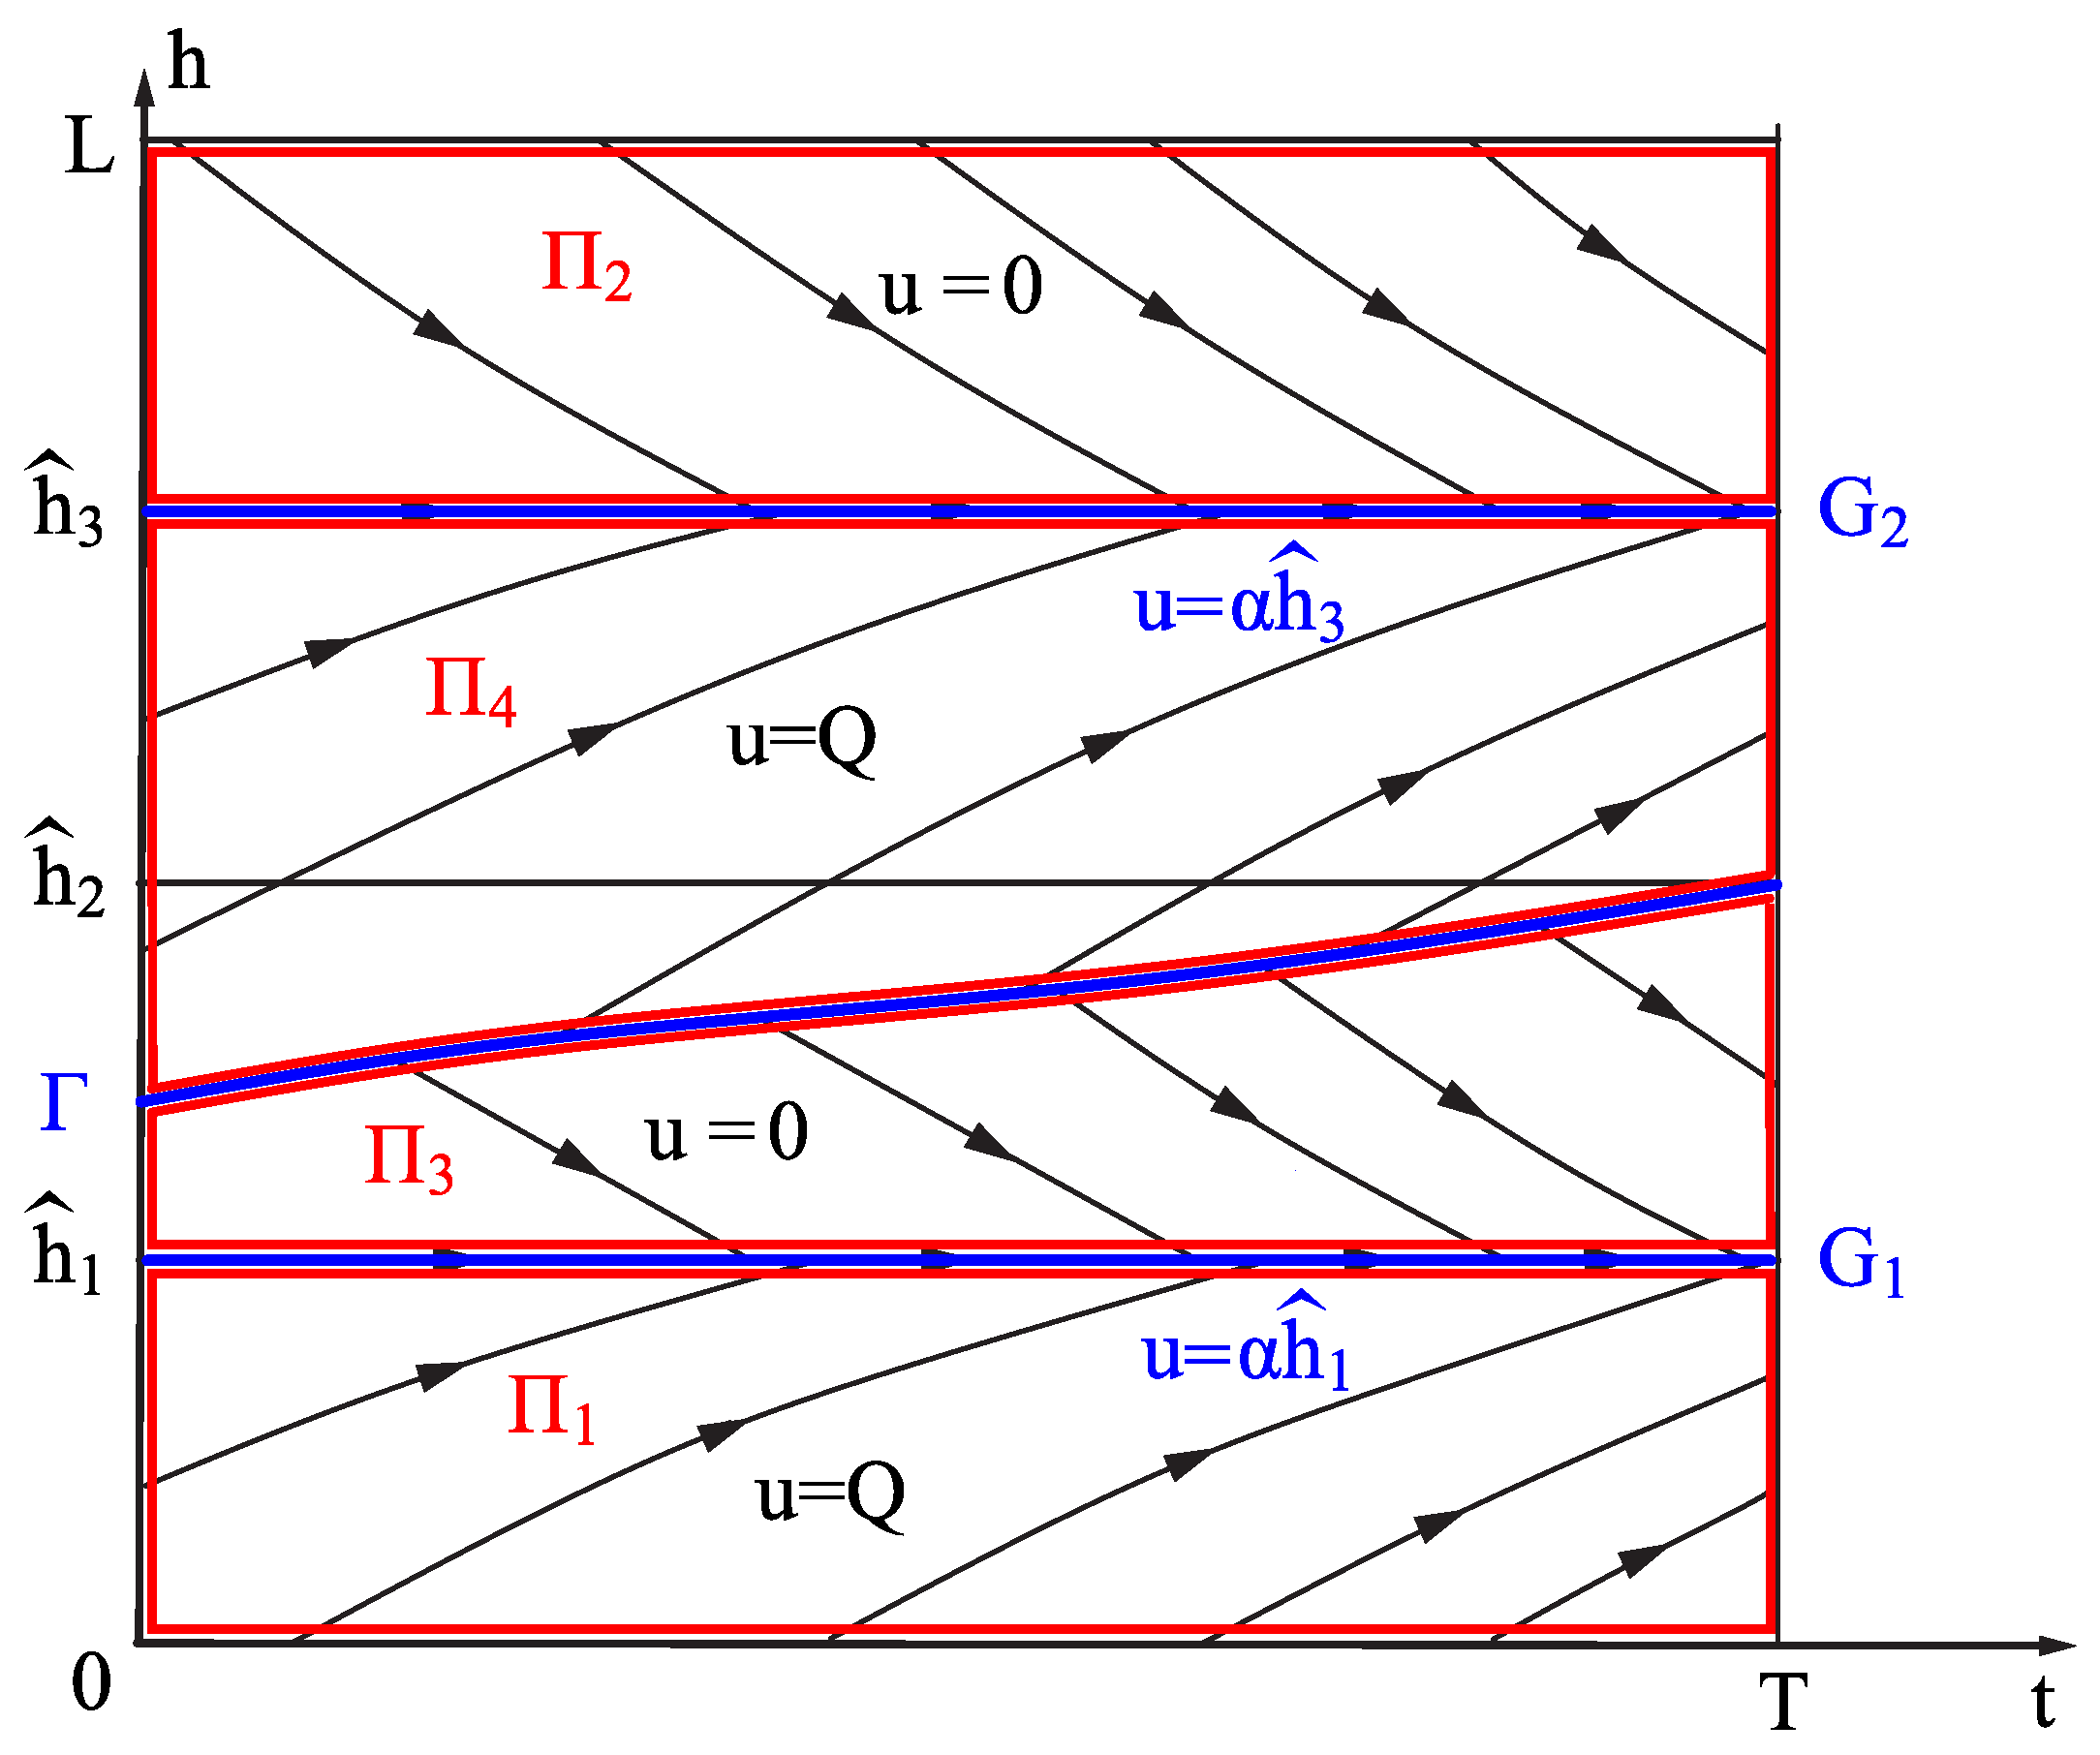
3.1. Construction of Set W 2

In this section, we describe the structure of set W 2 .
First, we transform the expression (9) for V a l 2 ( t 0 , h 0 , m 0 ) into a simpler form. It follows from (12) that in expression (9),
V 2 ( t 0 , h 0 ) = max u ( · ) J 2 t 0 , h 0 ( u ( · ) ) = t 0 T f ( h 0 ( t ) ) d t ,
where h 0 ( t ) = h ( t ; t 0 , h 0 , u 0 ( · ) ) is the solution of the second independent equation of the system (1) that is generated by the optimal feedback control ( u 0 ( t , h ) (16)). Also note that V a l 2 ( T , h 0 ) = 0 . Then,
V a l 2 ( t 0 , h 0 , m 0 ) = θ β m 0 β exp β γ V 2 ( t 0 , h 0 ) θ β e β ( r ( T t 0 ) ) + β m 0 β r t 0 T exp β ( r ( τ t 0 ) + γ V 2 ( τ , h 0 ( τ ) ) ) d τ = θ β m 0 β exp t 0 T β [ r γ f ( h 0 ( τ ) ) ] d τ θ β + β m 0 β r t 0 T exp β τ T [ r γ f ( h 0 ( y ) ) ] d y d τ ,
where h 0 ( · ) is the solution of system (1) that is generated by the optimal feedback control ( u 0 ( t , h ) ) (16).
Note that ( t 0 , h 0 , m 0 ) W 2 if
m 2 0 ( T ; t 0 , h 0 , m 0 , u 0 ( · ) ) = V a l 2 ( t 0 , h 0 , m 0 ) 1 β M 2 .
Thus, it follows from (20) that m 0 W 2 if
m 0 θ M 2 M 2 β β r t 0 T exp β τ T r γ f ( h 0 ( y ) ) d y d τ θ β exp β t 0 T r γ f ( h 0 ( τ ) ) d τ 1 β m ˜ ( h 0 ( · ) ) .
We now successively consider the regions (14) of set [ 0 , T ] × [ 0 , L ] to describe the construction of set W 2 .
(1)
Consider the following points:
( t 0 , h 0 , m 0 ) G 1 × [ 0 , M 2 ] ,
where set G 1 is defined in (14).
It follows from the form of the optimal control (16) that in system (1),
u 0 ( t , h ) = α h ^ 1 , h 0 ( t ) = h 0 ( t ; t 0 , h 0 , u 0 ( · ) ) = h 0 ( t ; t 0 , h ^ 1 , α h ^ 1 ) h ^ 1 .
Then, it follows from (21) that
{ ( t 0 , h 0 , m 0 ) : ( t 0 , h 0 ) G 1 , m 0 [ 0 , m ˜ ( h ^ 1 ) ] } W 2 .
(2)
Consider the following points:
( t 0 , h 0 , m 0 ) G 2 × [ 0 , M 2 ] ,
where set G 2 is defined in (14).
It follows from the form of the optimal control (16) that in system (1),
u 0 ( t , h ) = α h ^ 3 , h 0 ( t ) = h 0 ( t ; t 0 , h 0 , u 0 ( · ) ) = h 0 ( t ; t 0 , h ^ 3 , α h ^ 3 ) h ^ 3 .
Then, it follows from (21) that
{ ( t 0 , h 0 , m 0 ) : ( t 0 , h 0 ) G 2 , m 0 [ 0 , m ˜ ( h ^ 3 ) ] } W 2 .
(3)
Consider the following points:
( t 0 , h 0 , m 0 ) Π 1 × [ 0 , M 2 ] ,
where set Π 1 is defined in (14).
There exist two cases:
(3.a) The graph of h 0 ( t ) does not reach h ^ 1 on [ t 0 , T ] .
Then, it follows from the form of the optimal control (16) that the solution of (1) is
h 0 ( t ; t 0 , h 0 , u 0 ( · ) ) = h 0 ( t ; t 0 , h 0 , Q ) = h 0 Q α e α ( t t 0 ) + Q α .
It follows from (27) that case 3.a occurs when
h 0 < h 3 * ( t 0 ) h ^ 1 Q α e α ( T t 0 ) + Q α .
Therefore, it follows from (21) that
{ ( t 0 , h 0 , m 0 ) : t 0 [ t 0 , T ] , h 0 [ 0 , h 3 * ( t 0 ) ) , m 0 0 , m ˜ h 0 Q α e α ( t t 0 ) + Q α } W 2 .
(3.b) The graph of h 0 ( t ) reaches h ^ 1 :
t 3 * ( t 0 , T ] : h 0 ( t 3 * ; t 0 , h 0 , u 0 ( · ) ) = h 0 ( t 3 * ; t 0 , h 0 , Q ) = h ^ 1 .
It follows from (27) that this case occurs when
h 0 h 3 * ( t 0 )
and
t 3 * = 1 α ln h 0 Q α h ^ 1 Q α + t 0 .
It follows from the optimality principle that
V a l 2 ( t 0 , h 0 , m 0 ) = V a l 2 ( t 3 * , h ^ 1 , m 2 * ( t 3 * ) ) ,
where
m 2 * ( t ) m 2 0 ( t ; t 0 , h 0 , m 0 , u 0 ( · ) ) = m 2 0 ( t ; t 0 , h 0 , m 0 , Q ) .
Therefore, in case 3.b, ( t 0 , h 0 , m 0 ) W 2 when
m 2 0 ( T ; t 0 , h 0 , m 0 , u 0 ( · ) ) = m 2 0 ( T ; t 3 * , h ^ 1 , m 2 * ( t 3 * ) , α h ^ 1 ) M 2 .
However, it follows from case 1 that the latter expression is true when
( t 3 * , h ^ 1 , m 2 * ( t 3 * ) ) G 1 × [ 0 , m ˜ ( h ^ 1 ) ] .
Therefore,
{ ( t 0 , h 0 , m 0 ) : t 0 [ 0 , T ] , h 0 [ h 3 * ( t 0 ) , h ^ 1 ) , m 2 * ( t 3 * ) [ 0 , m ˜ ( h ^ 1 ) ) ] } W 2 .
Remark 2. 
Hereafter, the value of m 2 0 ( t ; t 0 , h 0 , m 0 ) can be calculated according to Formula (7).
(4)
Consider the following points:
( t 0 , h 0 , m 0 ) Π 2 × [ 0 , M 2 ] ,
where set Π 2 is defined in (14).
Similarly to case 3, there exist two cases:
(4.a) The graph of h 0 ( t ) does not reach h ^ 3 on [ t 0 , T ] .
Then, it follows from the form of the optimal control (16) that the solution of (1) is
h 0 ( t ; t 0 , h 0 , u 0 ( · ) ) = h 0 ( t 4 * ; t 0 , h 0 , 0 ) = h 0 e α ( t t 0 ) .
It follows from (31) that this case occurs when
h 0 > h 4 * ( t 0 ) h ^ 3 e α ( T t 0 ) .
Therefore, it follows from (21) that
{ ( t 0 , h 0 , m 0 ) : t 0 [ t 0 , T ] , h 0 ( h 4 * ( t 0 ) , L ] , m 0 0 , m ˜ h 0 e α ( t t 0 ) } W 2 .
(4.b) The graph of h 0 ( t ) reaches h ^ 3 on [ t 0 , T ] :
t 4 * ( t 0 , T ] : h 0 ( t 4 * ; t 0 , h 0 , u 0 ( · ) ) = h 0 ( t 4 * ; t 0 , h 0 , 0 ) = h ^ 3 .
It follows from (31) that this case occurs when
h 0 h 4 * ( t 0 )
and
t 4 * = 1 α ln h 0 h ^ 1 + t 0 .
It follows from the optimality principle that
V a l 2 ( t 0 , h 0 , m 0 ) = V a l 2 ( t 4 * , h ^ 3 , m 2 * ( t 4 * ) ) ,
where
m 2 * ( t ) = m 2 0 ( t ; t 0 , h 0 , m 0 , u 0 ( · ) ) = m 2 0 ( t ; t 0 , h 0 , m 0 , 0 ) .
Therefore, in case 4.b, ( t 0 , h 0 , m 0 ) W 2 when
m 2 0 ( T ; t 0 , h 0 , m 0 , u 0 ( · ) ) = m 2 0 ( T ; t 4 * , h ^ 3 , m 2 * ( t 4 * ) , α h ^ 3 ) M 2 .
However, it follows from case 1 that the latter expression is true when
( t 4 * , h ^ 3 , m 2 * ( t 4 * ) ) G 2 × [ 0 , m ˜ ( h ^ 3 ) ] .
Therefore,
{ ( t 0 , h 0 , m 0 ) : t 0 [ 0 , T ] , h 0 [ h 4 * ( t 0 ) , h ^ 3 ) , m 2 0 ( t 4 * ) [ 0 , m ˜ ( h ^ 3 ) ) ] } W 2 .
(5)
Consider the following points:
( t 0 , h 0 , m 0 ) Π 3 × [ 0 , M 2 ] ,
where set Π 3 is defined in (14).
There exist two cases:
(5.a) The graph of h 0 ( t ) does not reach h ^ 1 on [ t 0 , T ] .
Then, it follows from the form of the optimal control (16) that the solution of (1) is
h 0 ( t ; t 0 , h 0 , u 0 ( · ) ) = h 0 ( t ; t 0 , h 0 , 0 ) = h 0 e α ( t t 0 ) .
It follows from (35) that this case occurs when
h 0 > h 5 * ( t 0 ) h ^ 1 e α ( T t 0 ) .
Therefore, it follows from (21) that
{ ( t 0 , h 0 , m 0 ) : t 0 [ t 0 , T ] , h 0 ( h 5 * ( t 0 ) , x ( t 0 ) ] , m 0 0 , m ˜ h 0 e α ( t t 0 ) } W 2 ,
where x ( t 0 ) is the starting point of Γ curve (see Figure 1).
(5.b) The graph of h 0 ( t ) reaches h ^ 1 on [ t 0 , T ] :
t 5 * ( t 0 , T ] : h 0 ( t 5 * ; t 0 , h 0 , u 0 ( · ) ) = h 0 ( t ; t 0 , h 0 , 0 ) = h ^ 1 .
It follows from (35) that this case occurs when
h 0 h 5 * ( t 0 )
and
t 5 * = 1 α ln h 0 h ^ 1 + t 0 .
It follows from the optimality principle that
V a l 2 ( t 0 , h 0 , m 0 ) = V a l 2 ( t 5 * , h ^ 1 , m 2 * ( t 5 * ) ) ,
where
m 2 * ( t ) = m 2 0 ( t ; t 0 , h 0 , m 0 , u 0 ( · ) ) = m 2 0 ( t ; t 0 , h 0 , m 0 , 0 ) .
Therefore, in case 2.a, ( t 0 , h 0 , m 0 ) W 2 when
m 2 0 ( T ; t 0 , h 0 , m 0 , u 0 ( · ) ) = m 2 0 ( T ; t 5 * , h ^ 1 , m 2 * ( t 5 * ) , α h ^ 1 ) M 2 .
However, it follows from case 1 that the latter expression is true when
( t 5 * , h ^ 1 , m 2 * ( t 5 * ) ) G 1 × [ 0 , m ˜ ( h ^ 1 ) ] .
Therefore,
{ ( t 0 , h 0 , m 0 ) : t 0 [ 0 , T ] , h 0 [ h 5 * ( t 0 ) , h ^ 1 ) , m 2 * ( t 5 * ) [ 0 , m ˜ ( h ^ 1 ) ) ] } W 2 .
(6)
Consider the following points:
( t 0 , h 0 , m 0 ) Π 4 × [ 0 , M 2 ] ,
where set Π 4 is defined in (14).
There exist two cases:
(6.a) The graph of h 0 ( t ) does not reach h ^ 3 on [ t 0 , T ] .
Then, it follows from the form of the optimal control (16) that the solution of (1) is
h 0 ( t ; t 0 , h 0 , u 0 ( · ) ) = h 0 ( t ; t 0 , h 0 , Q ) = h 0 Q α e α ( t t 0 ) + Q α .
It follows from (39) that this case occurs when
h 0 < h 6 * ( t 0 ) h ^ 3 Q α e α ( T t 0 ) + Q α .
Therefore, it follows from (21) that
{ ( t 0 , h 0 , m 0 ) : t 0 [ t 0 , T ] , h 0 [ 0 , h 6 * ( t 0 ) ) , m 0 0 , m ˜ h 0 Q α e α ( t t 0 ) + Q α } W 2 .
(6.b) The graph of h 0 ( t ) reaches h ^ 3 :
t 6 * ( t 0 , T ] : h 0 ( t 6 * ; t 0 , h 0 , u 0 ( · ) ) = h 0 ( t ; t 0 , h 0 , Q ) = h ^ 3 .
It follows from (39) that this case occurs when
h 0 h 6 * ( t 0 )
and
t 6 * = 1 α ln h 0 Q α h ^ 3 Q α + t 0 .
It follows from the optimality principle that
V a l 2 ( t 0 , h 0 , m 0 ) = V a l 2 ( t 6 * , h ^ 3 , m 2 * ( t 6 * ) ) ,
where
m 2 * ( t ) = m 2 0 ( t ; t 0 , h 0 , m 0 , u 0 ( · ) ) = m 2 0 ( t ; t 0 , h 0 , m 0 , Q ) .
Therefore, in case 6.b, ( t 0 , h 0 , m 0 ) W 2 when
m 2 0 ( T ; t 0 , h 0 , m 0 , u 0 ( · ) ) = m 2 0 ( T ; t 6 * , h ^ 3 , m 2 * ( t 6 * ) , α h ^ 3 ) M 2 .
However, it follows from case 1 that the latter expression is true when
( t 6 * , h ^ 3 , m 2 * ( t 6 * ) ) G 1 × [ 0 , m ˜ ( h ^ 3 ) ] .
Therefore,
{ ( t 0 , h 0 , m 0 ) : t 0 [ 0 , T ] , h 0 [ h 6 * ( t 0 ) , h ^ 3 ) , m 2 * ( t 6 * ) [ 0 , m ˜ ( h ^ 3 ) ) ] } W 2 .
Note that it is obvious that
W 2 | t = T = { ( T , h 0 , m 0 ) : ( T , h 0 , m 0 ) W 2 } = T × [ 0 , L ] × [ 0 , M 2 ] .
Therefore, expressions (23), (25), (28), (29), (32), (33), (36), (37), (40) and (41) describe the structure of viability set W 2 (19) for problem (1), (6) according to the generalized logistic law.
Remark 3. 
It was proven in [20] that the viability set for problem (1), (5) according the Gompertz law has the following form:
W 1 = ( t 0 , h 0 , m 0 ) [ 0 , T ] × [ 0 , M 1 ] × [ 0 , L ] : V a l 1 ( t 0 , h 0 , m 0 ) M 1 2 ,
M 1 = e r γ F θ .

3.2. The Maximal Viability Set

Set W 2 , as described in the previous section, is the maximal viability set for problem (1), (6), and the following theorem is true.
Theorem 1. 
The following statements are true:
1.
( t 0 , h 0 , m 0 ) W 2 m 0 M 2 .
2.
Set W 2 (19) is weakly invariant with respect to the differential inclusion: w ˙ Y ( w ) , where
w = ( t , h , m ) Y ( w ) = 1 , g 2 ( m ) γ m f ( h ) , α h + [ 0 , Q ] .
3.
Set W 2 is the maximal viability set for problem (1), (6).
Proof. 
(1) Consider a point ( ( t 0 , h 0 , m 0 ) W 2 ). Let
m 2 0 ( T ) = m 2 0 ( T ; t 0 , h 0 , m 0 , u 0 ( · ) ) M 2 .
Then, one can express m 0 from (20) as:
m 2 0 ( T ) = θ m 0 exp t 0 T F 0 ( τ ) d τ θ β + β m 0 β r t 0 T exp β τ T F 0 ( y ) d y d τ 1 β M 2 ,
where F 0 ( τ ) r γ f ( h 0 ( τ ) ) , and h 0 ( t ) is the solution of (1) generated by the optimal feedback ( u 0 ( t ) = u 0 ( t , h ) ) (16).
Also note the expression for M 2 (18):
M 2 = θ 1 γ F r 1 β ,
where F = f ( h ^ 1 ) = f ( h ^ 3 ) = max h [ 0 , L ] f ( h ) . Thus,
m 2 0 ( T ) β θ β + β m 0 β r t 0 T exp τ T β F 0 ( y ) d y d τ = θ β m 0 β exp t 0 T β F 0 ( τ ) d τ ,
and
m 0 β = m 2 0 ( T ) β θ β θ β exp t 0 T β F 0 ( τ ) d τ m 2 0 ( T ) β β r t 0 T exp τ T β F 0 ( y ) d y d τ .
The following estimates are true:
F 0 ( y ) = r γ f ( h 0 ( y ) ) r γ F > 0 , β F 0 ( y ) β ( r γ F ) , exp β τ T F 0 ( y ) d y d τ exp β ( r γ F ) ( T τ ) .
Apply (43) and (45) to (44):
m 0 β M 2 β θ β θ β exp t 0 T β F 0 ( τ ) d τ θ β 1 γ F r β r t 0 T exp τ T β F 0 ( y ) d y d τ M 2 β e β ( r γ F ) ( T t 0 ) ( r γ F ) β t 0 T e β ( r γ F ) ( T τ ) d τ = M 2 β .
Therefore, for any ( t 0 , h 0 , m 0 ) W 2 , m 0 M 2 .
(2) It follows from the construction of W 2 that all the trajectories ( m 2 0 ( t ; t 0 , h 0 , m 0 , u ( · ) ) ) that start from the inner points ( ( t 0 , h 0 , m 0 ) ) of W 2 stay inside this set for any t [ t 0 , T ] .
We assume that such a trajectory corresponds to a point ( t * , h * , m * ) on the boundary of W 2 . Then, it follows from the optimality principle that
V a l 2 ( t * , h * , m * ) = V a l 2 ( t , h 0 ( t ) , m 2 0 ( t ) ) M 2 , t [ t * , T ] .
In other words, the trajectory does not leave W 2 . Thus, set W 2 is weakly invariant with respect to the differential inclusion (42).
(3) Consider the point ( t ¯ , h ¯ , m ¯ ) W 2 . Then, it follows from (19) that the value function V a l 2 ( t ¯ , h ¯ , m ¯ ) for the optimal control u 0 ( · ) is greater than M 2 :
m 2 0 ( T ; t ¯ , h ¯ , m ¯ , u 0 ( · ) ) > M 2 .
However, due to the continuity of the trajectory ( m 2 0 ( t ; t ¯ , h ¯ , m ¯ , u 0 ( · ) ) ), there exists t * [ t ¯ , T ) such that
m 2 0 ( t * ; t ¯ , h ¯ , m ¯ , u 0 ( · ) ) > M 2 .
For any point ( ( t 0 , h 0 , m 0 ) W 2 ) and any measurable function ( u ( · ) : [ t 0 , T ] [ 0 , Q ] ), according to the definition of the optimal result ( V a l 2 ( t 0 , h 0 , m 0 ) ),
σ 2 ( m 2 ( T ; t 0 , h 0 , m 0 , u ( t ) ) ) V a l 2 ( t 0 , h 0 , m 0 ) > M 2 .
Again, it follows from the continuity of the trajectory ( m 2 ( t ; t 0 , h 0 , m 0 , u ( · ) ) ) that
m 2 ( t * ; t 0 , h 0 , m 0 , u ( · ) ) > M 2 , t * < T .
In other words, the tumor volume exceeds the threshold compatible with life at moment t * , which is earlier than the control point (T).
Therefore, W 2 is the maximal viability set for problem (1), (6). □

3.3. The Inverse Problem

For models of chemotherapy for malignant tumors, it is often of interest to solve inverse problems, for example, to identify the growth parameter (r) in the model of this tumor and to reconstruct the treatment protocol ( u ( · ) ) for the patient using the current measurements of the tumor volume ( m ( t ) ) and the amount of drug ( h ( t ) ) in the body of the patient.
Consider a model according to the Gompertz law:
d m d t = g 1 ( m ) γ m f ( h ) , d h d t = α h + u ( t ) , t [ 0 , T ] , m ( 0 ) = m 0 , h ( 0 ) = h 0 .
The known parameters are:
g 1 ( m ) = r m θ m l n ( m ) , f ( h ) = 0.15 ( sin [ 2.2 h 0.5 π ] + 1 ) , θ = 10 2 , γ = 1 , α = 0.03 , T = 8 , m 0 = 5 * 10 7 , h 0 = 0 .
The feasible controls are measurable (piecewise constant) functions satisfying the following restrictions:
u ( t ) U = [ 0 , Q ] .
The parameters to reconstruct are:
r , u ( · ) .
It is assumed that the process ( m * ( · ) , h * ( · ) ) generated by some unknown feasible control ( u * ( · ) ) is observed at the following time interval:
t [ 0 , T ] , 0 < T < .
Discrete inaccurate measurements ( m i δ , h i δ ) of the process arrive in real time with a uniform time step ( t ). The measurement error is δ = ( δ m , δ h ) :
| m i δ m * ( t i ) | δ m , | h i δ h * ( t i ) | δ h , t i = i t , i = 0 , , N , N = T / t .
The inverse problem is to construct approximations ( r δ ) of parameter r and piecewise constant approximating functions ( u δ ( · ) ) such that:
  • u δ ( t ) U , t [ 0 , T ] ;
  • u δ ( t ) δ 0 , t 0 u * ( t ) almost everywhere on [ 0 , T ] ;
  • r δ δ 0 , t 0 r ;
  • The trajectories ( m δ ( · ) , h δ ( · ) ) of the system (47) that are generated by the reconstructed parameters ( r δ and u δ ( · ) ) converge uniformly to the observed process:
    max t [ 0 , T ] | m δ ( t ) m * ( t ) | δ 0 , t 0 0 , max t [ 0 , T ] | h δ ( t ) h * ( t ) | δ 0 , t 0 0 .
An approach for constructing such approximations was suggested and justified in [21] using the constructions from auxiliary problems of calculus of variations. These constructions are the solutions of Hamiltonian systems. The feature of the approach is the use of non-convex auxiliary variational problems, namely, the integrands of the functionals in the auxiliary problems are d. c. functions [23]. Such an approach proves the stability of the methods based on this approach with respect to the measurement and approximation errors. This approach reduces the inverse problems for dynamical systems to integration of linear ODE systems.
In this paper, we present the results of the numerical simulation for a method based on this approach, as explained and justified in [21].
This method was used in two numerical simulations. In the simulations, the parameters to reconstruct were:
r = 0.18 , u * ( t ) = 1 , t [ 0 , 4 ) [ 6 , 8 ] , 0.1 , t [ 4 , 6 ) .
The graph of the therapy function f ( h ) is shown in Figure 2.
To obtain the inaccurate measurements ( m i δ , h i δ ) of process m * ( · ) , h * ( · ) generated by u * ( · ) , this process was constructed numerically and randomly perturbed with uniform distribution for two sets of the parameters of observation (the measurement error ( δ ) and the time step ( t )). In the first simulation, ( δ m , δ h ) = ( 5 10 5 , 3 10 2 ) , t = T / 20 = 0.4 . In the second simulation, ( δ m , δ h ) = ( 10 5 , 0.6 10 2 ) , t = T / 100 = 0.08 . The approximations of the presumably unknown parameters (52) were constructed based on these sets of data using the method proposed in [21].
The result of the identification in the first simulation are presented as follows. The approximation ( r δ ) of parameter r (52), which characterizes the speed of the tumor’s growth, is
r δ 0.152 , | r r δ | 0.028 .
The results of the reconstruction of the control u * ( · ) in the first simulation are shown in Figure 3.
In this figure (and in Figure 4), the black graph is the control ( u * ( t ) ) (52) to be reconstructed. This control was applied to the model’s system (47) to simulate the inaccurate measurements of the basic (observed) trajectory. The red graph is the piecewise constant control ( u δ ( t ) ), which approximates the reconstructed control ( u * ( t ) ). It was constructed using the variational method suggested in [21].
The process ( m δ ( t ) , h δ ( t ) ) generated by r δ and u δ ( · ) in the first simulation is shown in Figure 5. In this figure (and in Figure 6), the blue graph is the “observed” process ( { m * ( t ) , h * ( t ) } ). It is the trajectory of the model’s system (47) generated by the “unknown” control ( u * ( · ) ) (52) (to be reconstructed). It is supposed that the inaccurate measurements of this trajectory are known. To simulate them, this trajectory was perturbed at discrete points with random error (with uniform distribution). These data are indicated by black dots. The red graph is the process { m δ ( t ) , h δ ( t ) } . It is the trajectory of the model’s system (47) generated by the control ( u δ ( · ) ) (52) (which is the constructed approximation of the “unknown” control ( u * ( · ) )). The aim of these figures is to show that the reconstructed trajectory of the system remains close to the observed trajectory (see condition 4 (51) in the inverse problem statement).
The results of identification in the second simulation are reported as follows. The approximation ( r δ ) of parameter r (52), which characterizes the speed of the tumor’s growth, is
r δ 0.174 , | r r δ | 0.006 .
The results of reconstruction of the control ( u * ( · ) ) in the second simulation are shown in Figure 4. In this figure, the black graph is the control ( u * ( t ) ) (52) to be reconstructed. The red graph is the piecewise constant control ( u δ ( t ) ), which approximates the reconstructed control ( u * ( t ) ).
The process ( m δ ( · ) , h δ ( · ) ) generated by r δ and u δ ( · ) in the second simulation is shown in Figure 6. In this figure, the blue graph is the “observed” process ( { m * ( t ) , h * ( t ) } ). The black dots are the inaccurate measurements of this process. The red graph is the process ( { m δ ( t ) , h δ ( t ) } ) generated by the control ( u δ ( · ) ) (52). The aim of these figures is to show that the reconstructed trajectory of the system remains close to the observed trajectory (see condition 4 (51) in the inverse problem statement).

4. Discussion

In this paper, models of chemotherapy for malignant tumors were studied. In particular, the problem of constructing the optimal control with the aim of minimizing the tumor volume at a given time point was considered. Possible directions for future research may include minimization of the total cost of the drug injected into the patient’s body. For such cases, the cost functional (which is a treatment quality criterion) should have the following form:
t 0 T u 2 ( t ) d t + σ ( m ( T ) ) .
Another problem to consider in the future is minimization of the total volume of the drug in the body for the entire period of treatment, i.e., minimization of the quality criterion
t 0 T h 2 ( t ) d t + σ ( m ( T ) ) .
All these problems can be solved by following the scheme proposed in this paper. The viability sets in these problems can also be constructed.
The models of chemotherapy considered in this paper are the simplest ones. They were previously studied in [3] for the case of a therapy function that is either linear or has a single maximum point. In this paper, we studied a model with a therapy function that has two maximum points. It describes a case in which two different therapeutic agents are used. One maximum point corresponds to maximum efficiency of the first agent and the second to maximum efficiency of the second agent.
The future development of the research presented in this paper will include the study of models tumor growth, which include the dynamics of the healthy cells and the body’s immune system and their interaction with the cancer cells and the drug (see, for example, [6,7,16,17]).
The results of the numerical construction of the viability sets will be presented in the future works.
It should be noted that the studied models are simplified idealizations of real processes. Therefore, the obtained results are informative and recommendatory in nature and require further experimental verification.

5. Conclusions

This paper presents the results of a study of a chemotherapy model of a malignant tumor growing according to the Gompertz law and the generalized logistic law. The optimal therapy strategy and optimal treatment protocols, which were constructed in previous works, were discussed with the aim of minimizing the tumor volume at the control point. We also discussed managerial insights with respect to their structure.
In the model of chemotherapy, a non-monotonic therapy function with two maxima is considered. This function defines the effect of the therapeutic agents on the tumor. Such a therapy function leads to a specific form of the optimal controls. They are piecewise constant functions with no more than one switch. The specifics are that the Rankine-Hugoniot line plays an important role in the construction of the optimal protocols. The position of the initial state of the model with respect to this line affects the construction of the optimal treatment protocols.
The structure of the maximal viability set for the considered model with the generalized logistic law is described. It is the set of the initial states of the model (the tumor volume and the concentration of the drug in the body) such that there exists a treatment protocol (a control) that guarantees that the tumor volume will not exceed the threshold amount compatible with life.
An inverse problem of reconstruction of the protocol of the ongoing treatment and identification of the parameter of the intensity of the tumor’s growth based on the observations of the dynamics of the treatment process is considered. Such problems have never been considered before. A solution to this problem is suggested. The results of the numerical simulations for this problem are presented herein.

Author Contributions

Conceptualization, N.S.; Methodology, N.S. and N.N.; Validation, N.S. and E.K.; Formal analysis, N.N. and E.K.; Data curation, N.S. and N.N.; Writing—original draft, N.N., N.S. and E.K.; Writing—review & editing, N.N., N.S. and E.K.; Visualization, E.K. All authors have read and agreed to the published version of the manuscript.

Funding

The contribution of Nina Subbotina and Evgenii Krupennikov was performed as part of research conducted in the Ural Mathematical Center with the financial support of the Ministry of Science and Higher Education of the Russian Federation (Agreement number 075-02-2023-913).

Data Availability Statement

Not applicable.

Conflicts of Interest

The authors declare no conflict of interest.

References

  1. Araujo, R.P.; McElwain, D.L. A history of the study of solid tumour growth: The contribution of mathematical modelling. Bull. Math. Biol. 2004, 66, 1039–1091. [Google Scholar] [CrossRef] [PubMed]
  2. Marusić, M.; Bajzer, Z.; Freyer, J.P.; Vuk-Pavlović, S. Analysis of growth of multicellular tumour spheroids by mathematical models. Cell Prolif. 1994, 7, 73–94. [Google Scholar] [CrossRef] [PubMed]
  3. Bratus, A.S.; Chumerina, E.S. Optimal Control Synthesis in Therapy of Solid Tumor Growth. Comp. Math. Math. Phys. 2008, 48, 892–911. [Google Scholar] [CrossRef]
  4. Kendal, W.S. Gompertzian growth and as a consequence of tumor heterogeneity. Math. Biosci. 1985, 73, 103–107. [Google Scholar] [CrossRef]
  5. Khailov, E.N.; Grigorenko, N.L.; Grigorieva, E.V.; Klimenkova, A.D. Lotka-Volterra Controlled Systems in the Modeling of Biomedical Processes; MAKS Press: Moscow, Russia, 2021. (In Russian) [Google Scholar]
  6. Grigorenko, N.L.; Khailov, E.N.; Grigorieva, E.V.; Klimenkova, A.D. Optimal strategies in the treatment of cancers in the Lotka–Volterra mathematical model of competition. Tr. Instituta Mat. Mekhaniki URO RAN 2020, 26, 71–88. [Google Scholar] [CrossRef]
  7. Grigorenko, N.L.; Khailov, E.N.; Grigorieva, E.V.; Klimenkova, A.D. Lotka–Volterra competition model with nonmonotone therapy function for finding optimal strategies in the treatment of blood cancers. Tr. Instituta Mat. Mekhaniki UrO RAN 2021, 27, 79–98. [Google Scholar] [CrossRef]
  8. Subbotina, N.N.; Novoselova, N.G. Optimal result in the control problem for a system with piecewise monotonic dynamics. Tr. Instituta Mat. Mekhaniki UrO RAN 2017, 23, 265–280. [Google Scholar]
  9. Subbotina, N.N.; Novoselova, N.G. On Applications of the Hamilton Jacobi Equations and Optimal Control Theory to Problems of Chemotherapy of Malignant Tumors. Proc. Steklov Inst. Math. 2019, 304, 257–267. [Google Scholar] [CrossRef]
  10. Pontryagin, L.S.; Boltyanski, V.G.; Gamkrelidze, R.V.; Mishchenko, E.F. Mathematical Theory of Optimal Processes; Interscience Publishers: New York, NY, USA, 1962. [Google Scholar]
  11. Crandall, G.; Lions, P.L. Viscosity solutions of Hamilton-Jacobi equations. Trans. Am. Math. Soc. 1990, 277, 1–42. [Google Scholar] [CrossRef]
  12. Subbotin, A.I. Generalized Solutions of First Order PDEs. The Dynamical Optimization Perspective; Birkhäuser: Boston, MA, USA, 1995. [Google Scholar]
  13. Schättler, H.; Ledzewicz, U. Optimal Control for Mathematical Models of Cancer Therapies: An Applications of Geometric Methods; Springer: New York, NY, USA, 2015. [Google Scholar]
  14. Moore, H. How to Mathematically Optimize Drug Regimens Using Optimal Control. J. Pharmacokinet. Pharmacodyn. 2018, 45, 127–137. [Google Scholar] [CrossRef] [PubMed]
  15. Kienle Garrido, M.-L.; Breitenbach, T.; Chudej, K.; Borzì, A. Modeling and Numerical Solution of a Cancer Therapy Optimal Control Problem. Appl. Math. 2018, 9, 985–1004. [Google Scholar] [CrossRef]
  16. Bratus, A.; Yegorov, I.; Yurchenko, D. Dynamic mathematical models of therapy processes against glioma and leukemia under stochastic uncertainties. Mecc. Mater. Strutt. 2016, 6, 131–138. [Google Scholar]
  17. Bratus, A.S.; Goncharov, A.S.; Todorov, I.T. Optimal control in a mathematical model for leukemia therapy with phase constraints. Moscow Univ. Comput. Math. Cybernet. 2012, 36, 178–182. [Google Scholar] [CrossRef]
  18. Swan, G.W. Optimal Control Synthesis in Therapy of Solid Tumor Growth. Comp. Math. Math. Phys. 1990, 101, 237–284. [Google Scholar]
  19. Aubin, J.-P.; Bayen, A.M.; Saint-Pierre, P. Viability Theory: New Directions, 2nd ed.; Springer: Berlin/Heidelberg, Germany, 2011. [Google Scholar]
  20. Novoselova, N.G.; Subbotina, N.N. Construction of the viability set in the problem of chemotherapy for a malignant tumor growing according to the Gompertz law. Tr. Instituta Mat. Mekhaniki UrO RAN 2020, 26, 173–181. (In Russian) [Google Scholar]
  21. Subbotina, N.N.; Krupennikov, E.A. Variational Approach to Solving Control Reconstruction Problems. Lobachevskii J. Math. 2022, 43, 1428–1437. [Google Scholar] [CrossRef]
  22. Ioffe, A.D.; Tikhomirov, V.M. Theory of Extremal Problems; North-Holland Publishing: New York, NY, USA, 1979. [Google Scholar]
  23. Strekalovsky, A.S. Elements of Nonconvex Optimization; Nauka: Novosibirsk, Russia, 2003. (In Russian) [Google Scholar]
Figure 1. Construction of the φ i ( · ) and the optimal strategy ( u 0 ( t , h ) ).
Mathematics 11 04301 g001
Figure 2. The f ( h ) function.
Mathematics 11 04301 g002
Figure 3. The approximations ( u δ ( · ) ) of the unknown control ( ( δ m , δ h ) = ( 5 10 5 , 3 10 2 ) , t = T / 20 = 0.4 ).
Mathematics 11 04301 g003
Figure 4. The approximations ( u δ ( · ) ) of the unknown control ( ( δ m , δ h ) = ( 10 5 , 0.6 10 2 ) , t = T / 100 = 0.08 ).
Mathematics 11 04301 g004
Figure 5. The reconstructed process { m δ ( · ) , h δ ( · ) } ( ( δ m , δ h ) = ( 5 10 5 , 3 10 2 ) , t = T / 20 = 0.4 ).
Mathematics 11 04301 g005
Figure 6. The reconstructed process { m δ ( · ) , h δ ( · ) } ( ( δ m , δ h ) = ( 10 5 , 0.6 10 2 ) , t = T / 100 = 0.08 ).
Mathematics 11 04301 g006
Disclaimer/Publisher’s Note: The statements, opinions and data contained in all publications are solely those of the individual author(s) and contributor(s) and not of MDPI and/or the editor(s). MDPI and/or the editor(s) disclaim responsibility for any injury to people or property resulting from any ideas, methods, instructions or products referred to in the content.

