1. Introduction
The rapid advancements in communication networks has had a profound impact on the development of society, and such networks have become a critical part of the infrastructure, underpinning numerous aspects of daily life [
1]. Communication networks play a pivotal role in providing essential services to end users, including social networking, smart-grid management, e-banking services, e-government services, and remote working. The availability of reliable and dependable communication services is paramount to ensure widespread access to these vital services. However, the proper functioning of communication networks is constantly threatened by a wide range of potential disaster events that could result in the simultaneous failure of multiple network components, thereby degrading their operation and performance [
2]. Natural disasters are occurring with increasing frequency worldwide, potentially inflicting significant damage to critical infrastructure, including communication networks [
3]. The breakdowns caused by these disasters can severely disrupt communication networks, rendering their services inaccessible. The impact of natural disasters on communication networks extends beyond service disruptions, hindering rescue and recovery efforts, exacerbating the effects of the disaster, and prolonging the suffering of affected populations [
4].
As indicated by worldwide meteorological observations, the risk posed by natural disasters has been steadily increasing. These disasters can be classified as either predictable (e.g., hurricanes, tornadoes, volcanic eruptions, and fires) or unpredictable (e.g., earthquakes) [
5]. Regardless of their predictability, natural disasters present a grave threat to the backbone networks of a country, necessitating proactive measures to ensure network resilience [
6]. A notable example is Hurricane Katrina, which struck the Southeast United States in August 2005, resulting in substantial damage to Louisiana and Mississippi. Hurricane Katrina damaged the communications infrastructure in the New Orleans metropolitan area, leaving emergency responders and the general public with little ability to share critical information for the co-ordination of response efforts [
6]. In the previous September, the Atlantic Basin experienced the devastating impact of Hurricane Ivan, the strongest hurricane of the 2004 season. The island of Grenada was particularly affected, with the hurricane inflicting severe damage on the electricity and land-based telecommunications networks. The overwhelming demand led to a complete overload of the mobile network. Despite the mobilization of numerous NGOs, institutions, and local workers in St. George, the capital city, establishing communication with external parties proved challenging [
7]. Similarly, the 7.1-magnitude earthquake in Southern Taiwan in December 2006 caused the simultaneous loss of seven underwater lines, disrupting international communications to China, Hong Kong, Korea, Japan, and Taiwan. Another example is the devastating 9.0-magnitude earthquake that struck Japan on 11 March 2011, known as the Great East Japan Earthquake. This earthquake not only caused severe damage to telecommunication switching offices but also wreaked havoc on undersea cables, severely impacting the communication infrastructure. On average, such network outages persist for approximately 10 days.
Natural disasters pose major threats to critical infrastructure such as power systems, necessitating strategies to improve resilience [
8]. As reviewed by Wang et al., power system resilience can be enhanced through coordinated generation scheduling, network hardening and reconfiguration, and integration of smart loads. Power distribution networks face resilience challenges during ice disasters, as emergency response plans made with imperfect information can be risky when executed [
9]. To address this, Wu et al. (2022) proposed a multi-stage framework for urban distribution networks that amends response plans based on updated disaster information to mitigate secondary impacts on critical loads. Transportation networks play an underestimated yet critical role in disaster resilience by providing access to vital services [
10]. As Anderson et al. (2022) discussed, evaluating community resilience requires understanding the direct and indirect impacts of transportation network damage during disasters on equitable service accessibility. They propose an approach to simulate hazard scenarios and the resulting isolation to assess transportation network support for community needs, highlighting the importance of a broad view of transportation’s role in equitable preparedness and response to disasters.
Scientists widely agree that, as global temperatures continue to rise, the frequency and intensity of violent storms, including hurricanes and tornadoes, will escalate. Consequently, it has become imperative to equip backbone networks with the ability to respond swiftly to disruptive events and withstand a wide array of potential natural disasters [
11].
Figure 1 shows the potential consequences of natural disasters on a backbone network. This serves as a reminder of the urgent need to develop robust strategies and solutions that enhance network resilience against the destructive forces of nature. The severity and urgency of this problem have garnered significant attention from the research community, highlighting the importance of network survivability in the face of natural disasters [
12,
13]. However, there exists a considerable research gap concerning the comprehensive analysis and understanding of the impact of these disasters. Properly understanding the underlying patterns and behavior of natural disasters can greatly contribute to the development of more robust and resilient communication networks that are capable of withstanding their destructive effects. By leveraging network resilience tools, we can establish a framework for evaluation of the resilience of communication networks during and after natural disasters. In this paper, we propose a novel evaluation framework called ENRN: Evaluating the Resilience of a Network against Natural disasters. Through systematic evaluation, we can identify vulnerabilities and design more resilient networks that can effectively withstand the impact of such events. Given enough data, the proposed framework can quantify and calculate the robustness and survivability of network infrastructure. We make significant contributions through three main objectives:
Introducing a novel system for evaluating network resilience against natural disasters by leveraging graph-theoretic topological robustness metrics.
Application of the proposed framework to assess the network resilience of the network infrastructure in respect of four real-world U.S.-based network providers against two major hurricanes.
Presenting the findings and inferences of the results obtained for four real-world U.S.-based networks, providing valuable insights into potential network improvements to enhance resilience against natural disasters.
In this research, we aim to address pivotal questions, including: What is the level of resilience exhibited by real-world U.S.-based network providers in the face of disasters? Can network functionality be maintained during and after natural disasters? What strategies can be implemented to enhance network infrastructure in preparation for inevitable future threats? By addressing these essential research gaps, our key objective is to foster the development of more resilient communication infrastructure. This, in turn, will enable efficient communication and the uninterrupted provision of vital services in the aftermath of natural disasters.
The remainder of this article is organized as follows.
Section 2 provides a background in graph theory and a comparative description of the relevant literature on the resilience and survival of disasters in communication networks. The proposed ENRN system is extensively discussed in
Section 3. In
Section 4, the evaluation methodology is discussed, together with our resilience metrics and datasets.
Section 5 details how four backbone networks performed through two significant hurricane events, Katrina and Ivan, in the United States, applying the ENRN algorithm to the dataset associated with these hurricanes. Finally, our conclusions and directions for future research are summarized in
Section 6.
2. Background and Related Work
In this section, we present basic graph notation and centrality measures. In addition, we present related work that utilizes graph-theoretic approaches to network resilience.
2.1. Graph Theory Centrality
A graph-theoretic approach can be employed to model and analyze various large-scale networks, such as cellular communications networks, water distribution networks (WDNs), and internet service providers. By representing these networks as graphs, we gain valuable insights into the behavior of link failures and outages, which directly contribute to their resilience during extreme events, such as hurricanes. In our system model, we define a network infrastructure as , where V represents the major nodes or vertices, such as base stations, junctions, pumps, or grids. These nodes are interconnected by edges (E), which represent power lines, links, pipelines, or other network connections. Each graph has a finite number of nodes and edges, denoted by and , respectively.
To measure the connectivity of a given network using graph-theoretic approach, several metrics can be used, such as average degree of centrality and betweenness.
The degree of centrality
of a node
v indicates its centrality and connectivity within the network.
where
is the degree of the node
v (i.e., the number of edges connected to v), and
is the total number of nodes in the graph [
14]. Nodes with higher degrees are more crucial, and their failure can result in significant losses and outages. Conversely, ensuring the stability of these nodes allows for the establishment of alternative connections to enhance network resilience.
The average degree
can be calculated as follows:
The shortest path
between two nodes
u and
v is the minimum number of edges traversed to travel from
u to
v [
15]. The average shortest-path length
of a graph is the average of the shortest path lengths between all pairs of nodes, calculated as:
can provide insights into the efficiency of communications, water flow, and transport.
The betweenness centrality of a node in a network is a measure of the number of shortest paths from all vertices to all others that pass through that node [
16]. In a graph
G with vertices V, the betweenness centrality
for a node
v is calculated as:
where s and t are nodes in the graph different from v,
is the total number of shortest paths from node s to node t, and
is the number of those paths that pass through v. These basic graph-theoretic metrics can be used to measure connectivity during natural events.
The selection of an appropriate network topology is a critical task, as it plays a significant role in determining the robustness of the network against node removals. The choice of topology affects various important aspects of the network. For example, in a star graph, removing the central node results in complete disconnection. However, a full-mesh topology offers maximum robustness against node removals, but can be expensive to implement in terms of adding all possible links [
17,
18]. The complexity of selecting an optimal topology increases with the number of nodes, often falling into the category of NP-hard problems [
19,
20]. Different graph robustness metrics have been introduced to evaluate the resilience of networks against common attacks, such as node or link removals [
21,
22]. These metrics capture various graph properties, and their selection depends on the specific problem at hand [
23]. Commonly used metrics include node degree, average shortest path length, and diameter, which provide insights into the robustness of a network. Additionally, metrics such as min-cut [
24],
k-connectivity [
17], and all-terminal reliability [
25] have shown promise in measuring robustness against node removals. However, it is important to note that the computation of these metrics is NP-hard, adding complexity to the evaluation process [
25]. Nevertheless, graph theory is a viable tool when it comes to the representation of complex connected networks of nodes. However, several potential robustness graph metrics are discussed in [
26].
2.2. Related Work
Several studies have addressed network resilience to enhance the reliability and survivability of communication networks during natural disasters and large-scale failures. Hossain et al. [
27] proposed metrics and enhancement strategies for grid resilience, evaluating the performance of power grids by simulating critical component failures. However, their study was limited to specific types of power grids, necessitating further investigation into its applicability to other grid types and regions. Liu et al. [
28] presented a survivability-aware routing restoration mechanism for smart-grid communication networks, utilizing a two-phase routing restoration algorithm that did not consider various failure types. Sadeghi Khomami and Sepasian [
29] introduced a pre-hurricane repair team placement model (PHRTPM) to improve the resilience of overhead electricity distribution networks, significantly reducing repair time. However, the limitations included assumptions of constant repair times and a lack of consideration of real-time information during hurricanes.
In a study by Izaddoost and Heydari [
30], a novel approach was proposed to enhance network service survivability during large-scale failure scenarios. They introduced a backup path selection algorithm to improve network survivability under various failure scenarios and validated it through simulation experiments, demonstrating its effectiveness in maintaining network connectivity. However, a limitation of the study was the assumption of equal importance for all network nodes, which may not reflect real-world network dynamics. Pasic et al. [
31] introduced EFRADIR, an enhanced framework for disaster resilience that combines different resilience-enhancing techniques. Although a case study demonstrated the effectiveness of the framework, it did not consider the impact of dynamic network conditions or potential interdependencies between network layers. Tariq et al. [
32] proposed an adaptable resilience framework to measure the impact of disasters on communities at the local level, utilizing a mixed-method approach. The framework can effectively measure community disaster resilience and identify areas for improvement; however, the study’s limitations include its focus on only a single case study, indicating the need to assess its applicability to other communities or disaster types. For the topological properties and fault tolerance of networks using graph-theoretic approaches, several studies investigated computational and topological properties through graph parameters such as degree, diameter, and closeness centrality [
33,
34,
35].
Raayatpanah et al. [
36] presented a design for survivable wireless backhaul networks, optimizing network design by considering the probability of link failures and the importance of nodes. Simulation experiments demonstrated the model’s effectiveness in improving network survivability, but dynamic network conditions and different failure types were not considered. Sterbenz et al. [
37] proposed a comprehensive framework for evaluating network resilience, including natural disasters, equipment failures, and human errors. Although case studies validated the framework’s effectiveness, the authors did not consider real-time network changes or potential dependencies between network components. In the context of content-centric networks and many-to-many routing, Davis and Vokkarane [
38] investigated failure-aware protection and proposed a routing algorithm considering network failures and content request patterns to improve resilience. However, dynamic network conditions and different failure types were not accounted for. Astaneh et al. [
39] explored the trade-offs between risk and operational cost in SDN failure recovery plans, proposing a risk-aware plan that balanced failure probability and operational costs. Simulation experiments demonstrated its effectiveness, but its disadvantages included assumptions of constant failure probabilities and limited consideration of different network conditions.
In the context of SDN-enabled smart city networks, Aljohani and Alenazi [
40] proposed MPRESISDN, a multi-path resilient routing scheme that improves network resilience by considering multiple paths during failure scenarios. Simulation experiments were conducted to validate the scheme’s effectiveness in maintaining network connectivity, although they did not account for dynamic network conditions or different failure types. Habib et al. [
13] focused on disaster survivability in optical communication networks, considering the spatial and temporal characteristics of disasters; although the authors claimed that the method could maintain network connectivity during disasters, the study’s limitations included assumptions of constant disaster probabilities and a lack of consideration of different network conditions. Gardner et al. [
41] proposed a resilience-aware SLA model that utilized service-level agreements to ensure network resilience against disasters, considering network failures, resource availability, and service-level objectives. The model’s effectiveness in improving network resilience was demonstrated through a case study. In the study by An et al. [
42], the resilience evaluation of multi-path routing against network attacks and failures was investigated. A novel resilience metric was proposed, which can accurately measure network resilience by considering vulnerability to attacks and failures. However, the study’s limitations included a lack of consideration of real-time network changes and potential dependencies between different network components.
Agarwal et al. [
43] studied the impact of single, multiple, and probabilistic physical attacks on network connectivity. They developed models to quantify the vulnerability in the form of the number of nodes or links that must be attacked to partition the network. However, the study only considered targeted attacks without showing natural events. Neumayer et al. [
44] specifically analyzed the effect of geographically correlated network failures by modeling spatial dependency between failures. They developed a polynomial-time algorithm for finding a worst-case cut and used it on Alcatel’s submarine network map in order to obtain numerical results. However, the analysis was limited to failures within a single network. Das et al. [
45] studied failures in an interconnected power communication system and developed techniques for root cause analysis of such failures. They demonstrated the cascading effects of failures to validate their analytical results through experiments in the power communication network of Maricopa County.
Table 1 presents a comparative analysis of the studies retrieved through an exhaustive literature review, focusing on the main contributions of the various studies and the aspects of network resilience that they address. The literature review highlights significant research efforts in the field of network resilience, specifically focusing on enhancing the reliability and survivability of communication networks during natural disasters and large-scale failures. Although several studies have proposed effective approaches and mechanisms, there are certain limitations that need to be addressed to further improve network resilience. Our proposed system addresses these limitations by adopting a graph-theoretic approach that leverages real-time weather data to evaluate the impact of hurricanes on backbone networks. Furthermore, we utilize the real-world backbone types of U.S.-based telecommunication networks, thus providing a realistic assessment of network resilience. The proposed system is rigorously evaluated using data from two major hurricanes, allowing us to analyze the results in the context of connectivity preference metrics. By taking these factors into account, our proposed scheme offers several advantages over existing approaches. It incorporates real-time weather data, enabling more accurate assessment of the network’s vulnerability to hurricanes. Additionally, the utilization of real-world backbone-type networks ensures the practical relevance of our findings. A comprehensive evaluation using actual hurricane data further strengthens the reliability and applicability of our proposed system.
3. The Proposed ENRN System for Evaluating Network Resilience
In this section, we present the proposed system’s components and their interaction. We introduce the main algorithm that evaluates and monitors networks in natural disasters. In addition, we present a discussion of our implementation and the tools used to integrate the whole system.
3.1. Components of the Proposed System
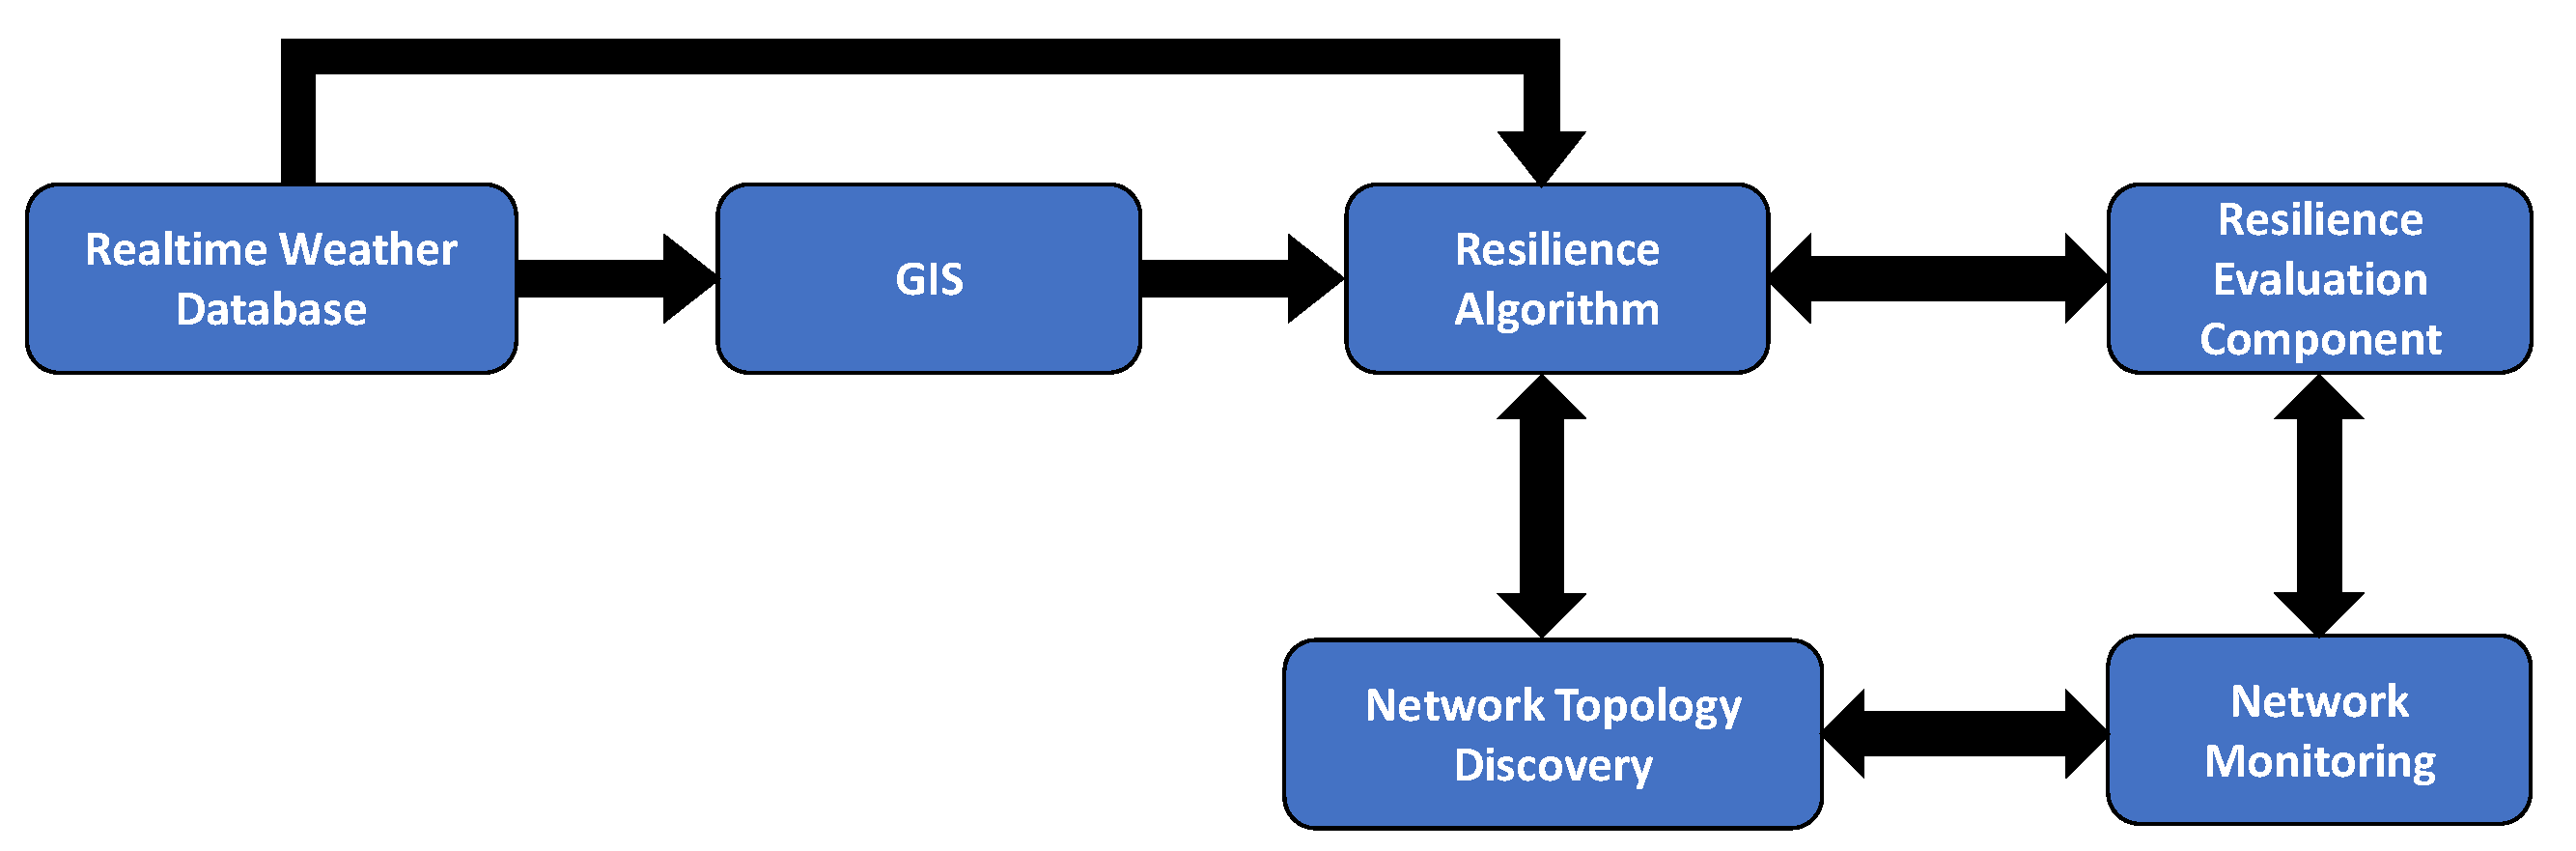
We propose a novel evaluation framework, called ENRN, in order to identify the resilience of communication network infrastructure against natural disasters. There are six major components that coherently work together to enable the identification of actionable observations.
Figure 2 illustrates the communication between the components of the proposed framework.
The real-time weather database serves as a reliable source of current weather data, supplying information on ongoing and predicted natural disasters, such as storms, floods, and earthquakes. These data are vital for accurate and timely assessments, and are utilized by the GIS and resilience algorithm components. The GIS component processes the real-time weather database data in conjunction with geographic information to identify high-risk areas susceptible to natural disasters. This information is then utilized by the resilience algorithms for network resilience evaluation. The network topology discovery component collects comprehensive data on the physical and logical structure of the network, including node and link properties, which are subsequently analyzed by the resilience algorithm component. In particular, using data from the real-time weather database, GIS, and the network topology discovery components, the resilience algorithm component assesses network resilience by employing various algorithms that analyze and determine the impact of natural disasters on network performance. This algorithm takes the network topology and information on disrupted components as input; it then computes the resilience metrics, including the largest connected component size, shortest path lengths, and flow robustness. The algorithm is optimized to efficiently analyze large-scale networks and quantify resilience degradation during disasters. A key benefit is the ability to pinpoint vulnerable areas based on how resilience metrics change when specific components fail. By identifying weaknesses, preventive measures can be taken to strengthen network robustness. The detailed information of this algorithm is discussed in
Section 3.3. The resilience evaluation component generates insightful reports based on the assessments carried out by the resilience algorithm component. These reports provide valuable information regarding the network’s resilience against natural disasters, enabling network operators to proactively enhance resilience and mitigate potential risks. Additionally, the Network Monitoring component continuously observes the network’s performance, detecting anomalies and potential threats in real-time. By doing so, it ensures the network’s resilience against natural disasters and provides immediate feedback on the effectiveness of implemented measures.
3.2. Interoperability of System Components
The integrated system components work in synergy to fulfill the primary objective of evaluating network resilience in the face of natural disasters. The real-time weather database serves as a vital data source, feeding crucial information to the GIS and resilience algorithm components. In the GIS component, these data are merged with network topology details, providing a comprehensive understanding of the network’s physical landscape. The network topology discovery component plays a pivotal role by supplying essential structural information to the resilience algorithm component, empowering it to assess the network’s susceptibility to natural disasters. The resilience evaluation component leverages these assessments to generate informative reports, enabling network administrators to make data-driven decisions for network resilience improvement. Simultaneously, the network monitoring component diligently monitors the network’s performance, promptly detecting any changes that may indicate the impact of a natural disaster.
This combined observation guarantees a swift response and facilitates effective recovery measures. The collective efforts of these system components contribute to a comprehensive evaluation of network resilience, empowering network operators to safeguard critical communication infrastructure against the disruptive forces of natural disasters.
3.3. Proposed ENRN Evaluation Algorithm
Algorithm 1 presents a comprehensive framework for determining and assessing network resilience indicators in the presence of natural disasters. The algorithm consists of three main phases: determining the natural challenge track, identifying potential network component failures, and evaluating network resilience.
| Algorithm 1: ENRN Evaluation Algorithm |
![Mathematics 11 04250 i001]() |
In the first phase of the algorithm, the primary objective is to calculate the path or trajectory of the natural challenge (e.g., a hurricane, tornado, or other natural disasters). The algorithm achieves this by employing two functions: WeatherDB and AffectedBoundaries. The WeatherDB function retrieves the weather forecast data for the monitored area, which is specified by the user. This function returns data in the JSON (JavaScript Object Notation) format, which is a lightweight data-interchange format. The JSON data represent the predicted trajectory of the natural challenge. Following this, the AffectedBoundaries function is utilized. This function takes the path of the natural challenge derived from the WeatherDB function as an input and converts it into geographical coordinates. These coordinates essentially set the boundaries of the area expected to be affected by the natural challenge. The boundaries are then supplied to the GIS-Map function. This function employs a geographical information system (GIS), a tool used for gathering, managing, and analyzing data rooted in the science of geography. Based on the supplied boundaries, the GIS-Map function generates two key outputs:
affectedMap—A graphical representation highlighting the regions likely to be impacted by the natural disaster. This map is crucial for visualizing the potential impact area and for developing mitigation strategies.
ChallengeTrack—The potential path of the natural disaster within the monitored area, plotted based on the boundaries derived from the AffectedBoundaries function.
In the second phase of the algorithm, the primary focus is to identify potential network component failures. This phase is achieved by using the NetworkTopology function, which takes the NetworkProvider and the affectedMap as inputs, and tags the backboneNetwork within the disaster-prone area. The algorithm then iterates through each node in the backboneNetwork, checking its location relative to the ChallengeTrack (which represents the expected path of the natural disaster). This process helps in identifying the affectedNodes, i.e., the nodes that are anticipated to fail during the disaster.
Moving into the third phase, the algorithm calculates the resilience of the network by analyzing the affectedNodes. For each node in the affectedNodes list, the node is removed from the backboneNetwork, and the connectivity function is used to evaluate the connectivity of the remaining network. The output of the connectivity function is an Rvalue, which represents the resilience of the network after the node has been removed. The algorithm repeats this process for each node in the affectedNodes list, accumulating the resulting Rvalues in the ResilienceValues list. This list provides a comprehensive assessment of the network’s resilience to the natural disaster, thereby offering insights into how the network might fare and where reinforcements might be necessary.
The ENRN evaluation algorithm provides a robust framework for researchers to evaluate network resilience in the face of natural disasters. By determining the challenge track, identifying potential failures, and assessing network resilience, the algorithm offers valuable insights into network performance during adverse events. This understanding enables network providers to make informed decisions to improve infrastructure and mitigate the impact of natural disasters on their services.
3.4. System Implementation
The proposed ENRN framework was implemented in Python to integrate the system components, leveraging key Python libraries and tools. NetworkX [
46] was used for graph-theoretic metrics and analysis in the resilience algorithm component, providing efficient graph algorithms and data structures. Geopandas [
47] processed spatial data in the GIS component and overlaid network topology by extending pandas to support the merging of geographic data. Contextily [
48] added to the visualization capabilities to the resilience evaluation component by including Google/OSM map tiles in Geopandas plots. NetworkX abstracted the network topology as graphs, and Geopandas served as the central data structure integrating spatial weather data with infrastructure. This implementation in Python demonstrated the feasibility of prototyping the proposed ENRN framework using real datasets and highlighted the capabilities of these tools in evaluating network resilience through the interoperability of components.
4. Dataset and Evaluation Methodology
The performance evaluation of the proposed graph-theoretic ENRN framework focuses on assessing the resilience and survivability of network infrastructure in the face of natural disasters; specifically, hurricanes. To showcase the effectiveness of our solution, we conducted extensive experiments on real-world networks provided by four U.S.-based network providers. We specifically evaluated the performance of these network infrastructures during two significant hurricane events; namely, Hurricane Katrina in 2005 and Hurricane Ivan in 2004. To facilitate our evaluations, we represented the network data as graphs and utilized the NetworkX Python library for analysis [
49]. The dataset used for our experiments includes comprehensive information gathered from various sources, enabling a thorough representation of the impacts of the hurricanes on telecommunication networks. By leveraging this dataset and applying the proposed ENRN framework, we aim to gain valuable insights into the resilience and effectiveness of the network infrastructure during these natural disasters.
4.1. Network Infrastructure and Hurricanes Dataset
Hurricane Katrina, which took place in August 2005, was one of the deadliest and costliest hurricanes in the history of the United States. The telecommunications infrastructure suffered significant damage during the hurricane, leading to widespread outages and disruptions in communication services. The impact of Hurricane Katrina on the communication infrastructure highlights the importance of network resilience in disaster environments [
50,
51]. Hurricane Ivan occurred in September 2004 and caused widespread damage to the telecommunications infrastructure in the affected areas. The hurricane disrupted communication services, affecting the management of complex and dynamic operations during the disaster. The dataset includes information on the extent of the damage, recovery efforts, and the lessons learned to improve network resilience in the face of future natural disasters. The study also utilized data from the National Hurricane Center’s (NHC) tropical cyclone historical database, known as HURDAT (HURricane DATabase). The HURDAT database provides crucial information about past tropical cyclones in the Atlantic and North-East/Central Pacific regions [
52].
In this study, we consider four major U.S.-based network providers: AT&T, Internet2, Level3, and Sprint [
53]. The dataset was acquired from KMI Corporation, specifically the “North American Fiberoptic Long-haul Routes Planned and in Place”. This dataset provides detailed information on the fiber optic cables of four major U.S.-based network providers: AT&T, Sprint, Level3, and Internet2. It includes data on the physical and logical structure of these networks, allowing for an in-depth evaluation of their resilience against natural disasters such as hurricanes. In addition, our analysis of the dataset provides information such as the number of nodes, connecting links, the radius and diameter of the geographical network, and average hop counts that connect nodes with each other. AT&T, being the largest provider, has the highest number of nodes and the densest network, whereas the Internet2 service has a smaller number of physical nodes across the country. The density and connectivity of nodes directly impact the resilience or availability of alternative paths in the case of failures. However, a greater number of nodes means higher capital, operational, and repair costs.
Table 2 details the various properties of the backbone network providers.
4.2. Performance Evaluation Metrics
We define four performance metrics to evaluate the resilience of the communication network infrastructure, denoted as . These metrics provide a quantitative assessment of backbone network resilience during hurricanes and assist in identifying vulnerabilities and improvement strategies. The metrics are node failure, link failure, largest component size, and flow robustness, each of which contributes to the comprehensive evaluation of network resilience. By utilizing these graph-theoretic performance metrics, we can quantitatively analyze and identify the strengths and weaknesses of a network against natural disasters. This assessment provides valuable insights for improving network resilience and addressing vulnerabilities.
Node failure (
) measures the impact on the network when specific nodes malfunction, or are removed or disconnected, due to natural events such as hurricanes. This metric quantifies the network’s ability to maintain connectivity when certain nodes are compromised [
54]. It is computed as the ratio of the number of nodes remaining in the largest connected component to the total number of nodes in the network, as follows:
where
is the set of failed nodes, and
V is the set of all nodes in the network.
In addition to node failure, another key performance metric for evaluating network resilience is link failure (
). This metric assesses the impact on the network when specific links are disrupted or removed due to a hurricane. Link failure provides insights into the network’s ability to maintain connectivity and data transfer when certain links are compromised [
54]. By quantifying the proportion of intact links in the largest connected component, we can gauge the network’s robustness against link failures during hurricanes. This metric helps to identify vulnerable areas and potential points of failure within the network infrastructure. It is computed as the ratio of the number of links remaining in the largest connected component to the total number of links in the network, as follows:
where
is the set of failed links, and
E is the set of all links in the network.
In evaluating network resilience during hurricanes, an important metric to consider is the size of the largest connected component (
). This metric provides insights into the overall connectivity of the network after a hurricane, taking into account both node failures and link disruptions [
55]. By considering the
value, we can assess the network’s ability to maintain a significant portion of its connectivity despite the impact of the hurricane. A larger
indicates a higher level of resilience, as more nodes remain interconnected, facilitating continued communication and data transfer within the network.
is calculated as the ratio of the number of nodes in the largest connected component to the total number of nodes in the network:
where
is the set of nodes in the largest connected component, and
V is the set of all nodes in the network.
Flow robustness is a crucial graph metric that quantifies the resilience of communication in a network by measuring the ratio of reliable flows to the total number of flows. A flow is considered reliable if it maintains at least one unbroken path despite the presence of node or link failures. The total number of flows in a network with
V nodes is given by
, representing all possible node–pair communications. Flow robustness captures the network’s ability to sustain communication between nodes even in the face of disruptions. This provides valuable insights into the network’s capacity to maintain connectivity and ensure the uninterrupted flow of information [
26]. The range for flow robustness values is
, where 1 indicates that all the nodes can communicate with each other, and 0 means there is no node–pair communication in the whole network (i.e., there are no links in the graph). We also define
as the set of components in a graph
G. A rough estimation of
can be calculated as follows:
where
represents the
ith connected component in graph
G, the total number of connected components is defined as
k, and
V represents the set of nodes in the graph
G.
takes on a value between 0 and 1, where a higher value indicates greater robustness.
These four metrics are used to assess the connectivity function, shown in Algorithm 1. We note that in our proposed system, any graph-theoretic connectivity function can be used. Utilization of these four graph-theoretic performance metrics allows for a comprehensive quantitative assessment of backbone network resilience in the face of hurricanes and other natural disasters. By using these metrics for evaluation, we can gain valuable insights into the network’s vulnerabilities and areas that require improvement. This knowledge is instrumental in ensuring the uninterrupted operation of critical infrastructure during extreme weather events.
5. Results and Discussion
In this section, we present the results of our evaluation of the survivability and resilience of four major U.S.-based communication networks—namely, AT&T, Internet2, Level3, and Sprint—during hurricanes Katrina and Ivan. The evaluation was conducted using the proposed ENRN algorithm, which allowed us to calculate novel performance metrics, including node failure, link failure, the sum of the largest connected components, and flow robustness. These metrics provide insights into the ability of the networks to withstand and recover from the impact of hurricanes, highlighting their strengths and weaknesses in terms of resilience.
5.1. ENRN Algorithm Results for the Hurricane Katrina Dataset
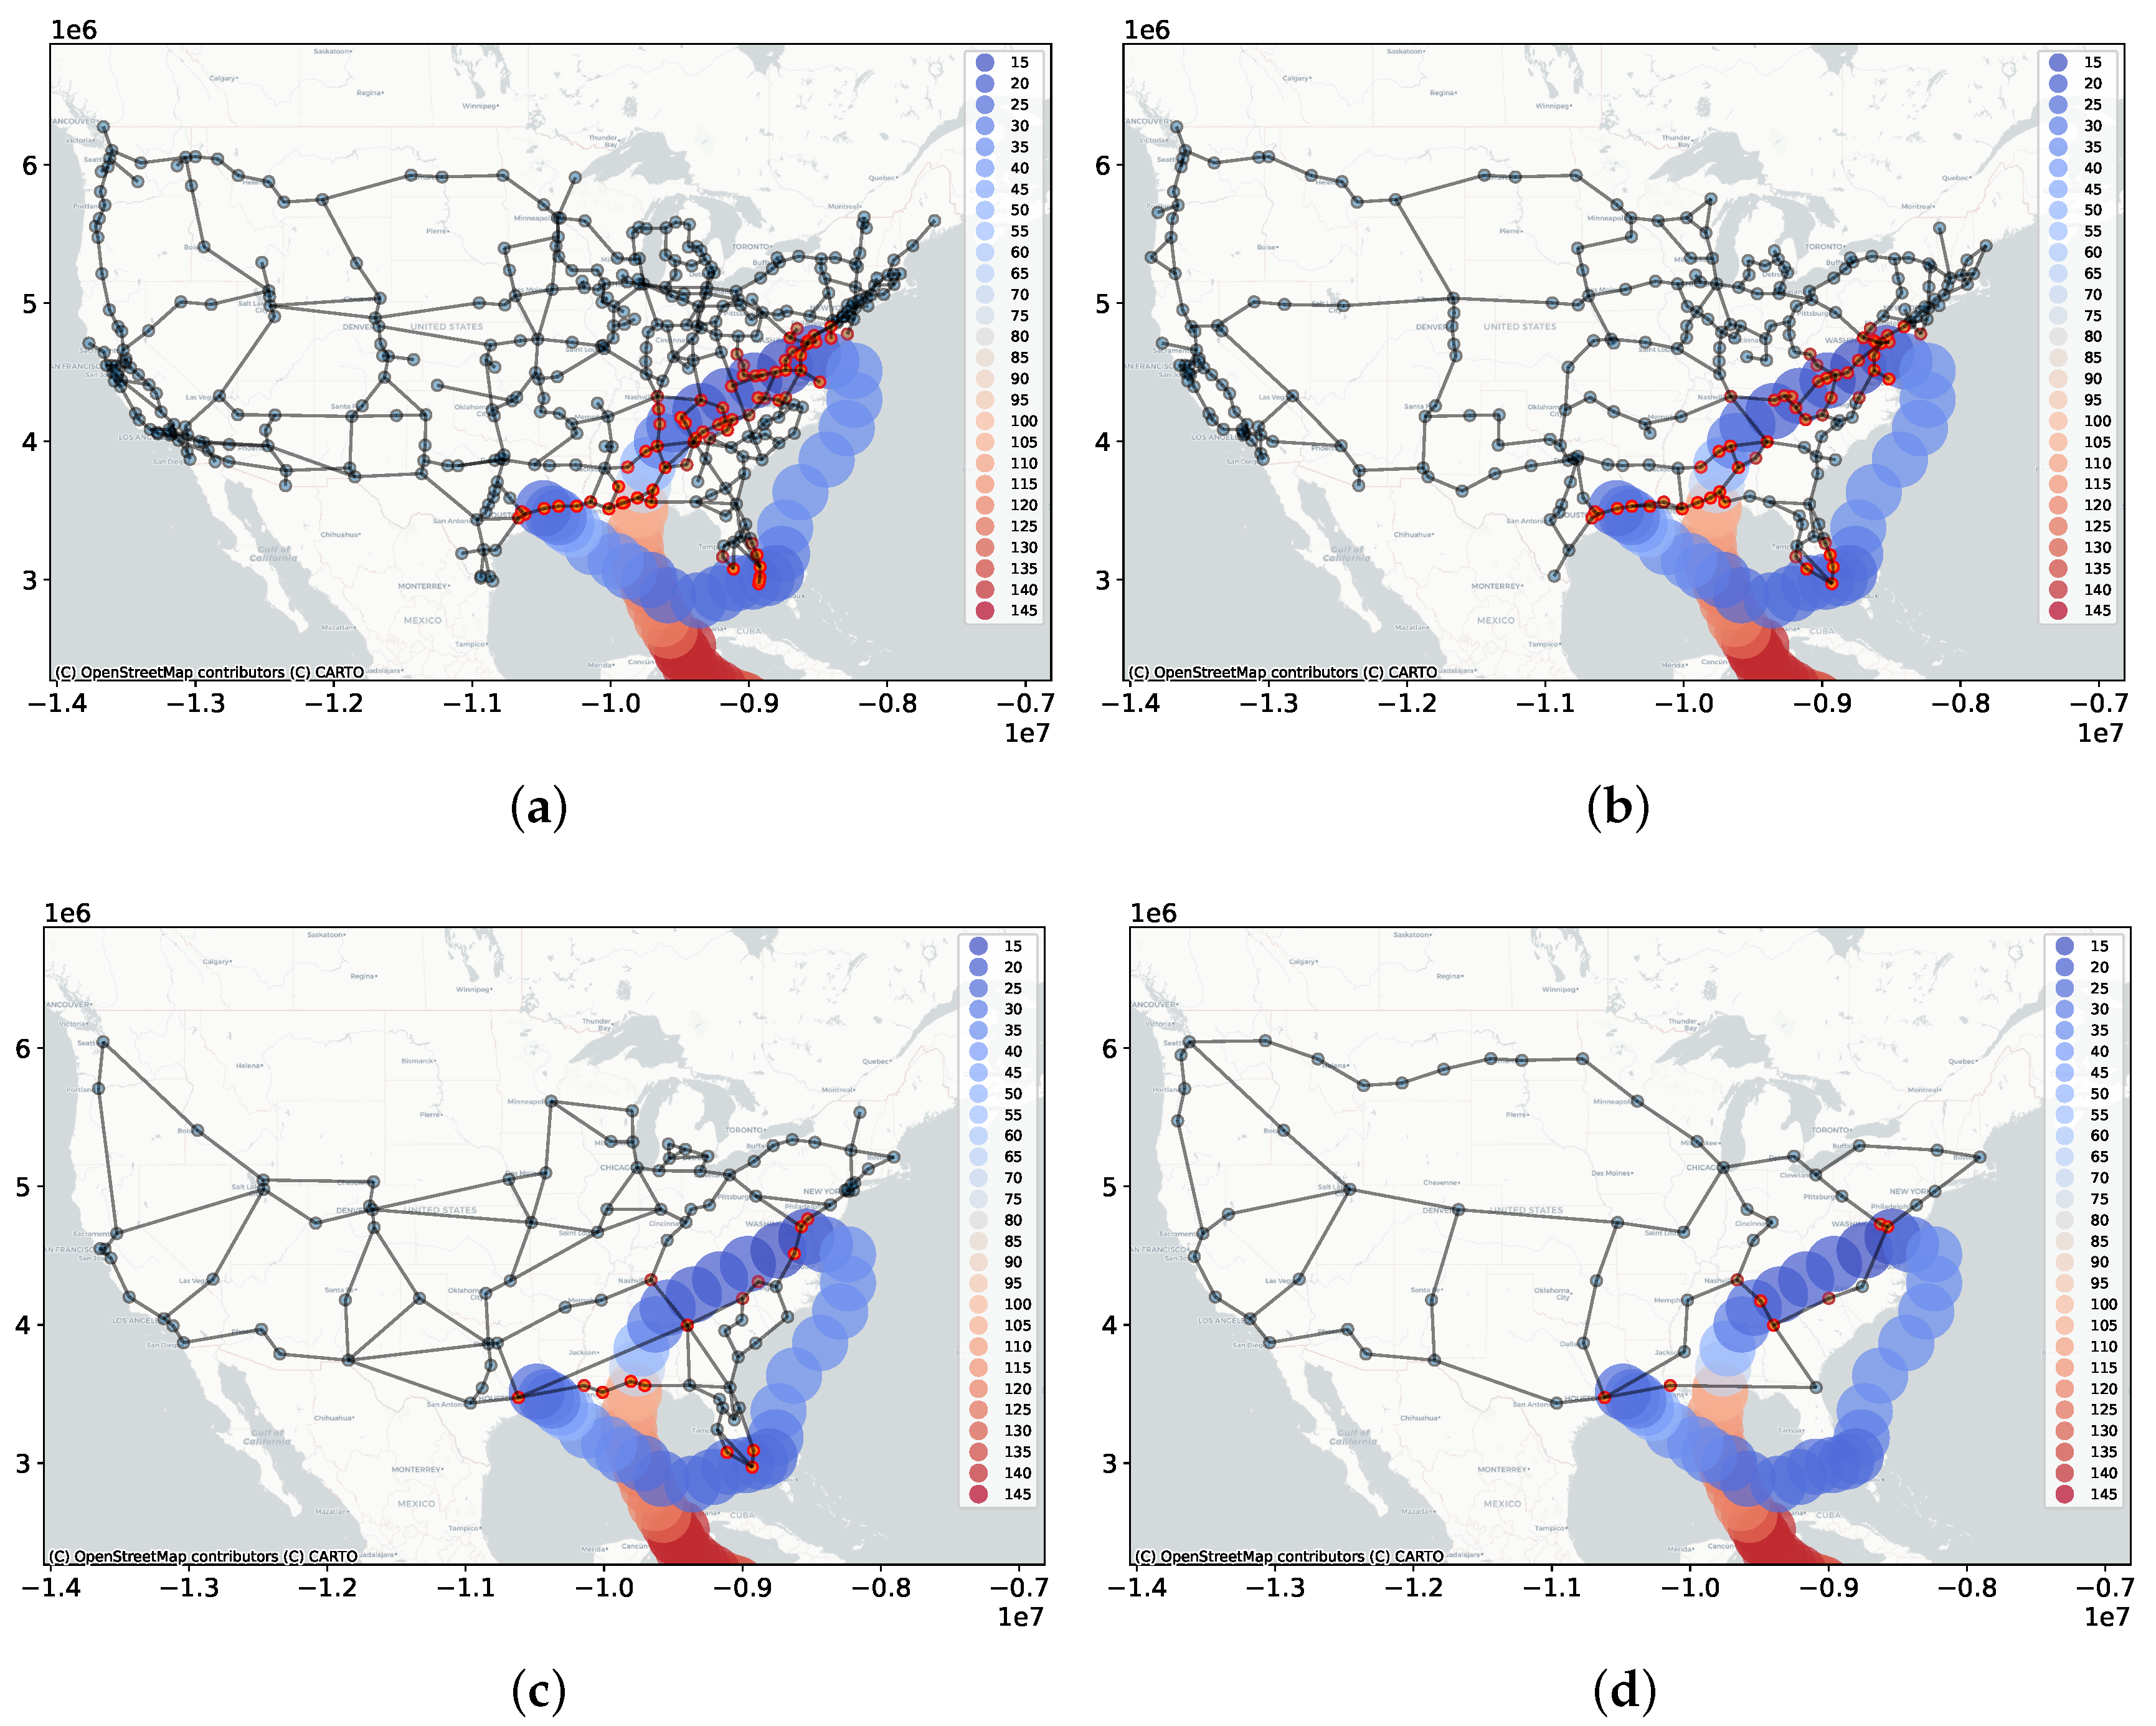
Figure 3 illustrates the impact of Hurricane Katrina on the four selected networks (i.e., AT&T, Sprint, Level3, and Internet2), determined by applying the ENRN algorithm to the Hurricane Katrina dataset. The hurricane’s track is represented by a heatmap, depicting wind speeds ranging from 15 to 245 km/s. Each network topology is displayed using blue nodes and links to represent backbone connectivity, whereas the red nodes indicate node failures during the hurricane. Specifically,
Figure 3a presents the node failures and significant damage experienced by the AT&T network in the southeastern United States. Of the 383 nodes included in the network dataset, approximately 47 nodes failed during the hurricane, resulting in a node failure rate of 12.27%. Similarly,
Figure 3b shows that the Sprint network observed 33 node failures out of 264 nodes, representing a node failure rate of 12.50%. The Level3 network had 15 nodes that failed as a consequence of Hurricane Katrina, accounting for a node failure percentage of 15.15% (
Figure 3c). Additionally, the Internet2 network encountered 8 node failures out of 57 nodes, resulting in a node failure rate of 14.04% (
Figure 3d). It is worth noting that the affected nodes in all the networks resulted in complete disconnection of most of the data centers linking Atlanta, Georgia, and other states in the southeast with the central and western parts of the country. These observations highlight the vulnerabilities and the extent of the impact of Hurricane Katrina on the connectivity and functionality of the networks in those regions.
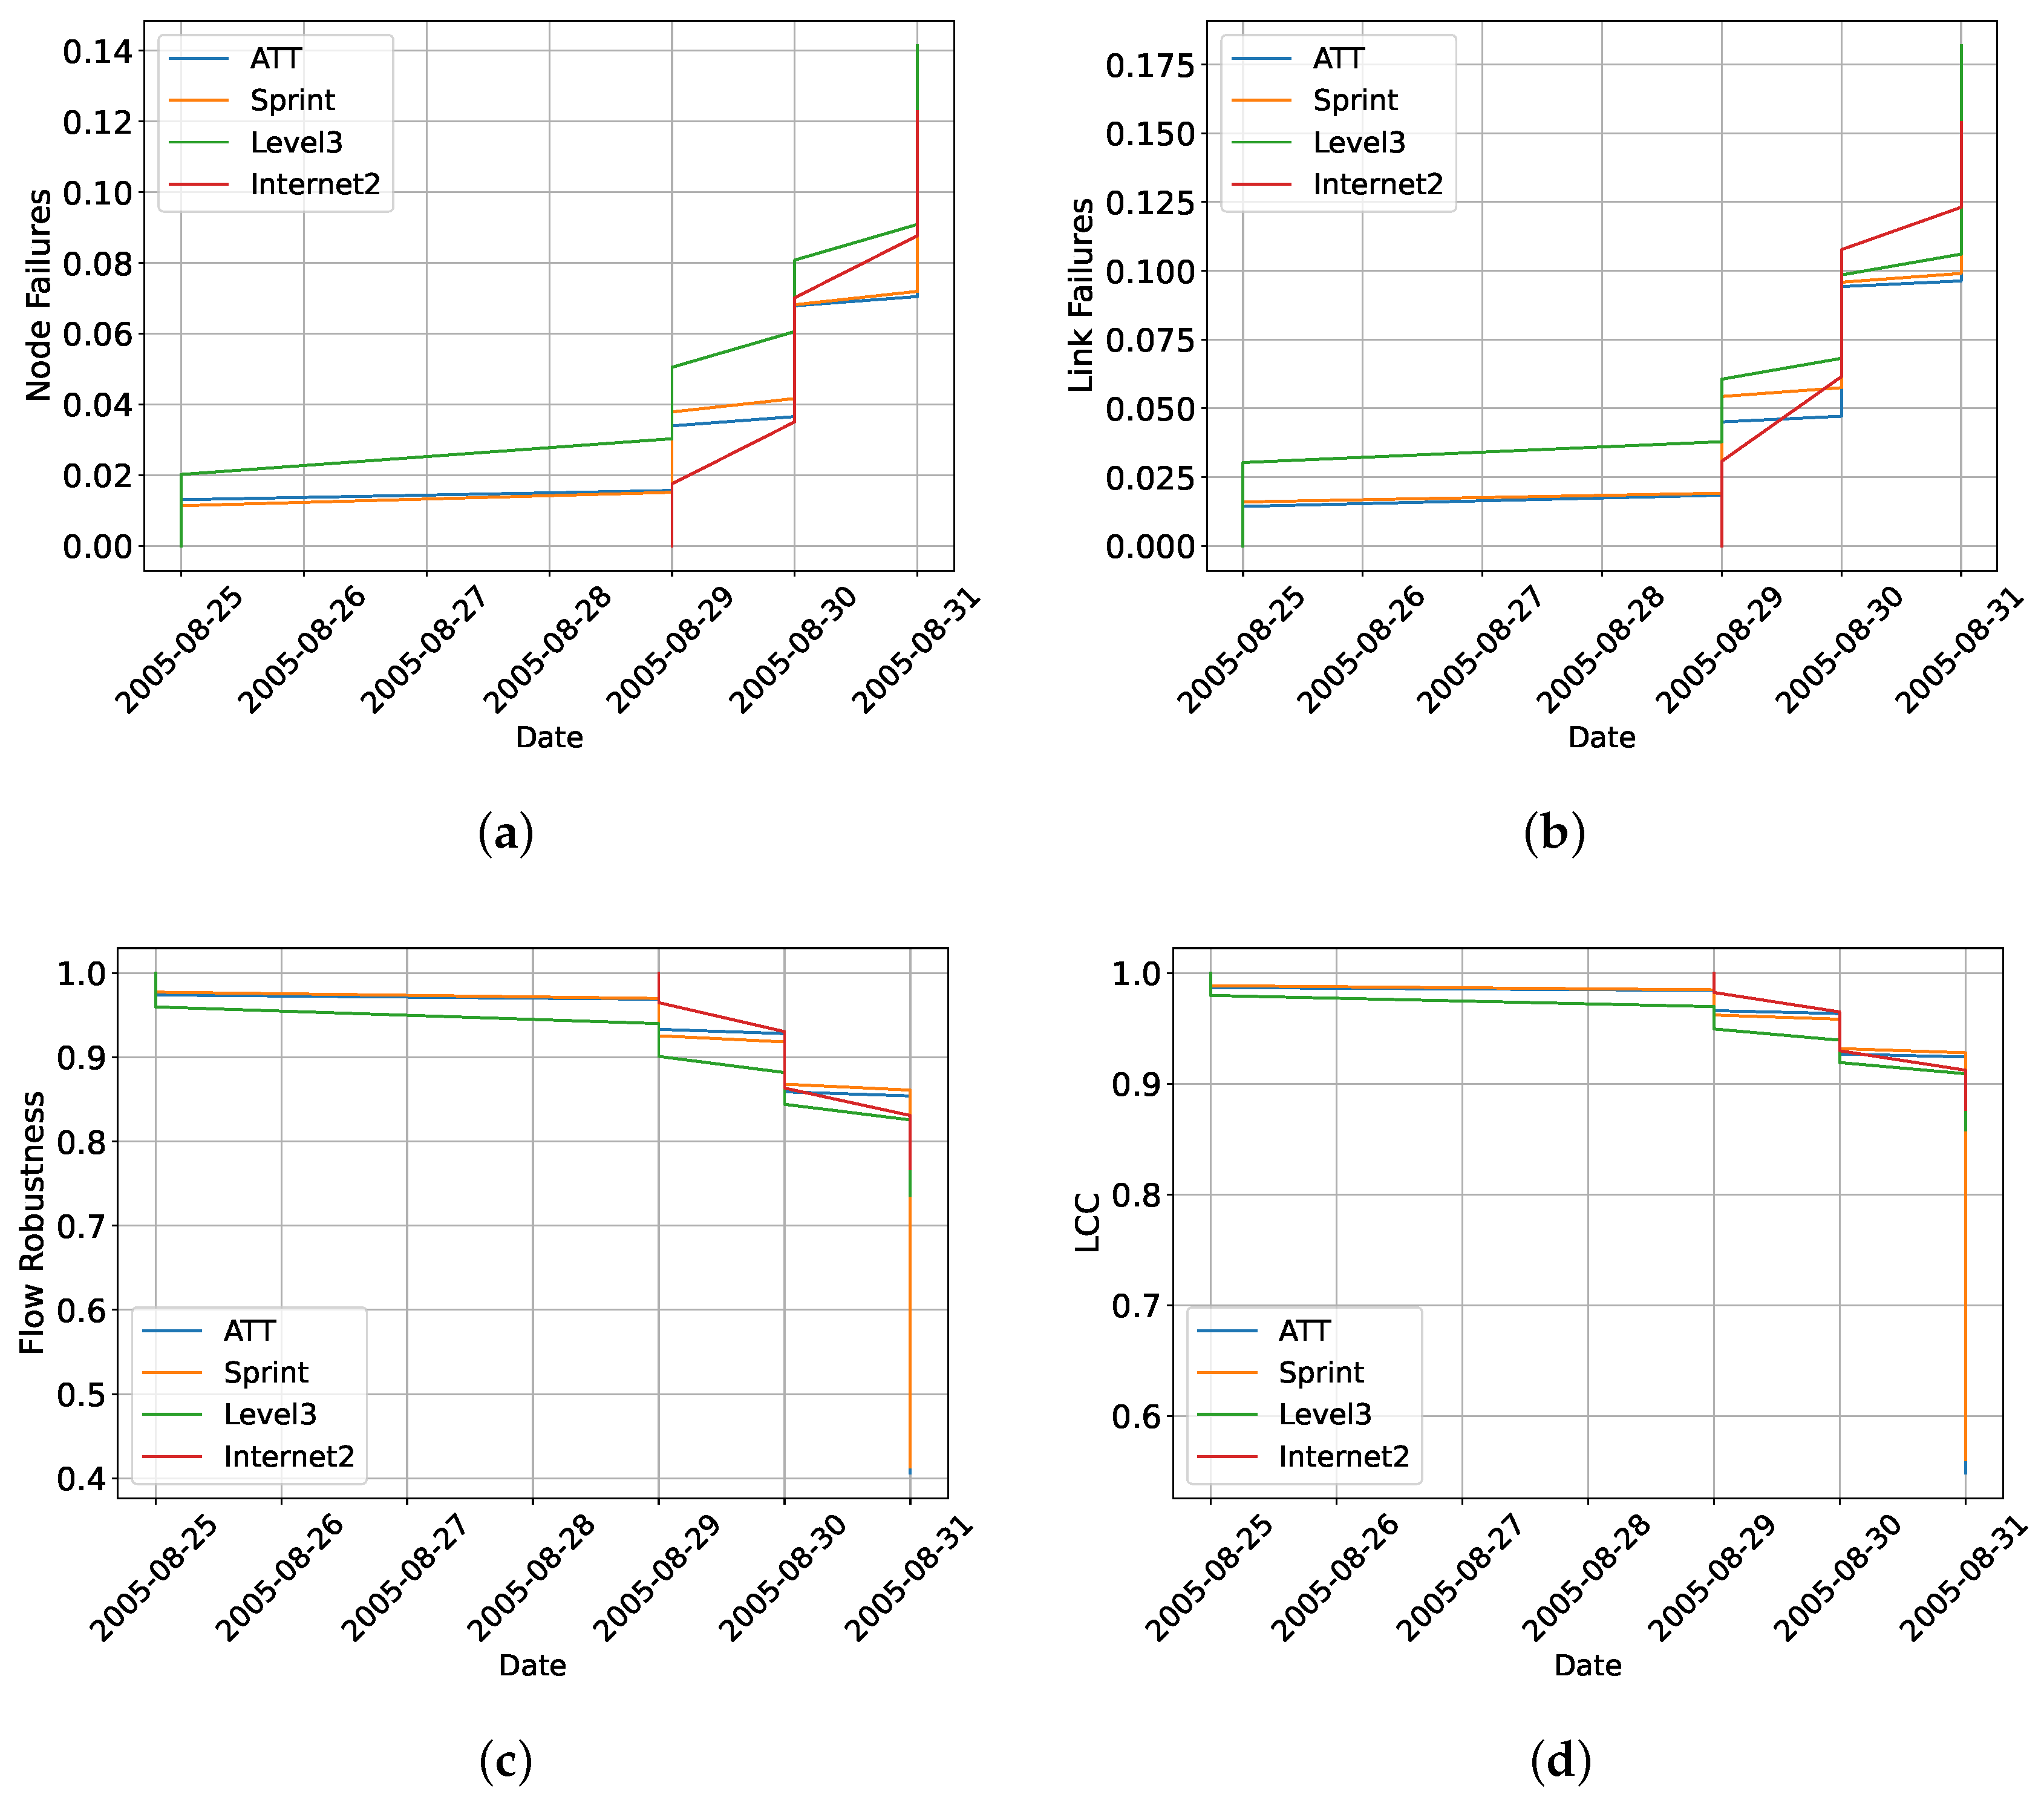
Figure 4 provides a comprehensive analysis of the performance of the selected networks during Hurricane Katrina, showcasing their behavior through the four performance metrics. The results demonstrate that Level3 experienced the highest number of node and link failures, indicating its vulnerability to Hurricane Katrina. Conversely, AT&T exhibited greater resilience, as evidenced by the lower number of failures observed. This is in alignment with the findings presented in
Figure 3, showcasing the impact of Hurricane Katrina on the network structure. Examining the performance metrics of flow robustness and largest connected component (LCC), it can be observed that AT&T presented higher values in both metrics. This indicates that AT&T maintained a greater level of reliable flows and overall network connectivity during the hurricane as compared to Level3, which exhibited lower flow robustness and LCC values. These findings support the notion of AT&T’s enhanced resilience and its ability to sustain network operations during challenging conditions. A quick observation of these networks and the performance metrics indicates that a higher average node degree is directly proportional to the resilience and robustness of the network infrastructure against natural disasters. Additionally,
Table 3 outlines the graph-theoretic performance evaluation metrics for all four networks during Hurricane Katrina. The sums of the LCC and flow robustness metrics provide combined measures of the network’s overall connectivity and resilience during a specific event, such as a natural disaster. The AT&T network, being more geographically connected, had the highest sums of LCC and flow robustness values (42.08 and 39.17, respectively). The Sprint network had the second-highest values (28.69 and 26.52), followed by the Level3 network (13.93 and 12.96) and the Internet2 network (7.51 and 7.05).
5.2. ENRN Algorithm Results for the Hurricane Ivan Dataset
Figure 5 provides a visualization of the impact of Hurricane Ivan on the four selected backbone networks (i.e., AT&T, Sprint, Level3, and Internet2) when applying the ENRN algorithm to the Hurricane Ivan data. The impact of Hurricane Ivan mostly affected the Eastern coastal states.
Figure 5a illustrates the node failures and significant loss in connectivity experienced by the AT&T network in the southeastern United States. Of the 383 nodes included in the network dataset, approximately 69 nodes failed during the hurricane, resulting in a node failure rate of 18.02%. Similarly,
Figure 5b highlights that the Sprint network encountered 52 node failures out of 264 nodes, representing a node failure rate of 19.70%. The Level3 network experienced 15 node failures as a result of Hurricane Ivan, leading to a node failure rate of 15.15%, as depicted in
Figure 5c. Additionally, the Internet2 network had 8 node failures out of 57 nodes, resulting in a node failure rate of 14.04% (
Figure 5d). These findings demonstrate the vulnerability of the networks in the Southeast region of the United States to the impact of Hurricane Ivan.
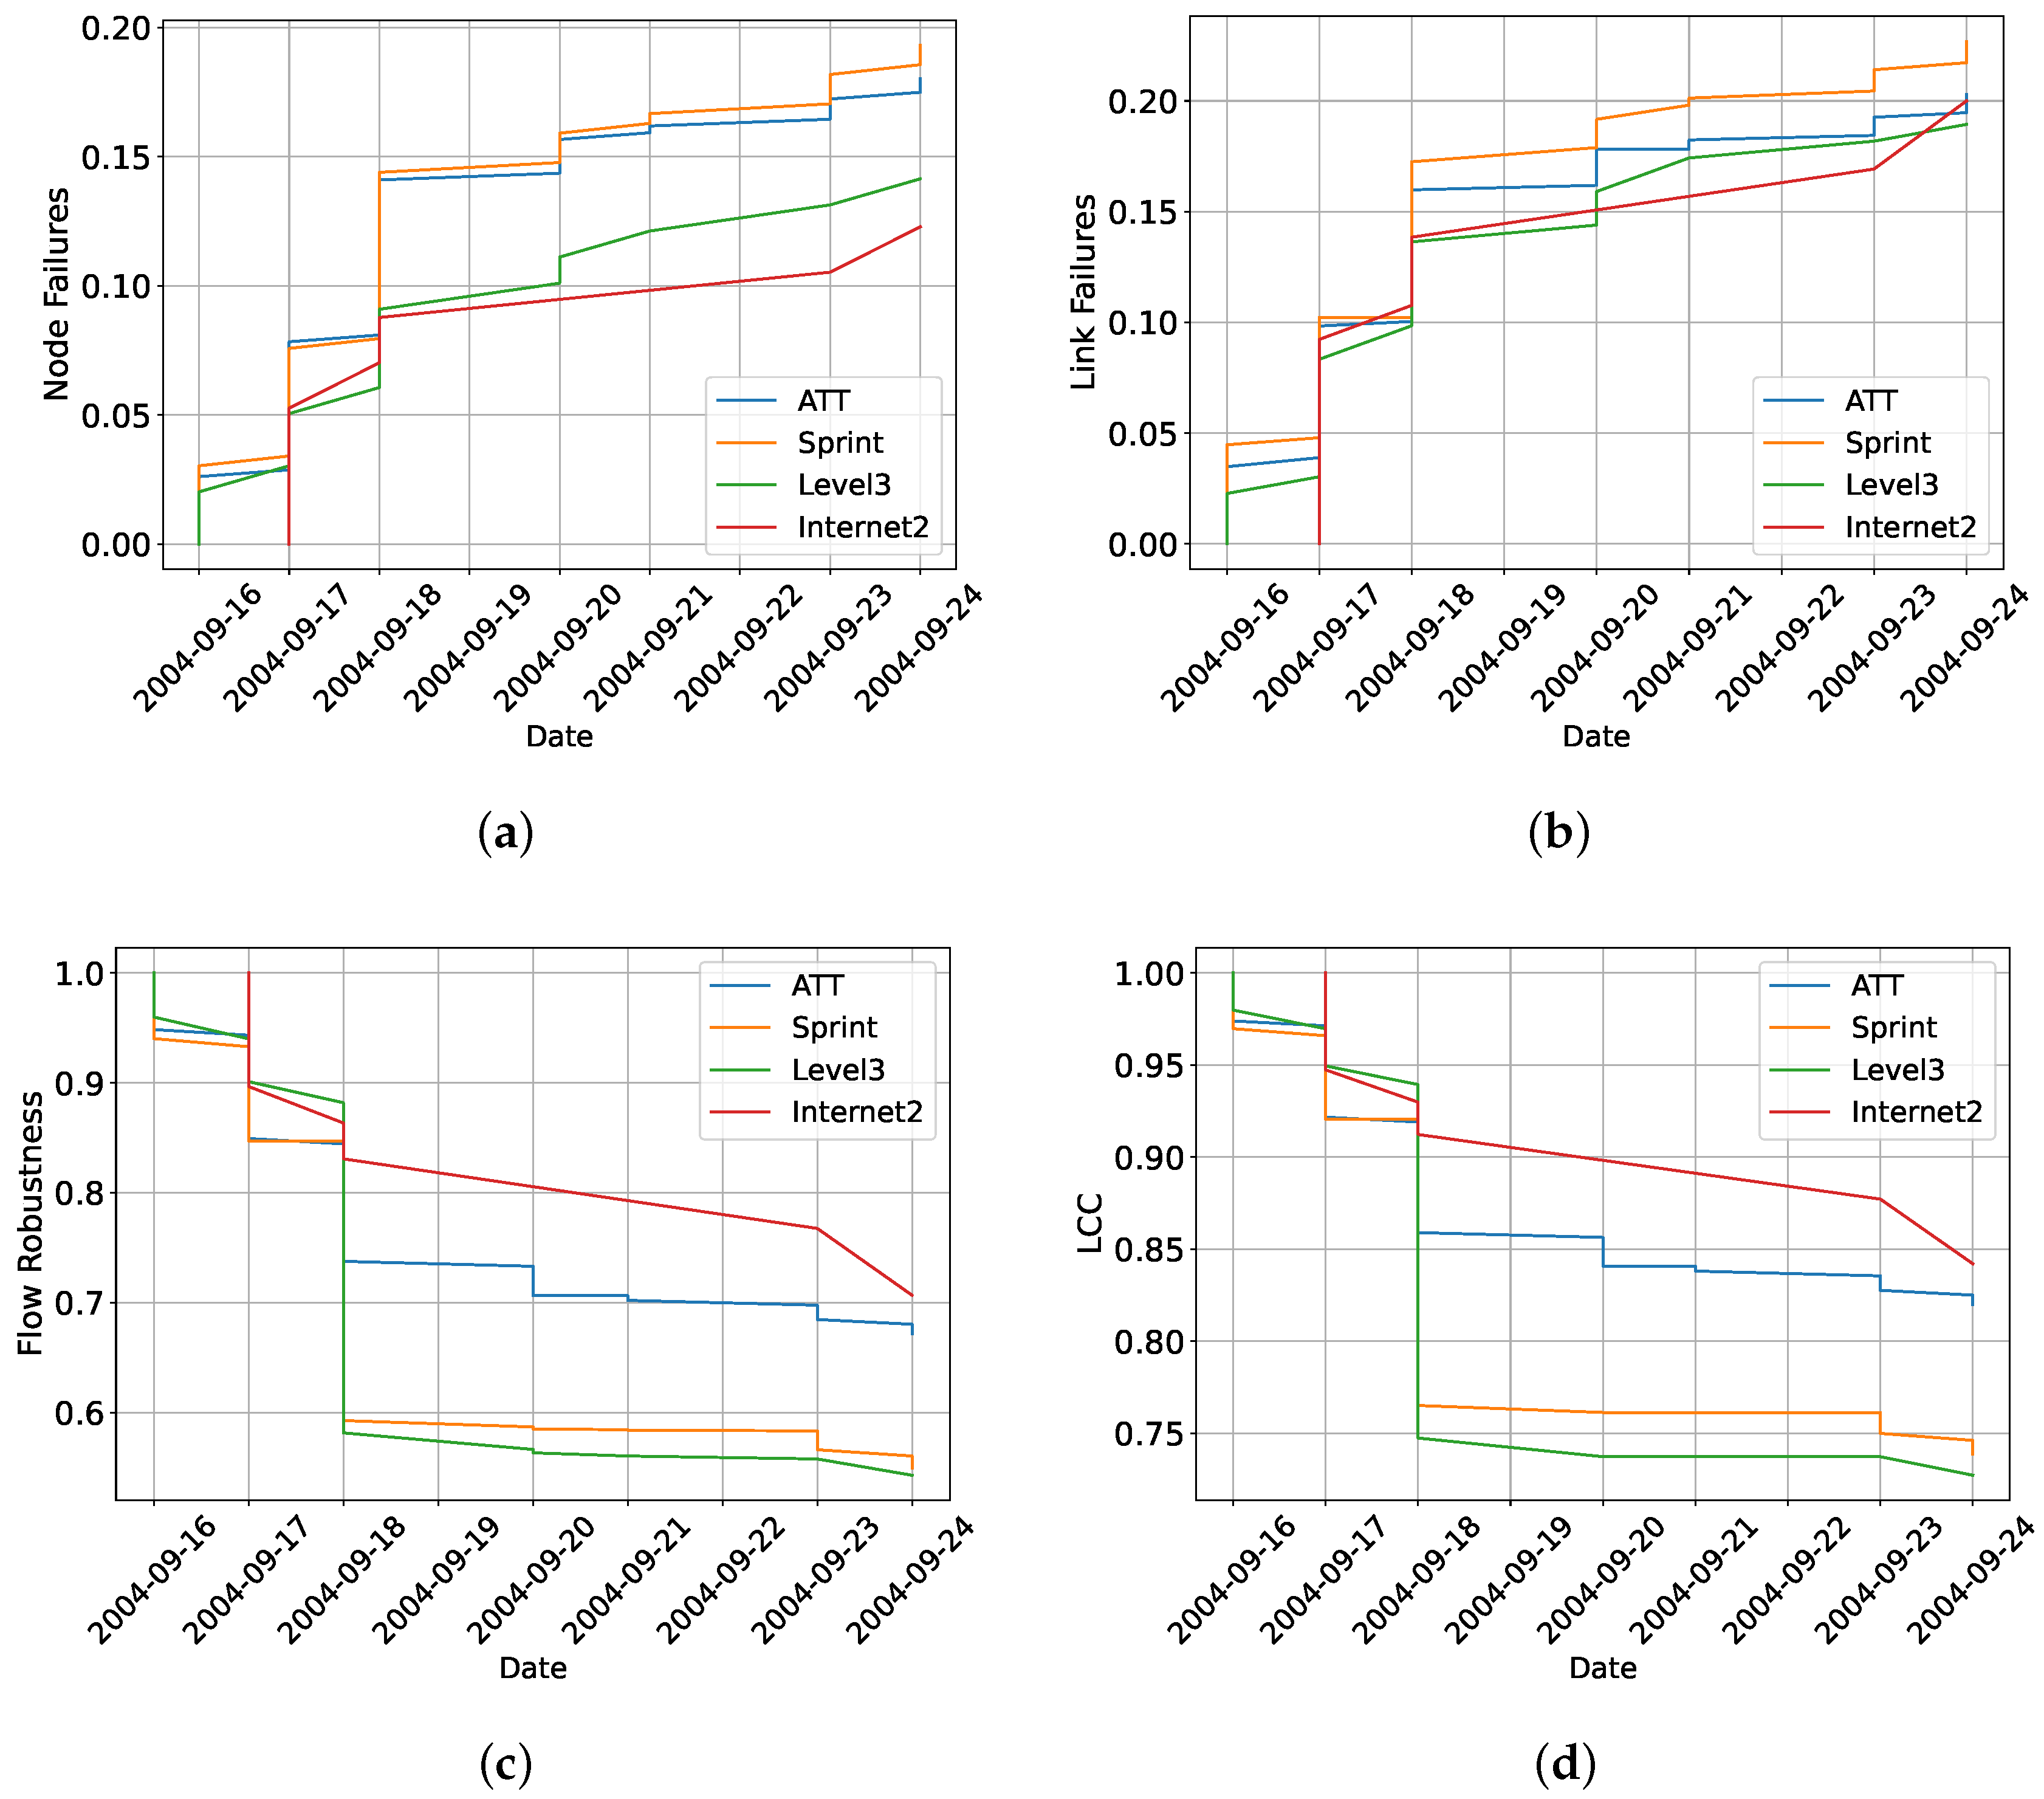
The analysis of the performance metrics for the four networks during Hurricane Ivan revealed interesting results.
Figure 6 provides a graphical representation of these metrics, shedding light on the resilience of each network. In terms of node and link failures, it is evident that Sprint and AT&T experienced a higher number of failures, compared to Internet2 and Level3. This observation aligns with the impact of Hurricane Ivan on the network topology, as depicted in
Figure 5. The higher number of failures in the Sprint and AT&T networks indicates their vulnerability and the challenges that they faced during the hurricane. Regarding flow robustness and LCC, the Internet2 network presented the highest values, indicating its superior ability to maintain reliable flows and overall network connectivity during the hurricane. AT&T followed closely behind, with the second-highest values for both metrics. This highlights the resilience and robustness of the Internet2 and AT&T networks in maintaining communication pathways and connectivity, even in the face of severe weather conditions. Overall, the results demonstrate variations in the performance of the four networks during Hurricane Ivan, whereas Sprint and AT&T encountered a higher number of failures, the Internet2 network showed stronger flow robustness and LCC values.
In
Table 4, we provide a comprehensive overview of the network performance during Hurricane Ivan. Consistent with the observations from Hurricane Ivan’s impact, the AT&T network demonstrated the highest sums of LCC and flow robustness, with values of 63.60 and 57.98, respectively. This indicates that AT&T exhibited strong overall network connectivity and robust flow maintenance capabilities during the hurricane. The Sprint network followed closely behind, with values of 44.94 and 39.42 for LCC and flow robustness, respectively. Although slightly lower than those of AT&T, these metrics still indicate a considerable level of resilience and an ability to maintain reliable flows within the Sprint network during Hurricane Ivan.
However, the Level3 network had significantly lower sums of LCC and flow robustness, with values of 12.90 and 11.42, respectively. This suggests that Level3 experienced greater challenges in maintaining network connectivity and reliable flows during the hurricane. Similarly, the Internet2 network demonstrated the lowest performance in terms of both LCC and flow robustness, with values of 7.46 and 6.96, respectively. This demonstrates relatively weaker network connectivity and a reduced ability to maintain reliable flows within the Internet2 network during the impact of Hurricane Ivan. In summary, AT&T and Sprint showed higher levels of network resilience, whereas Level3 and Internet2 encountered more significant challenges in maintaining network connectivity and reliable flows.
Analysis of the selected four networks in respect of their resilience and performance during Hurricanes Katrina and Ivan provided valuable insights, demonstrating the effectiveness of the proposed ENRN framework. The results consistently indicate that the AT&T network outperformed the other networks in terms of the sums of both the LCC and flow robustness, establishing it as the most resilient network during these extreme weather events. The Sprint network ranked second in terms of performance, whereas the Level3 and Internet2 networks exhibited lower performance.
5.3. Discussion
The findings of this study highlight the ability of the proposed ENRN algorithm to accurately forecast the natural challenge path, identify potential failures of the network components, and quantify network resilience by analyzing affected nodes. This framework not only provides an assessment of the resilience of well-known examples of network infrastructure against past events, but also has the potential to predict the survivability of any network against any disaster, given sufficient data. By leveraging these insights, network operators can proactively identify vulnerabilities in their backbone networks and develop strategies to enhance their resilience during extreme weather events. These strategies may include infrastructure improvements, redundancy measures, and network management improvements. Furthermore, the findings of this analysis can inform emergency response and recovery efforts by guiding the prioritization of resources and the restoration of network connectivity in affected areas. The proposed ENRN framework contributes to the field of network resilience by providing a comprehensive approach for assessing the resilience of the network infrastructure. By understanding the strengths and weaknesses of different networks, stakeholders can make informed decisions to improve infrastructure designs and implement measures that enhance resilience.
5.4. Comparison to Related Work Approaches
The task of evaluating and comparing different network resilience approaches is not straightforward due to the inherent differences in their objectives, performance metrics, and datasets. Each approach is designed with specific goals and use cases in mind, thus adopting unique datasets for testing and different metrics for measuring performance. These variations in methodologies can make it challenging to perform a direct comparison. However, in this paper, we strive to compare these approaches as comprehensively as possible with our proposed model, known as the Evaluation of Network Resilience against Natural Disasters (ENRN). The ENRN model leverages network topology and real-world hurricane data to assess network resilience, setting it apart from other techniques. As we delve into the comparisons, it is important to remember the distinctiveness of each model and the context within which they operate.
As shown in
Table 5, our proposed method focuses on assessing network resilience in the face of natural disasters, specifically hurricanes, using real-world data from US providers AT&T, Sprint, Level3, and Internet2. It primarily measures the node and link failures and flow robustness. In contrast, Pasic et al. [
31] proposed a two-stage spine selection model, a regional failure model, and optimal disaster-resilient network planning. This approach uses various network topologies and earthquake and seismic data for Europe and the USA, with performance metrics including availability upgrade cost, intensity tolerance upgrade, average capacity allocated, and blocking probability. Izaddoost et al. [
30] employed a preventive protection approach using different network topologies for evaluation. Their performance metrics include disrupted connections and network disruption time. On the other hand, An et al. [
42] presented two routing approaches, First-Hop Multi-Path (FMP) and Multi-Hop Multi-Path (MMP), using an 18 ASes dataset from six countries. Their performance is evaluated based on latency and loss rate. Finally, Liu et al. [
56] proposed a model for disaster protection and adaptive multi-path routing utilizing various network topologies. Their performance metrics include spectrum utilization, the maximal index of occupied frequency slots (MOFI), and content storage space. In summary, although these models share a common goal of enhancing network resilience, they differ significantly in their datasets, proposed models, and performance metrics, making a direct comparison challenging. However, the ENRN approach provides a unique perspective by focusing on the impact of hurricanes on network resilience.
6. Conclusions
In conclusion, the proposed ENRN framework represents a significant advancement in evaluating network resilience against natural disasters. By integrating real-time weather data, geographic information, detailed network topology data, advanced resilience algorithms, and continuous network monitoring, this framework provides accurate and actionable insights for designing and maintaining robust communication networks. The large AT&T network, having more than 350 major nodes, presented the highest robustness of 39.17, compared to the Internet2 backbone with a robustness of only 7.05. With a higher number of nodes, AT&T also presented a high number of node failures during Hurricanes Katrina and Ivan. The ability of the proposed framework to inform decision-making processes and support the development of more resilient networks ensures the continued functionality of communication networks during extreme weather events, thus benefiting affected populations.
To enhance our understanding of network resilience, future research may focus on examining the specific factors contributing to the resilience of each network, such as infrastructure design, redundancy, and network management practices. Additionally, conducting simulations and case studies involving different types of natural disasters and scenarios can provide a more comprehensive assessment of network resilience capabilities. Moreover, we plan to run our system with real-time data via the weather database application programming interface (API). Furthermore, exploring the impacts of emerging technologies, such as 5G, edge computing, and artificial intelligence, on network performance and resilience during disasters will contribute to further advancements in this field. Finally, we plan to incorporate graph neural networks (GNNs) in our future work. GNNs, with their ability to effectively capture complex relationships in graph-structured data, present a promising avenue for enhancing our understanding of network resilience.


