1. Introduction
Network security is the most interesting aspect that is responsible for the emergence of internet applications. However, the number of cyberattacks has also increased on the internet in the past decade. Therefore, it is essential to develop new approaches that can effectively detect and prevent such attacks. This can be achieved by developing novel techniques for intrusion detection [
1]. In order to avoid these cyberattacks, key management, access control, and intrusion detection systems (IDS) are necessary [
2]. Amongst these, IDS is the most commonly used system for ensuring network security. Presently, cyberattacks pose a major issue for system and network security in the form of Denial of Service (DoS) attacks, computer viruses, and data breaches [
3]. To mitigate this problem, the IDSs are frequently employed in different organizations. According to the identification techniques, these detection methods are categorized as signature-based or misuse-based NIDS and anomaly-based NIDS. The objective of the current research is to determine the anomalies by recognizing a clear abnormality between the existing actions and predetermined normal actions, utilized for representing a normal activity or normal connection [
4,
5]. Automatically, the anomaly-based detection techniques exhibit the ability to identify new (or 0-day) attacks, whereas the misuse-based detection systems identify only the known attacks [
6].
The researchers established IDSs for various platforms depending on the security issues of diverse networks. The operations of the IDS involve data collection to analyze every potential security attack from various fields within a network or computer [
7]. In recent years, intrusion detection and other security technologies, namely, firewalls, cryptography, and authentication, have significantly improved. Machine Learning (ML) is the main assistant of Artificial Intelligence (AI) technology [
8]. It enables the creation of computers that can perform without precise programming. In these computers, the ML techniques can perform the execution of tasks depending on generalized data or samples. This characteristic helps these computers in improving themselves by learning from the available information [
9]. The ML technique is capable of identifying unknown attacks in network traffic, thus sharing its ability to identify other types of attacks trained on rare and general types of traffic. However, the effectiveness of the ML approaches does not remain consistent when using various types of datasets, because of the presence of higher-dimensional data [
10]. For instance, redundant or inefficient features can increase the computational period and reduce the identification outcome. In this context, Feature Selection (FS) is a better approach to mitigate this problem.
For intrusion detection, FS and Deep Learning (DL) techniques are applied. FS is highly needed nowadays, owing to the presence of numerous attributes of the network data, which are repetitive and unrelated. With the application of the FS technique, the detection model can focus primarily on highly useful features, reduce the dimensionality, enhance the model’s interpretability, and increase the detection accuracy. On the other hand, the DL technique can proficiently learn complex patterns and temporal dependencies from the network traffic data. The DL models can learn intricate intrusion patterns that may be challenging for traditional rule-based or statistical approaches to discern. By combining the FS’s data pre-processing capabilities with DL’s pattern recognition prowess, the network intrusion detection process can be significantly fortified. This outcome enables the timely and accurate identification of both known and novel cyber threats in the ever-evolving landscape of network security.
The current study proposes a Network Intrusion Detection System using a Lion Optimization Feature Selection with Deep Learning (NIDS-LOFSDL) model. The NIDS-LOFSDL technique uses the LOFS technique, which aids in improving the classification performance. Furthermore, the study also used the attention-based bi-directional long short-term memory (ABiLSTM) system for intrusion detection. In order to enhance the intrusion detection performances of the ABiLSTM methodology, the gorilla troops optimizer (GTO) is deployed for hyperparameter tuning. For validating the enhanced solution of the NIDS-LOFSDL technique for intrusion detection, a comprehensive range of experiments was conducted. The key contributions of the study are summarized herewith:
A new NIDS-LOFSDL technique has been developed in this study, comprising LOFS, ABiLSTM classifier, and GTO-based parameter tuning approaches for network intrusion detection. The rationale behind combining the FS and hyperparameter-tuned DL model is to enhance the accuracy and efficiency of the intrusion detection systems;
LOFS has been incorporated as an FS method that selects the most relevant and informative features from a dataset. This characteristic helps in improving the accuracy and interpretability of the intrusion detection models;
The ABiLSTM network has been deployed for intrusion detection, and the model is known for its ability to capture temporal dependencies in sequential data, thus making it an appropriate choice for the detection of complex intrusion patterns in network traffic;
To further enhance the performance of the ABiLSTM algorithm, the study used GTO for hyperparameter tuning. It intends to determine the optimal hyperparameter configuration for the ABiLSTM model to accomplish an enhanced detection performance.
2. Related Works
In the literature [
11], a new anomaly-based IDS technique has been deployed for IoT networks, utilizing the DL method. In particular, a filter-based FS-DNN technique was introduced in the study, in which extremely correlated features were dropped. Additionally, this technique was tuned with several parameters and hyperparameters. Mohy-eddine et al. [
12] developed an NIDS for IoT platforms by employing FS and KNN methods. The authors created the NIDS with the help of the K-NN method to enhance the IDS Detection Rate (DR) and accuracy (ACC). Also, the GA, univariate statistical test, and PCA were utilized for the FS technique individually to increase the quality of the data and select ten better effective features. In the study conducted earlier [
13], a hybrid DL technique and shallow learning method were presented for identifying the intrusions in the IoT devices. In the developed method, the spider monkey optimization FS method was primarily employed to select a greater number of relevant features. Secondarily, a Siamese NN-based approach was presented for making the data highly classifiable. Syed et al. [
14] suggested a new fog-cloud-based IoT-IDS that integrates a distributed process by separating the database based on the type of attacks and an FS stage on time-series IoT data. Then, a DL-Recurrent-NN (Simple RNN and BiLSTM) was used to identify the attacks.
In the literature [
15], a network intrusion detection classification (NIDS-CNNLSTM) technique was presented based on DL. This technique was designed for the wireless sensing environment of the Industrial IoT (IIoT) for the efficient differentiation and detection of network traffic data, and to ensure the safety of the equipment and the functioning of the IIoT. The NIDS-CNNLSTM technique integrated the robust learning capability of LSTM-NNs in time series data, and classified and learnt the FS utilizing CNN. Further, the efficiency was also confirmed based on multi-classification and binary classification methods. Ravi et al. [
16] recommended an endwise system for network attack classification and identification by DL-based recurrent approaches. This method extracts the features of v-layers present in the recurrent algorithms and uses a kernel-based PCA (KPCA)-FS technique for the detection of the optimum features. Lastly, the optimum features of the recurrent methods were incorporated, and classification was executed using an ensemble meta-classifier.
Atefinia and Ahmadi [
17] introduced a multi-architectural integrated DNN technique to reduce the false positive rate of anomaly-based IDSs. This approach contains a feed-forward method, a stack of limited Boltzmann machine methods and two recurrent methods. The output weights of these methods were input into an aggregator method to generate the solution for these models. In the literature [
18], the authors introduced an efficient network IDS based on Random Forest (RF) and Sparse-AE (SAE) to alleviate the issue. The extraction feature ability of the SAE and identification and classification potential of the RF were integrated to enhance the identification accuracy and performance. The SAE-RF identification technique was developed.
With an increase in network-based threats and sophisticated intrusion techniques, the requirement for highly robust and adaptive intrusion detection systems has grown exponentially. A major research gap in the field of network intrusion detection lies in the requirement for efficient models to perform FS and hyperparameter selection. Though considerable developments have been made in ML and DL models to detect intrusions, the intricate and high-dimensional nature of the network data continue to pose challenges. The existing approaches find it challenging to deal with feature redundancy, irrelevant attributes, and suboptimal hyperparameter configurations, thus resulting in low detection performance. So, it is now necessary to design new models for the effective selection of relevant features and the fine-tuning of the model hyperparameters to adapt to the dynamic and evolving nature of network threats.
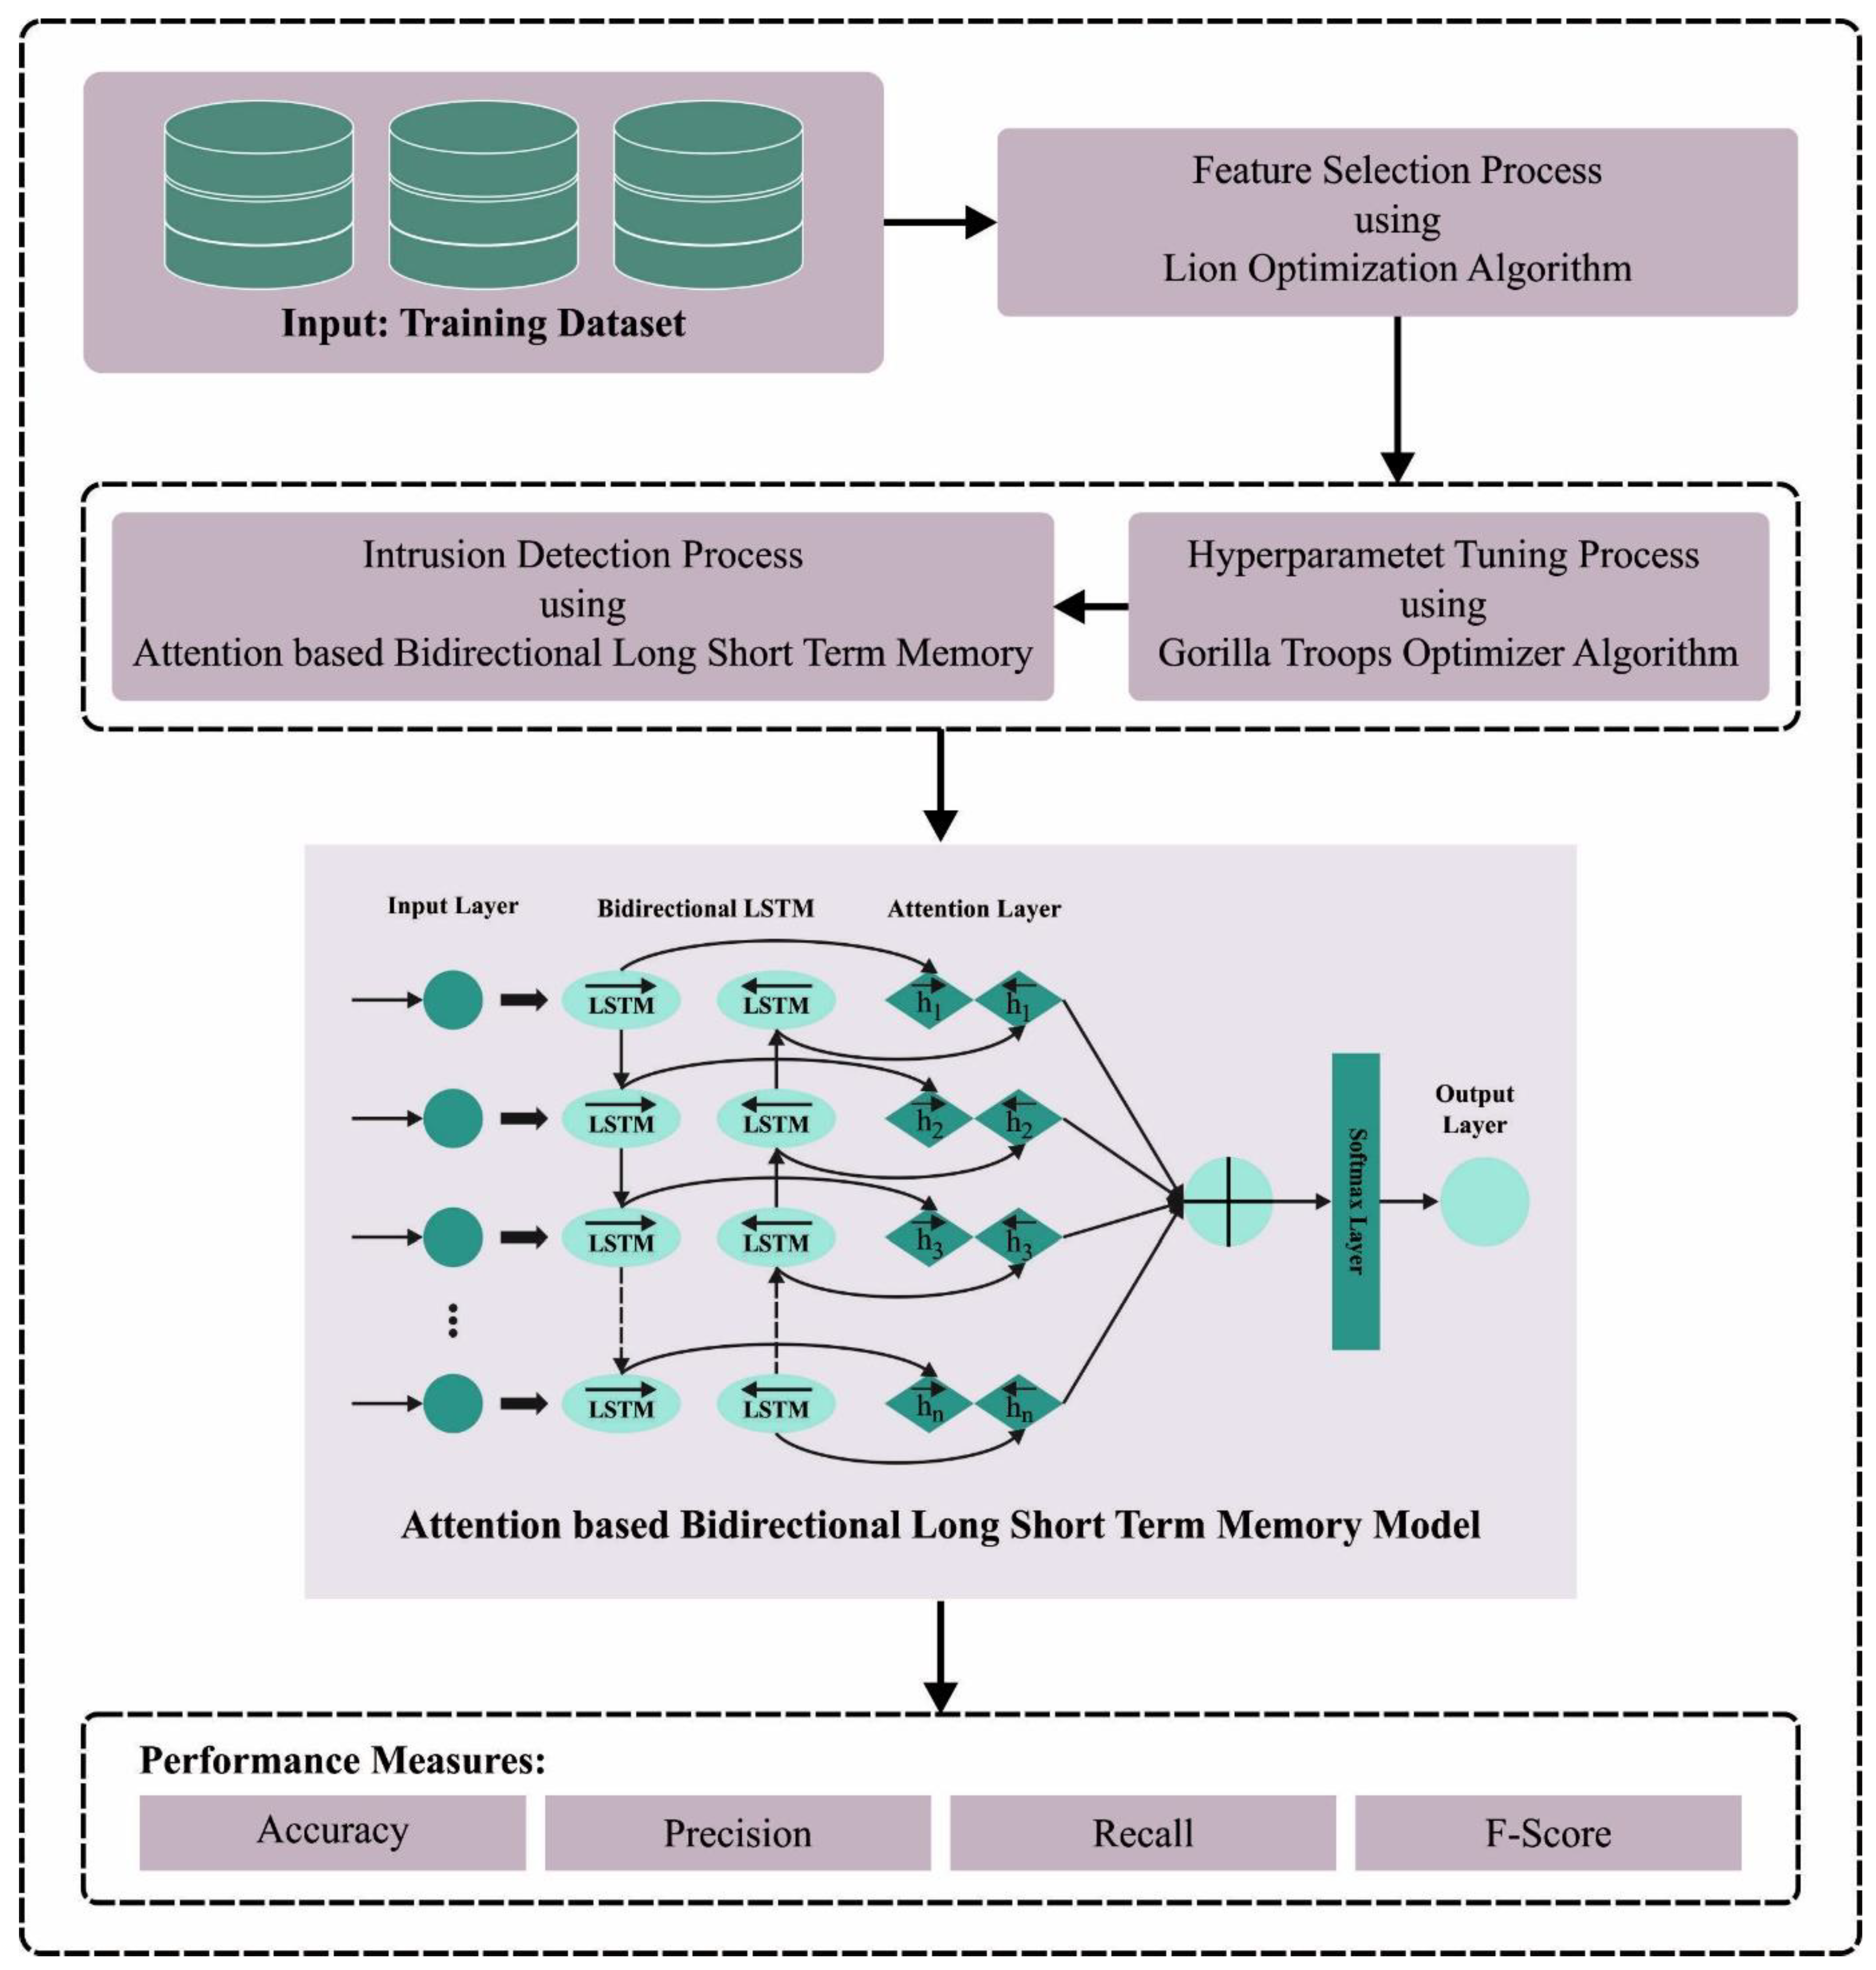
3. The Proposed Model
In the current study, a novel NIDS-LOFSDL approach has been established for intrusion recognition so as to accomplish network security. The NIDS-LOFSDL technique follows the concept of FS with a hyperparameter-tuned DL algorithm for the recognition of the intrusions. The proposed model encompasses LOFS, ABiLSTM-based detection, and GTO-based hyperparameter tuning.
Figure 1 exhibits the entire procedure of the NIDS-LOFSDL methodology.
3.1. Feature Selection Using the LOFS Approach
For the feature selection process, the LOFS approach is used. The LO algorithm is a population-based algorithm in which the lemurs set is mathematically modeled as follows [
19].
where
stands for the solution candidate and
indicates the decision variable.
shows the matrix in
size.
Figure 2 illustrates the flowchart of the LO algorithm. The steps contained in the LOFS approach are given below.
Step 1: Define the parameter Population when represents the maximum iteration count. corresponds to the dimensionality of the searching region over the dataset size. In addition, and indicate the upper and lower boundaries of the problem, respectively.
Step 2: Produce
decision parameters in the
ith solution, according to Equation (2)
where
implies the uniformly distributed random integer
Step 3: Inside the loop for all the iterations, evaluate the Free Risk Rate
, a co-efficient of LO,
In Equation (3), indicates the existing iteration counter. shows the size of the iteration. Low-Risk Rate (LRR) and High-Risk Rate (HRR) are two constant and predefined values.
Step 4: Compute the fitness values for
, as given below.
In Equation (4), represents the accuracy of the subset that can be extracted by the ABiLSTM classification function in order to assess the selected subset in all the iterations. Fit denotes the fitness values, implies the number of features selected suggests the maximal number of features selected.
Step 5: Lemurs are categorized into two dissimilar processes to increase their fitness values. Initially, the best near lemurs are recognized, which implies the selection of the solution with a low fitness values. According to the FS objective, provides a better feature for the existing iteration. Then, the global best lemur is selected in the whole population, which represents the total optimum solution.
Step 6: Set the value of
, a randomly generated value, to
, and compare it with
. Later, the location is updated for the lemur, far from the risk-based position, according to Equation (5).
where
refers to the random integer
. The present
th lemur of the
th population is
, i.e., the solution candidate at the
th dimension.
The LO process begins by arbitrarily generating a swarm of lemurs. Next, it tries to move towards the lemurs with low fitness value by dance hup. The optimization process randomly generates a group of lemurs. The value begins towards the LRR, thus representing that the lemur starts with the move and moves near to the through “dance hup”. The purpose of LO, implementing these dance hup actions, is to decrease the value of near to the . Next, it exploits the leap-up action to move the lemur towards the global optimal performance. This process is repeated until the ending condition is met.
3.2. Intrusion Detection Using ABiLSTM Model
To detect the presence of the intrusions, the ABiLSTM model is applied. LSTM is a revised edition of the classical RNN that exploits the specially adapted memory units to effectively express the long-term dependency of the MTS dataset [
20]. The LSTM model’s design provides an effective solution to the gradient disappearing problem on the contrary to the traditional RNN methods. According to the present input and the previous state of the hidden units, the LSTM cell learns about the existing state of the hidden unit. Nevertheless, it replaces the structure of the hidden unit with a memory cell that corresponds to the long-term dependency of the MTS signal. The LSTM model includes four controlled gates, such as one self-loop memory cell, one input, one output, and one forget, for manipulating the interaction of the data stream among different memory neurons. In the hidden layer of the LSTM model, the forget gate is used to determine the data that need to be ignored or preserved from the prior moment. Simultaneously, the entrance of the input neuron decides whether the input signal needs to be injected with the information of the memory unit. The output neuron gate decides whether the state of the memory unit should be changed or not. Consider the input
of MTS and the dynamic output state
; the neuron state, output of HL, and gate states are calculated using the subsequent formula.
The recurrent weight matrices are represented as , and , while the weighted matrix for the input, forget, output and memory cell gates are denoted by , and , correspondingly. The gates bias is formulated by , and . The cell state of the candidate is used to update the original memory cell state, . At any time step, represents the state of HL and denotes the output. The symbol denotes the element-wise multiplication operation. denotes the hyperbolic tangent function and shows the logistic sigmoid activation function.
The classical LSTM model may inadvertently discard the sequential information at the time of training as it processes only the input signals in one direction. Therefore, the time series data cannot be completely reviewed. In order to over this limitation, the BLSTM was developed with a bidirectional structure to capture the representation of MTS information via forward and backward directions. The BLSTM comprises two LSTM layers that are carried out in parallel but opposite directions. In the case of the reverse propagation direction,
represents the hidden layer, which comprises data from the future MTS values. In forward propagation,
denotes the data of the hidden LSTM neuron, and it retains the data from the prior sequence value. Both
and
are connected to each other for creating the final output of the BiLSTM model. The
tth hidden layer of BLSTM for forward and backward states is computed using Equations (12) and (13):
In addition to these, and correspond to biased data in two directions. The weight matrices and represent the forward and backward synapsis weight from the input to the internal unit weight. Likewise, and represent the forward and backward feedback recurrent weights.
indicates the activation function of the HLs
. Using this component, the output of BiLSTM
is defined herewith.
In Equation (16), the forward and backward weights of the resultant layers are denoted by and , correspondingly. The activation function of the resultant layer is either given as a linear function or sigmoidal function. Further, represents the output bias.
In ABiLSTM, when the attention mechanism is utilized, it supports the model in learning by assigning various weights. For an HL
, its attention
is expressed as in Equation (15).
whereas
signifies the weighted matrix,
implies the bias, and
represents the global context vector, and all three are learned in the training method.
3.3. Hyperparameter Tuning Using GTO Algorithm
Eventually, the hyperparameter values of the ABiLSTM methodology are chosen using the GTO algorithm. The GTO approach is one of the main metaheuristic optimization approaches, inspired by the intelligent behaviors of gorillas [
21]. These behaviors are explained using five major operators, as follows. Two of the operators represent the exploitation stage, whereas the other three operators define the exploration stage. The three operators are sometimes described as strategies or the exploration stage, and they can be inferred from the movement to another gorilla, migration towards an unknown place, and migration towards a known place. As mentioned before, the exploitation stage uses two operators reflected by the competition for adult females, and follows the behavior of the silverback. The competition is initiated between the adult females in such a way that they follow the silverback.
Using the following equations, the three prior approaches of the exploration stage are defined.
In this equation, the upper as well as lower boundaries are denoted using and , respectively. Using , the position selected is defined in the iteration (), whereas the existing location is represented as (). is known by the maximum number of iterations. The parameter defines the probability of the migration that lies in the range of 0 to 1. Lastly, the exploration stage ends by enabling the outcome to exchange , and these solutions are known if the silverback arises, when is greater than ().
Using Equations (18)–(24), the following competition strategies are defined.
The GTO approach develops the following FF to make the best classification solutions. It defines a positive integer to denote the good solution of the candidate’s performance. In this case, the reduction in the classification errors is supposed to be the FF.
4. Results and Discussion
The proposed model was simulated in the Python 3.8.5 tool configured on a PC with specifications of i5-8600k, GeForce 1050Ti 4 GB, 16 GB RAM, 250 GB SSD, and 1 TB HDD.
The ID detection outcomes of the NIDS-LOFSDL methodology were validated using two benchmark datasets, the UNSW-NB15 [
22] and AWID [
23].
Table 1 shows the details of both datasets.
Figure 3 establishes the classification performances of the NIDS-LOFSDL system on the UNSW-NB15 database.
Figure 3a,b demonstrate the confusion matrices produced by the NIDS-LOFSDL methodology on the 60:40 TR set/TS set. The outcome values show that the NIDS-LOFSDL system detected and classified both the classes accurately. Afterwards,
Figure 3c reveals the PR outcomes of the NIDS-LOFSDL method. The simulation value infers that the NIDS-LOFSDL methodology attained the maximum PR values on both the classes. However,
Figure 3d demonstrates the ROC outcomes of the NIDS-LOFSDL methodology. The outcomes show that the NIDS-LOFSDL approach led to a proficient solution with better ROC values on both the classes.
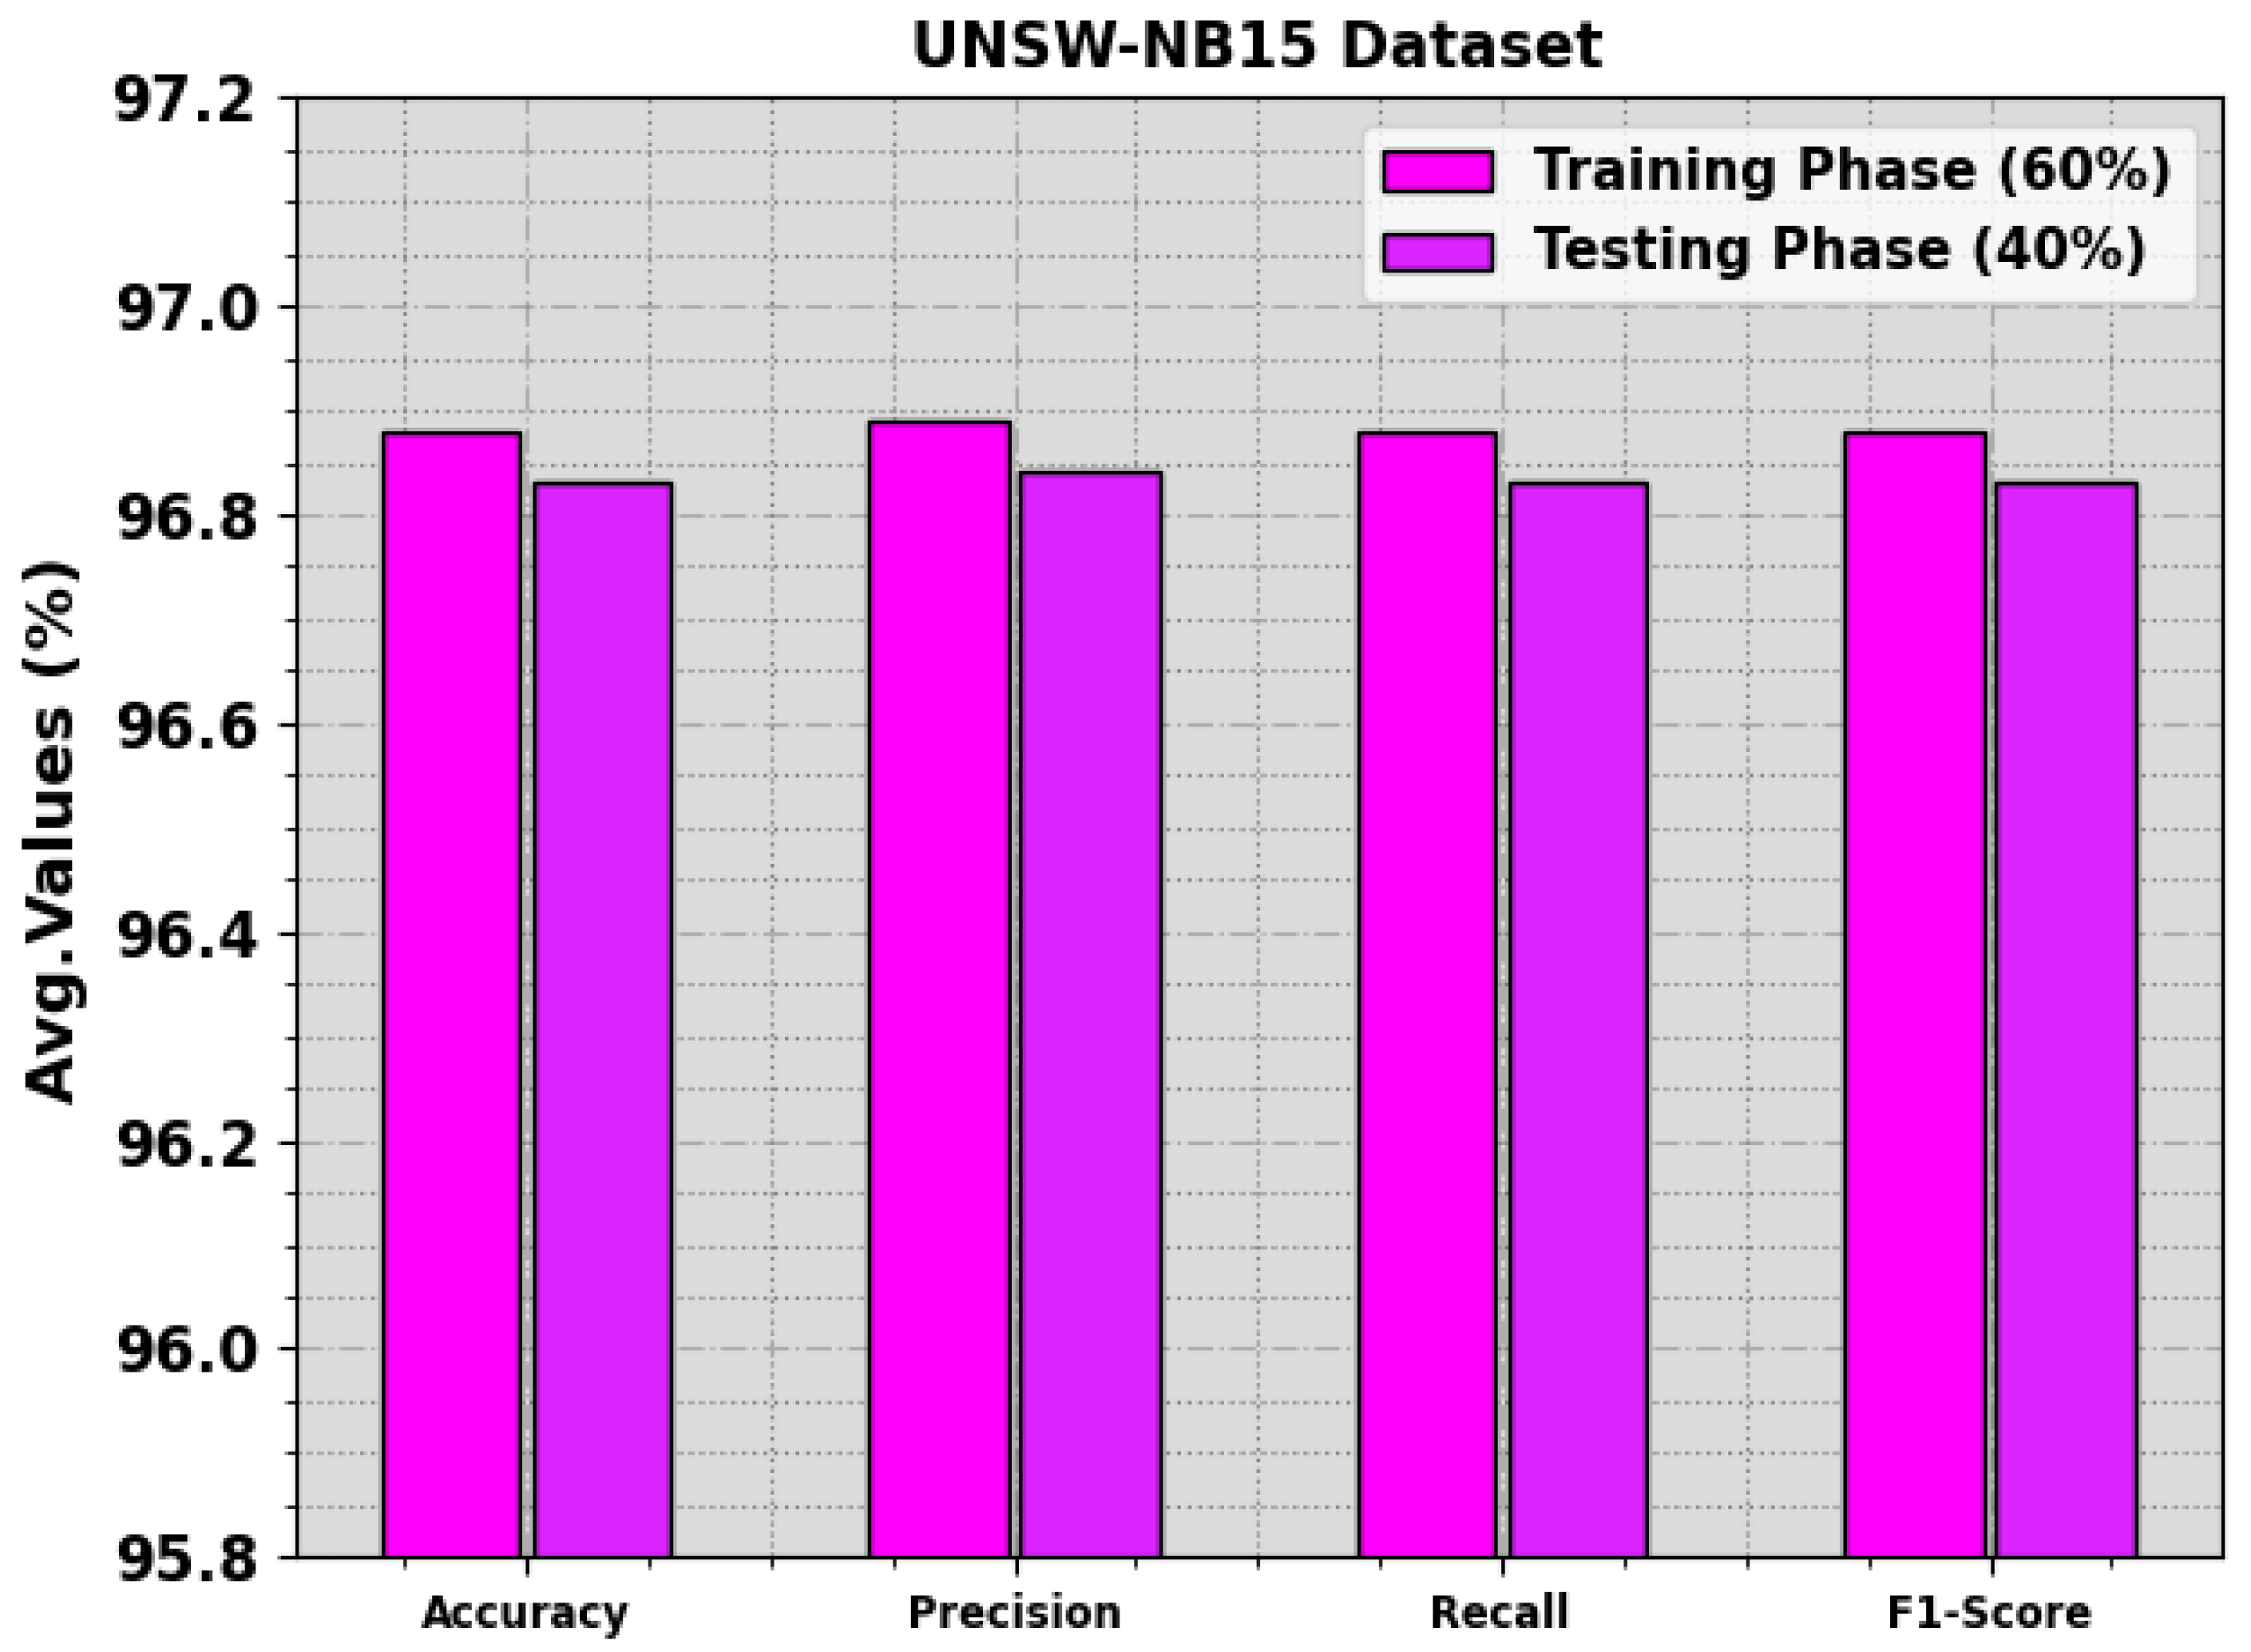
Table 2 and
Figure 4 highlight the recognition outcomes of the NIDS-LOFSDL system upon the UNSW-NB15 database. The outcomes indicate the proficient recognition of normal and attack instances. With the 60% TR set, the NIDS-LOFSDL technique achieved an average
of 96.88%, a
of 96.89%, a
of 96.88%, and an
of 96.88%. Additionally, with the 40% TS set, the NIDS-LOFSDL algorithm attained an average
of 96.83%, a
of 96.84%, a
of 96.83% and an
of 96.83%.
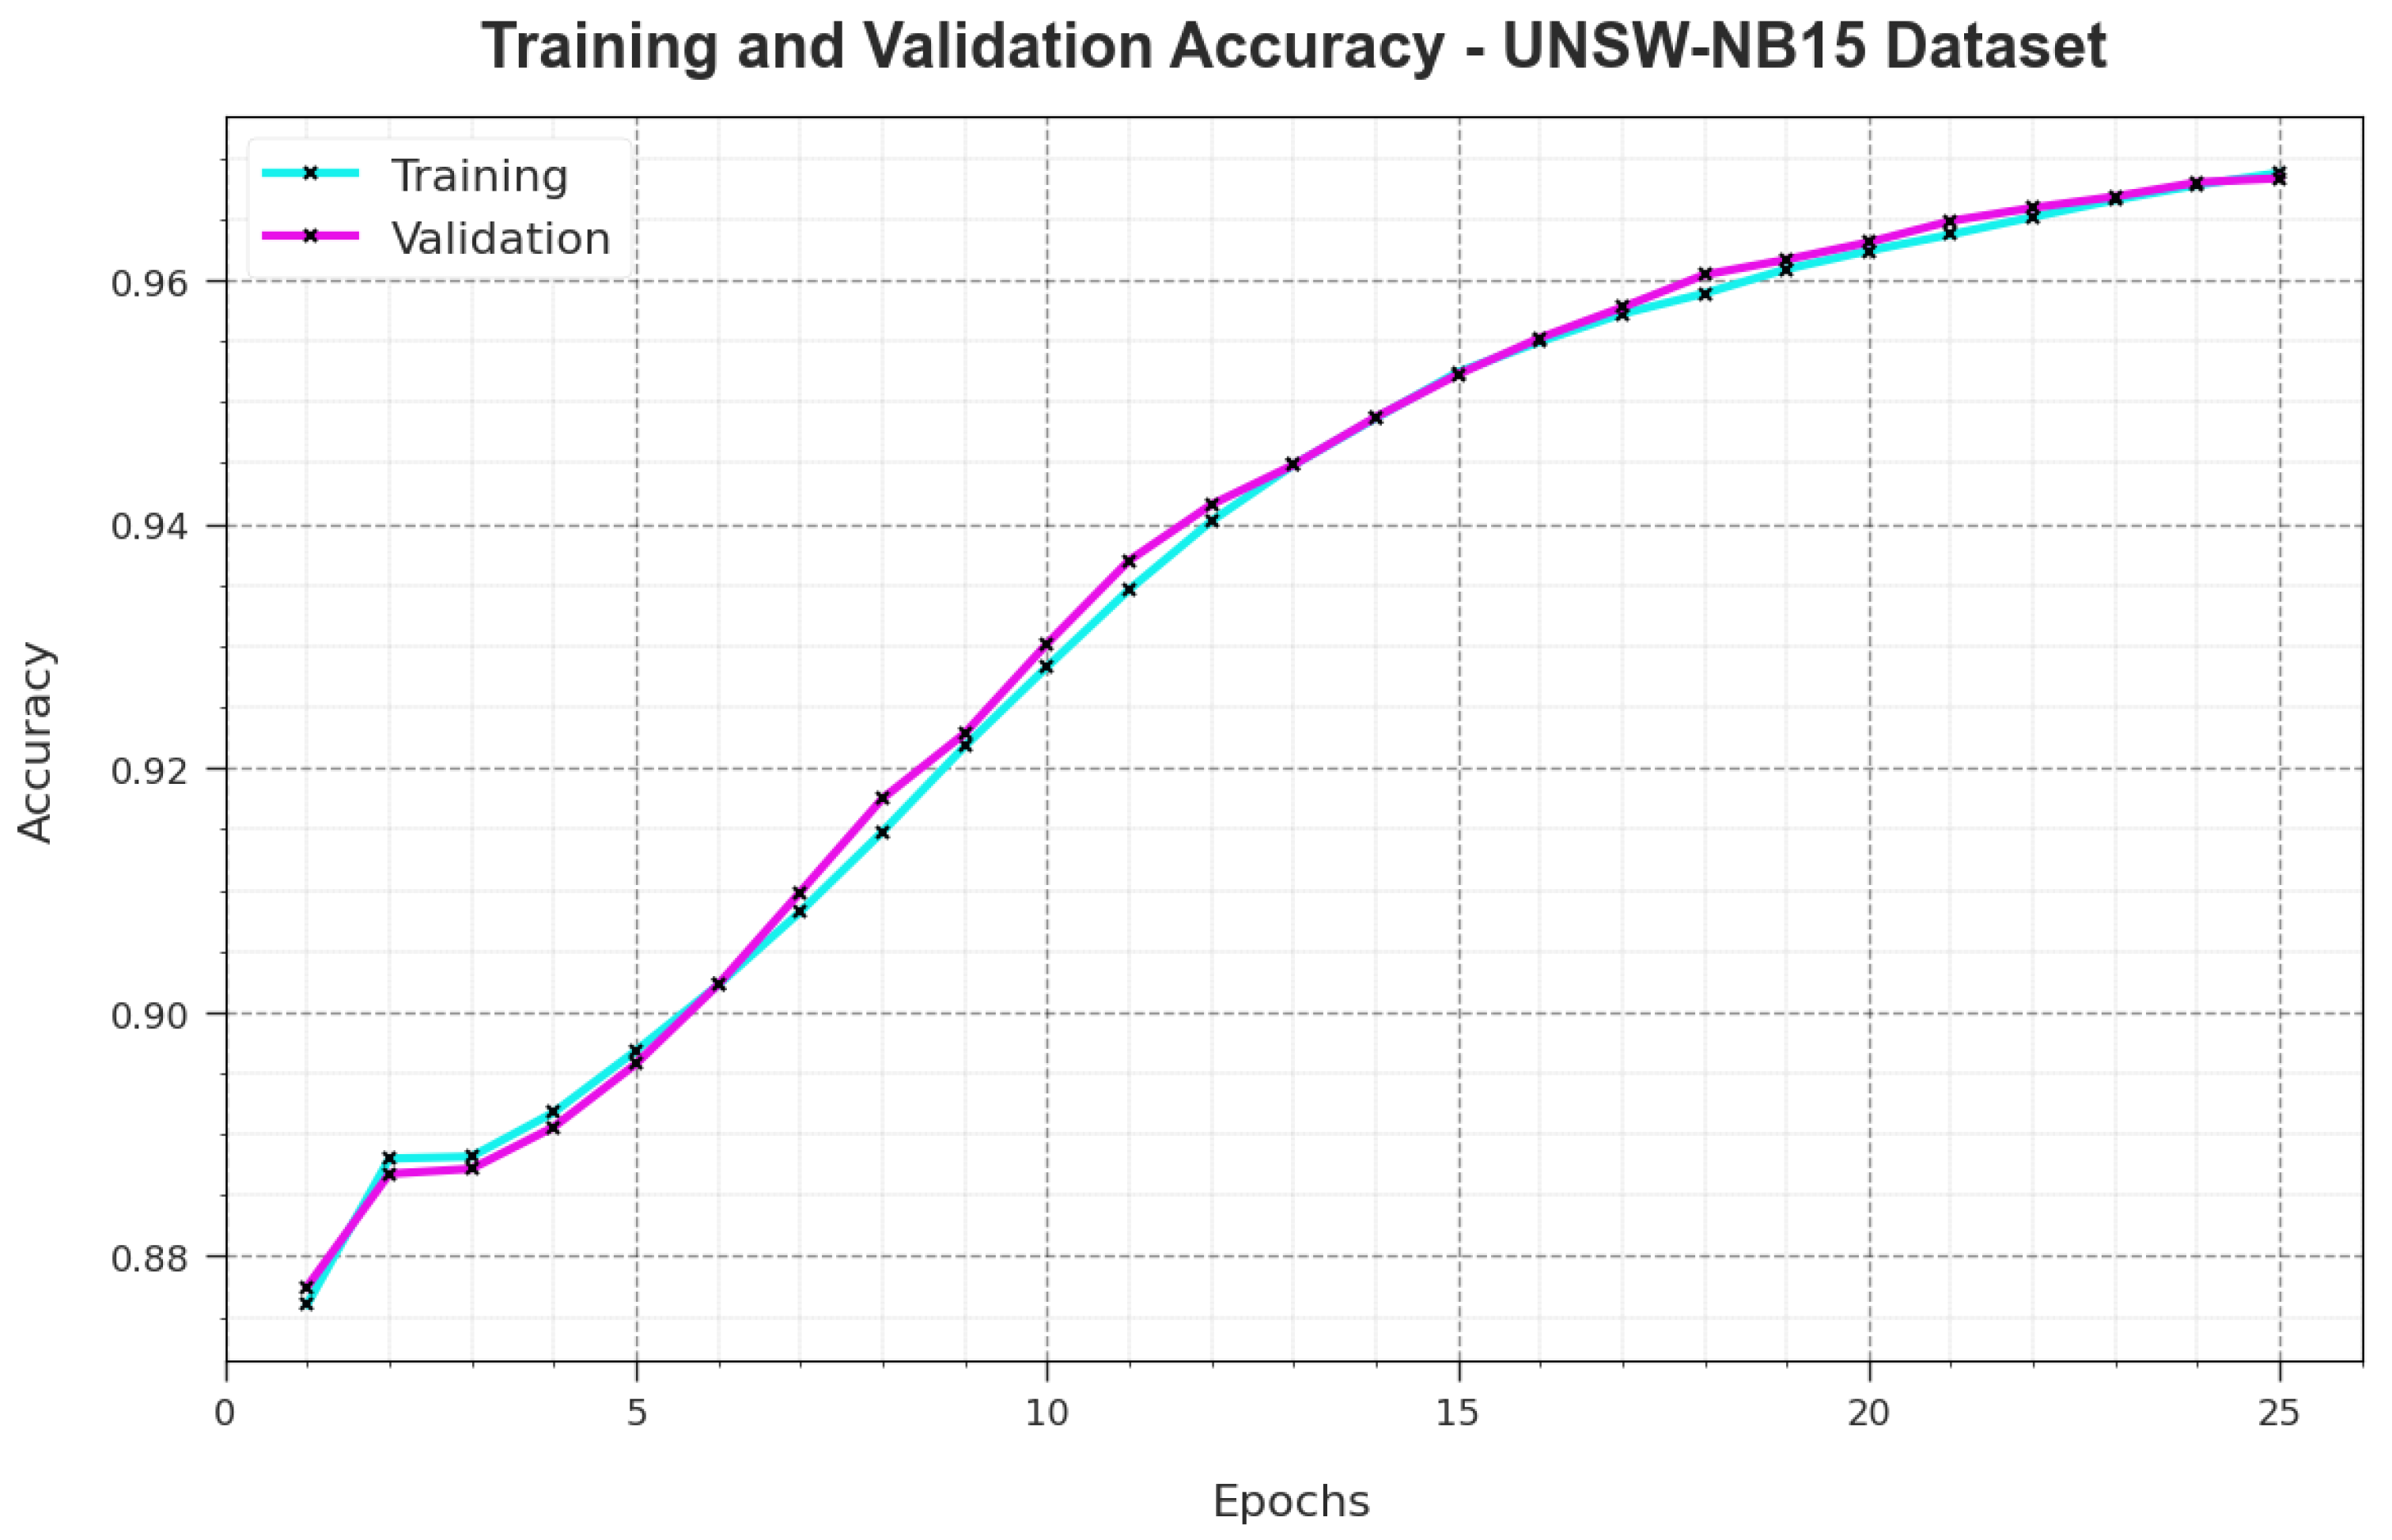
Figure 5 illustrates the training accuracy values, i.e.,
and
, attained by the NIDS-LOFSDL technique on the UNSW-NB15 dataset.
is determined by evaluating the NIDS-LOFSDL method on the TR dataset, whereas the
value is computed by evaluating the outcomes on a separate testing dataset. The results imply that both the
and
values increased with an upsurge in the number of epochs. Accordingly, the performance of the NIDS-LOFSDL system is confirmed to achieve the maximum performance on both TR and TS datasets, with an increase in the number of epochs.
In
Figure 6, the
and
results of the NIDS-LOFSDL algorithm on the UNSW-NB15 dataset are revealed. The
corresponds to the error between the predictive performance and original values on the TR data. The
represents the performance evaluation of the NIDS-LOFSDL technique on individual validation data. The outcomes imply that both
and
values were reduced with an increase in the number of epochs. This scenario portrays the enhanced performance of the NIDS-LOFSDL approach and its ability to produce an accurate classification. The minimal
and
values demonstrate the enhanced performance of the NIDS-LOFSDL method in capturing the patterns and relationships.
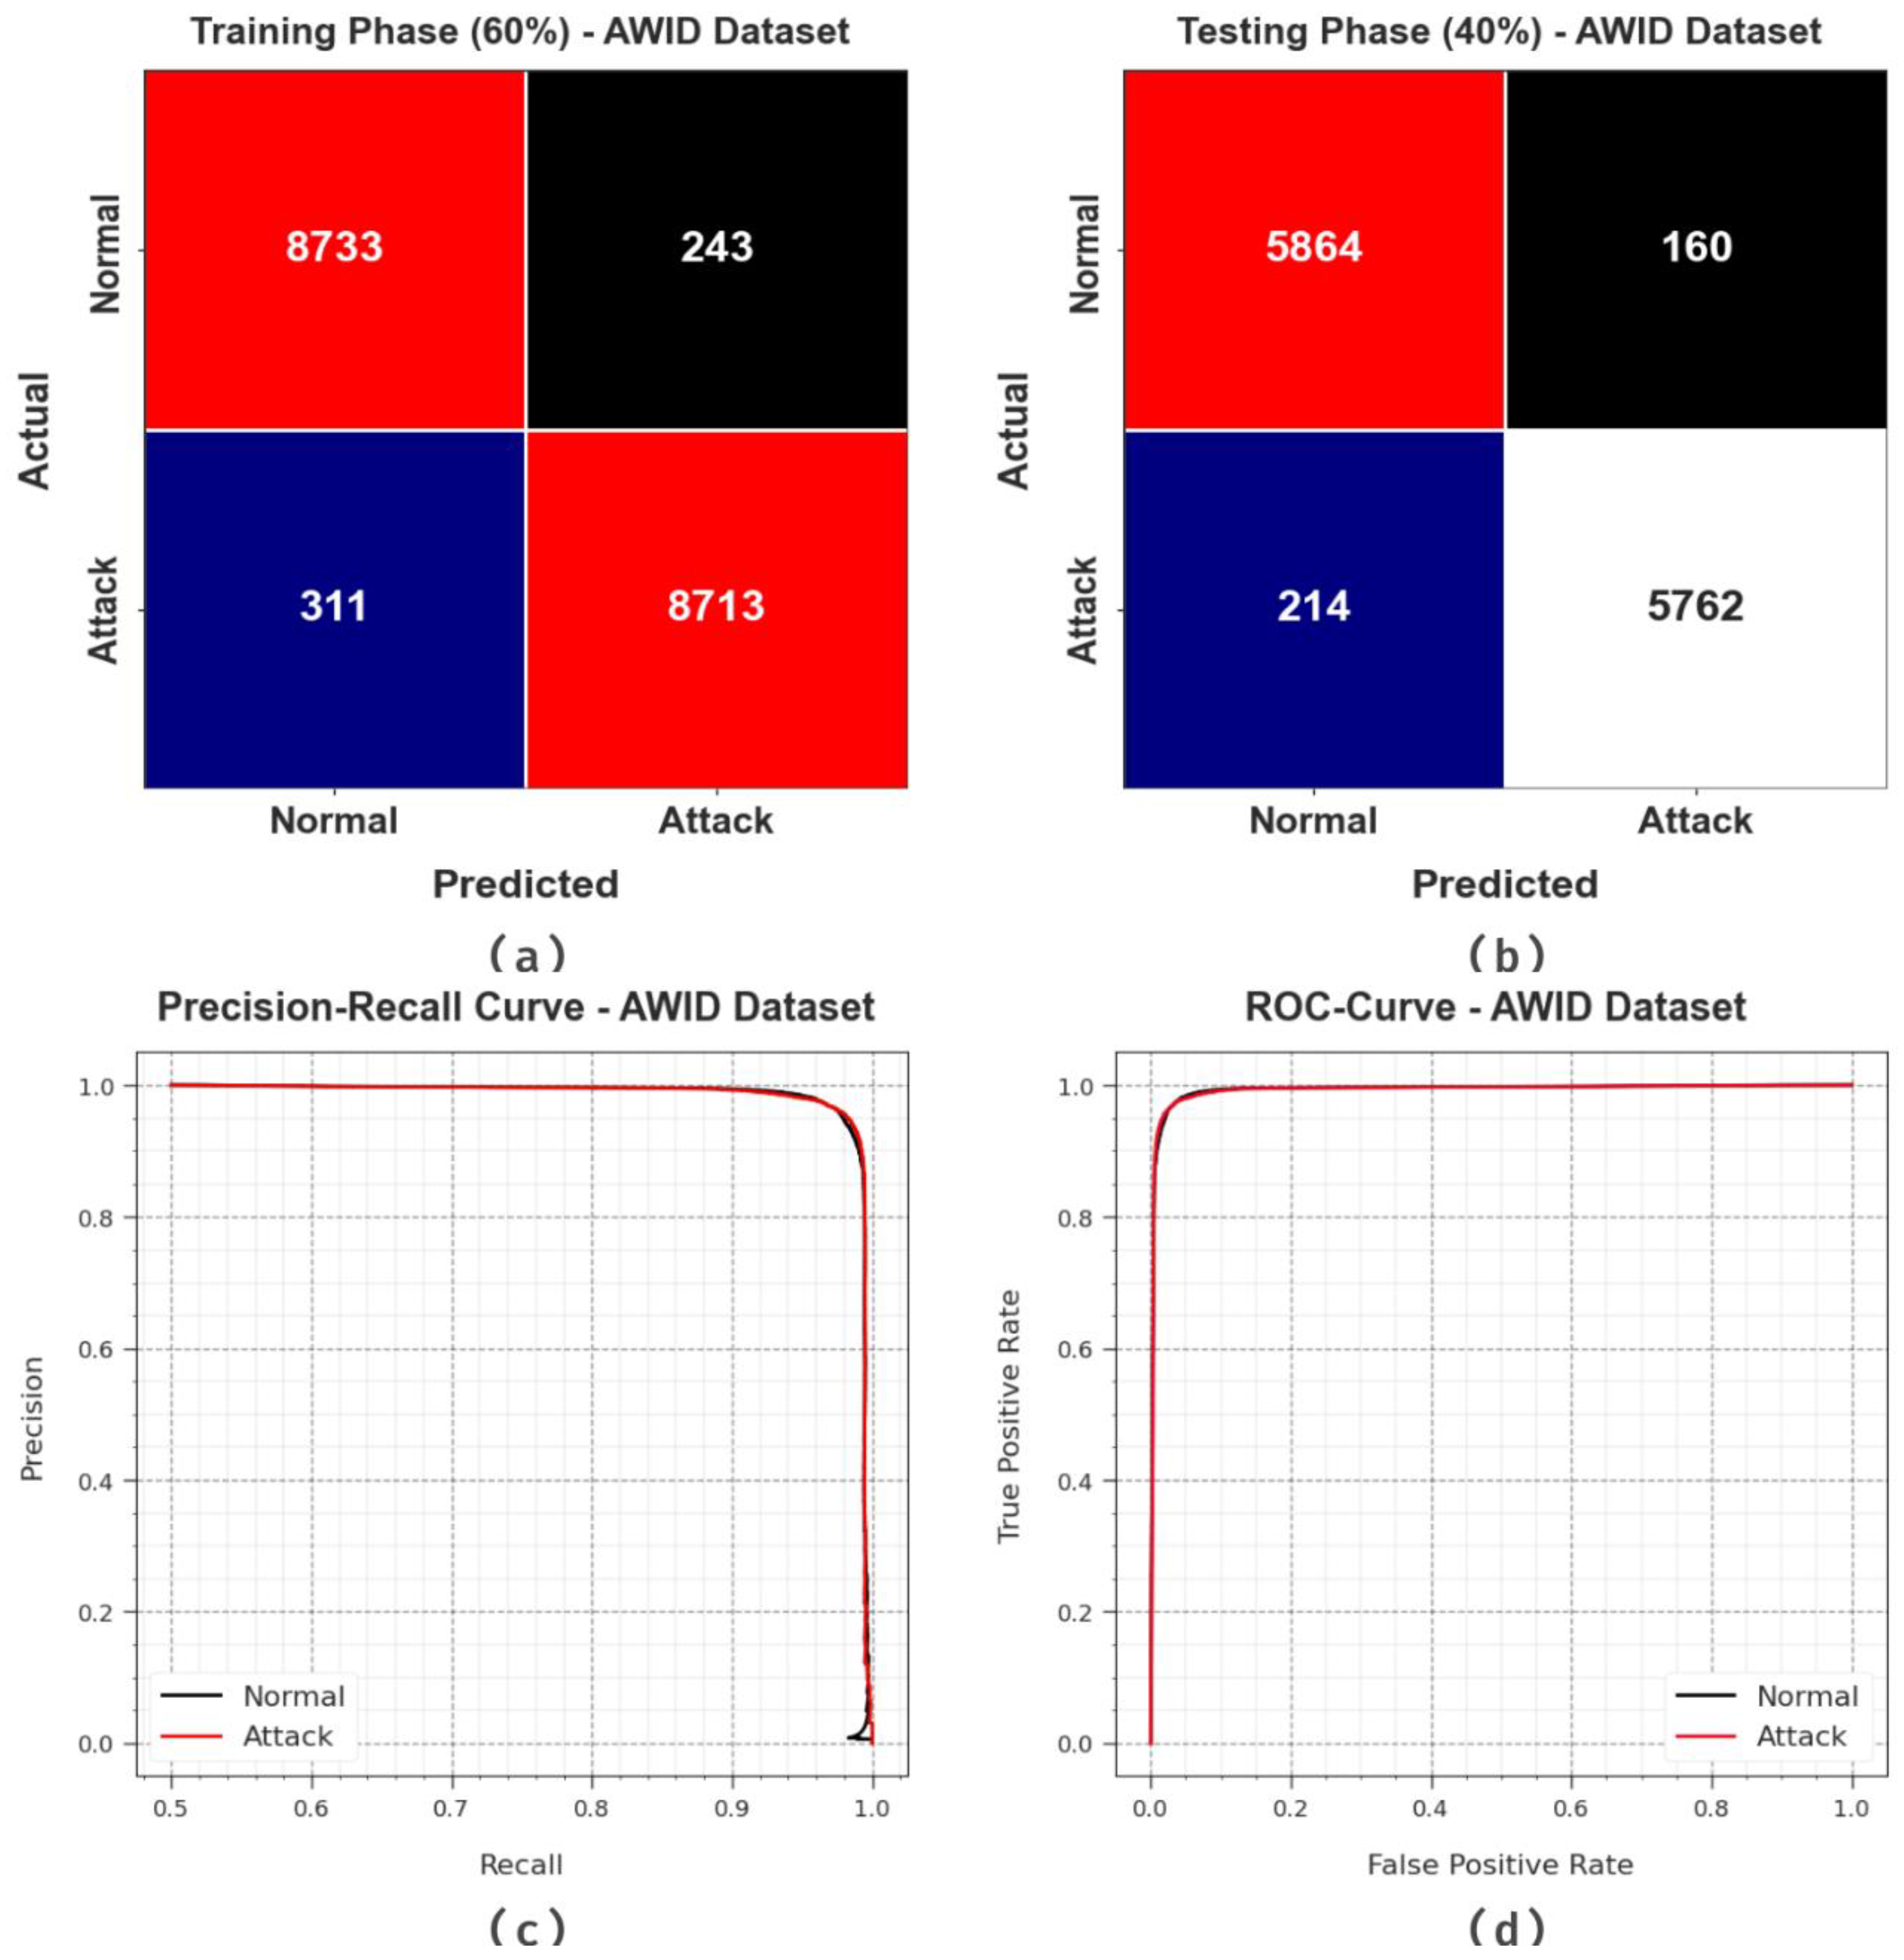
Figure 7 illustrates the classification outcomes of the NIDS-LOFSDL algorithm on the AWID database.
Figure 7a,b exhibit the confusion matrices generated by the NIDS-LOFSDL methodology upon 60:40 of the TR set/TS set. The outcomes show that the NIDS-LOFSDL system outperformed all other techniques and detected and classified both the classes accurately. Then,
Figure 7c depicts the PR outcomes of the NIDS-LOFSDL approach. The simulation value shows that the NIDS-LOFSDL system reached increased PR values on both the classes. Moreover,
Figure 7d shows the ROC curve of the NIDS-LOFSDL methodology. The outcome values demonstrate the superior capability of the NIDS-LOFSDL algorithm with higher ROC values on both the classes.
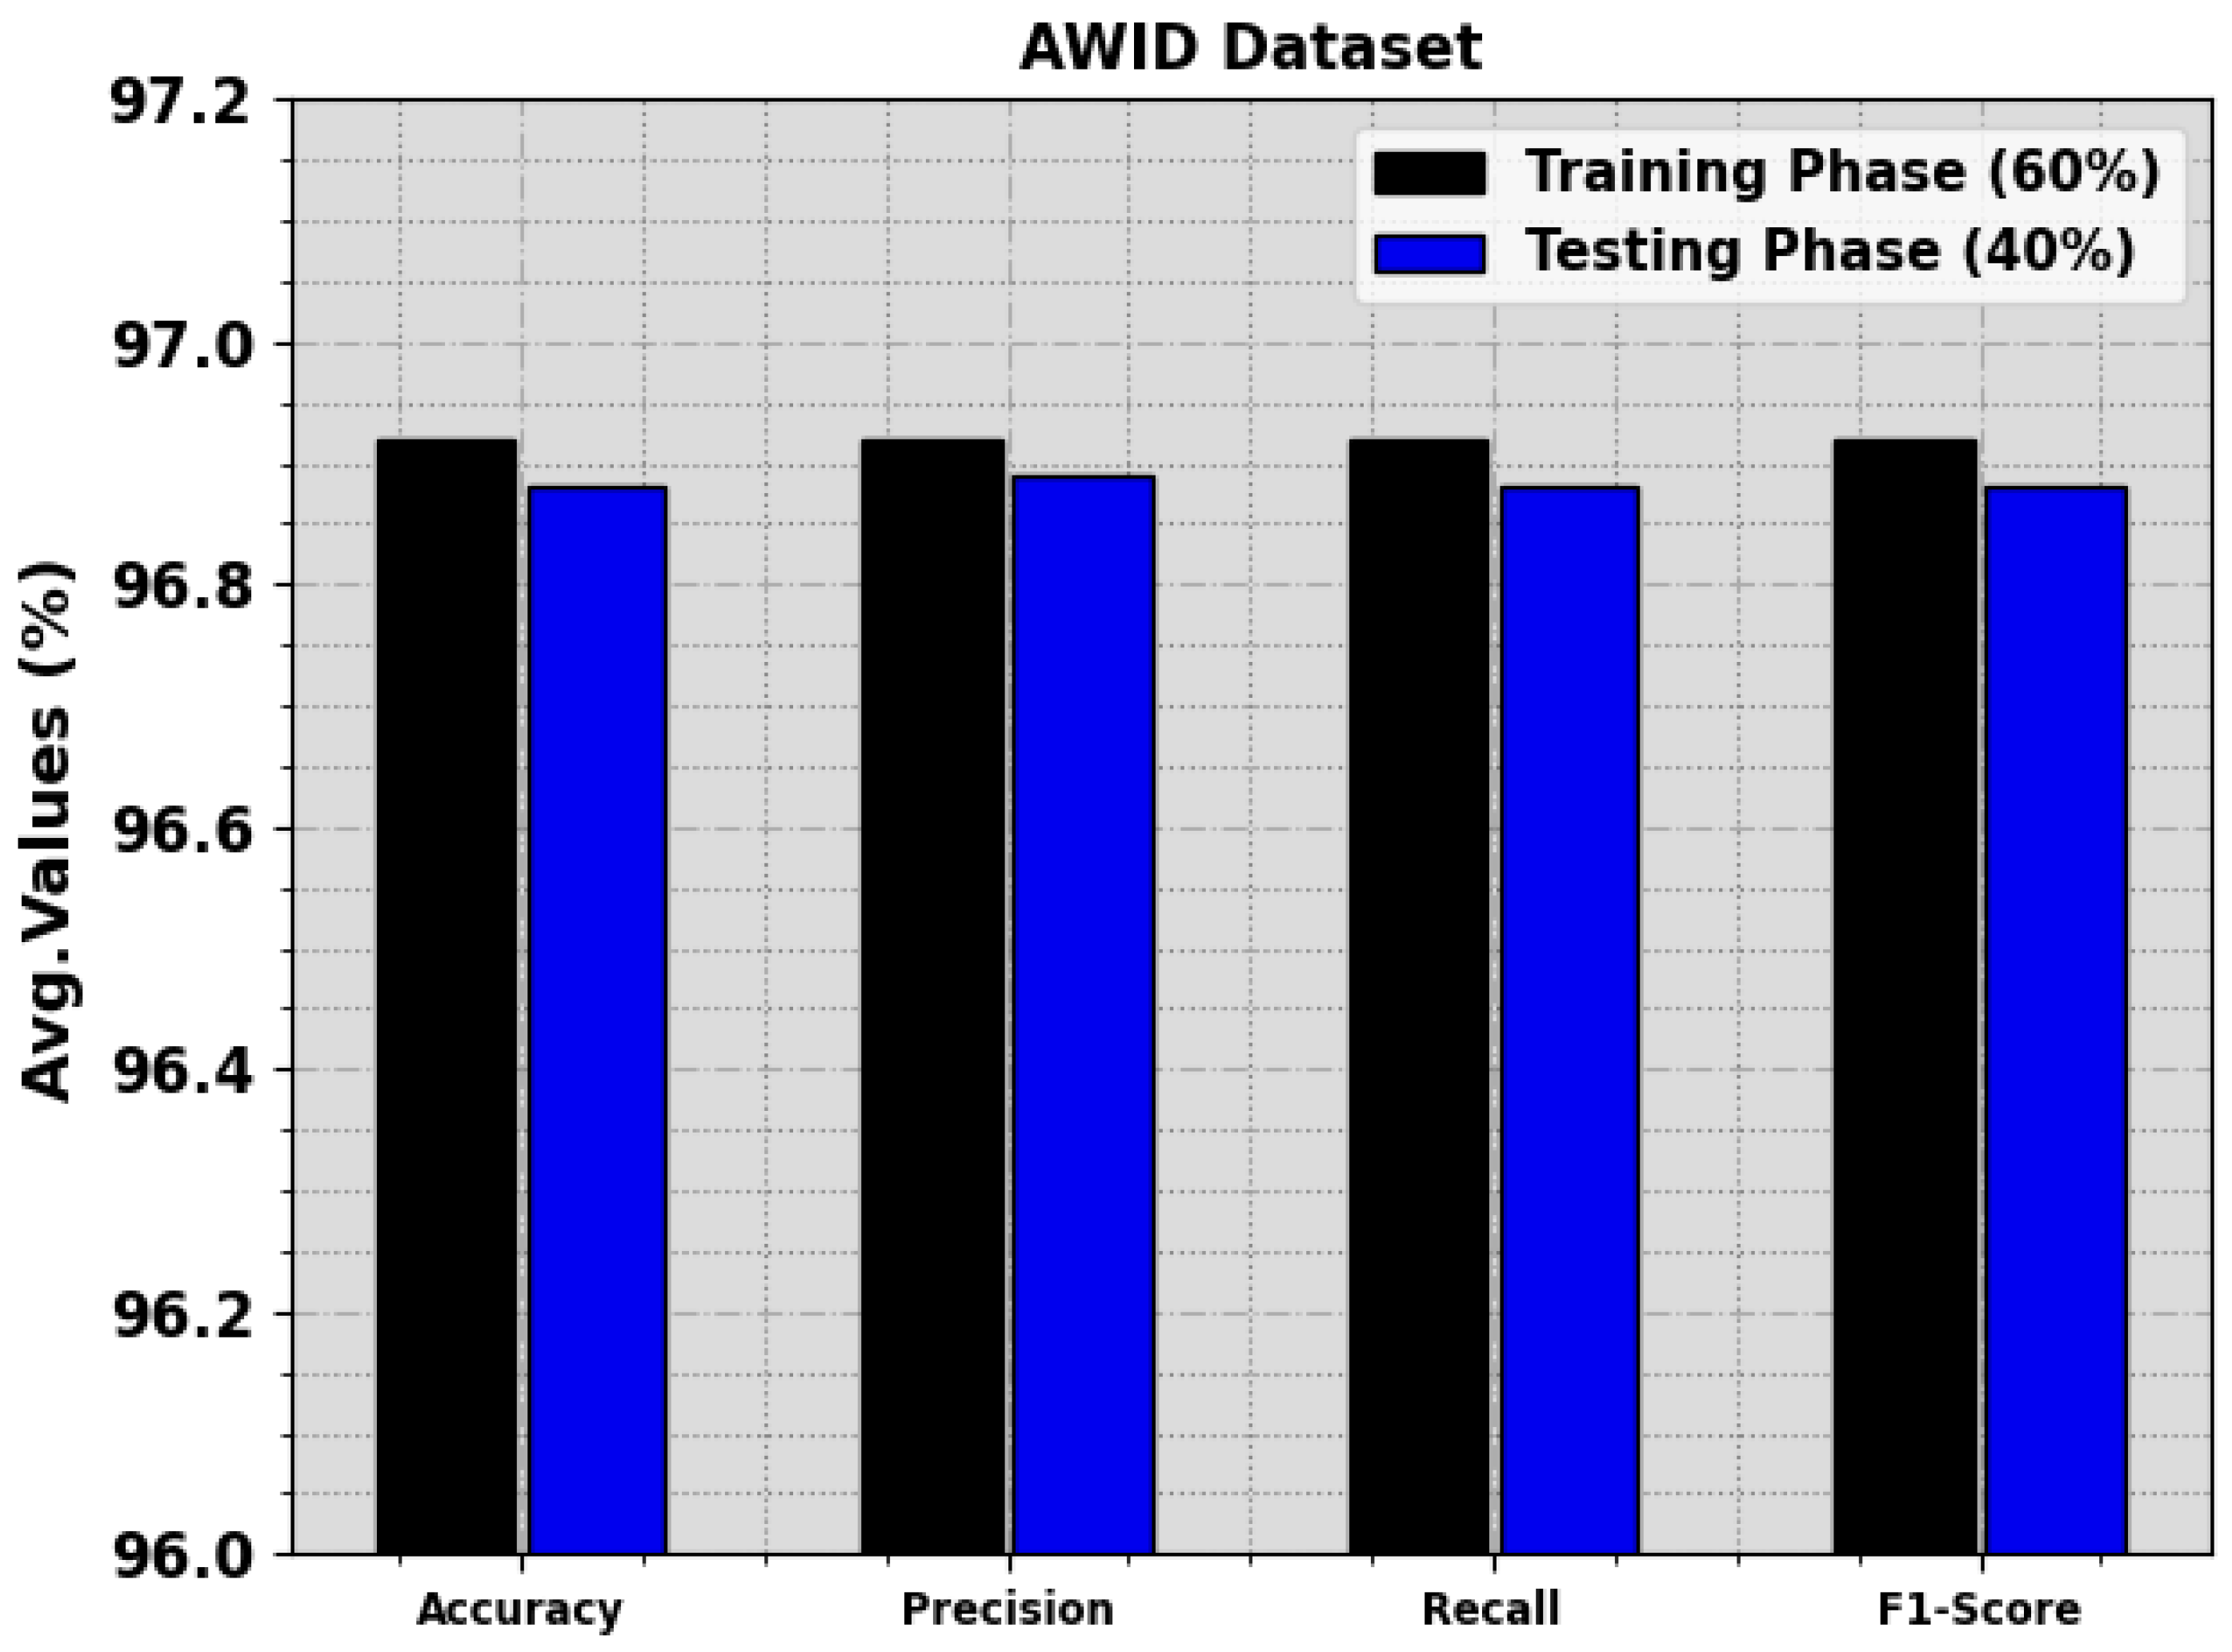
Table 3 and
Figure 8 demonstrate the recognition outcomes of the NIDS-LOFSDL methodology on the AWID database. The simulation value refers to the proficient recognition of both normal and attack samples. With the 60% TR set, the NIDS-LOFSDL system attained an average
of 96.92%,
of 96.92%,
of 96.92%, and an
of 96.92%. Then, with the 40% TS set, the NIDS-LOFSDL methodology accomplished an average
of 96.88%,
of 96.89%,
of 96.88%, and an
of 96.88%.
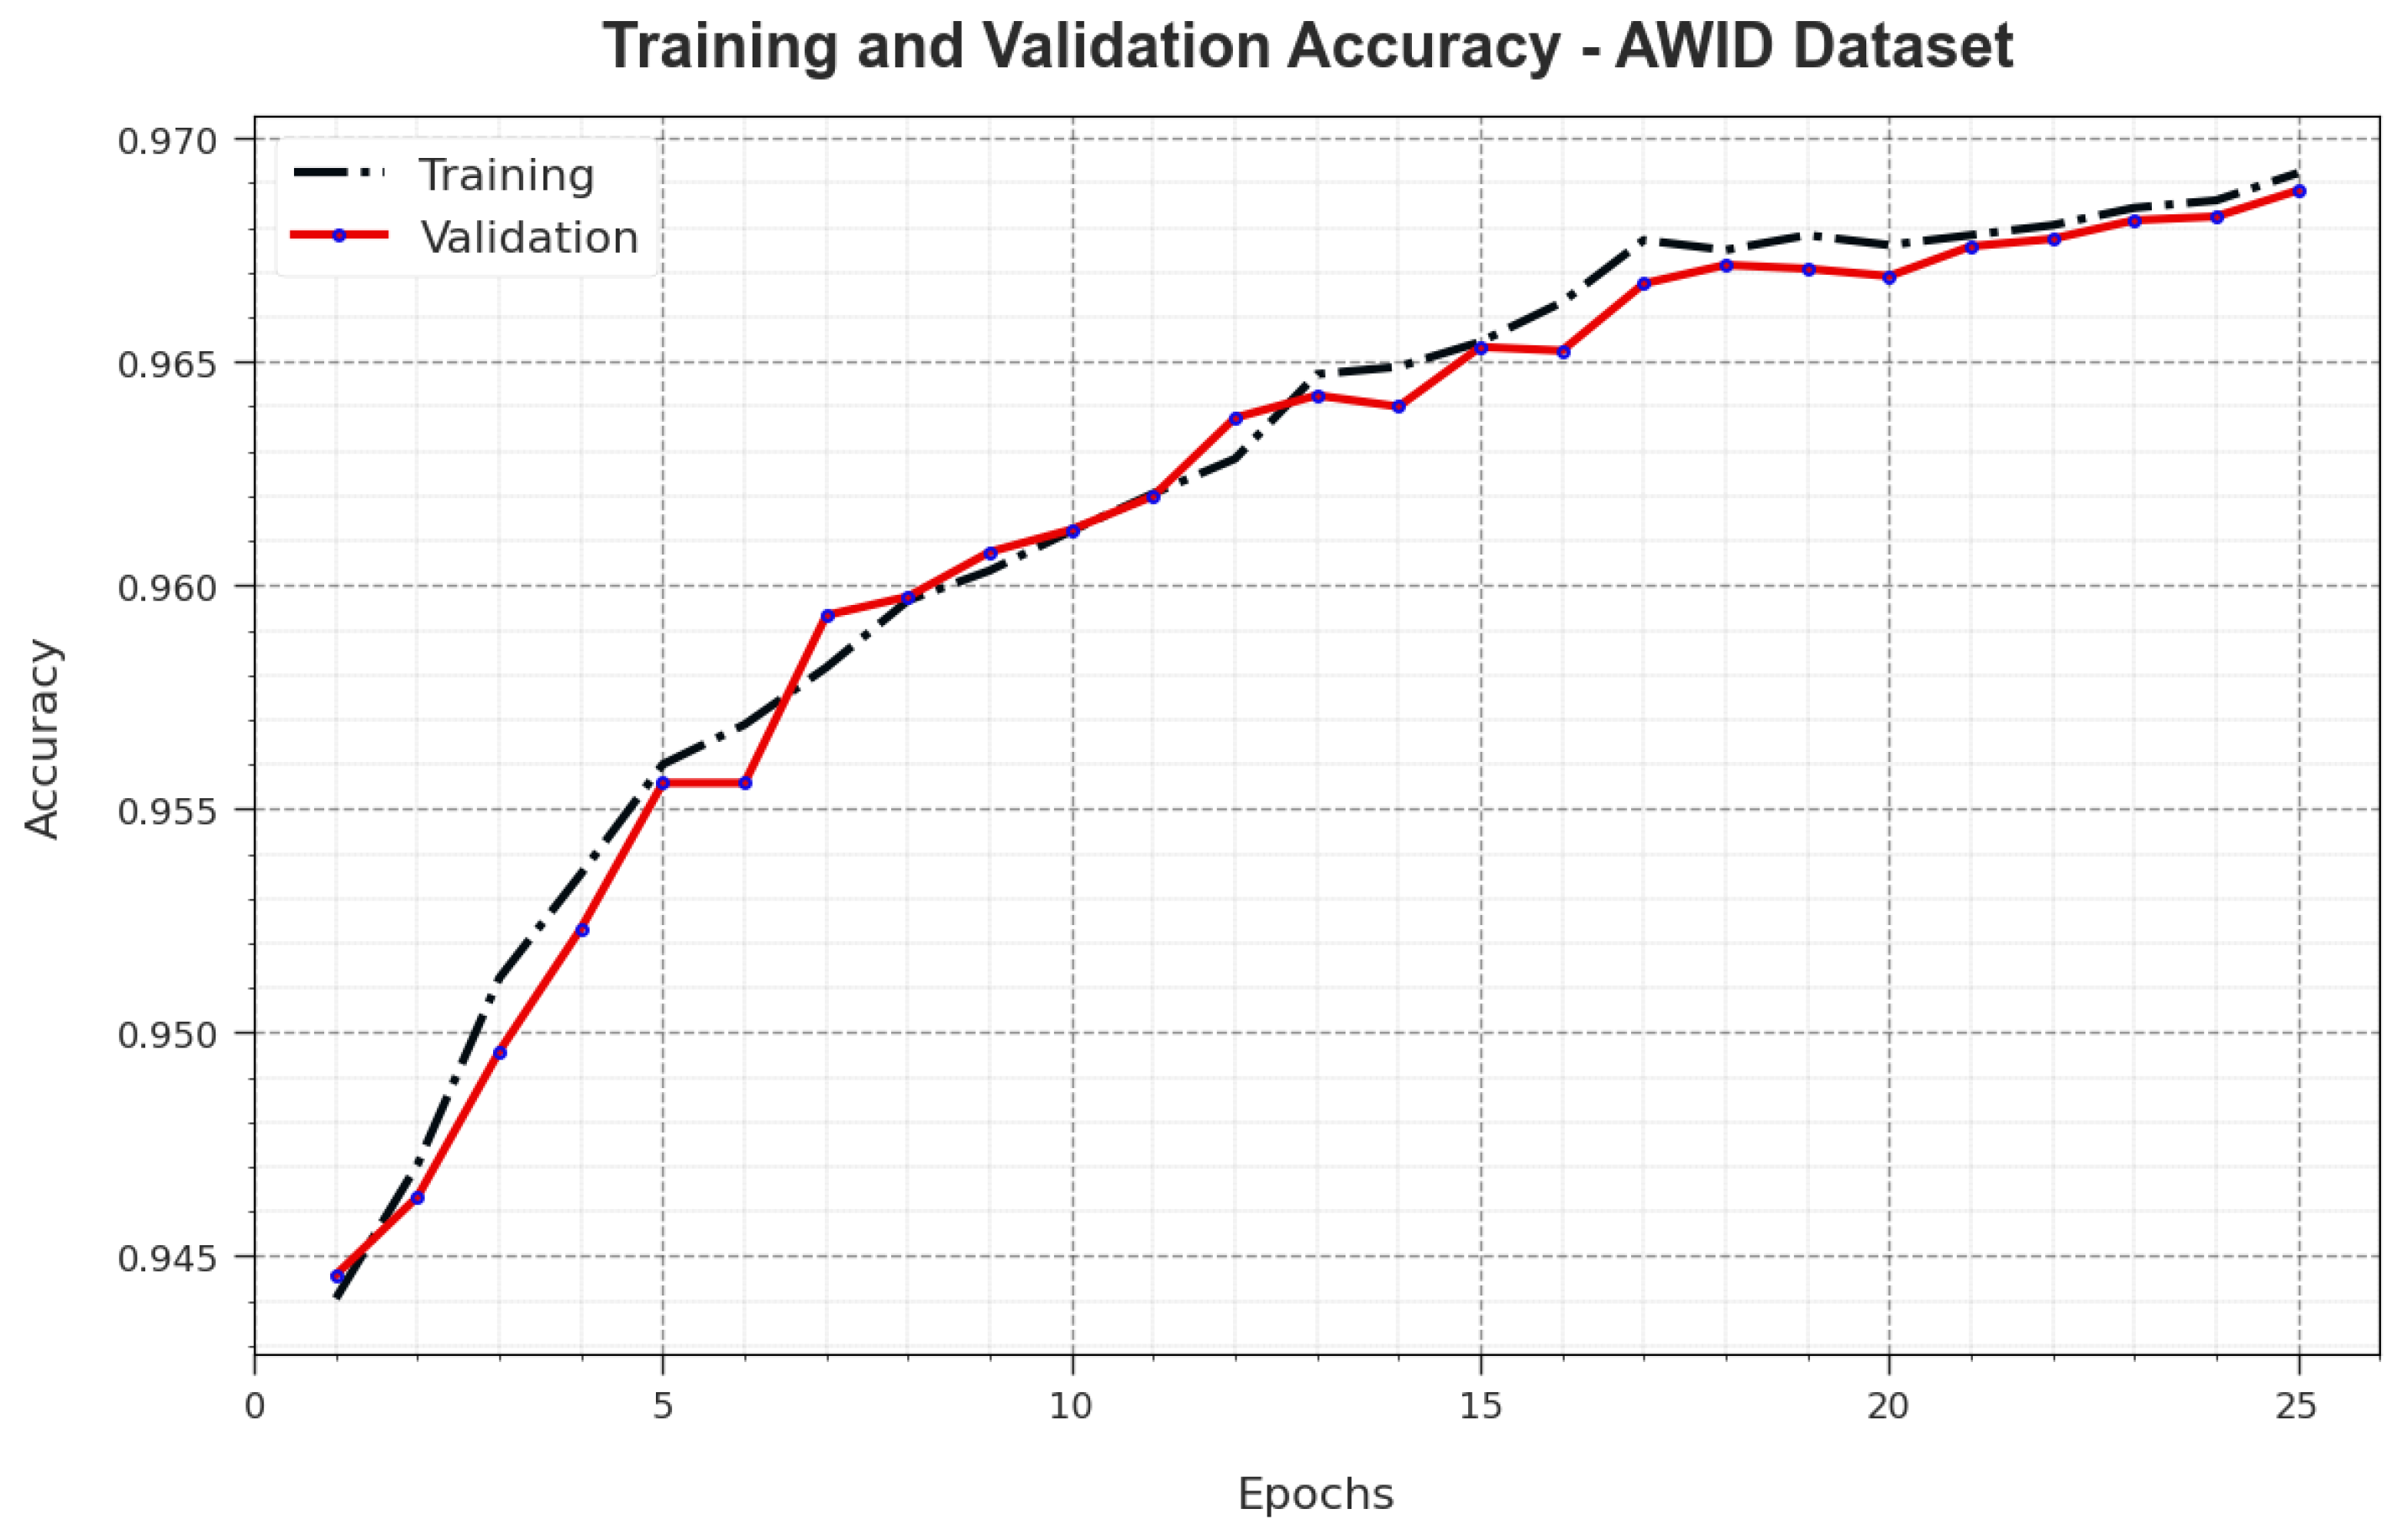
Figure 9 illustrates the training accuracy
and
values accomplished by the NIDS-LOFSDL algorithm on the AWID dataset.
is determined by evaluating the NIDS-LOFSDL methodology on the TR dataset, whereas the
value is computed by calculating the outcome on a separate testing dataset. The outcomes show that both the
and
values increased with an upsurge in the number of epochs. Therefore, the performance of the NIDS-LOFSDL methodology enhances the TR and TS datasets, with an increase in the number of epochs.
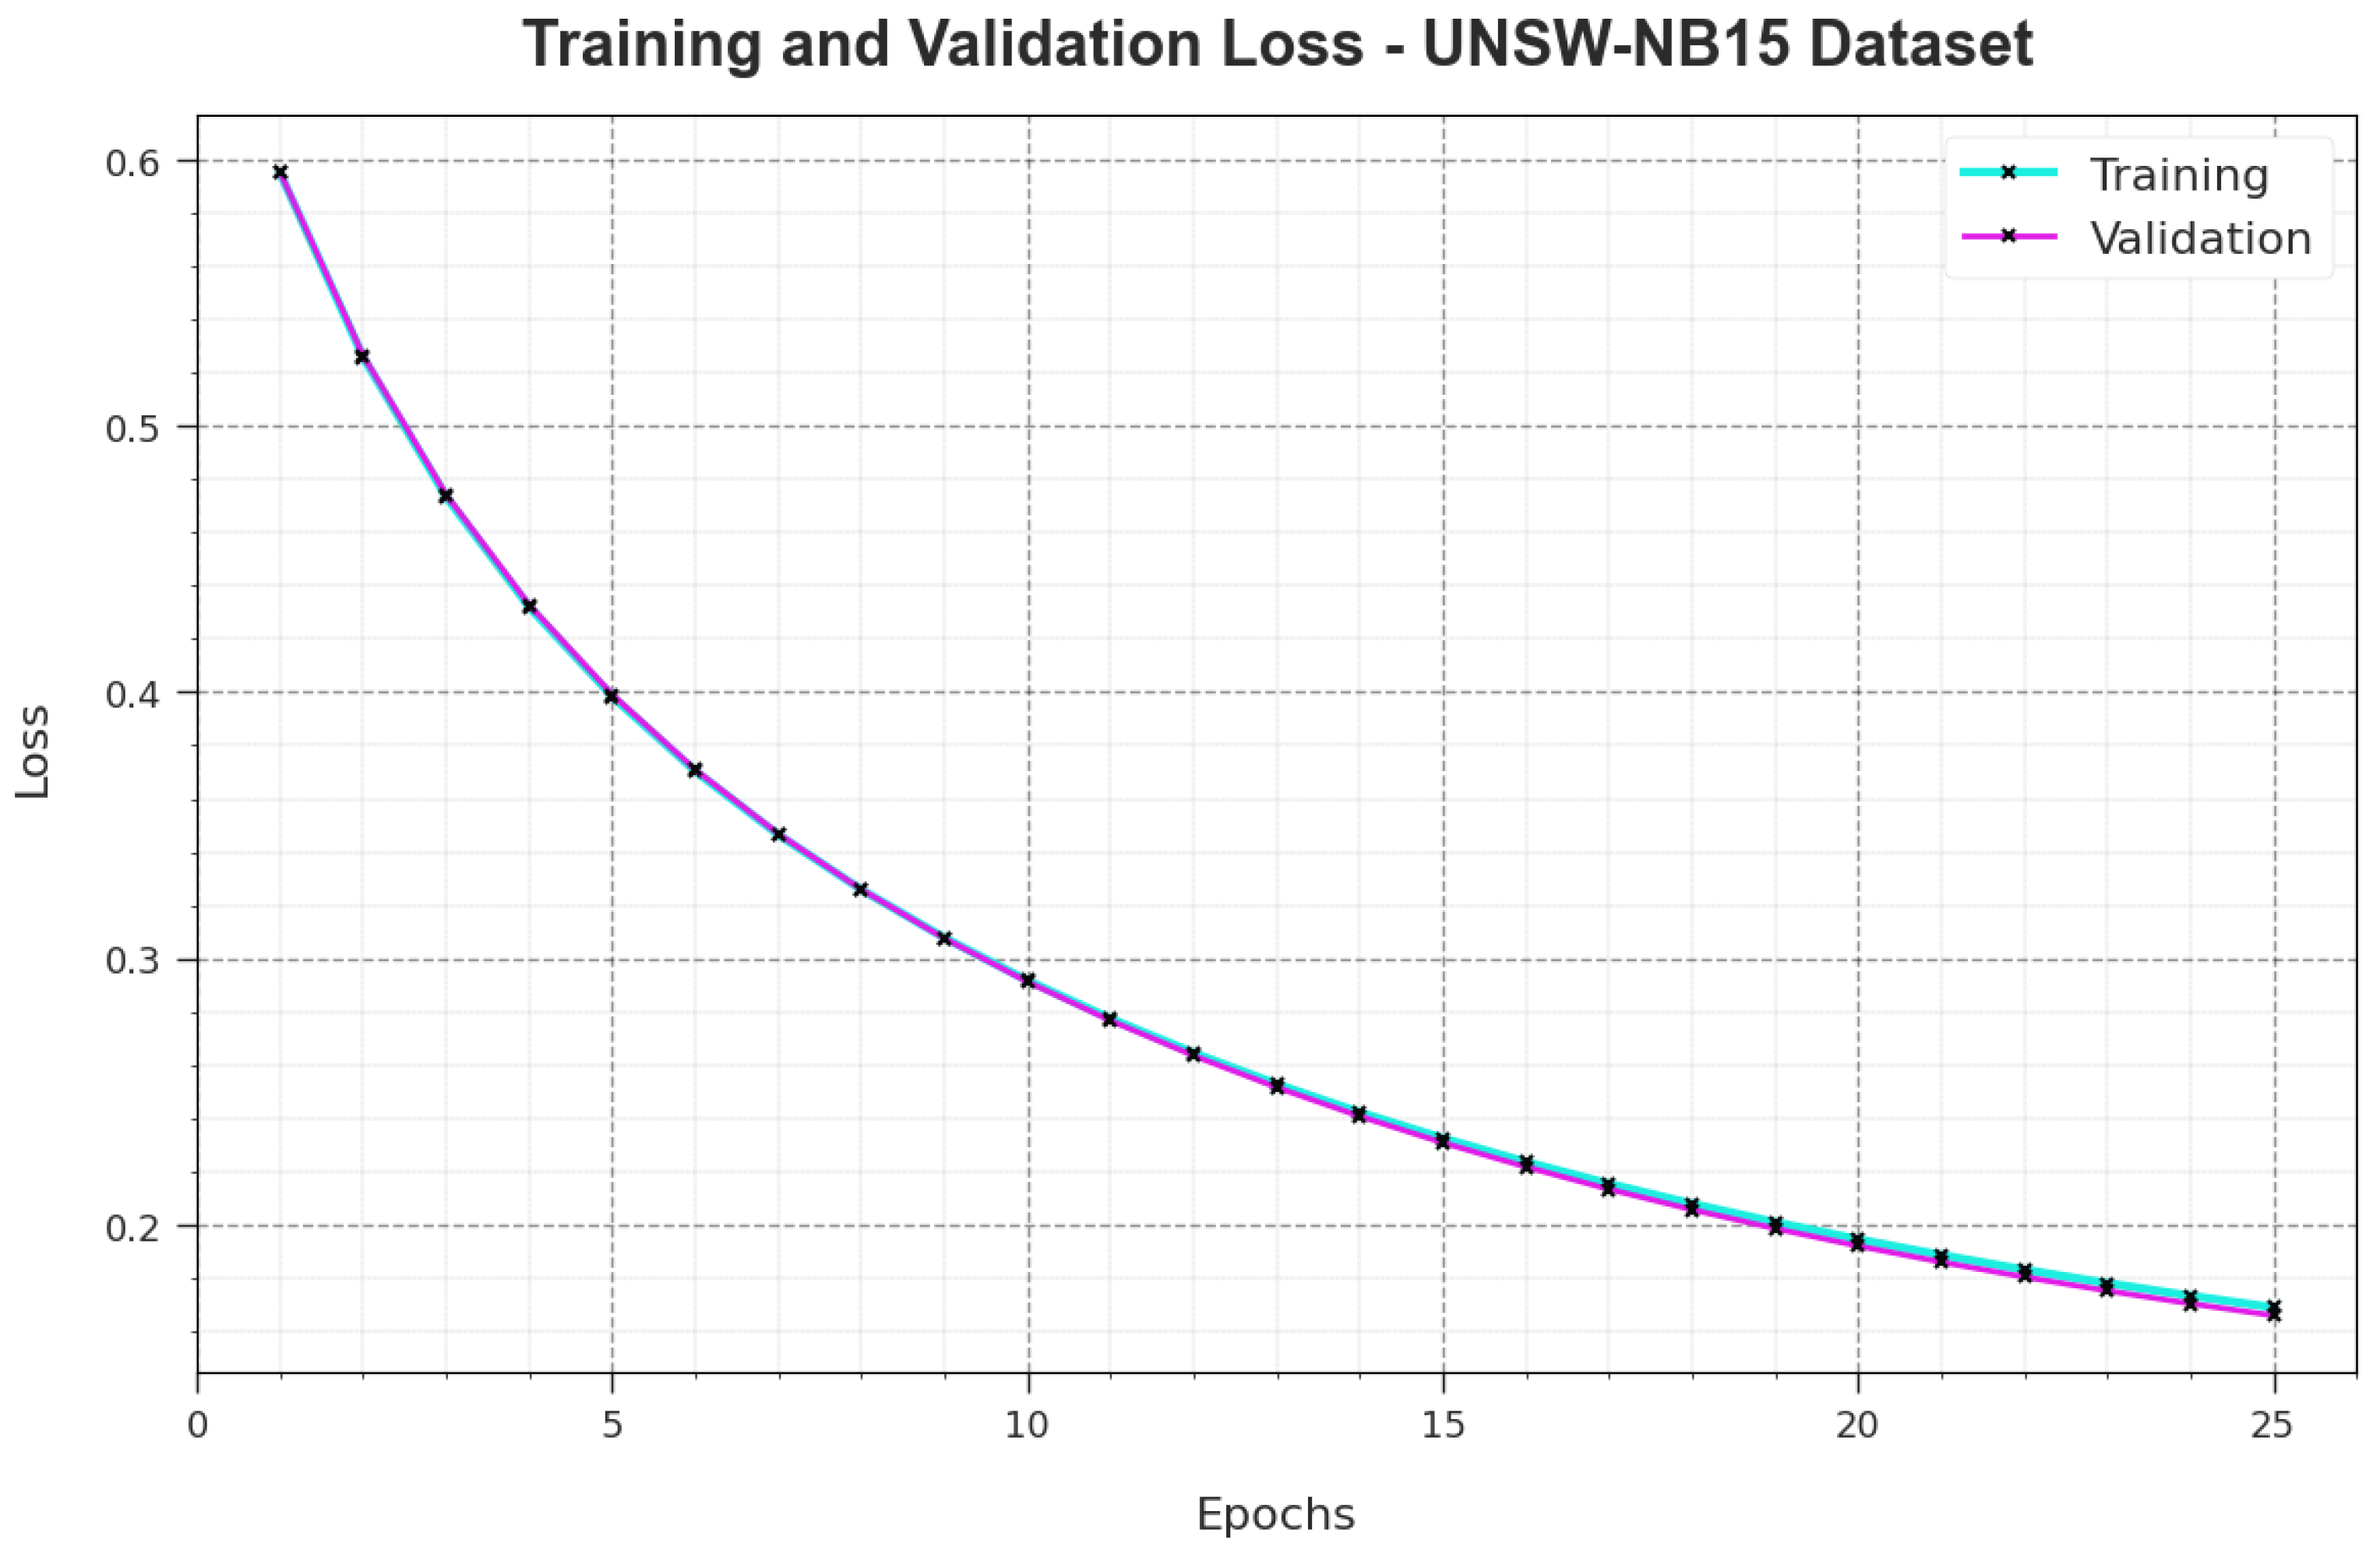
In
Figure 10, the
and
curves of the NIDS-LOFSDL approach on the AWID dataset are shown.
corresponds to the error between the predictive solution and the original values of the TR data.
signifies the performance outcomes of the NIDS-LOFSDL technique on individual validation data. The outcomes imply that both
and
values tend to decrease with increasing numbers of epochs. The outcomes represent the enhanced performance of the NIDS-LOFSDL technique and its capability to produce accurate classification. The decreased
and
values demonstrate the better solution of the NIDS-LOFSDL technique in terms of capturing the patterns and relationships.
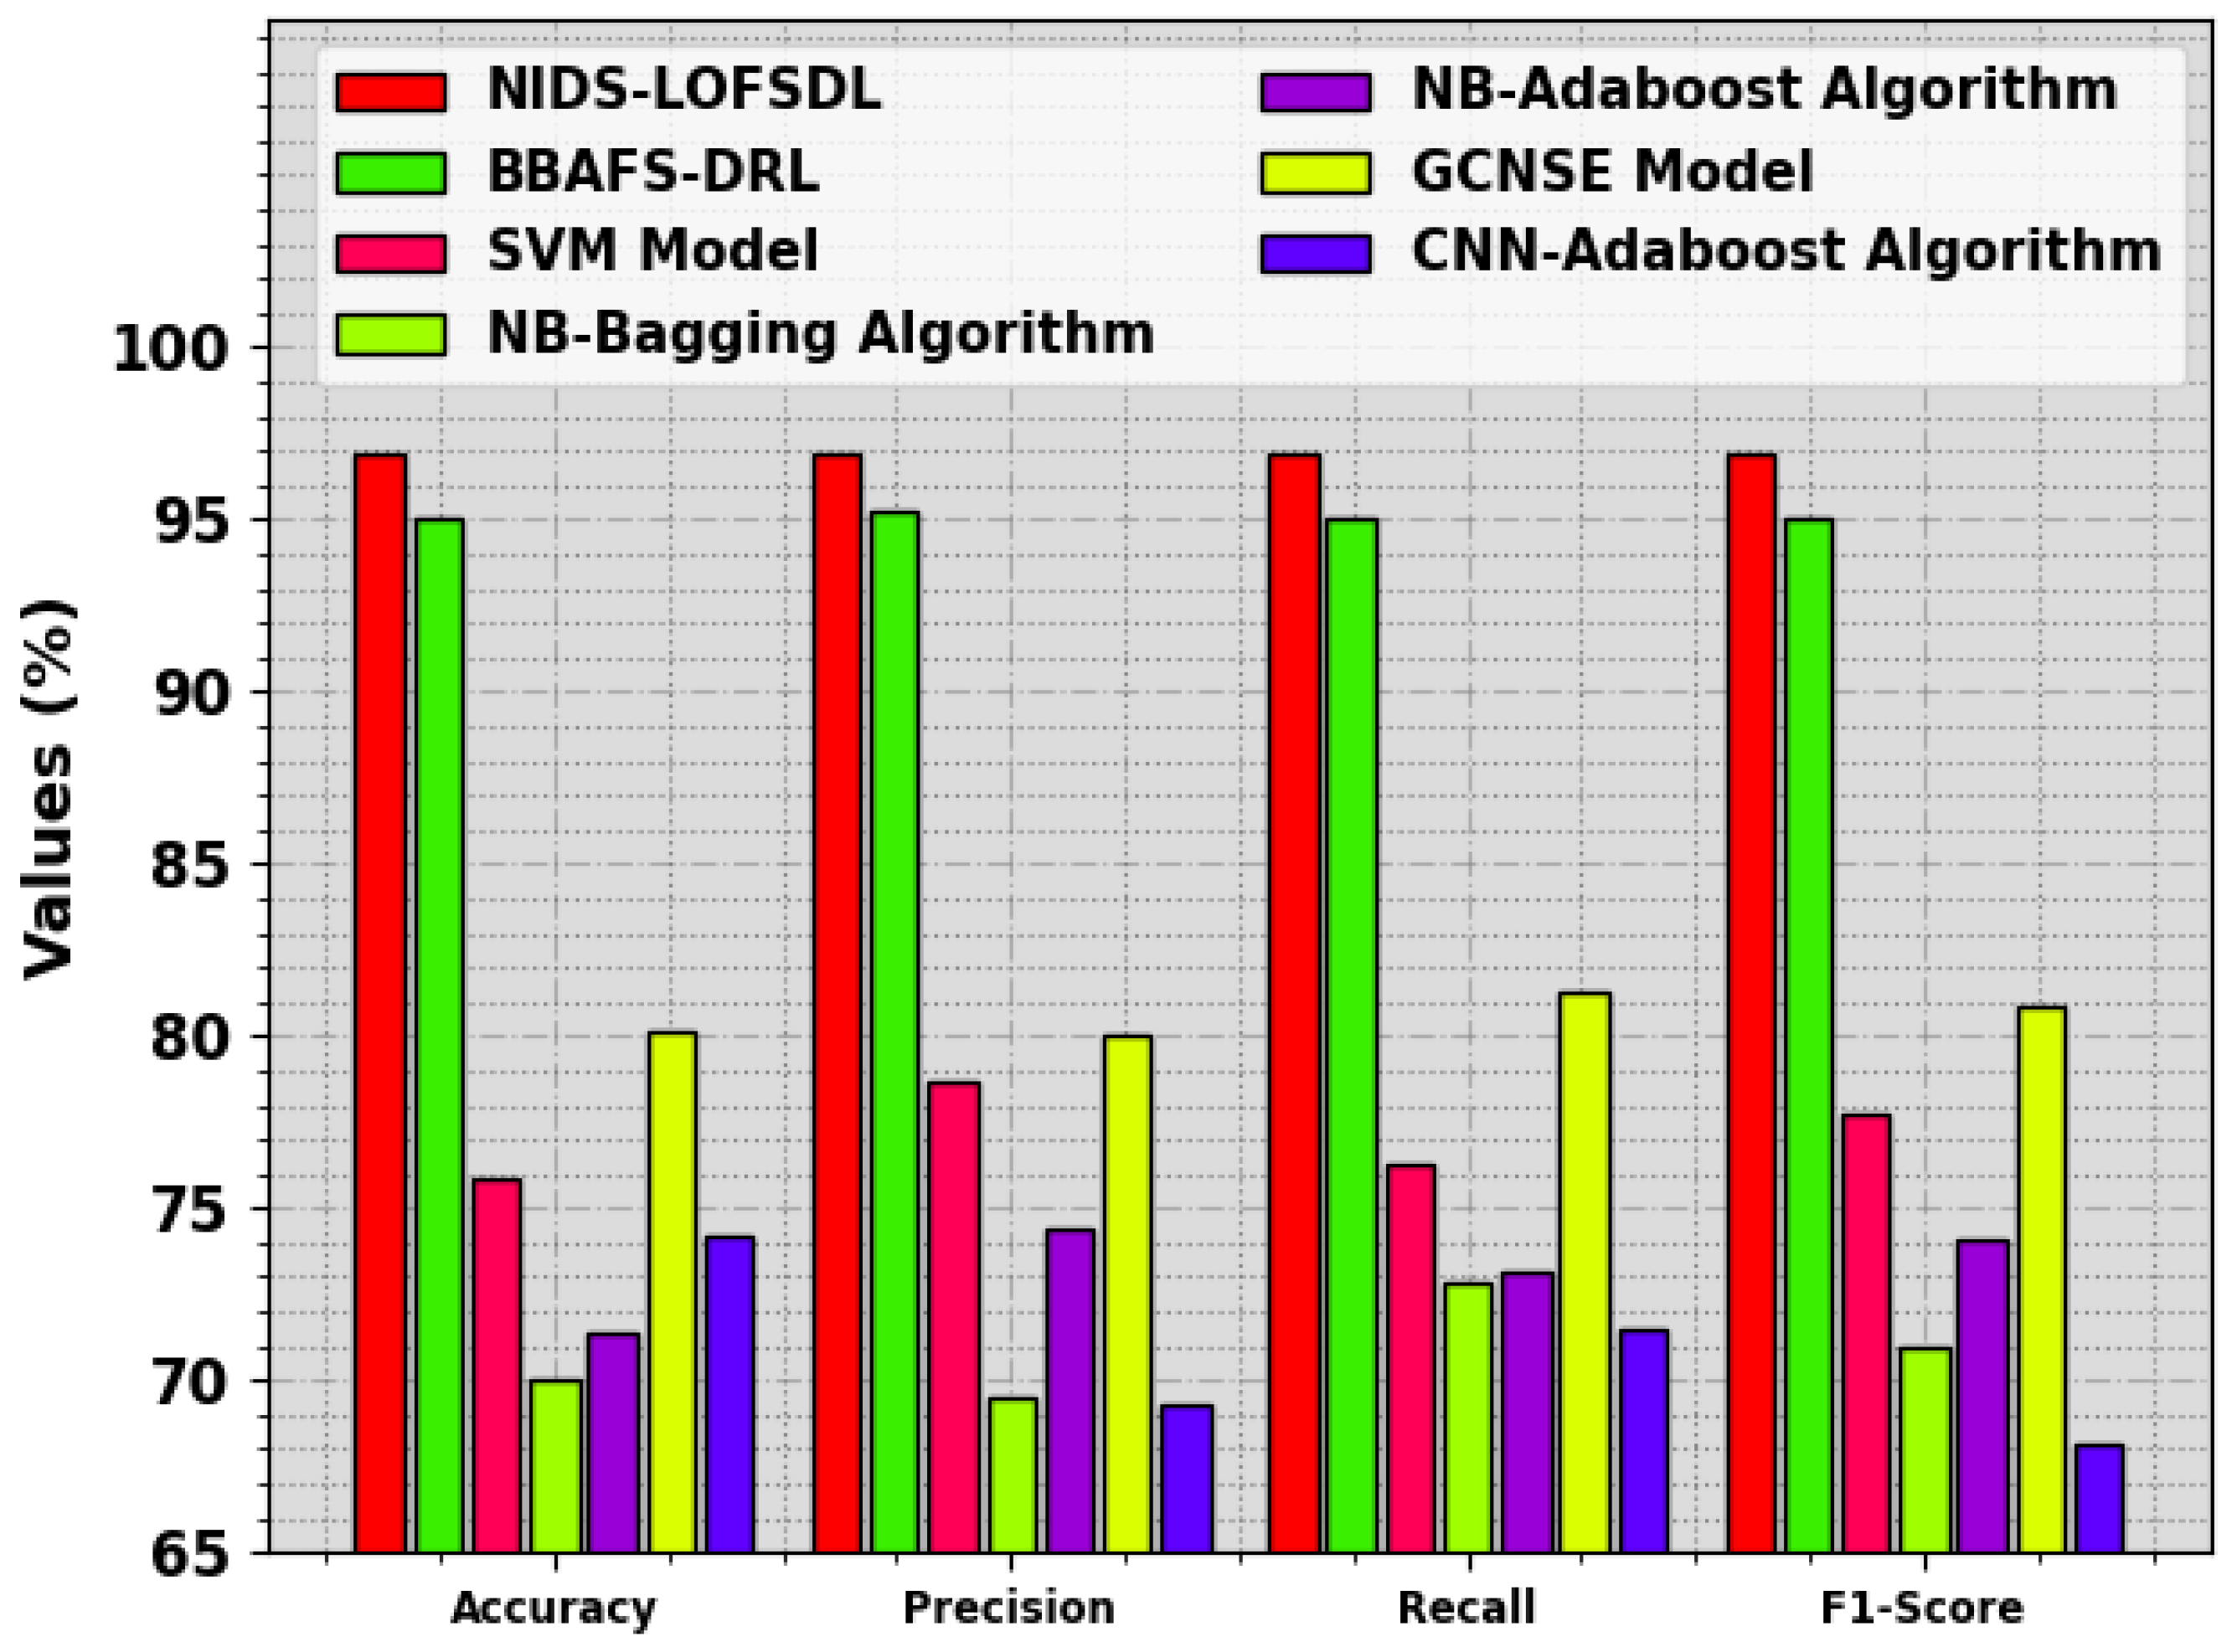
To ensure better results of the NIDS-LOFSDL technique, an extensive comparative analysis was conducted and the results are shown in
Table 4 and
Figure 11 [
24,
25]. The simulation values state that the SVM, NB-Bagging, NB-Adaboost, GCHSE, and CNN-Adaboost approaches achieved the worst performance. However, the BBAFS-DRL approach demonstrated a considerable performance with an
of 95.04%,
of 95.22%,
of 95.06%, and an
of 95.04%. Nevertheless, the NIDS-LOFSDL technique outperformed all other models with a maximum
of 96.92%,
of 96.92%,
of 96.92%, and an
of 96.92%. These outcomes confirm the effective performance of the NIDS-LOFSDL methodology on IDS.
5. Conclusions
In the current study, a novel NIDS-LOFSDL technique has been developed for the detection of intrusions so as to accomplish network security. The NIDS-LOFSDL technique follows the concept of FS with a hyperparameter-tuned DL model for intrusion recognition. For the purpose of FS, the NIDS-LOFSDL technique uses the LOFS technique, which helps in improving the classification outcomes. Besides this, the ABiLSTM model is also executed for intrusion detection. In order to enhance the intrusion detection results of the ABiLSTM methodology, GTO is deployed for hyperparameter tuning. For validating the enhanced solution of the NIDS-LOFSDL system upon intrusion detection, a comprehensive range of experiments was conducted. The simulation values establish the promising results of the NIDS-LOFSDL system compared to the recent state-of-the-art DL approaches, with an improved accuracy of 96.88% and 96.92% on UNSW-NB15 and AWID datasets, respectively. Future research works can extend the proposed model to accommodate the dynamic and evolving nature of network threats. Besides this, continuous adaptation and learning mechanisms within the model, such as online or semi-supervised learning, can also be incorporated to enhance the capability of intrusion detection patterns proficiently. Finally, the scalability issue of the NIDS-LOFSDL technique should be resolved in order to enable it to be deployed in large-scale environments with high-speed data streams.


