Abstract
Survival analysis models allow for predicting the probability of an event over time. The specificity of the survival analysis data includes the distribution of events over time and the proportion of classes. Late events are often rare and do not correspond to the main distribution and strongly affect the quality of the models and quality assessment. In this paper, we identify four cases of excessive sensitivity of survival analysis metrics and propose methods to overcome them. To set the equality of observation impacts, we adjust the weights of events based on target time and censoring indicator. According to the sensitivity of metrics, (area under Precision-Recall curve) is best suited for assessing the quality of survival models, and other metrics are used as loss functions. To evaluate the influence of the loss function, the model uses ones to select the size and hyperparameters of the ensemble. The experimental study included eight real medical datasets. The proposed modifications of (Integrated Brier Score) improved the quality of compared to the classical loss functions. In addition, in seven out of eight datasets, the with new loss functions outperforms the existing models of the scikit-survival library.
Keywords:
machine learning; survival analysis; Kaplan–Meier estimator; recursive partitioning; model averaging MSC:
62N02
1. Introduction
Models of event forecasting are important for describing the causes and effects of various phenomena and processes. Survival analysis is a set of methods for estimating the probability of occurrence of an event in time. The definition of an event varies depending on the application area.
For example, in the case of healthcare, the event is a fatal outcome, relapse, or recovery of the patient. Clinical data and anamnesis is used to predict disease history and prescribe treatment with minimal risks of negative consequences. In the case of reliability analysis, the event is a failure of the equipment. The history of the event allows for balancing the load or replacing individual components at an early stage to prevent the failure of the entire system.
Papers [1,2,3] emphasize the main features of survival analysis. The usage of incomplete data leads to the appearance of censored observations with an unknown time of the event (for example, the event does not occur before the end of the study). In this paper, we consider only right-censoring cases with a fixed beginning time and expect the event to the right. In addition, the distribution of events in time is important. There are several split criteria [4] with high sensitivity to early events and [5,6,7] late events. However, the models assume a constant sensitivity of events and do not take into account the event distribution of the source data.
Finally, the proportion of censored and terminal classes is the cause of bias in forecasting. The most popular approach to overcome the imbalance is data balancing (increasing the minor class or decreasing the dominant class). However, balancing leads to a bias of a priori probabilities of classes.
The influence of the highlighted characteristics applies not only to predictive models but also to quality metrics. In classic machine learning, metrics allow evaluation of the quality of models and are used as a loss function to solve optimization problems during model fitting. Finally, metrics influence the selection of the optimal model and its hyperparameters. Metrics of survival analysis cover the set of predicted values: point estimates (probability and time of occurrence of events) and integral estimates (history of occurrence of an event, cumulative risk in time).
The purpose of this work is to analyze the sensitivity of survival analysis metrics. We propose the classification of the sensitivity biases and modifications of metrics to overcome them. In addition, we explore the relationship between the loss function and the quality of the model. The model uses a loss function to select the size and hyperparameters of the ensemble. According to the analytical and experimental results, we define the best metrics as quality score and loss function. A critical analysis of the advantages and disadvantages of existing metrics allows us to assess the quality of models reliably and motivate researchers to conduct additional testing of the stability of metrics to data characteristics.
The paper is organized as follows: Section 2 presents an overview of survival analysis models and describes the motivation for choosing quality metrics for each type of predicted values. Section 4 describes the characteristics of open medical datasets, the presence of early and late events, and class imbalance. Section 3 describes the main steps of the sensitivity study. Section 5 classifies the causes of the excessive sensitivity of metrics and proposes relevant examples for their detection, such as the higher significance of particular events, metric changes over time, the significance of the time scale, and the influence of the imbalance of classes. In addition, we propose modified metrics to improve sustainability and select a reliable quality metric. Section 6 provides an experimental study of the relationship between modified loss functions and the quality of models. The result is the selection of the best loss functions for the expansion of the ensemble. Section 7 presents the main results of the work and directions for further research.
2. Background
2.1. Problem Statement
Let X denote a random vector of variables, T a non-negative random variable of event time, C a non-negative random variable of censoring time, and an event occurrence indicator. In this case, the target time, , of the event is:
Thus, the task is reduced to analyzing triplets for each observation, i, where and are the target variables. Using variable , the goal is to predict the true time, , which is hidden for censored observations.
To predict the history of the occurrence of an event, the task of survival analysis is reduced to three functions [2]. The survival function determines the probability of non-occurrence of an event after a certain time:
where t is the observation time and T is a random variable of the event time.
The death density function determines the probability of an event occurring at a specific time, :
The hazard function or the conditional failure rate represents the probability of an event at a particular time, t, given that the event did not occur earlier:
Depending on the task, the survival analysis functions can be formulated in a continuous and discrete form [2,8]. The continuous-time problem uses the entire time scale, and the observations correspond to the source event time, . Then, the survival analysis functions have the following form:
Usually, continuous-time models have strict assumptions about the time distribution and the differentiability of the survival function on the timeline.
In a discrete-time problem, the original timeline is split into n specified time intervals (bins). Let denote an ascending ordered set of time points, then the time points, T, of the sample are mapped to the set . Despite that the discrete-time problem requires fewer assumptions, it also leads to information loss due to time discretization. In addition, the number of time intervals is a hyperparameter that strongly affects the accuracy and computational complexity of the model. Finally, the discrete-time problem imposes a serious functional limitation on the allowable time points for forecasting. Further, we consider only continuous-time models.
2.2. Statistical Models
2.2.1. Kaplan–Meier Estimator
The most popular nonparametric estimation of the survival function is the Kaplan–Meier method [9]. Denote the set of source times of the event as . For each time point, , there are the number of remaining observations, , and the number of events, , that occurred at time . Then, the survival function at the moment of t is a cumulative product of survival probability for each previous time:
The expected lifetime is , so that . In practice, it also needs to predict the survival function before the first occurrence of the event and after the occurrence of the last event. There are two ways to expand Kaplan–Meier estimation. In the first case (henceforth, KM), the survival function is equal to the last cumulative product after all events. However, if the latest observation is censored, the survival function does not reach zero. In the second case (henceforth, KM10), the survival function assigns 0 after all events and 1 before the first event.
2.2.2. Cox Proportional Hazard
Nonparametric methods do not take into account the relationship between the signs of observations and target variables. At the same time, parametric methods assume a theoretical relationship and determine the significance of features based on their impact on the forecast.
The Cox Proportional Hazards (henceforth, CoxPH) [10] assumes that all observations have the same form of the hazard function and differ by a positive coefficient of proportionality.
where is the base hazard function, is the vector of features, and is the vector of linear model coefficients. The importance of features (hazard ratio) calculates as .
The survival function of CoxPH consists of basic survival function, (usually is the Breslow estimator [11]), that is shifted with the weights, :
However, the method has several significant disadvantages:
- The ratio of two hazard functions does not change over time;
- The significance of features does not depend on time. In real clinical practice, the influence of risk factors may vary over time. For example, the patient is at risk after surgery, but after rehabilitation is more stable;
- The weights of the model define a linear combination of the data features;
- CoxPH does not support categorical features and missing values.
2.3. Metrics
2.3.1. Concordance Index
The Concordance index () [12] is a ratio of correctly ordered pairs relative to the event time, which can be calculated as follows:
where is the true time of occurrence of the event, is the indicator function, and is the time expected by the model. The best metric value is 1 (correct ordering), the worst value is 0 (opposite order), and the value 0.5 reflects the randomness of the model response.
The metric uses only point forecasts and does not evaluate survival function as a whole. In addition, the value of does not change with the shift of the survival functions, although the predicted time itself may be extremely biased compared to the true one.
2.3.2. Integrated AUC
An alternative ranking metric is the integrated area under the curve () [13,14], which extends the calculation of the curve and area under the curve () to multi-class or temporary cases.
Denote the cumulative hazard as . There is the following relationship between cumulative hazard and hazard function:
For each event time, there are two sets of observations with early and late events. The metric measures the weighted proportion of right-ordered pairs (by cumulative hazard) of observations from different sets (occurred events should have a higher cumulative hazard at time t) and can be calculated as follows:
where is the cumulative hazard estimation of in time t and is the inverse probability of censoring in time (, where is the Kaplan–Meier model with censoring event).
Integrated aggregates over time with minimal value, , maximum value, , and general survival function, , as the Kaplan–Meier model.
2.3.3. Likelihood
In general, the likelihood function (henceforth, ) is the joint distribution of the sample, considered as a function of a parameter. Denote the describing parameter of the predictive model as . Therefore, the likelihood function of the sample is .
Based on the survival function, , and the hazard function, , paper [15] denotes the full likelihood as . To solve an optimization problem, the logarithmic form is:
In addition, paper [15] uses only the hazard function, , and denotes the partial likelihood as . In addition, the corresponding logarithmic form is:
2.3.4. Kullback–Leibler Divergence
Kullback–Leibler Divergence (henceforth, ) [16] measures the distance between continuous probability distributions P and Q. On the set , denote the density functions of the distributions P and Q as and , accordingly. Then, divergence is .
In survival analysis, paper [17] proposes a modification of divergence (henceforth, ). Let denote the estimation of the survival function on n observations. Based on the family of two-parameter Weibull survival functions, the true function is where and .
The main disadvantage of is the usage of the nonparametric to estimate proximity to the theoretical Weibull function, . In such a case, does not take into account individual features, , and a censoring indicator.
2.3.5. Integrated Brier Score
Integrated Brier score () [18] is based on the squared deviation of the predicted survival function from the true one. The true survival function equals 1 before the event time and 0 after. Denote the number of observations as N and the probability of censoring as the Kaplan–Meier model, , with the censoring event. To assess the quality of the forecast at the time t, the Brier score is:
where is the predicted survival function at time, t for observation with the true time . Then, for a fixed moment, t, and an observation, , if the event occurs before time t, we expect a low survival probability (close to 0). Otherwise, if the event occurs after the moment t, we expect a high survival probability (close to 1).
To score censored data, (4) uses the indicator and the probability of censoring. Squared deviations are weighted on the inverse probability: if the event occurs before time t, and if the event occurs after time t. Censored observations before time t are not taken into account. Integrated Brier score aggregates, , over time:
2.3.6. AUPRC
The Survival -AUPRC (henceforth, ) metric [19] measures the concentration of the distribution mass around the true time of the event. The idea is similar to the metric “area under Precision-Recall curve”, but compares distributions for one observation.
For a terminal event with true time and features , the metric is an average difference between early and late values of the survival function at different intervals (each determines the interval ):
Figure 1 shows an example of calculating for two terminal events of the dataset with the true times (left figure) and (right figure). The vertical red line highlights the true time moment, and blue vertical lines correspond to the level and reflect the compared values and .
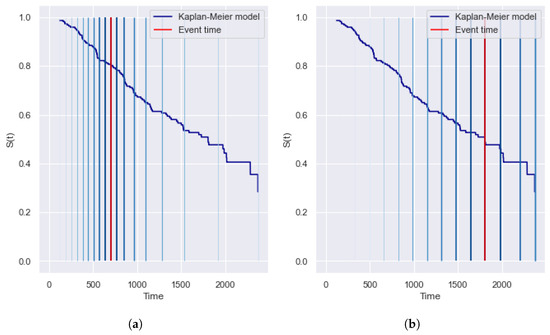
Figure 1.
Example of the (area under Precision-Recall curve) metric for two terminal observations of the dataset with the event times (a) and (b). The vertical red line highlights the true time moment, and the blue vertical lines correspond to the level. provides a symmetrical contribution of early and late intervals and covers the entire timeline. (a) True time is 698 ( = 0.38). (b) True time is 1807 ( = 0.42).
For censored observation with time and features , proposes zero survival probability after the event:
The best value of the metric is 1 when the survival function is a step-function that equals 1 before the event and 0 after. The smallest value is 0 if the survival function is a constant (in terminal events for any constant function and in censored observations only for constant 0). However, paper [19] presents only partial metric values and does not describe a method to aggregate the for multiple observations. In this paper, we propose to aggregate values by mean:
2.3.7. Motivation for Choosing a Metric
In this section, we summarize the properties of all considered metrics. Firstly, each metric estimates one of the predicted values: the expected event time, T (), the survival function, (, , and ), and the hazard function, ( and ). For a comprehensive assessment of the quality of forecasting, it is necessary to choose a metric for each of the variables.
Based on the comparison approach, metrics can be classified into ranking ( and compare relative values) and regression (, , , and compare absolute values) types. Based on the covering approach, metrics can be divided into point and integral types. Point metrics ( and ) use a single value to evaluate the quality. Integral metrics (, , , and ) compare the predicted survival and hazard function with the target function. Thus, integral metrics allow us to score the quality of functions over time.
Finally, all metrics except have the ability to differ in the processing of censored observations from terminal events. In particular, the uncertain behavior after censoring time leads to the false comparison of forecasting.
Thus, we recommend several metrics to assess the following quantities:
- 1.
- metric for estimating the time of the event T. For censored observations, considers only pairs that the second event occurred before the moment of censoring.
- 2.
- metric for estimating the hazard function, . Unlike the metric, evaluates the overall survival function.
- 3.
- and metrics for estimating the survival function, . Unlike , these metrics take into account censored observations. In addition, is limited by the nonparametric survival function, , which does not use the feature space of observations.
2.4. Machine Learning Models
Instead of classic parametric methods, tree-based approaches do not use strict theoretical assumptions (proportionality of hazards and definite distribution) and split the feature space into regions with a similar target variable.
Models applied in various tasks: classification, regression, and outlier detection. For each task, there is a criterion for splitting to calculate the proximity of the partitions by the values of the source features. In survival analysis, the most popular criteria are a statistical log-rank criterion (Section 2.4.1) and its modifications. Section 2.4.2 describes a method for constructing a binary survival tree.
To improve the quality of decision trees, there are ensemble algorithms. Decision trees are well suited as basic models, as they exactly describe the training sample. The random survival forest method (Section 2.4.3) is an ensemble of independent survival trees with log-rank criteria. The survival (Section 2.4.4) method uses more confident trees with modified log-rank and works with missing and categorical data.
The gradient boosting method [20] is an ensemble of models where each next algorithm fixes the errors of the previous model. Gradient Boosting uses only one target variable, but survival analysis has two variables with different types: the time of the event and the event indicator. Section 2.4.5 describes the Gradient Boosting method in terms of survival analysis and its component-wise modification (Section 2.4.6).
2.4.1. Log-Rank Criterion
To measure the differences between two survival functions, the most widespread criterion is log-rank [3]. A higher value of log-rank statistics determines a greater difference between survival functions. The null hypothesis of the criterion assumes that survival functions from two samples are equal. However, papers [1,3] suggest poor sensitivity of log-rank to the real data with early events. The log-rank criterion does not assume a relationship between the censoring indicator and the forecast, and the significance of events is the same at the early and late stages of the study.
There are many ways to increase the sensitivity of the criterion. For example, several weighted criteria [1,3,4] have a high significance of the contribution of early events. Criteria define the weights of log-rank statistics by the following schemes:
- 1.
- Wilcoxon weights are the number of remaining observations at the time.
- 2.
- Peto-peto weights are the value of the parent survival function at the time.
- 3.
- Tarone-ware weights are the square root of the number of observations at the time. Tarone-Ware is the “golden mean” among weighted criteria [1].
Fleming–Harrington [7] is a flexible criterion sensitive to a certain type of events. The criterion is based on the family of statistics with weights for each time . In particular, the criterion equals the log-rank (sensitivity to proportional risks), equals the peto-peto (sensitivity to early events), and is sensitive to late events [5]. According to article [7], weighted log-rank statistics are distorted in the case of strong censorship, and the reliability of weighted statistics seriously decreases when censorship increases. In addition, local sensitivity enhancement does not apply to all data, and it needs to use different directions for assessing the proximity of survival functions.
A comprehensive study [21] noticed that MaxCombo [5] is a universal criterion for assessing the proximity of survival functions (it shows the best results for 18 datasets). The MaxCombo criterion combines several weighted log-rank criteria to provide sensitivity for early and late events simultaneously. In particular, MaxCombo is defined as the maximum of the criteria and .
2.4.2. Survival Tree
A tree-like survival algorithm (ST) [22] recursively divides the sample into groups with different survival functions. The tree starts from the root node with full data. Using a log-rank criterion, the root node is divided into two child nodes, which are also divided. The process is repeated recursively for each subsequent node.
In the case of a binary tree, the splitting approach considers all possible intermediate values for each feature from the space X. For each intermediate point, the statistic value is calculated by target features T and from two branches of the partition. The best partition has the maximum value of statistics among all possible pairs of partitioning. For an observation with a feature vector x, the forecast of the survival function is Kaplan–Meier estimation for the associated leaf (end node) by the x feature.
The advantage of the method is a strong interpretation. Each leaf has a set of rules passing from the root to the leaf. Thus, if the depth of the tree is not too great, the expert can analyze the set of rules for consistency and correctness.
Nevertheless, the method has significant drawbacks. Firstly, a classical survival tree works only on filled data. Secondly, without any restrictions on the number of observations in a node, the survival tree has an addiction to overfitting. Finally, a tree needs a sufficient amount of data to reach a high quality. In the case of limited data, the decision tree model is often used as a basic “weak” model in ensembles.
2.4.3. Random Survival Forest
Random Forest is the most widely used method of ensembling. For survival analysis, Random Survival Forest (RSF) [23] is an ensemble of independent survival trees [22], aggregating their forecasts. The construction algorithm is:
- 1.
- Build N bootstrap samples (with replacement) from the source sample. Each bootstrap subsample excludes approximately 37% of the data, which is called out-of-bag (OOB);
- 2.
- Build a survival tree for each bootstrap sample [22]. Finding the best partition uses only P features at each node. The best partition maximizes the difference between child nodes;
- 3.
- Each survival tree is built until bootstrap sampling is exhausted. In other words, there are no restrictions on the depth and number of observations for trees.
The constructed ensemble evaluates the error of the model with (with ). For each observation with the feature vector x, the forecast is the average forecast over trees so that . Similarly, the forecast of the survival function is the average value for all tree forecasts in the ensemble for all time points. Averaging forecasts of trees allows us to improve quality and avoid overfitting.
2.4.4. Survival Bagging
In previous work [24], we developed a new model of survival tree that uses weighted log-rank criteria and has a high sensitivity to data characteristics. In particular, the model supports the following criteria: Peto-peto, Wilcoxon, and Tarone-ware. To predict the survival function, the model uses the following nonparametric estimators for each leaf: the Kaplan–Meier model (KM from the Section 2.2.1), expanded Kaplan–Meier model (KM10 from the Section 2.2.1).
The model handles categorical features using the weight of evidence (WOE) mapping method. To handle missing values, a set of observations with a missing feature are placed in turn in each branch of the partition. The final branch has the greatest statistical value. To reduce the computational complexity for continuous features, we use quantiles as splitting points (the number of quantiles is a hyperparameter).
In addition, we developed a Bagging model () as an ensemble of proposed survival trees. To select the optimal size of the ensemble, for each iteration we evaluated the OOB error with the following quality metrics (loss functions): , , and . Similar to RSF, the forecast of the survival function is the average forecast of the survival trees relative to each point in time.
Previously, we have not considered universal criteria and criteria with increased sensitivity to late events. In addition, it is necessary to study the impact of data characteristics on loss functions. Excessive sensitivity of metrics to early or late events influences the optimal size of the ensemble. In addition, it is necessary to investigate the stability of metrics to class imbalance.
2.4.5. Gradient Boosting Survival Analysis
The Gradient Boosting model [20] is based on iterative learning of each new decision tree on the errors of the previous one. The purpose of the algorithm is to minimize the loss function by the iterative counting of a gradient of prediction error. The forecast of gradient boosting is a weighted sum of all tree forecasts in the ensemble. The main advantages of the model are simplicity, versatility, flexibility to modifications, and high generalizing ability. Although the approach provides high-quality forecasting, the interpretability of the model is poor.
There are many difficulties of gradient boosting in survival analysis. In particular, Gradient Boosting uses only one target variable, but survival analysis has two variables with different types (the time of the event and the censoring indicator).
However, paper [25] proposes the Gradient Boosting Survival Analysis (GBSA) model with an expanded scope of applicability of classical Gradient Boosting to survival analysis tasks. GBSA predicts the probability of the event (where is the number of features) as the linear combination, , from CoxPH. An ensemble of regression decision trees is used to describe . As a loss function, GBSA uses a modification of the likelihood function, taking into account the assumption of proportional hazards:
Based on the forecast of , the forecasts of functions are:
where and are the cumulative hazard and survival function from the CoxPH model.
Thus, GBSA reduces survival tasks to the regression problem of predicting the point value of . To predict the survival and hazard function, GBSA extends the point value using a nonparametric model and inherits the limitations of the CoxPH assumption.
2.4.6. Component-Wise Gradient Boosting
Article [26] provides an overview of the existing methods of Component-wise Gradient Boosting (CWGBSA). Instead of basic algorithms fitting on the entire feature space, X, component-wise boosting uses only one variable for fitting. This approach is also called likelihood-based boosting since the ensemble maximizes the overall probability at each iteration by choosing the underlying algorithm that leads to the greatest increase in probability.
In survival analysis, the goal of CWGBSA is to optimize the loss function with respect to linear coefficients, , of the CoxPH model. The gradient of the loss functions is calculated by the weights, . In this case, each loss function should be expressed in terms of the weights of the CoxPH model (which additionally requires a hazard proportionality condition).
The model response is . Function constructs according to formulas (1) and (2) of the CoxPH model. According to study [26], CWGBSA with outperforms alternative approaches, where the base learner is the least squares method. Thus, the survival and hazard forecasts of CWGBSA are based on a nonparametric model and a point estimation of the probability of an event. To obtain point estimation, an ensemble of linear models iteratively finds optimal coefficients, , of the CoxPH model. In that case, the model inherits the limitations of the CoxPH assumption.
2.5. Summary
Based on the review of the metrics of the survival analysis, we emphasize the following conclusions. To assess the predicted event time, we recommend using the concordance index, which equals the ratio of correctly ordered pairs of events in time. To assess the predicted survival and hazard functions, we consider point and integral metrics. Point metrics use a single value of the forecast and reduce the survival task to a classical regression problem, taking into account the censoring flag. Integral metrics compare the predicted and theoretical functions for all time points. In Section 2.3.7, we recommend using metrics , and as the most promising. In addition, we have not found studies on the sensitivity of metrics to data characteristics.
Based on the review of survival analysis models, we emphasize the following conclusions. The Kaplan–Meier method is applied to the continuous time problem and has no restrictions on the time distribution. However, the KM method does not describe the relationship between the feature space and target variables. The classic Cox proportional hazards model has a strict assumption that leads to several disadvantages: independence of the significance of features in time, linearity of the model, inapplicability to categorical features, and missing values.
The survival tree model uses the log-rank criterion in order to find the best partition. However, the log-rank criterion has poor sensitivity to the characteristics of real data [1,3]. Ensembles of independent (Random Forest) and dependent (GBSA, CWGBSA) models are used to increase the accuracy of forecasting survival trees. The limitations of the Random Forest model follow from the base survival models. The gradient boosting model solves a classical regression problem by extending the point estimate using CoxPH. The most popular metrics of the boosting model are modification of likelihood with the assumption of proportional hazards (GBSA) and Brier score (CWGBSA).
3. Methodology
The formulated conclusions from Section 2 are the justification for the directions of further research. Figure 2 presents the scheme of the main steps of the sensitivity study. First, we consider the most popular open-source datasets and highlight the following characteristics of the data (Section 4): the concentration of events over time (early and late events) and class imbalance. The excessive sensitivity of models or metrics can negatively affect the quality of models and resistance to new data.
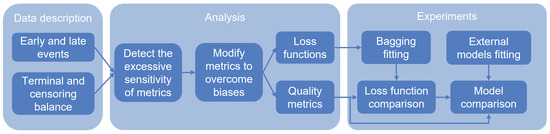
Figure 2.
Scheme of the steps of the proposed algorithm. The first step is to highlight the characteristics of events for datasets. The second step is to investigate the sensitivity of metrics to these characteristics and check for equality between events. In the case of inequality, we modify the metrics. Metrics are compared with each other and divided into groups: quality metrics and loss functions. Finally, we evaluate the impact of modified metrics on the quality and compare models.
With high sensitivity to early events, the penalty for an error at early events exceeds the late event penalty. Thus, to optimize the loss function, it is profitable to understate the survival function to minimize the late error of an early event. In addition, an increased concentration of early events tends to decrease a survival function close to constant 0. With high sensitivity to late events, models tend to overstate the survival function. With a high concentration of late events, the survival function tends to be constant 1.
Later, we analyze existing metrics to detect the excessive sensitivity to described characteristics (Section 5). As we show below, the following cases distort the true quality of the forecast: the different significance of the contribution of events, increasing the contribution of late time, the influence of time scale, and a small contribution of terminal events in the case of an imbalance of censored observations. We present examples of the biases and propose modifications of metrics. To summarize the results of the analysis, we compare the metrics to each other based on their properties and resistance to biases. The most stable metrics are used to score the quality of the models, and others are used as the loss function.
At the experiments stage (Section 6), we use the previously proposed Survival (Section 2.4.4) and the following external models: Cox Proportional Hazard (Section 2.2.2), Survival Tree (Section 2.4.2), Random Survival Forest (Section 2.4.3), Gradient Boosting Survival Analysis (Section 2.4.5), Component-wise Gradient Boosting (Section 2.4.6). Only the model is able to use the loss function in model fitting. To compare the influence of loss functions, considers them as hyperparameters. Based on experimental results, we provide a model comparison and a loss function comparison.
In addition, we visualize how modified metrics affect the choice of the best model. In the case of the leaf model hyperparameter, modified metrics allow for achieving better quality for the expanded Kaplan–Meier model (KM10).
4. Real Data Description
This section describes the most popular datasets in survival analysis. To provide a comprehensive analytical and experimental study, we consider eight datasets with different properties and characteristics. The SurvSet [27] library allows us to obtain files of the following datasets. In addition, we notice source links for each dataset.
The German Breast Cancer Study Group () dataset, collected from 1984 to 1989, was presented in [28]. The dataset event is cancer relapse. The dataset contains 686 observations and 8 features according to anamnesis, tumor description, and treatment strategy. There are three categorical features: htreat, menostat, and tumgrad. The dataset does not contain missing values. During the study, 387 patients were censored.
The Cohort study on the breast cancer dataset from the Netherlands () was presented in [29]. The dataset event is the relapse of cancer. The dataset contains 2982 observations and 11 features according to anamnesis, tumor description, and treatment strategy. There are six categorical features: meno, tsize, grade, hormone, chemo, and recent. The dataset does not contain any missing values. During the study, 1710 patients were censored.
The Study to Understand Prognoses and Preferences for Outcomes and Risks of Treatments () [30] dataset describes incurable patients using life support devices. The dataset event is death. The dataset contains 9105 observations and 35 features according to anamnesis, the class of the patient’s disease, the severity of physiological abnormalities, and concomitant diseases. There are 11 categorical features: sex, dzgroup, dzclass, num_co, race, diabetes, dementia, ca, dnr, sfdm2, income. In addition, 21 features contain missing values, where the maximum number of missing values is 5641 for the ADL feature. During the study, 2904 patients were censored.
The dataset, collected from January 10 to 18 February 2020, was presented in [31]. The dataset event is the patient’s discharge. The dataset contains 375 observations and 76 features according to anamnesis and the results of clinical studies during treatment. The feature space is formed from the minimum, maximum, and average indicators of the patient’s clinical trials. All features contain missing values, where the maximum number of missing values is 173 for the indicators of antithrombin and fibrin breakdown products. During the study, 174 patients were censored.
The Primary Biliary Cirrhosis () dataset, collected from 1974 to 1984, was presented in [32]. The dataset event is death. The dataset contains 276 observations and 17 features according to anamnesis, cirrhosis status, treatment strategy, and clinical indicators. There are five categorical features: trt, sex, ascites, hepato, and spiders. In addition, 12 features of the dataset contain missing values (in particular, treatment strategies and clinical indicators), where the maximum number of missing values is 134 for the cholesterol index and 136 for the triglyceride index. During the study, 263 patients were censored.
The Second Manifestations of ARTerial Disease () [33] dataset is a sample from a study of patients hospitalized with clinically manifest atherosclerotic vascular disease or pronounced hazard factors for atherosclerosis. The dataset event is death. The dataset contains 3873 observations and 26 features of anamnesis, clinical indicators, and markers of atherosclerosis. There are nine categorical features: sex, diabetes, cerebral, aaa, periph, stenosis, albumin, smoking, and alcohol. In addition, 16 features contain missing values, where the maximum number of missing values is 1499 for diastolic by hand and 1498 for systolic by hand. During the study, 3413 patients were censored.
The AIDS Clinical Trials Group Study () [34] dataset is a sample from a study comparing two sets of drugs in HIV-infected patients. The dataset event is the diagnosis of AIDS or death. The dataset contains 1151 observations and 11 features according to anamnesis, clinical indicators, and treatment strategy. There are seven categorical features: tx, txgrp, strat2, sex, raceth, ivdrug, hemophil. The dataset does not contain any missing values. During the study, 1055 patients were censored.
The Assay of Serum Free Light Chain () [35] dataset is a sample of Olmsted County residents from a study of the relationship between serum-free light chains (FLC) and mortality. The dataset event is the death of a patient. The dataset contains 7874 observations and 11 features according to anamnesis, clinical blood analysis, and the presence of monoclonal gammopathy. There are four categorical features: sex, chapter, sample_yr, and mgus. Only one feature (creatinine) contains 1350 missing values. During the study, 5705 patients were censored.
Figure 3 and Figure 4 show the event time density for each of the considered datasets. Brief statistics for all datasets are shown in Table 1. The column “N” contains the number of observations, and the column “feat” contains the number of features. The percentage of terminal events is presented in column “Event”. The number of features with possible missing values is presented in column “NaN (feat)”.
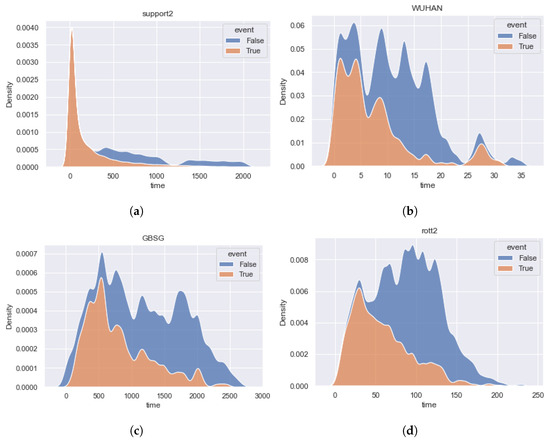
Figure 3.
The time densities of terminal events and censored observations of the datasets , , , and . Datasets contain predominant early events. (a) [30]. (b) [31]. (c) [28]. (d) [29].
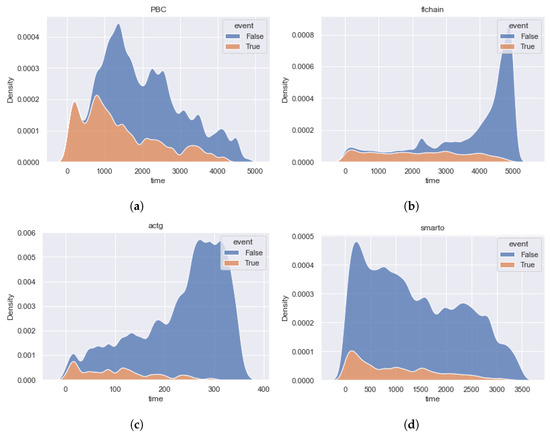
Figure 4.
The time densities of terminal events and censored observations of the datasets , , , and . The distributions of terminal and censored observations are very different for and data. Datasets do not contain the predominant interval of events. (a) [32]. (b) [35]. (c) [34]. (d) [33].

Table 1.
Description of considered datasets. The datasets follow in descending order the percentage of terminal events.
Based on the described open datasets and figures of the time density, we highlight the following characteristics of the datasets:
- 1.
- Early events have the highest significance for the dataset because the data describes the incurable patients using life support devices. The imbalance of event classes is biased toward terminal events.
- 2.
- The , , , and datasets are balanced relative to the event classes, and the early and middle events have the greatest importance.
- 3.
- The , , and datasets have a high imbalance of censored events and are uniform for the importance of event time contribution. It is important to note that for and datasets, the distribution of censoring time differs from the distribution of event time in the direction of increasing the importance of late events. The shapes of the dataset density functions are close.
5. Analysis of Biases in the Sensitivity of Metrics
In Section 2.3.7, we have described the primary motivation for choosing existing metrics to estimate survival forecasts. For a comprehensive study of the sensitivity of quality metrics, in this section, we consider the following characteristics and biases of chosen metrics:
- 1.
- The significance of the contribution of partial events (Section 5.1). The metric may have an implicit relationship between the contribution of events and its true time, which affects the reliability of the estimation. For example, the increased impact of late events is not suitable for data with dominant early events.
- 2.
- Dependence of integral metrics in time (Section 5.2). Integrated metric values may have a latent dependence on the timeline. In this case, the increased importance of a certain time period is not suitable for different data.
- 3.
- The influence of time variable in the integral metric (Section 5.3). The integrated variable directly affects aggregation over time and can lead to distortion of the significance of a certain period of time.
- 4.
- Resistance to the imbalance of censored observations (Section 5.4). The dominance of censoring can lead to false overstatement or understatement of the metric.
Later, we will reveal these biases for integrated metrics of survival analysis. To overcome the excessive sensitivity, we will adjust the weighting scheme of observation contributions. Finally, we will select the best metric for quality assessment and use other metrics as loss functions of the model. Comparing loss functions, we will assess the impact of biased and unbiased metrics on model quality.
5.1. The Significance of the Contribution of Partial Events
In this section, we investigate the metrics , , and for the presence of dependence on the contribution of partial events. To check the dependence, we visualize the metric values for each observation relative to the event time. To ensure equal conditions for early and late events, we consider the constant forecast of the survival function as . Using constant forecasts as one or zero, the quality of the events would be different. The main requirement for verification is the ability to represent the metric as an aggregation of values for each observation.
5.1.1. IBS
We present an alternative form of (5). In particular, we transfer the integration operation for each iteration of summation. Since the sum and the constant N do not depend on the observation time, the formula has the following form:
Reveal the value of the integral for each of the conditions:
Then, can be represented as the sum of partial for each observation, i, with the corresponding event time, , features, , and the censoring indicator, :
An alternative form of the metric is the average of the partial for each of the sample observations. The final form of allows us to calculate the metric value for each observation:
The first biased sensitivity of is a growth of the values relative to the event time. For example, we consider as a constant survival function for each observation. The left side of Figure 5 shows the values of for each observation of dataset. The x-axis corresponds to the event time and the y-axis corresponds to the value of the partial . The color of the dots determines the type of event: blue dots define censored events and orange dots define terminal events. Based on the left-hand figure, we notice that increases during the growth of the event time. Consequently, late observations make a greater contribution in the metric (7).
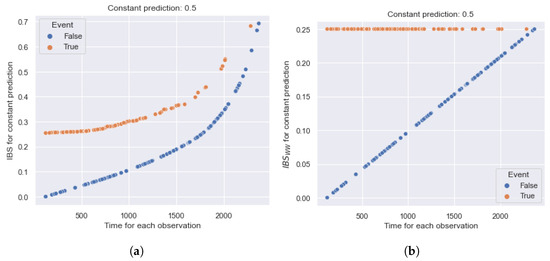
Figure 5.
Example of the relationship between partial (Integrated Brier Score) and values for each observation of the dataset relative to the event time. increases depending on the event time and has a greater contribution to late observations. is constant over time (for terminal events) and determines equal contributions. (a) . (b) .
Bias appears due to the monotonically increasing weight scheme, . The weight of the contribution depends on the time before the event occurrence and after the event is equal to the constant . Consequently, increasing the event time, the weights of deviations and their aggregation also increase. The logic is contrary to other studies, according to which weighted log-rank criteria are highly sensitive to early events. In addition, terminal and censored observations determine two curves, so the censored curve is located below. This effect is due to the censored containing only up deviations to the moment of censorship.
To overcome this disadvantage of the original , we propose the metric without a weighting scheme (assuming ). Thus, the value of the metric has the following form:
The right side of Figure 5 shows the values of for each observation of . The figure notations are equivalent to the left side of Figure 5. According to the figure, the metric value for terminal events equals the constant 0.25 and eliminates an increasing dependence on the true time. We see persistent linear dependence for censored observations because of the sum of early deviations, where the highest value is 0.25 (in the case of the latest censoring observation).
Thus, the inverse weighting scheme gives excessive sensitivity to late observations, even in the case of a constant forecast. With the transition from the weighting scheme to the constant contribution of deviations, the increasing dependence disappears. An alternative disadvantage of the weights is the dependence of the metric on the estimation of the general survival function for censored observations, . Consequently, the estimation of the global survival function changes with the growth of data, leading to a bias of the previous values of the metric.
5.1.2. IAUC
The metric (3) does not have a representation in terms of partial , which depends on the forecast for only one object, i. The reason for this is the ranking type of metric. In particular, the construction of a partial score uses only one pair of the true and predicted hazard functions, but is based on a comparison of different hazard functions for pairs of observations.
5.1.3. AUPRC
The metric (6) already has a partial form. Figure 6 shows an example of the dependence of on the true observation time for the constant forecast, , of . All notations are the same as those in Figure 5. Note that the minimum value for censored observations is 0.5.
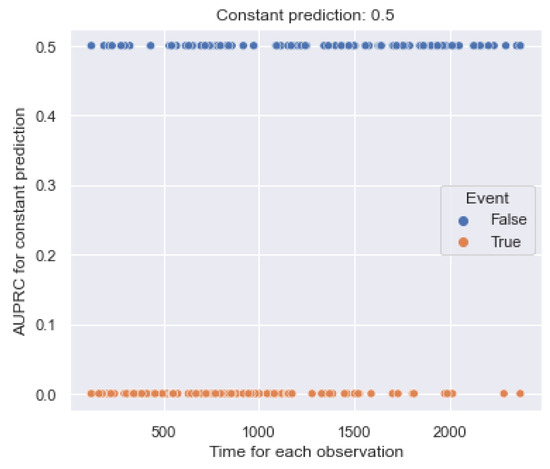
Figure 6.
Example of the relationship between values and the event time for each observation of the dataset. is constant over time and determines equal contributions.
According to the figure, the metric value for terminal events equals the constant 0.0 and does not determine an increasing dependence on the true time. For censored observations, the metric equals the constant 0.5 and also does not assume increasing dependence. Thus, the metric does not have false sensitivity to partial observations.
5.2. Dependence of Integral Metrics in Time
In this section, we check the dependence of the time-based components , , and over time. Later, integrated metrics will use the components to aggregate the scores for each moment of the timeline.
5.2.1. IBS
Calculating time-dependent metrics, (4) and (8), averages the deviations of all observations for each time, t (the total number of observations is N).
As noted earlier, we consider the constant survival function, , in time. Figure 7 shows the trend of quadratic deviations over time. The x-axis corresponds to the bins of the timeline, and the y-axis corresponds to the time-based values. The blue line refers to the values. The highest values of the metric are reached in the time interval from 1500 to 2000. Consequently, early observations (occurring before the 1000th moment) have a smaller contribution to the integral value of . The reason for excessive sensitivity is the weight, , which increases the contribution of deviations of late events.
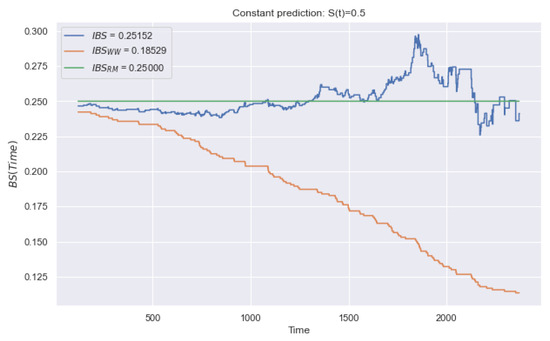
Figure 7.
Example of trend over time for a constant forecast of . The blue line relates to , the orange line to , and the green line to . Metrics and change over time and have false sensitivity. We propose , which determines equal contributions.
The orange line refers to and monotonically decreases in time. Therefore, early observations have a greater contribution to the integral value of . According to the (8), the contribution equals 0 after the censoring time. In general, the deviation after censoring is indefinite (due to the absence of the true time of the event). At the averaging stage, the zero deviation makes a false contribution, assuming the high quality of forecasting, .
To overcome the problems of the and metrics, we propose a metric with controlled averaging of observed events by time, t. In this case, the constant of the total number of events, N, is replaced by the variable . Therefore, the following modification does not take into account the contribution of observations after the moment of censoring:
In Figure 7, the green line relates to the (10). Thus, the metric does not have false sensitivity, such as the contribution of each time is 0.25. It is important to note that the study (Section 5.1) of partial assumes (for one observation). Consequently, this characteristic of time sensitivity affects only a set of observations. In the case of partial observations .
Thus, the weighting scheme, , and the averaging approach of all deviations lead to excessive sensitivity to late and early events, respectively. Using a modification of controlled averaging, false sensitivity disappears.
5.2.2. IAUC
Similarly, we consider the behavior of the metric over time (Figure 8). Evaluating the cumulative hazard function, we use the following transformation: . For a constant function, , we set . Based on the figure, we conclude that the metric does not have false sensitivity in time.
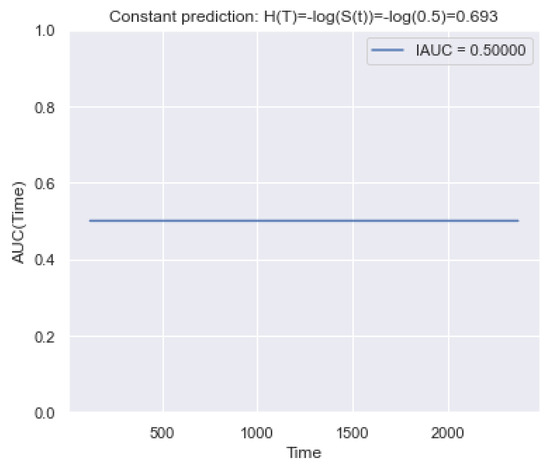
Figure 8.
Example of the trend of over time for a constant forecast of . It is seen that determines an equal contribution in time.
5.2.3. AUPRC
Figure 9 shows an example of changing the metric in time for a constant function, , of . Based on the figure, the metric does not have false sensitivity in time.
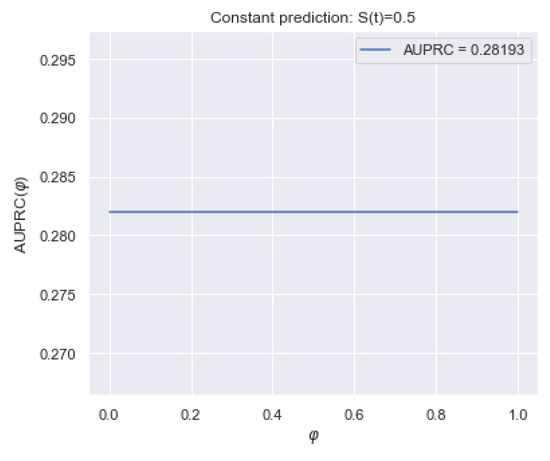
Figure 9.
Example of trend over time for a constant forecast of on dataset. It is seen that determines equal contributions.
5.3. The Influence of the Integration Variable
In Section 5.2, we considered the sensitivity of the time-based values relative to the time, t. Further, before obtaining the integral values, it is necessary to investigate the sensitivity of the variable of integration in time.
For integrated metrics (, , ), we aggregate quality for all time points by calculating the integral on a timeline. In practice, a timeline can be set by the user to predict the function at a certain time. In this paper, the timeline is the set of times between the occurrence of the first and last event of the training sample (hereafter, we denote the set of bins as ).
Integrating with this set of bins leads to an equal contribution of in time. In terms of the metrics (, , ), the integral is calculated directly from the time, t, and has an equal contribution each time. Similarly, integrating over the variable , determines the equal contribution.
For the metric (Section 2.3.2), there are several defining sets of differentials to calculate the integral. In particular, papers [13,14,36,37] present weight schemes with the general formula . At the same time, papers [14,36,37] assume weights as the density function, . Hence, , where is the KM estimation (Section 2.2.1). Paper [13] considers the weight scheme as . Hence, , where is the KM estimation.
Figure 10 shows a behavior of different weights in time, , for the and datasets. The green line relates to weighing with an equal contribution (used in ). The blue line relates to the weighted scheme , and the orange line to scheme (used in ).
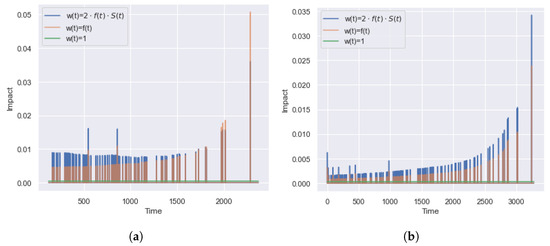
Figure 10.
Example of the dependence of the contribution of on time for and datasets. There are three weight schemes: , , and . Only a constant weighting scheme provides equal contributions of bins. Other schemes increase over time and have false sensitivity to later bins. (a) . (b) .
Both weight schemes have similar behavior and have two drawbacks. Firstly, some of the time points do not affect the value of the integral metric. The presence of a zero contribution is due to the equality of the survival functions for the start, , and the end, (so that ), points of the interval so . According to the KM estimation, it happens if there are no observed events in the interval . In this case, censoring observations in the range changes the value, which does not affect the integral metric, .
The second disadvantage is the increased significance of for late time points. According to the dataset densities (Figure 3 and Figure 4), the datasets and contain predominant early events, and most of the events have happened by the time . However, Figure 10 shows the higher importance of ranking quality for late time points. To overcome the disadvantages of , we recommend using the unit weight scheme .
Thus, the metrics and have equal contributions over time (without false sensitivity). At the same time, both weight schemes of lead to the excessive contributions of late times and ignore values at the moments of non-occurrence of terminal events (they do not take into account the fact of censoring).
5.4. The Impact of the Imbalance
In practice, real datasets have a different ratio of censored and terminal events. For a terminal event, the best survival function is a threshold function that equals 1 before the event and 0 after. For censored observation, the quality of the survival function is certain only before the moment of censoring .
5.4.1. IBS
According to (5), the best survival function for censored observation equals 1 until the moment of censoring and has an arbitrary value after. Therefore, for censored observations, the smallest value of is reached by a constant forecast, . The deviation before and after moment are considered for terminal events. Therefore, for the same forecast, , it is true that .
To demonstrate the sensitivity of to class imbalance, we present an alternative form of (5). In particular, we represent the metric as the sum of deviations for each type of event, , where is the proportion of deviations of terminal events and is the proportion of deviations of censored observations:
Therefore, has the following form:
For data with the domination of censored observations, , the optimal forecast, , is shifting to 1 and providing a smaller error for the dominant censored observations.
The left side of Figure 11 shows a change of for the dataset with a high imbalance of classes ( of terminal events and of censored observations). The dotted and dashed lines define values only for censored and terminal events, respectively. The solid line defines the total value of (sum of values). Based on the figure, there is an understating of the significance of the error of terminal events, and the curve, , is close to . Consequently, deviations of censored observations have a higher impact on the metric. In this case, changing the deviations for terminal events does not lead to significant changes to the metric.
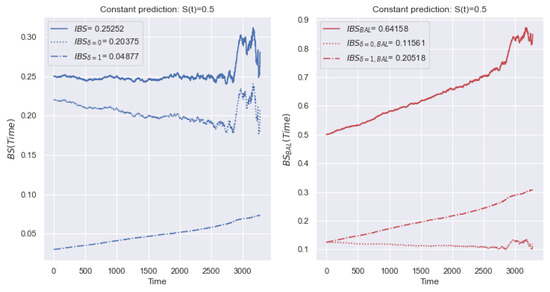
Figure 11.
Example of the behavior of and metrics over time with a constant forecast of for the dataset. Due to the imbalance, there is an understating of the significance of the error of terminal events, and the curve, , is close to . Blue lines present values (event, censoring, and total) with the source proportionality of classes. Red lines present values (event, censoring, and total) with an equal ratio of classes.
In addition, we consider an example for other data. The left side of Figure 12 shows a change of for the dataset, with a small class imbalance ( of terminal events, of censored observations). The notation is equivalent to Figure 11. There is no dominance of the contribution of a certain type of event. In this case, deviations for both types of event have a significant impact on the value of the metric.
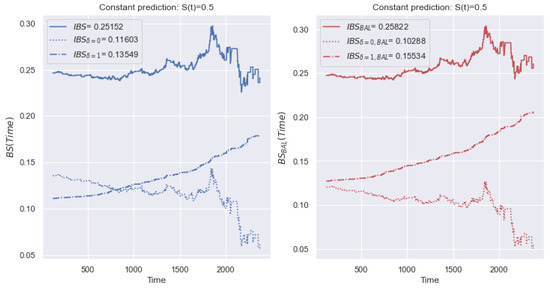
Figure 12.
Example of the behavior of and metrics over time with a constant forecast of for the dataset. The right figure shows the proposed metric, which is resistant to class imbalance. The metric values are close since the dataset is balanced relative to the event types.
To overcome the disadvantage of the different contributions of event types, we propose establishing an equal contribution of the deviations of censored and terminal events to the value of . In (12), we replace the total number of events, N, by the number of terminal events, . Similarly, in (13), we replace N with the number of censored events, . Thus, the value of the metric is defined as a balanced average relative to two types of event, and the metric is defined similarly to (5):
Note that the metrics , and can be defined for the previously described modifications, and , similarly.
The right side of Figure 11 shows a change of the metric for the dataset. Compared to the metric in the left-hand figure, the contribution of deviations of the terminal and censored events equally affects the values of . The right side of Figure 12 shows a change of the metric for the dataset. The values of the metrics are close, and the contribution of deviations of terminal and censored events significantly affects the values of and .
Thus, with an imbalance of a certain type of observation, the average deviation shifts towards the prevailing class. Using a balanced modification of , we overcome excessive sensitivity to the prevailing class.
5.4.2. AUPRC
Similarly, we conduct reasoning for the metric. The left side of Figure 13 shows a change of for the dataset. Unlike the metric, the final metric is the average of two values. The other notifications repeat Figure 11. There is an understating of the significance of the terminal events, and the curve is close to . Consequently, deviations of censored observations contribute more to the metric .
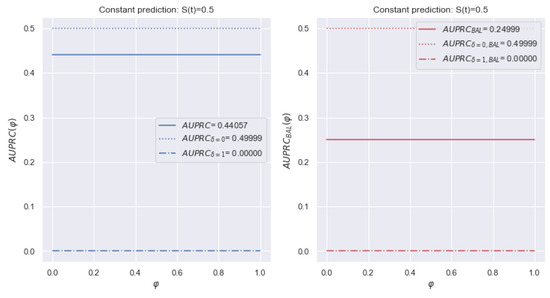
Figure 13.
Example of a change of metric over time for dataset with a constant forecast of . The left figure shows the total value of the metric is shifted toward the dominant class of censored events. The modification determines an equal ratio of the contributions.
The left side of Figure 14 shows a change of for the dataset. Unlike the metric, the final metric is the average of two values. The other notifications repeat Figure 12. There is no dominance of a certain class of events.
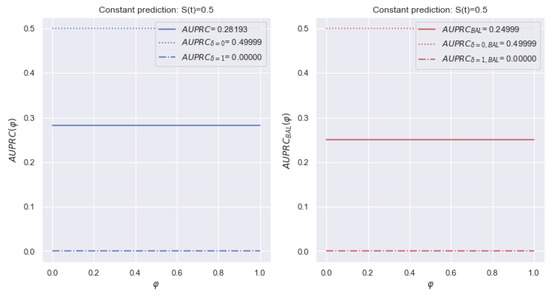
Figure 14.
Example of a change of over time for a dataset with a constant forecast of . and are close since is balanced relative to the event types. In addition, determines an equal ratio of the contributions.
Therefore, to increase the stability of , we propose the following balanced modification (similar to the (15) metric):
5.4.3. IAUC
Among the discussed metrics (Section 2.3.7), is resistant to imbalance. In papers [38,39], the authors advise using in the case of unbalanced data. In addition, papers [40,41] noticed that is invariant for a priori probabilities of classes. In survival analysis, and the integral value have similar properties.
5.5. Summary
In this section, we studied the sensitivity of existing integral metrics of survival analysis to score the hazard and the survival function. In the course of the study, we considered four different cases of metric excessive sensitivity involving false sensitivity to early events, late events, and class imbalance. To overcome the revealed biases, we have proposed several modifications to existing metrics.
Based on the conducted research (Section 5.1,Section 5.2,Section 5.3,Section 5.4), there is a summary, Table 2, that shows the properties of all integral metrics and their modifications. In addition, the summary table shows which metrics use the general survival function . In practice, the calculation and usage of requires additional data and computing resources. Also, the estimation of the survival function changes with the growth of data, leading to a distortion of the previous values of the metric.
Table 2.
The sensitivity properties of integral metrics. The column names are the numbers of the sections with studied excessive sensitivity: Section 5.1—the significance of the contribution of partial events, Section 5.2—the dependence of integral metrics in time, Section 5.3—the influence of the integration variable, Section 5.4—the impact of the imbalance. The column “” reflects the dependence of the metric on the theoretical general survival function. The cells indicate the presence of certain bias:“-”—stable, “+”—excessive, “?”—no information. The best metrics are grayed out.
A better metric should have fewer biases. We highlight the stability of metrics to the considered bias as “-”. Unknown verification or lack of information are highlighted as “?”. For example, for the family, we cannot check the contributions of partial observations because there is no representation of the metric in partial form. In addition, the stability of the family to data imbalance is taken from papers [40,41], but this has not been tested in practice. The best metric from each family is grayed out.
Thus, the most stable metrics are , , and . The unknown behavior of to imbalance and partial events leads to less visibility and reliability compared with other families. Comparing the metrics and , we note an important property of the later. Estimating the probability of , we evaluate the quality of the survival function before and after the event occurrence. Therefore, the early (before the event) and late (after the event) intervals have equal contributions to the metric. In the case of , the early and late intervals have a different contribution proportional to the length of the time interval.
In addition, when calculating the integral, avoids additional false sensitivity. In particular, the distance between the bins does not affect the integral and avoids increasing the contribution of rare late events. In the case of , the late outliers lead to additional late bins with an increased contribution of late events to the integral metric. Finally, paper [19] notes the stability of to calibration. In particular, saving the forecast form but changing the offset of predicted probabilities, metrics give an unreliable assessment.
Thus, according to the results of the conducted research, the most stable and reliable metric for assessing the quality of the survival function is .
6. Experiments
Based on the results of the conducted studies of the sensitivity of metrics (Section 5), we conclude that has the least false sensitivity. In addition, the proposed modifications of the metrics allow us to achieve a comparable level of reliability.
Each noticed metric can be used as a loss function in machine learning models. The choice of the loss function for survival analysis models has a significant role. Firstly, during the model fitting, the loss function helps us to select the optimal size of the tree ensemble. Secondly, to deploy the model, it is necessary to determine a set of hyperparameters that achieve the best quality of the model. In the future, we plan to embed the loss function into boosting ensembles to minimize the error for each observation.
This section contains an experimental study of the impact of the loss function on the model quality. The metric and its modifications determine the model quality, but [42], [43,44], and [24,26] and its modifications are used as the loss function. The study aims to select an optimal loss function (from the reviewed metrics in Section 5) and detect the impact of modifications of metrics to the model quality. The study of loss functions performs on the proposed survival bootstrap ensemble (Section 2.4.4).
The second goal of the experimental study is to evaluate and analyze the quality of existing and proposed models on the metric. At the time of this paper, we have not found any open studies about evaluating the models on .
6.1. Experimental Setup
The experiment setup is divided into three stages (Figure 15). Initially, we process feature space and target variables of each dataset (time before the event, a censoring indicator). In the first stage, the source data is split into a training and a test sample (66% and 33%, respectively) with stratification by the censoring indicator.
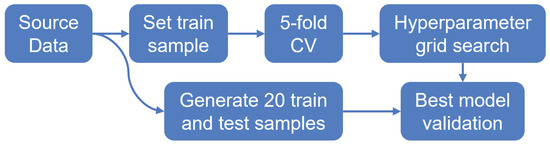
Figure 15.
Scheme of experimental setup. There are three primary steps: train and test splitting, cross-validation (CV) grid search, and multi-sample validation. The pipeline is performed for each survival model (CoxPH, ST, RSF, GBSA, CWGBSA, ), with a corresponding grid of hyperparameters.
In the second stage, using a training sample, we conduct a 5-fold cross-validation [45] according to a given grid of hyperparameters. During cross-validation, we divide the initial sample into five non-overlapping parts, four of which are used to train the model, and one part is used for model testing and for calculating metrics. Thus, there are five iterations of training/testing of the model, where each part becomes a test sample once. The resulting metric for cross-validation is the average value of the metric for all iterations. Using a predefined quality metric, we search the best hyperparameters for each model by grid.
In the third stage, we generate training and test data from the source 20 times (with 66% and 33% sizes, respectively). According to the best hyperparameters of each model (selected during cross-validation), we fit models on training data and apply them to test ones. The final quality of the model is the average quality for 20 test samples.
In the experimental study, we use the implementations of the CoxPH Survival Analysis (CoxPH), Survival Tree (ST), Random Survival Forest (RSF), Component-wise Gradient Boosting (CWGBSA), and Gradient Boosting Survival Analysis (GBSA) from the open library scikit-survival. The scikit-survival [25] package is written in the Python programming language and allows one to build classical survival analysis models. According to the overview [25] of the completeness of existing libraries (scikit-survival, lifelines, statsmodels, pycox), scikit-survival contains the widest functionality. The implementation of was presented in Section 2.4.4 of this paper.
Table 3 contains the grid of hyperparameters for each model. The hyperparameters of the CoxPH model are the regularization parameter for ridge regression penalty (regularization penalty), and the method to handle tied event times (ties). The hyperparameters of the ST model control the tree growth by the depth of the tree (max depth), the number of splitting features (max features), the algorithm of best split choosing (split strategy), and the size of nodes (min sample leaf). The hyperparameters of the RSF model are the size of the ensemble (num estimators) and the tree growth control parameters. The hyperparameters of the GBSA model are the num estimators, the coefficient of the contribution of each tree (learning late), and the tree growth control parameters. The hyperparameters of the CWGBSA model are the num estimators, the learning rate, the fraction of samples to fit the individual base models (subsample), and the percentage of dropped base models during the fitting (dropout rate).
Table 3.
The grid of hyperparameters of predictive models.
The hyperparameters of are the num estimators, the fraction of samples to fit base trees (bootstrap sample size), the estimation of and for each leaf (leaf model), weighted statistic for split choosing (criterion), and the tree growth control parameters.
6.2. Results
In this section, we present detailed experimental results for 8 datasets: , , , , , , , and . The purpose of the experiment is to evaluate the relationship between the loss function and the quality of model prediction. For each dataset, we evaluate the quality of existing and proposed methods using the metrics , (metric is based on terminal events), and (metric is based on equal contributions of censured and terminal observations).
Figure 16, Figure 17, Figure 18, Figure 19, Figure 20, Figure 21, Figure 22 and Figure 23 present the obtained results for each dataset. Each figure contains information about the quality of the existing models and for five loss functions: (likelihood), (concordance index), (integrated Brier score), (9) (integrated Brier score without weighting), (11) (integrated Brier score with controlled averaging of remained events). The x-axis corresponds to method name and the y-axis corresponds to the quality of the method. The proposed models ( and ) are marked in bold. For each method, we have created a boxplot with the distribution of metrics on 20 test samples. In addition, the medians of the values are marked by the gray line.
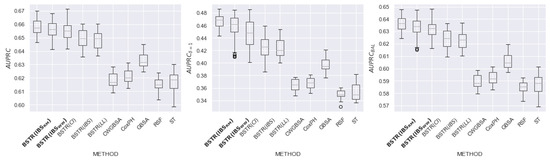
Figure 16.
comparison for dataset.
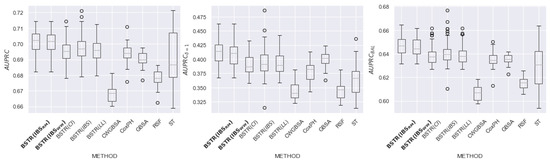
Figure 17.
comparison for dataset.
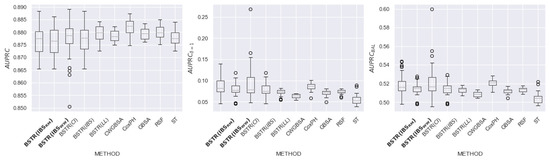
Figure 18.
comparison for dataset.
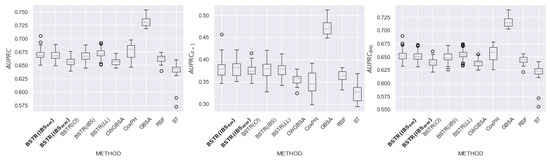
Figure 19.
comparison for dataset.
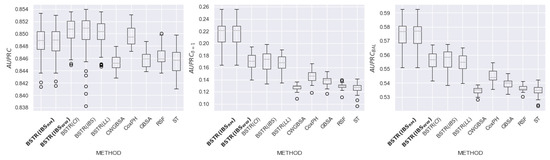
Figure 20.
comparison for dataset.
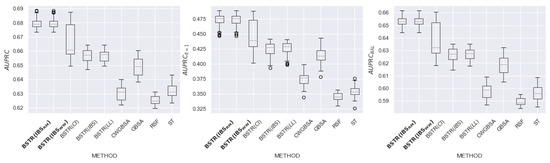
Figure 21.
comparison for dataset.
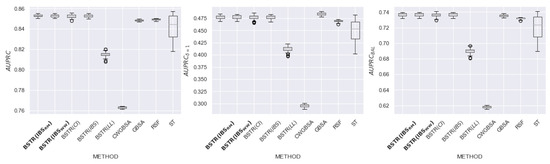
Figure 22.
comparison for dataset.
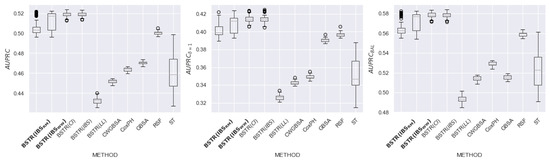
Figure 23.
comparison for dataset.
Table 4 contains summary results for all datasets. According to the dataset and metric, each cell contains a list of the best loss functions, or the value “no winner” if all loss functions have achieved similar quality. The row “Total” determines the recommended loss function for each metric. The best loss function for all metrics is . The second place in all metrics is taken by . The third place in the metric is taken by . Thus, the modifications lead to better quality compared to the original metric and alternative non-integrated metrics. In addition, for seven out of eight datasets, outperforms the existing scikit-survival models.
Table 4.
Summary table of the best loss function for each dataset and metric (descending order of the datasets by the proportion of terminal events). The row “Total” defines the best loss function for each metric. The best loss function for all metrics is .
According to the results of an experimental study, the proposed modification of (used as a loss function for an ensemble of independent survival trees) showed an increase in quality for , , and . Loss functions with an equal impact of events allow us to build models that are more resistant to imbalance. Thus, we should apply the proposed modifications of metrics to build a high-quality ensemble of survival trees. In further research, we plan to use for boosting model construction.
6.3. Discussion of Hyperparameters
In the experimental study, we showed the positive impact of the proposed modifications of on the model quality. In this section, we use these modifications to analyze the hyperparameters of predictive models. For example, we have proposed analyzing the influence of two types of Kaplan–Meier leaf models (KM and KM10) that we defined in Section 2.2.1. Recall that KM10 is an extension of the standard Kaplan–Meier model with a zero value after the moment of the occurrence of the last event.
To analyze the hyperparameters, we use the obtained table in the second stage of the experiments. In particular, we compare the value of the loss function for each set of parameters. Based on the previously described algorithm, the result of this stage is the best set of hyperparameters for each model. We consider the relationship between the values of loss functions (, , ) and quality metrics (, , ). In plots, we note the values for each set of hyperparameters and stratify them relative to the type of leaf model. To increase visibility, we visualize an estimate of spatial density based on kernel functions.
Figure 24 shows nine plots of pairwise dependence of three quality metrics and three loss functions for datasets. The vertical axis corresponds to the quality of the cross-validation model. The horizontal axis corresponds to the values of the model’s loss function on cross-validation. To choose the best hyperparameters, we consider the minimum value of and the best quality related to the largest . Hyperparameters with KM10 are highlighted in orange, with KM in blue.
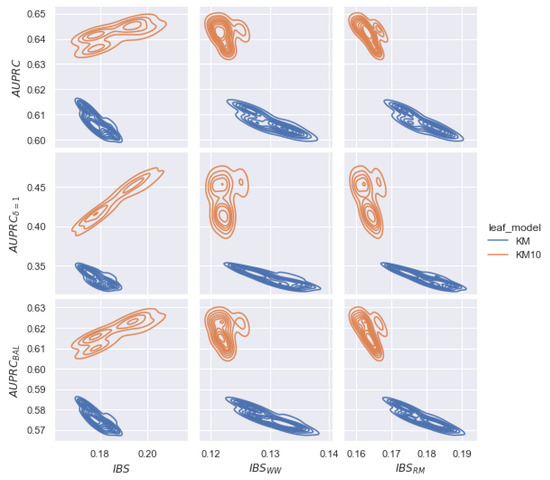
Figure 24.
Example of the relationship between the model quality (, , ) at the cross-validation stage ( dataset) and loss functions (, , ). Based on the quality of for each hyperparameter, we visualize a kernel density estimation. The KM10 leaf model provides better quality than KM and corrects the linear relationship in the case of the modified metrics. In addition, the best quality is reached for modified metrics.
Based on Figure 24, we notice the following conclusions. Firstly, for all plots, the density of KM10 hyperparameters is higher than those for KM. Therefore, using the KM10 leaf model, increases. Secondly, minimizing the metric (left plots), there is a linear relationship between and for KM10. This dependence is contrary to the best quality of and . Therefore, by choosing hyperparameters with the lowest value of , the quality of is also lower. Note that we observe the inverse linear relationship for the KM model ( increasing for decreasing ).
However, minimizing and metrics (central and right plots), we observe an inverse linear relationship between the loss function and the quality metric for the KM10 hyperparameter. Thus, modifications of restore the correct relationship for the KM10 parameter. Finally, minimizing (left plots), there is an unstable choice between the KM10 and KM parameters, although the KM10 class leads to a significant improvement in quality. In the case of modifications, the KM10 class shifts to the left and leads to a stable minimal loss value. Thus, modified metrics allows us to detect a class of hyperparameters that leads to an improvement of .
7. Conclusions
Survival analysis data have several specific characteristics, such as rare early and late events and the proportion of classes. The rare late events often do not correspond to the general distribution of time and contribute to the bias of forecasts. In this paper, we have researched the excessive sensitivity of survival analysis metrics to data features. We have determined four cases of increased sensitivity: the higher significance of partial events, the growth of integral metrics in time, the impact of time bins, and the influence of the imbalance of censored observations.
and metrics increase the contribution of rare late events, which leads to a distortion of the quality assessment. , , and metrics are unstable due to class imbalance. To set the equality of observation impacts, we adjust the weighting schemes of the event contribution and propose a controlled averaging approach. In particular, has equal contributions of times and partial events. In addition, , , and modifications provides equal contributions of censured and terminal observations. Based on the analytical study, we recommend to evaluate the prediction of the survival function.
The experimental study included eight datasets of real medical data. The goal of the study was to assess the impact of the loss function (, and the proposed modifications) on the quality (according to the metrics ) of the ensemble of independent survival trees. The uses a loss function to select the size and hyperparameters of the ensemble. According to the experimental results, shows an increase in quality compared to the original metric and alternative non-integrated metrics. Loss functions with an equal impact of events allow us to build models that are more resistant to imbalance. In addition, allows us to detect a class of hyperparameters (with leaf model as extended Kaplan–Meier) that leads to an improvement of . Finally, for seven datasets, the model outperforms the existing models of the scikit-survival library.
In further research, we plan to apply the proposed modifications of metrics to build a boosting ensemble of survival trees. The usage of stable metrics will prevent overfitting and bias in the model. In addition, we plan to study the quality of the proposed approaches on real datasets from alternative applications of survival analysis.
Author Contributions
Conceptualization, M.P. and I.M.; methodology, I.V. and M.P.; software, I.V.; validation, I.V.; formal analysis, I.V. and M.P.; investigation, M.P. and I.M.; resources, M.P. and I.M.; data curation, I.V.; writing—original draft preparation, I.V.; writing—review and editing, M.P. and I.M.; visualization, I.V.; supervision, M.P.; project administration, I.M. All authors have read and agreed to the published version of the manuscript.
Funding
This research received no external funding.
Data Availability Statement
The authors confirm that the data supporting the findings of this study are available within the article.
Conflicts of Interest
The authors declare no conflict of interest.
References
- Kleinbaum, D.; Klein, M. Survival Analysis: A Self-Learning Text, 3rd ed.; Statistics for Biology and Health; Springer: New York, NY, USA, 2016. [Google Scholar]
- Wang, P.; Li, Y.; Reddy, C.K. Machine learning for survival analysis: A survey. ACM Comput. Surv. (CSUR) 2019, 51, 1–36. [Google Scholar] [CrossRef]
- Lee, S.H. Weighted Log-Rank Statistics for Accelerated Failure Time Model. Stats 2021, 4, 348–358. [Google Scholar] [CrossRef]
- Karadeniz, P.G.; Ercan, I. Examining tests for comparing survival curves with right censored data. Stat Transit 2017, 18, 311–328. [Google Scholar]
- Lee, S.H. On the versatility of the combination of the weighted log-rank statistics. Comput. Stat. Data Anal. 2007, 51, 6557–6564. [Google Scholar] [CrossRef]
- Brendel, M.; Janssen, A.; Mayer, C.D.; Pauly, M. Weighted logrank permutation tests for randomly right censored life science data. Scand. J. Stat. 2014, 41, 742–761. [Google Scholar] [CrossRef]
- Hasegawa, T. Group sequential monitoring based on the weighted log-rank test statistic with the Fleming–Harrington class of weights in cancer vaccine studies. Pharm. Stat. 2016, 15, 412–419. [Google Scholar] [CrossRef]
- Kvamme, H.; Borgan, Ø. Continuous and discrete-time survival prediction with neural networks. Lifetime Data Anal. 2021, 27, 710–736. [Google Scholar] [CrossRef]
- Etikan, I.; Abubakar, S.; Alkassim, R. The Kaplan-Meier estimate in survival analysis. Biom. Biostat. Int. J. 2017, 5, 00128. [Google Scholar] [CrossRef]
- Andersen, P.K. Fifty years with the Cox proportional hazards regression model. J. Indian Inst. Sci. 2022, 102, 1135–1144. [Google Scholar] [CrossRef]
- Lin, D. On the Breslow estimator. Lifetime Data Anal. 2007, 13, 471–480. [Google Scholar] [CrossRef]
- Longato, E.; Vettoretti, M.; Di Camillo, B. A practical perspective on the concordance index for the evaluation and selection of prognostic time-to-event models. J. Biomed. Inform. 2020, 108, 103496. [Google Scholar] [CrossRef] [PubMed]
- Heagerty, P.J.; Zheng, Y. Survival model predictive accuracy and ROC curves. Biometrics 2005, 61, 92–105. [Google Scholar] [CrossRef] [PubMed]
- Lambert, J.; Chevret, S. Summary measure of discrimination in survival models based on cumulative/dynamic time-dependent ROC curves. Stat. Methods Med. Res. 2016, 25, 2088–2102. [Google Scholar] [CrossRef] [PubMed]
- Kvamme, H.; Borgan, Ø.; Scheel, I. Time-to-event prediction with neural networks and Cox regression. arXiv 2019, arXiv:1907.00825. [Google Scholar]
- Clim, A.; Zota, R.D.; TinicĂ, G. The Kullback-Leibler divergence used in machine learning algorithms for health care applications and hypertension prediction: A literature review. Procedia Comput. Sci. 2018, 141, 448–453. [Google Scholar] [CrossRef]
- Yari, G.; Mirhabibi, A.; Saghafi, A. Estimation of the Weibull parameters by Kullback-Leibler divergence of Survival functions. Appl. Math. Inf. Sci 2013, 7, 187–192. [Google Scholar] [CrossRef]
- Haider, H.; Hoehn, B.; Davis, S.; Greiner, R. Effective Ways to Build and Evaluate Individual Survival Distributions. J. Mach. Learn. Res. 2020, 21, 3289–3351. [Google Scholar]
- Avati, A.; Duan, T.; Zhou, S.; Jung, K.; Shah, N.H.; Ng, A.Y. Countdown regression: Sharp and calibrated survival predictions. In Proceedings of the Uncertainty in Artificial Intelligence, Virtual, 3–6 August 2020; pp. 145–155. [Google Scholar]
- Hastie, T.; Tibshirani, R.; Friedman, J.H.; Friedman, J.H. The Elements of Statistical Learning: Data Mining, Inference, and Prediction; Springer: Berlin/Heidelberg, Germany, 2009; Volume 2. [Google Scholar]
- Dormuth, I.; Liu, T.; Xu, J.; Yu, M.; Pauly, M.; Ditzhaus, M. Which test for crossing survival curves? A user’s guideline. BMC Med. Res. Methodol. 2022, 22, 34. [Google Scholar] [CrossRef]
- Bou-Hamad, I.; Larocque, D.; Ben-Ameur, H. A review of survival trees. Statist. Surv. 2011, 5, 44–71. [Google Scholar] [CrossRef]
- Ishwaran, H.; Kogalur, U.B.; Blackstone, E.H.; Lauer, M.S. Random survival forests. Ann. Appl. Stat. 2008, 2, 841–860. [Google Scholar] [CrossRef]
- Vasilev, I.; Petrovskiy, M.; Mashechkin, I.V. Survival Analysis Algorithms based on Decision Trees with Weighted Log-rank Criteria. In Proceedings of the 11th International Conference on Pattern Recognition Applications and Methods, Virtual, 3–5 February 2022; pp. 132–140. [Google Scholar]
- Pölsterl, S. scikit-survival: A Library for Time-to-Event Analysis Built on Top of scikit-learn. J. Mach. Learn. Res. 2020, 21, 1–6. [Google Scholar]
- Nguyen, N.P. Gradient Boosting for Survival Analysis with Applications in Oncology; University of South Florida: Tampa, FL, USA, 2019. [Google Scholar]
- Drysdale, E. SurvSet: An open-source time-to-event dataset repository. arXiv 2022, arXiv:2203.03094. [Google Scholar]
- Schumacher, M. Rauschecker for the german breast cancer study group, randomized 2× 2 trial evaluating hormonal treatment and the duration of chemotherapy in node-positive lbreast cancer patients. J. Clin. Oncol. 1994, 12, 2086–2093. [Google Scholar] [CrossRef]
- Royston, P.; Lambert, P.C. Flexible Parametric Survival Analysis Using Stata: Beyond the Cox Model; Stata Press: College Station, TX, USA, 2011; Volume 347. [Google Scholar]
- Knaus, W.A.; Harrell, F.E.; Lynn, J.; Goldman, L.; Phillips, R.S.; Connors, A.F.; Dawson, N.V.; Fulkerson, W.J.; Califf, R.M.; Desbiens, N.; et al. The SUPPORT prognostic model: Objective estimates of survival for seriously ill hospitalized adults. Ann. Intern. Med. 1995, 122, 191–203. [Google Scholar] [CrossRef] [PubMed]
- Yan, L.; Zhang, H.T.; Goncalves, J.; Xiao, Y.; Wang, M.; Guo, Y.; Sun, C.; Tang, X.; Jing, L.; Zhang, M.; et al. An interpretable mortality prediction model for COVID-19 patients. Nat. Mach. Intell. 2020, 2, 283–288. [Google Scholar] [CrossRef]
- Kaplan, M.M. Primary biliary cirrhosis. N. Engl. J. Med. 1996, 335, 1570–1580. [Google Scholar] [CrossRef] [PubMed]
- Simons, P.C.G.; Algra, A.; Van De Laak, M.; Grobbee, D.; Van Der Graaf, Y. Second manifestations of ARTerial disease (SMART) study: Rationale and design. Eur. J. Epidemiol. 1999, 15, 773–781. [Google Scholar] [CrossRef]
- Hammer, S.M.; Squires, K.E.; Hughes, M.D.; Grimes, J.M.; Demeter, L.M.; Currier, J.S.; Eron, J.J., Jr.; Feinberg, J.E.; Balfour, H.H., Jr.; Deyton, L.R.; et al. A controlled trial of two nucleoside analogues plus indinavir in persons with human immunodeficiency virus infection and CD4 cell counts of 200 per cubic millimeter or less. N. Engl. J. Med. 1997, 337, 725–733. [Google Scholar] [CrossRef]
- Kyle, R.A.; Therneau, T.M.; Rajkumar, S.V.; Larson, D.R.; Plevak, M.F.; Offord, J.R.; Dispenzieri, A.; Katzmann, J.A.; Melton, L.J., III. Prevalence of monoclonal gammopathy of undetermined significance. N. Engl. J. Med. 2006, 354, 1362–1369. [Google Scholar] [CrossRef]
- Hung, H.; Chiang, C.T. Estimation methods for time-dependent AUC models with survival data. Can. J. Stat. 2010, 38, 8–26. [Google Scholar] [CrossRef]
- Uno, H.; Cai, T.; Tian, L.; Wei, L.J. Evaluating prediction rules for t-year survivors with censored regression models. J. Am. Stat. Assoc. 2007, 102, 527–537. [Google Scholar] [CrossRef]
- Chawla, N.V. Data mining for imbalanced datasets: An overview. In Data Mining and Knowledge Discovery Handbook; Springer: New York, NY, USA, 2010; pp. 875–886. [Google Scholar]
- He, H.; Ma, Y. Imbalanced Learning: Foundations, Algorithms, and Applications; Wiley-IEEE Press: Hoboken, NJ, USA, 2013. [Google Scholar]
- Fawcett, T. An introduction to ROC analysis. Pattern Recognit. Lett. 2006, 27, 861–874. [Google Scholar] [CrossRef]
- Tong, L.I.; Chang, Y.C.; Lin, S.H. Determining the optimal re-sampling strategy for a classification model with imbalanced data using design of experiments and response surface methodologies. Expert Syst. Appl. 2011, 38, 4222–4227. [Google Scholar] [CrossRef]
- Chen, Y.; Jia, Z.; Mercola, D.; Xie, X. A gradient boosting algorithm for survival analysis via direct optimization of concordance index. Comput. Math. Methods Med. 2013, 2013, 873595. [Google Scholar] [CrossRef] [PubMed]
- Binder, H.; Binder, M.H. Package ‘CoxBoost’. 2015. Available online: https://cran.r-hub.io/web/packages/CoxBoost/CoxBoost.pdf (accessed on 20 August 2023).
- Bai, M.; Zheng, Y.; Shen, Y. Gradient boosting survival tree with applications in credit scoring. J. Oper. Res. Soc. 2022, 73, 39–55. [Google Scholar] [CrossRef]
- Refaeilzadeh, P.; Tang, L.; Liu, H. Cross-validation. Encycl. Database Syst. 2009, 5, 532–538. [Google Scholar]
Disclaimer/Publisher’s Note: The statements, opinions and data contained in all publications are solely those of the individual author(s) and contributor(s) and not of MDPI and/or the editor(s). MDPI and/or the editor(s) disclaim responsibility for any injury to people or property resulting from any ideas, methods, instructions or products referred to in the content. |
© 2023 by the authors. Licensee MDPI, Basel, Switzerland. This article is an open access article distributed under the terms and conditions of the Creative Commons Attribution (CC BY) license (https://creativecommons.org/licenses/by/4.0/).