Abstract
This study aims to develop and test a new accelerated method for analyzing low-frequency oscillations in power systems using phasor measurements. The proposed method is based on the use of mathematical statistics methods that do not require significant computing power and have high reliability. Changes in the structure of power generation and integration of control devices based on power electronics cause low-frequency oscillations of power system operation parameters that present a threat. These changes result in a reduction in the total inertia of power systems with the subsequent impact on the operation of automatic voltage regulators and power system stabilizers, the purpose of which is to damp low-frequency oscillations. We conduct a careful review of the existing methods for low-frequency oscillations analysis in power systems to identify the gaps in the literature and design a new method to address the issues. The proposed method is tested on real-life data that was obtained during a disturbance with a transient event. Estimation of the low-frequency oscillation parameters was carried out, and the potential threat posed by these phenomena was examined. The implementation of the proposed algorithm for analyzing low-frequency oscillations is done using the Matlab programming language. Evaluation of the proposed algorithm is performed on physical data obtained during real transient processes occurring at large power plants.
Keywords:
low-frequency oscillation; power system; signal processing; phasor measurement unit; synchronous generator; statistical analysis MSC:
28-08
1. Introduction
Low-frequency oscillations (LFO) of power system operation parameters pose a threat to the stability and reliability of power system operation [1,2,3,4,5]. The presence of these oscillations leads to a forced limitation of total transfer capacity, which in turn has a negative impact on economic indicators with the required reliability level being ensured.
The phenomenon of LFOs has been known for a long time. They are inherent to any power system. LFOs occur and expand due to minor oscillations of load and disturbances such as the disconnection of generators or transmission lines. LFOs of power system operation parameters during electromagnetic transients generally reveal themselves in the aftermath of a substantial power deficit in a particular area of a power system. The proximity of power flows to transmission capacity limits and incorrect tuning of the Automatic Voltage regulator (AVR) and turbine governor are the main factors that contribute to the occurrence of LFOs. Untimely LFO identification and a lack of damping may lead to instability of a power system [6], equipment damage due to the transition of synchronous oscillations into out-of-step ones, etc. [7].
The energy industry has continuously grown the scale of its operations including the expansion of grids with increasing rated voltage or the growth of generator capacities [8]. Starting from the middle of the 20th century, the spread and complexity of grids have been growing due to the uneven distribution of energy resources and their major consumers. This resulted in the creation of multiple international interconnections in North, Central, and South Americas, Europe, and Northern and Southern Africa. All this has brought about the creation of power systems of high capacities [9], which include long transmission lines with limited capacity. Power generation has been expanding through the installation of distributed generation including that based on renewable sources of energy (RES). Moreover, according to expert estimates, the share of wind and sun generation will increase further despite the uncertainty of its operation and forecast difficulty [10,11,12]. The constant alteration of power system structures causes their inertia to decrease [13], which makes disturbances more impactful in terms of system operation parameters [14]. The controllability of power systems can be improved using advanced equipment that is often supplemented by fast control systems such as asynchronous machines, flexible AC transmission systems (FACTS) [15], energy storage systems, etc. [16]. Hence, the properties of the power system start to change as well, which manifests in the form of LFOs among other phenomena [17].
Slight load changes can lead to different results for acceptable oscillations of small amplitude that occur in normal conditions for a relatively long time and under-damped conditions. Such events may lead to the instability of the power system operation. The constant growth of inter-tie power flows turns inter-area LFOs into under-damped, non-damped, or over-damped oscillations and they present a peril to power system operation.
The range of low-frequency oscillations is usually between 0.1 and 3.0 Hz [18]. In addition, LFOs are divided into local and system-wide based on the degree of localization [19], with the latter impacting the whole power system. Local LFOs are usually mutual oscillations of synchronous generators, while system-wide LFOs are those of subsystems or generator groups. An LFO ensues from the interaction of several rotating masses in an area of a power system, which determines its non-linearity and non-stationarity [20,21]. Additional components, which correspond to the mutual action of concentrated system regions or entire power systems, may occur.
Several studies have been made to solve the problem of LFO monitoring [22]. The conventional approach to stability analysis is based on studying physical or computer models [23]. Such models are developed [24] and verified on a regular basis [25] in order to comply with the real parameters and behavior of a power system during transients. However, it is not possible to simulate all possible dangerous events in power systems using dynamic models [26]. Therefore, LFO monitoring based on measurements of power system operation parameters is required to minimize potential threats before they start to escalate into the instability of a system [27]. There are time periods of under-damped oscillations during the analysis of power system measurements. A lack of damping indicates a less reliable operation of a power system since all subsequent disturbances can result in transient instability. Small LFOs of synchronous generators regularly take place due to the frequent occurrence of insignificant power unbalances. They are effectively damped and do not represent any danger. Cyclic electromagnetic transients happen during significant power imbalances and are followed by frequency deviations higher than 0.05 Hz. Fast identification (express-analysis) of LFOs becomes of paramount importance in these kinds of situations. Identification is carried out for monitoring damping efficiency for each synchronous generator, which is largely defined by the parameters of system regulators. The monitoring of damping for each generator and system as a whole is necessary to find the causes of an LFO and to adjust the operation of regulators.
The goal of this study is to develop a novel accelerated method for power system LFO analysis based on a statistical analysis of signals obtained from phasor measurement units (PMU). To achieve this goal, the following tasks were set: (i) review existing methods for analyzing low-frequency oscillations in power systems, (ii) identify their advantages and disadvantages, (iii) develop an accelerated method for analyzing low-frequency oscillations in power systems, and (iv) test the developed method, to determine the requirements for analyzing the danger level of LFOs in power systems.
2. Comparison of Methods for Estimation of LFO Parameters
In this section, we review and compare the methods used for solving a wide range of oscillation analysis problems. Also, the latest developments aimed at the application of LFO analysis in power systems are presented.
Figure 1 shows the general flow chart for estimating LFO parameters in power systems.
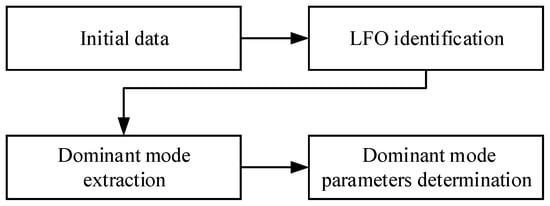
Figure 1.
Flow chart for estimating LFO for power system operation parameters.
Signals of active power or frequency obtained from PMUs are used as the initial data for analysis of the LFO parameters. The procedure for LFO identification is applied to the initial data. Dominant modes of oscillation are extracted and then the parameters of each dominant mode are estimated.
2.1. Methods of LFO Identification
Data express-analysis is performed to detect LFO in measurement arrays including the inception of oscillations, duration, and parameters in real-time mode or the closest mode to real-time. Splitting the problems of express analysis and the analysis of LFOs is widely practiced worldwide [4,28] The reason for it is that the methods are processing all PMU data, which requires enormous computation capabilities to process in real-time.
This section describes the following methods of data express-analysis: the Buys–Ballot method, spectral analysis based on discrete Fourier transform (DFT), and spectral analysis based on discrete Prony transform.
2.1.1. Buys-Ballot Method
To detect hidden periodic patterns in signals, the simplest and fastest linear methods are often used: the averaging of ordinates using a trial period, the averaging of a process using a trial period, and the Buys–Ballot table [29]. The Buys–Ballot method is the most appropriate to detect oscillations using phasors of active power and frequency [30,31]. The method allows the detection of periodic oscillations only in the interval under consideration and the estimation of the frequency of these oscillations. The efficiency of the method can be considered to be acceptable. The speed of the LFO detection depends significantly on the choice of method settings.
2.1.2. DFT-Based Method of Spectral Analysis
The DFT is one of the most widely used techniques for solving oscillation analysis problems [32,33,34]. The method of spectral analysis, which is based on the DFT, is described. It is used for solving the problem of express-data analysis of LFOs in power systems. It is possible to use two ways to carry out express analysis using this method: either all operations are conducted in sequence using fully set input data, or all operations are conducted using every LFO search window. The difference is that the former is useful for retrospective analysis only, whereas the latter can also be used to carry out express analysis in real-time. A reason for this difference is that the first way requires a complete dataset, while the second one is computing data as they come. This method ensures a short time response of LFO identification.
An a priori basis has to be set to carry out the analysis. The inverse dependence of FT resolution on frequency and time requires finding compromises in choosing the LFO search window width and the application of window functions. The method meets the requirements for express analysis in real time [35].
2.1.3. Spectral Analysis Based on Discrete Prony Transform
The method of spectral analysis based on the discrete Prony transform is considered an alternative to the DFT-based method [36,37]. The decomposition of the initial data frequency components forms the basis of this method. For this reason, it is similar to the FT method. The main difference between these methods is that the Prony method uses harmonics, the amplitudes of which change exponentially, as the components. The application of the Prony transform allows the user to take into account changing amplitudes in express analysis. An a priori basis has to be set to carry out the analysis. The result of express analysis based on the Prony transform heavily depends on the number of transformation modes. The method is very resource-intensive. It can be useful in retrospective analysis only. Among the considered methods that can be used in express analysis, only the FT-based spectral analysis method meets the requirements. The Buys–Ballot method is not capable of LFO parameter estimation. This fact makes the method useless. At the same time, the method of spectral analysis based on the Prony transform is highly resource-intensive, which makes it impossible to use the method in real-time. However, the method is still useful in retrospective analysis because it takes into account changing LFO amplitude. Despite the inverse dependence of FT on frequency and time as the result of using windows, the application of this method is the most appropriate because of the highly developed theory and the availability of a lot of programming modules with high optimization levels, for solving real-time problems [38]. The impossibility of taking into account the real properties of oscillations caused by the a priori basis is not significant. This can be explained by the fact that the express analysis goal is LFO identification and LFO parameters estimation. However, it is necessary to develop an express analysis method without the mentioned drawbacks.
2.2. Dominant Mode Extraction
The method for analysis of electromechanical oscillations in power systems must be chosen by taking into consideration their non-linearity and non-stationarity. Apart from the a priori set basis, the common property of methods mentioned in Section 2.1 is their bias toward linear and stationary processes. The analysis of linear non-stationary processes can be carried out using wavelets [39,40], principal component analysis [41], and the Wigner–Ville distribution [42]. However, they were not considered in this study due to the a priori set basis (Haar, Mayer wavelets, etc.) can introduce unacceptable errors to results. The non-linear and non-stationary properties of LFOS s in power systems can be taken into account to the fullest extent by means of the Empirical Mode Decomposition (EMD) [43,44]. The main advantage of this approach lies in its adaptive basis, which is formed using initial data.
The types of EMD are:
- Classical EMD;
- EMD with centroid-based sifting;
- Noise-assisted EMD;
- EMD with phase-shift;
- EMD with frequency-shifting.
Using the EMD with frequency-shifting ensures a high discrimination degree of the method, as well as the minimization of mode mixing in cases when their frequencies differ from each other by more than the value of the minimal transition band of a filter. In addition, the effectiveness of the EMD with frequency-shifting is equal to or even higher than that of classical EMD due to decreased number of noise and small modes, which are achieved by means of using a filter. The procedure of filtering is not resource-hungry by itself: corresponding fast algorithms have been developed in the framework of digital signal processing.
2.3. Estimation of Dominant Mode Parameters
Two types of HT and the alternative method were considered for the purpose of the estimation of amplitude, frequency, and duration on the whole range of dominant modes.
2.3.1. Hilbert Transform Using Direct and Inverse Fourier Transform
According to the classical HT [45,46], an initial signal is decomposed into two components: amplitude and phase. An arbitrary signal is assigned as an «analytical signal». This is a complex signal with a real part equal to the initial signal and an imaginary part equal to the initial signal shifted by– π/2. A Hilbert Transform using direct and inverse Fourier transform is characterized by low computational costs, and, consequently, high effectiveness owing to highly optimized calculation modules based on the FFT.
2.3.2. Hilbert Transform Using Summation
Another variation of the HT based on the summation rule was considered as an alternative to direct inverse FT [47]. This replaces integration in cases of discrete signals.
2.3.3. Estimation of LFO Parameters Using the Method of Signal Energy
The third method under consideration is different from the HT and it does not use the concept of the analytical signal. It is referred to as the signal energy method [48] and according to this approach, the parameters of the initial signal are estimated on half-cycles of oscillations.
2.3.4. Comparison of Methods
The results of mode component calculation by each mentioned method are shown in Figure 2. Table 1 shows the advantages and disadvantages of the methods considered. Figure 2 shows the test signal. The purpose of using such a signal is to demonstrate the capabilities of the considered methods regarding the determination of frequency in a wide range of frequency variations.

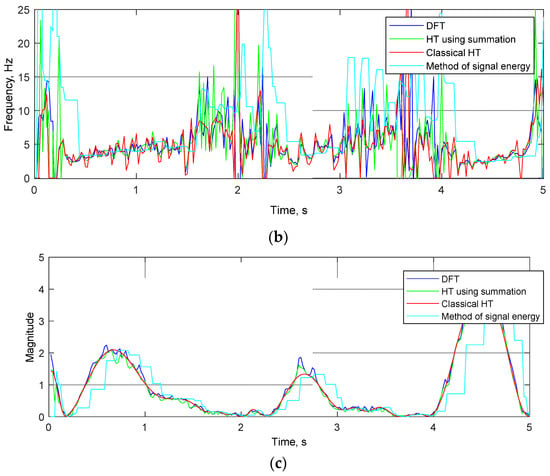
Figure 2.
The results of mode component calculation for each method: (a) initial signal; (b) signal frequencies; (c) signal magnitudes.

Table 1.
Comparison of existing methods for LFO analysis.
Only the DFT-based method of spectral analysis meets the requirements for effectiveness and computational costs for the purposes of LFO express analysis. The Buys–Ballot method cannot be used to estimate LFO parameters, while the Prony-based method of spectral analysis has high computational costs, which means a long time response. The conducted comparison allowed us to establish that it is advisable to develop a new method. This new method includes express analysis without the main drawback of the considered methods—the need to set the a priori basis.
Furthermore, the comparison of methods for LFO dominant mode extraction has made it clear that the EMD method can be used to take into account non-linearity and non-stationarity. In addition, the classical method would require modification in order to minimize the impact of known drawbacks on the results. At the same time, it is recognized the considered modifications cause computational efficiency to drop, except for the EMD with frequency shifting. Therefore, a new method of LFO dominant mode extraction needs to be developed. This method should include existing experience and it should carry out the processing of data from power facilities in real-time. It was found that the method of signal energy is not accurate enough, while the HT with summation rule has too large a computational burden. Moreover, both HT variations require data from the whole analyzed time interval. However, real-time estimation of LFO parameters is one of the highest priorities in power system operation. Hence, FT-based HT can not be used in solving this very problem, despite its high accuracy and effectiveness.
The following methods can also be used for the analysis of the LFO: the fast Fourier transform (FFT) [49], the Prony transform (PT) [50], and the Wavelet transform (VT) [51]. However, each of these methods has its limitations. For example, PT and FFT can be used only for stationary signals, while VT cannot be effectively used for the analysis of the LFO due to the time-consuming procedure of selecting a basic Wavelet. In [52], the application of the Hilbert–Huang method for real-time analysis of LFO is proposed. However, the proposed method has a number of disadvantages associated with the complexity of processing narrowband signals; the detection of intermittent oscillations and the analysis of close dominant modes are also difficult. In the study [53], the Pseudo-Newton method was used for the analysis of the LFO, which cannot be used in real-time due to the significant number of iterations of the calculation. The authors of the study [54] proposed the Analytical Modal Decomposition (AMD) method, which is similar to EMD but has a simpler structure and high reliability. However, for this method, there is still the problem of analyzing narrowband signals.
The review of the literature indicates the necessity to develop improved methods or completely new ones in order to solve the problem of the accurate estimation of oscillation parameters in real-time.
3. The Algorithm of LFO Statistical Analysis
In this section, we describe the methods of express analysis, dominant modes extraction, and their parameter estimation. Our goal is to reduce the impact of the current drawbacks on calculations. In addition, a number of problems related to the sampling of data obtained from real measurement devices on power facilities are solved.
3.1. The Method of Sliding Statistical Segments
The results of comparing the methods of express analysis show that only the DFT-based method of spectral analysis meets the requirements, though not without incorrect consideration of LFO parameter changes. Consequently, a fast method is needed to negate that. The method of sliding statistical segments has been developed to solve the problem of LFO express analysis in real-time conditions. It boils down to the estimation of oscillation time, and the amplitude and frequency of the oscillations, taking into account changes in these values in real-time.
The algorithm of the proposed method is the following:
- Local extrema of the initial signal are found using the method of sliding parabola [55];
- An array of alternating local minima and maxima of the initial signal is formed using mean values of the same extrema arranged in a row and without separation by opposite extrema;
- Successive (adjacent) extrema are connected by straight line segments;
- Coordinates of intersection are found. The intersection in question is that of segments and vertical lines crossing the point of the opposite extrema, which is located between two adjacent extrema of the same sign (maxima-maxima or minima-minima);
- Values of LFO amplitude are estimated at intervals corresponding to half-cycles of oscillations. The same is done for frequency estimation;
- Estimation of LFO time (duration, from inception to the end).
The results of carrying out the method’s procedures are shown in Figure 3. Same-sign extrema (minima-minima, maxima-maxima) are connected with segments (dashed line) and intersections are found (triangle markers), with vertical lines not being shown due to visual overload of the plot.
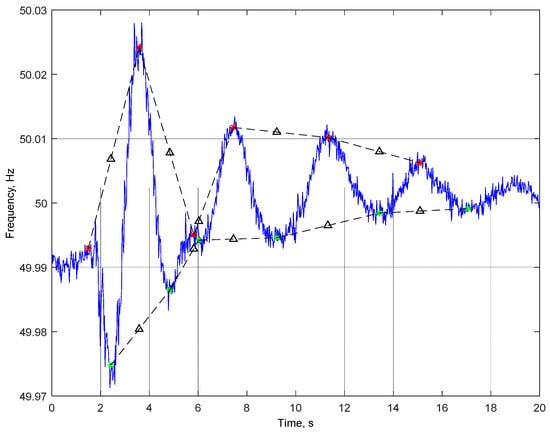
Figure 3.
Express-analysis using the method of sliding statistical segments.
In Figure 3, red asterisks show the upper points of the signal extremes, green asterisks show the lower extremes of the signal, dotted lines show the connection line of the same type (upper or lower) extremes, black triangles show the middle of the segment connecting the same type of extremes.
Figure 4 shows the flow chart for the proposed accelerated method for LFO analysis.
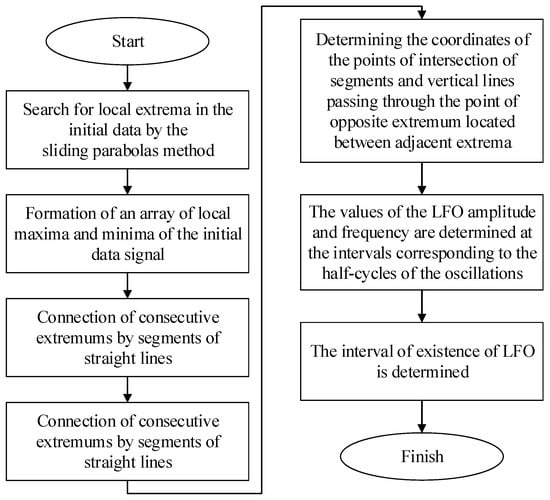
Figure 4.
Flow chart of the proposed method of LFO analysis.
The configurable parameters of the algorithm are: the approximation interval for finding extremes by sliding parabolas (by default, the ap-approximation interval is 50 quanta), the approximation step for finding extremes by sliding parabolas (by default, the approximation step is 20 quanta.)
3.2. Estimation of LFO Time Interval
The interval of LFO occurrence is estimated based on exceeding the irregular component of a signal by the amplitude value. The irregular component of a signal (sum of random insignificant changes in a process and measurement errors) is estimated to be equal to three standard deviations (SD) of the initial data on the initial interval starting from the curve that approximates the data on this very interval by a third-degree polynomial. The distribution of the irregular component is assumed to be close to a normal distribution. Assuming that the irregular component is distributed normally, then oscillations take place on those intervals where the amplitude exceeds three SD of the initial data. The results of the method application are shown in Figure 5, including the set of intervals of LFO occurrence (inception shown as a red line, end shown as a green line) and estimates of the amplitude and frequency.
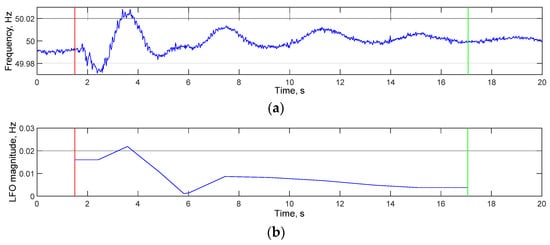

Figure 5.
The initial data and, estimated amplitude and frequency of the LFO, duration of the LFO: (a) initial signal; (b) LFO frequency; (c) LFO magnitude.
Application of the method would also enable the simplified elimination of the signal trend by finding its «average line» on the interval of the LFO.
3.3. The Frequency-Based EMD
In some cases, it is not possible to extract oscillation components with close frequency values by using only band filtering. This is caused by the necessary non-zero transition band of a filter. The EMD with frequency shifting is used to separate these components by frequency. Such a combination of methods is suggested and named «frequency-based EMD».
The algorithm of the frequency-based EMD is the following:
- Frequency intervals with oscillation components are found in the initial data. The DFT is used to find these frequency intervals. After this, the spectral peaks, which correspond to oscillation components of a signal, are detected. Since not all oscillations can be separated by frequency using band filtering, the minimal and maximal frequencies are detected for oscillations with a difference of less than 0.5 Hz;
- Extraction of oscillation components is carried out in the same way as in the phase-shifting EMD;
- In case of the occurrence of oscillation components in some frequency range that can not be separated by frequency using the traditional EMD then the phase-shifting EMD is used.
The frequency-based EMD ensures a completely new level of extraction of nonlinear and nonstationary oscillation components in measurements of power system operation parameters by combining the advantages of EMD modifications, which are the most appropriate to the nature of the initial data. Hence, the use of the frequency-based method makes it possible to extract oscillation components with particular frequency values. It is the frequency-based EMD that ensures the most complete results of the highest quality judging by the whole aggregation of its parameters and properties while having relatively low computational costs. Frequency-based EMD is recommended to extract dominant modes.
3.4. The Modified Hilbert Transform
We further develop an additional method for signal parameters estimation that we call a modified Hilbert transform. This approach includes the calculation of the analytical signal using signal amplitudes.
The algorithm of the modified HT is as follows:
- The envelope curve of local extrema (maxima) of the absolute centralized signal values (absolute signal) is used as signal amplitude;
- The imaginary part of the analytical signal is found according to:
- Signal frequency is estimated as such:
Due to the stage-wise procedure of the estimation, the possibility of real-time operation is the most crucial difference between the modified and classical HT. Hence, LFO parameters can be estimated as new information from intervals on the quarter of their cycle becomes available.
It is suggested to use the following:
- The value of the LFO amplitude for a detected time exceeding the limit;
- A standardized LFO damping factor for a detected time exceeding the limit.
The acceptable duration of exceeding the limit should be set considering the exceeded value.
3.5. Criteria of LFO Threat Evaluation
The evaluation of LFO threat in power systems should be based on the analysis of LFO parameter changes and the facts of the violation of set limits and the acceptable duration of such events. Acceptable limits and duration values are set using expert recommendations based on PMU data analysis and they can be further corrected using data from real practical experience. The acceptable duration of exceeding the limit by an LFO parameter is found depending on the amplitude and frequency of the LFO. The default values of indices are shown in Table 2. Values of the duration exceeding the limit by an LFO parameter are to be set for each type of LFO [56]. The graphical interpretation of LFO threat criteria and limit values are shown in Figure 6: «Alarm» level is marked by orange lines (horizontal lines indicate a criterion value, vertical lines indicated duration of exceeding the limit) and hatching, while «Danger» is marked by red lines. Figure 6 shows a real frequency signal recorded during a technical incident at one of the large power plants with the highest frequency fluctuation value of 0.108 Hz.

Table 2.
Values of LFO threat criteria.
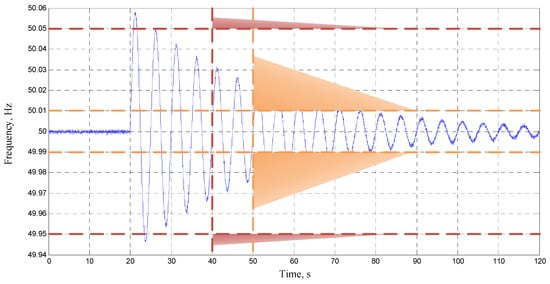
Figure 6.
Visual representation of LFO threat criteria for a case of frequency.
Two types of data format are used in Table 1: [0.01, 30 s]—limit value is on the first position, acceptable duration of exceeding the limit is on the second position; [10%, 40 s]—share of either rated power capacity or transmission capacity limit is shown on the first position, acceptable time of exceeding the limit is on the second position.
Values of threat criteria should be corrected in relation to the irregular component of probabilistic behavior of power system operation parameters, which can be found using the following:
where N is a parameter of power system operation, N1 is the value of the irregular component of the power system operation parameter, ME(N) is the mean of the power system operation parameter, and SD(N) is the standard deviation of the power system operation parameter. Limits should be set at 5–6 more than the irregular component for dispatch and control personnel and to set 2–3 less than this limit and duration for engineer workers according to the problem specificity and requirements.
4. Testing of the LFO Estimation Method
The proposed method of LFO estimation is tested on data obtained during a real disturbance in a real power system when the AC frequency had dropped to 48.2 Hz.
4.1. Description of the Disturbance
During the disturbance, the real power system area became isolated, with automatic load shedding operating successfully. The frequency had dropped to 48 Hz with further restoration after 23 s. The LFO occurred after the isolated operation of one of the power plants.
The switchgear diagram of the power plant under consideration is shown in Figure 7. The dotted line shows the equipment that is disabled.
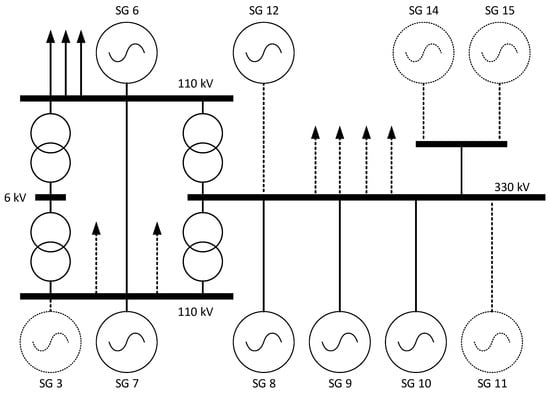
Figure 7.
Single-line diagram of the power plant under consideration.
According to the single-line diagram of the power plant, generators 8–10 operate at one bus of rated voltage 330 kV (tie circuit breaker is switched on), and generators 6 and 7 are separated from the others by autotransformers at 330/110 kV, respectively. All power units have the same transformers. All generators have the same equipment, including the exciter and AVR. It should be noted that regulator settings were set separately in order to create the possibility of a situation when settings may vary during the disturbance.
The rated parameters of the generators are shown in Table 3.

Table 3.
Rated parameters of generators.
The active power signals of the power plant under consideration are shown in Figure 8.
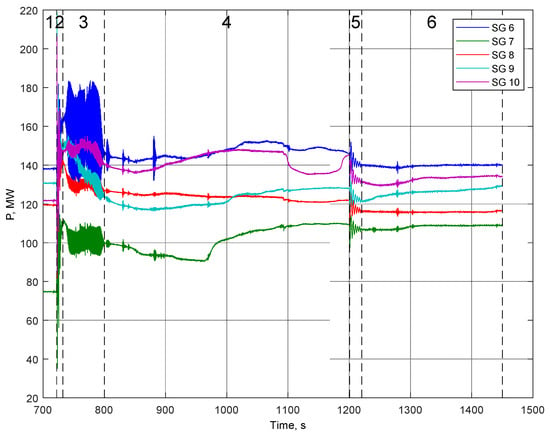
Figure 8.
Active power signals.
The time interval of the disturbance can be divided into six distinctive sub-intervals:
- 700–722.18 s: pre-disturbance steady state.
- 722.18–732.30 s: short damped oscillation transient that followed after separation of the isolated area and load shedding.
- 732.30–800 s: long under-damped oscillation that resulted from the initial damped one.
- 800–1200.66 s: gradual frequency recovery that preceded resynchronization.
- 1200.66–1220.44 s: oscillation transient as a consequence of resynchronization.
- 1220.44–1450 s: post-disturbance steady state.
4.2. Analysis of LFO
The decomposition results are extracted based on the dominant modes. It is done based on the amplitude value and average mode frequency value with the frequency range under consideration. An example of the first mode parameters for generator 6 during the third sub-interval is shown in Figure 9.
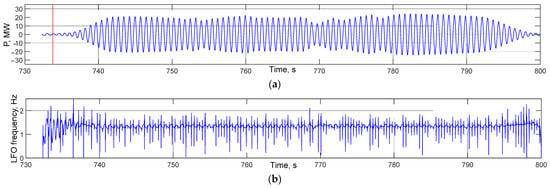

Figure 9.
Sub-interval 3, generator 6, active power: mode 1: (a) first mode signal; (b) LFO frequency; (c) LFO magnitude.
The results of active power LFO analysis are presented in Table 4.

Table 4.
Results of LFO analysis.
According to the results of the LFO analysis, it can be seen that the parameters of the LFO that occurred after the initial disturbance (sub-interval 2) do not exceed the limits. However, the long overdamped oscillations that occurred afterward (sub-interval 3) presented a threat to the equipment, the power plant, and the isolated grid.
These oscillations were not caused by the disturbance; it is for this reason that their analysis is of great importance. The active power output of the generators has been dropping insignificantly during the LFO: the power drop for generator 6 was about 15 MW, the power drop for generators 7 and 8 was about 10 MW, the power drop for generator 9 was about 25 MW, and the power drop for generator 10 was less than 10 MW.
The oscillations of the generators themselves and between generators can be distinguished during sub-interval 2 at frequencies of 1 and 0.5 Hz, respectively. The same types of oscillations can be extracted from sub-interval 3 at a frequency of 1.3 Hz. Local oscillations with a frequency of 0.3 Hz were found during sub-interval 5, whereas inter-tie oscillations of a frequency equal to 0.3 Hz were caused by power system restoration.
5. Conclusions
The ubiquity of LFOs in power systems and their threat are of great importance including the parameters of the LFOs–frequency, amplitude, and damping factor. The two factors (spread and threat) have a huge impact on the selection of possible control actions to prevent LFOs from occurring and expanding, thus mitigating their adverse effect on power system operation. Moreover, any information and statistics regarding the occurrence of LFOS must be recorded and analyzed for the further retrospective analysis of disturbances followed up by oscillatory transients. Examples of such data include finding interconnected groups of generators and/or facilities, tracking the chronology of oscillations development, etc.
In this paper, methods of LFO express analysis and LFO detailed analysis were developed. The proposed approaches meet the requirements of the problems under investigation to the fullest extent due to consideration of the drawbacks of existing methods. The method of sliding statistical segments was developed for the purpose of LFO express analysis, which includes the estimation of duration and other parameters of an LFO. This method makes it possible to estimate the amplitude and frequency of LFOs that can change in real-time without a loss in effectiveness. That means that the proposed method is more effective than the DFT-based method of spectral analysis. In addition, the method does not require additional procedures of disturbance detection and trend elimination, which also improves the response time.
The developed methods, namely frequency-based EMD and modified HT, are capable of dominant modes extraction and the estimation of mode parameters. Unlike the classical version of EMD and other modifications, frequency-based EMD also demonstrates fewer computational costs, which enables it to be used in real-time. Thus, the problem of the detailed analysis of LFOs can be effectively solved using a combination of this method together with the modified HT, since the modified HT does not require having the whole analyzed signal, unlike the classical EMD. At the same time, the modified HT makes it possible to estimate the parameters of the oscillation components with high accuracy.
The paper presents an accelerated method for the analysis of LFOs based on the application of the theory of mathematical statistics. Methods of express analysis and in-depth analysis of the LFO are developed. By taking into account the identified shortcomings of existing approaches, the proposed approaches fully meet the requirements of the tasks of analyzing the modes of power systems. The paper suggests the following settings for the developed method:
- Approximation interval for searching for extremes by the sliding pairs method [55]: 50 quanta;
- Approximation step for finding extremes by the sliding parabola method [55]: 20 quanta.
Testing of the developed method of LFO analysis was performed on real signals received from transient recorders installed at a large power plant. During the experiment, the parameters of the first dominant mode of the oscillatory process of the active power of each of the synchronous generators of the power plant under consideration were obtained.
The proposed criteria and the corresponding threshold values for assessing the risk of LFOs are designed to inform personnel in a timely manner about the occurrence of LFOs. Two stages of threshold values and time exposures are set taking into account the exclusion of false positives. Future studies will be aimed at the development of a tuning correction technique for power system stabilizers (PSS) for different parameters of LFOs that occur in the technological development and expansion of power systems.
Author Contributions
All authors contributed equally. All authors have read and agreed to the published version of the manuscript.
Funding
This study is supported via funding from prince Sattam bin Abdulaziz University Project number (PSAU/2023/R/1444).
Data Availability Statement
Not Applicable.
Conflicts of Interest
The authors declare no conflict of interest.
References
- Zhang, X.; Chen, J.; Zhang, G.; Wang, L.; Qiu, R.; Liu, Z. An Active Oscillation Compensation Method to Mitigate High-Frequency Harmonic Instability and Low-Frequency Oscillation in Railway Traction Power Supply System. IEEE Access 2018, 6, 70359–70367. [Google Scholar] [CrossRef]
- Zhao, Y.; Zhang, J.; Zhao, Q. Online Monitoring of Low-Frequency Oscillation Based on the Improved Analytical Modal Decomposition Method. IEEE Access 2020, 8, 215256–215266. [Google Scholar] [CrossRef]
- Fan, C.; Chen, G.; Chen, Z.; Shi, H.; Liu, C.; Teng, Y. Frequency Oscillation Analysis of Power System With Multiple Governor Deadbands. IEEE Access 2020, 8, 88085–88092. [Google Scholar] [CrossRef]
- Saadatmand, M.; Gharehpetian, G.B.; Moghassemi, A.; Guerrero, J.M.; Siano, P.; Alhelou, H.H. Damping of Low-Frequency Oscillations in Power Systems by Large-Scale PV Farms: A Comprehensive Review of Control Methods. IEEE Access 2021, 9, 72183–72206. [Google Scholar] [CrossRef]
- Shu, Y.; State Grid Corporation of China; Zhou, X.; Li, W. China Electric Power Research Institute Analysis of low frequency oscillation and source location in power systems. CSEE J. Power Energy Syst. 2018, 4, 58–66. [Google Scholar] [CrossRef]
- Hashmy, Y.; Yu, Z.; Shi, D.; Weng, Y. Wide-Area Measurement System-Based Low Frequency Oscillation Damping Control Through Reinforcement Learning. IEEE Trans. Smart Grid 2020, 11, 5072–5083. [Google Scholar] [CrossRef]
- Rodriguez-Amenedo, J.L.; Gomez, S.A. Damping Low-Frequency Oscillations in Power Systems Using Grid-Forming Converters. IEEE Access 2021, 9, 158984–158997. [Google Scholar] [CrossRef]
- Alzakkar, A.; Vladimirovich, M.V.; Samofalov, Y.; Ildar, I.; Valeev, I. The impact of electrical interconnection between countries on the stability of electrical power systems. In Proceedings of the 2022 4th International Youth Conference on Radio Electronics, Electrical and Power Engineering (REEPE), Moscow, Russia, 17–19 March 2022; pp. 1–6. [Google Scholar] [CrossRef]
- Amrr, S.M.; Asghar, M.S.J.; Ashraf, I.; Meraj, M. A Comprehensive Review of Power Flow Controllers in Interconnected Power System Networks. IEEE Access 2020, 8, 18036–18063. [Google Scholar] [CrossRef]
- Shi, Z.; Wang, W.; Huang, Y.; Li, P.; Dong, L. Simultaneous optimization of renewable energy and energy storage capacity with hierarchical control. CSEE J. Power Energy Syst. 2022, 8, 95–104. [Google Scholar] [CrossRef]
- Hu, J.; Liu, X.; Shahidehpour, M.; Xia, S. Optimal Operation of Energy Hubs With Large-Scale Distributed Energy Resources for Distribution Network Congestion Management. IEEE Trans. Sustain. Energy 2021, 12, 1755–1765. [Google Scholar] [CrossRef]
- Jena, C.; Guerrero, J.M.; Abusorrah, A.; Al-Turki, Y.; Khan, B. Multi-Objective Generation Scheduling of Hydro-Thermal System Incorporating Energy Storage With Demand Side Management Considering Renewable Energy Uncertainties. IEEE Access 2022, 10, 52343–52357. [Google Scholar] [CrossRef]
- Chen, X.; Du, W.; Wang, H.F. Power system angular stability as affected by the reduced inertia due to wind displacing synchronous generators. In Proceedings of the 2017 2nd International Conference on Power and Renewable Energy (ICPRE), Chengdu, China, 20–23 September 2017; pp. 402–406. [Google Scholar] [CrossRef]
- Schiffer, J.; Aristidou, P.; Ortega, R. Online Estimation of Power System Inertia Using Dynamic Regressor Extension and Mixing. IEEE Trans. Power Syst. 2019, 34, 4993–5001. [Google Scholar] [CrossRef]
- Kapetanaki, A.; Levi, V.; Buhari, M.; Schachter, J.A. Maximization of Wind Energy Utilization Through Corrective Scheduling and FACTS Deployment. IEEE Trans. Power Syst. 2017, 32, 4764–4773. [Google Scholar] [CrossRef]
- Li, X.; Wang, L.; Yan, N.; Ma, R. Cooperative Dispatch of Distributed Energy Storage in Distribution Network with PV Generation Systems. IEEE Trans. Appl. Supercond. 2021, 31, 1–4. [Google Scholar] [CrossRef]
- The influence of virtual synchronous generators on low frequency oscillations. CSEE J. Power Energy Syst. 2020, 8, 1029–1038. [CrossRef]
- Begovic, M. Inter-Area Oscillations in Power Systems: A Nonlinear and Nonstationary Perspective (Messina, A.R.) [Book Reviews]. IEEE Power Energy Mag. 2011, 9, 76–77. [Google Scholar] [CrossRef]
- Rogers, G. Power System Oscillations; Springer Science & Business Media: Berlin/Heidelberg, Germany, 2012. [Google Scholar]
- Saleem, B.; Badar, R.; Manzoor, A.; Judge, M.A.; Boudjadar, J.; Islam, S.U. Fully Adaptive Recurrent Neuro-Fuzzy Control for Power System Stability Enhancement in Multi Machine System. IEEE Access 2022, 10, 36464–36476. [Google Scholar] [CrossRef]
- Prakash, A.; Kumar, K.; Parida, S. Energy Capacitor System Based Wide-Area Damping Controller for Multiple Inter-Area Modes. IEEE Trans. Ind. Appl. 2022, 58, 1543–1553. [Google Scholar] [CrossRef]
- Liu, H.; Qi, Y.; Zhao, J.; Bi, T. Data-Driven Subsynchronous Oscillation Identification Using Field Synchrophasor Measurements. IEEE Trans. Power Deliv. 2021, 37, 165–175. [Google Scholar] [CrossRef]
- Satheesh, R.; Chakkungal, N.; Rajan, S.; Madhavan, M.; Alhelou, H.H. Identification of Oscillatory Modes in Power System Using Deep Learning Approach. IEEE Access 2022, 10, 16556–16565. [Google Scholar] [CrossRef]
- Zhang, Y.; Zhao, P.; Han, Z.; Yang, L.; Chen, J. Low Frequency Oscillation Mode Identification Algorithm Based on VMD Noise Reduction and Stochastic Subspace Method. In Proceedings of the 2022 Power System and Green Energy Conference, Online, 25–27 August 2022; pp. 848–852. [Google Scholar] [CrossRef]
- Dong, X.; Luo, F.; Wu, C.; He, S. An Identification Method for Dominant Mode of Low Frequency Oscillation in Power System. In Proceedings of the 2022 IEEE 5th International Electrical and Energy Conference (CIEEC), Nanjing, China, 27–29 May 2022; pp. 1404–1409. [Google Scholar] [CrossRef]
- Pu, J.; Tang, Y.; Shi, X.; Zhang, J.; Ye, H.; Liu, Y. Oscillation source location based on abnormal signal analysis. In Proceedings of the 2013 IEEE PES Asia-Pacific Power and Energy Engineering Conference (APPEEC), Hong Kong, China, 8–11 December 2013; pp. 1–5. [Google Scholar] [CrossRef]
- Wilson, D.H. Continuous damping measurement for power system analysis. In 2005 IEEE Russia Power Tech; IEEE: Piscataway, NJ, USA, 2005; pp. 1–6. [Google Scholar] [CrossRef]
- Koellner, K.M.; Burks, S.; Blevins, B.; Nuthalapati, S.N.; Rajagopalan, S.; Holloway, M.L. Synchrophasors Across Texas: The Deployment of Phasor Measurement Technology in the ERCOT Region. IEEE Power Energy Mag. 2015, 13, 36–40. [Google Scholar] [CrossRef]
- Iwueze, I.S.; Nwogu, E.C.; Johnson, O.; Ajaraogu, J.C. Uses of the Buys-Ballot Table in Time Series Analysis. Appl. Math. 2011, 2, 633–645. [Google Scholar] [CrossRef]
- Chigozie, O.; Egwim, K.C.; Eke, C.N.; Onuoha, D.O. Buys-Ballot Modeling of Nigerian Domestic Crude Oil Pro-duction (2006–2012). West Afr. J. Ind. Acad. Res. 2013, 8, 160–171. [Google Scholar]
- Gabor, D. Theory of communication. Part 1: The analysis of information. J. Inst. Electr. Eng.-Part III Radio Commun. Eng. 1946, 93, 429–441. [Google Scholar] [CrossRef]
- Pei, S.-C.; Hsue, W.-L.; Ding, J.-J. Discrete Fractional Fourier Transform Based on New Nearly Tridiagonal Commuting Matrices. IEEE Trans. Signal Process. 2006, 54, 3815–3828. [Google Scholar] [CrossRef]
- Suresh, K.; Sreenivas, T.V. Block Convolution Using Discrete Trigonometric Transforms and Discrete Fourier Transform. IEEE Signal Process. Lett. 2008, 15, 469–472. [Google Scholar] [CrossRef]
- Hsue, W.-L.; Chang, W.-C. Real Discrete Fractional Fourier, Hartley, Generalized Fourier and Generalized Hartley Transforms With Many Parameters. IEEE Trans. Circuits Syst. I Regul. Pap. 2015, 62, 2594–2605. [Google Scholar] [CrossRef]
- Fedorenko, S.V. Efficient Syndrome Calculation via the Inverse Cyclotomic Discrete Fourier Transform. IEEE Signal Process. Lett. 2019, 26, 1320–1324. [Google Scholar] [CrossRef]
- Avramenko, D.V.; Andrejev, V.G. Evaluation of the spectral mode of the photometric signal by the two-sided Prony method. In Proceedings of the 2021 10th Mediterranean Conference on Embedded Computing (MECO), Budva, Montenegro, 7–10 June 2021; pp. 1–4. [Google Scholar] [CrossRef]
- Wang, J.-L.; Wang, L.-M. Power System Dynamic Phasor Extraction Method Based on Prony and Improved State Model. In Proceedings of the 2020 3rd International Conference on Advanced Electronic Materials, Computers and Software Engineering (AEMCSE), Shenzhen, China, 24–26 April 2020; pp. 897–900. [Google Scholar] [CrossRef]
- Almunif, A.; Fan, L. PMU Measurements for Oscillation Monitoring: Connecting Prony Analysis with Observability. In Proceedings of the 2019 IEEE Power & Energy Society General Meeting (PESGM), Atlanta, GA, USA, 4–8 August 2019; pp. 1–5. [Google Scholar] [CrossRef]
- Sun, X.-Y.; Dong, J.-Q.; Zhang, W.-L.; Xing, H. Application Of Synchroqueezing Wavelet Transform In Bolt Anchorage Detection Signal Analysis. In Proceedings of the 2020 International Conference on Wavelet Analysis and Pattern Recognition (ICWAPR), Zurich, Switzerland, 27–28 July 2020; pp. 21–25. [Google Scholar] [CrossRef]
- Soveiko, N.; Gad, E.; Nakhla, M. A Wavelet-Based Approach for Steady-State Analysis of Nonlinear Circuits With Widely Separated Time Scales. IEEE Microw. Wirel. Compon. Lett. 2007, 17, 451–453. [Google Scholar] [CrossRef]
- Xiao-Fei, L.; Li-Qun, S. Power system load forecasting by improved principal component analysis and neural network. In Proceedings of the 2016 IEEE International Conference on High Voltage Engineering and Application (ICHVE), Chengdu, China, 19–22 September 2016; pp. 1–4. [Google Scholar] [CrossRef]
- Kalra, M.; Kumar, S.; Das, B. Moving Ground Target Detection With Seismic Signal Using Smooth Pseudo Wigner–Ville Distribution. IEEE Trans. Instrum. Meas. 2019, 69, 3896–3906. [Google Scholar] [CrossRef]
- Wei, H.; Qi, T.; Feng, G.; Jiang, H. Comparative Research on Noise Reduction of Transient Electromagnetic Signals Based on Empirical Mode Decomposition and Variational Mode Decomposition. Radio Sci. 2021, 56, e2020RS007135. [Google Scholar] [CrossRef]
- Yang, H.-W.; Jeng, S.-K.; Young, H.-W.V.; Lin, C.; Wang, Y.-H.; Hu, K.; Lo, M.-T. A Minimum Arclength Method for Removing Spikes in Empirical Mode Decomposition. IEEE Access 2019, 7, 13284–13294. [Google Scholar] [CrossRef]
- Yu, B.; Yang, X. The Hilbert Transform of B-Spline Wavelets. IEEE Signal Process. Lett. 2021, 28, 693–697. [Google Scholar] [CrossRef]
- Grujic, D.N. Numerical Hilbert Transform Algorithm for Causal Interpolation of Functions Represented by Cubic and Exponential Splines. IEEE Access 2021, 9, 136702–136709. [Google Scholar] [CrossRef]
- Yi, J.; Uang, Q.H.; Jing, S.; Ding, L. An Anti Mode Mixing EMD Algorithm for Detecting the Characteristics of Low Frequency Oscillations in Power System. TELKOMNIKA Indones. J. Electr. Eng. 2013, 11, 4742–4750. [Google Scholar] [CrossRef]
- Yang, D.; Rehtanz, C.; Li, Y.; Tang, W. A novel method for analyzing dominant oscillation mode based on improved EMD and signal energy algorithm. Sci. China Technol. Sci. 2011, 54, 2493–2500. [Google Scholar] [CrossRef]
- Wen, H.; Guo, S.; Teng, Z.; Li, F.; Yang, Y. Frequency Estimation of Distorted and Noisy Signals in Power Systems by FFT-Based Approach. IEEE Trans. Power Syst. 2014, 29, 765–774. [Google Scholar] [CrossRef]
- Sanchez-Gasca, J.J.; Chow, J.H. Performance comparison of three identification methods for the analysis of electrome-chanical oscillations. IEEE Trans. Power Syst. 1999, 14, 995–1002. [Google Scholar] [CrossRef]
- Huang, N.E.; Shen, Z.; Long, S.R.; Wu, M.C.; Shih, H.H.; Zheng, Q.; Yen, N.-C.; Tung, C.C.; Liu, H.H. The empirical mode decomposition and the Hilbert spectrum for nonlinear and non-stationary time series analysis. Proc. R. Soc. Lond. Ser. A Math. Phys. Eng. Sci. 1998, 454, 903–995. [Google Scholar] [CrossRef]
- Qing, L.; Mitani, Y. Application of HHT for oscillation mode analysis in power system based on PMU. In Proceedings of the 2011 2nd International Conference on Electric Power and Energy Conversion Systems (EPECS), Sharjah, United Arab Emirates, 15–17 November 2011; pp. 1–4. [Google Scholar] [CrossRef]
- Li, H.Z.; Li, C.; Wang, Z. Direct damped sine atomic sparse decomposition method that based on the combinatorial optimization of chaotic and pseudo-newton and its application to low-frequency oscillation analysis. Proc. CSEE 2018, 38, 148–157. (In Chinese) [Google Scholar]
- Chen, G.; Wang, Z. A signal decomposition theorem with Hilbert transform and its application to narrowband time series with closely spaced frequency components. Mech. Syst. Signal Process. 2012, 28, 258–279. [Google Scholar] [CrossRef]
- Kovalenko, P.Y.; Senyuk, M.D.; Mukhin, V.I.; Kornilova, D.D. Detection Event Inception Point Algorithms Based on Instantaneous Point-on-wave Measurements. In Proceedings of the 2020 Ural Smart Energy Conference (USEC), Ekaterinburg, Russia, 13–15 November 2020; pp. 151–154. [Google Scholar] [CrossRef]
- Follum, J.; Pierre, J. Detection of periodic forced oscillations in power systems. In Proceedings of the 2016 IEEE Power and Energy Society General Meeting (PESGM), Boston, MA, USA, 17–21 July 2016; p. 1. [Google Scholar] [CrossRef]
Disclaimer/Publisher’s Note: The statements, opinions and data contained in all publications are solely those of the individual author(s) and contributor(s) and not of MDPI and/or the editor(s). MDPI and/or the editor(s) disclaim responsibility for any injury to people or property resulting from any ideas, methods, instructions or products referred to in the content. |
© 2023 by the authors. Licensee MDPI, Basel, Switzerland. This article is an open access article distributed under the terms and conditions of the Creative Commons Attribution (CC BY) license (https://creativecommons.org/licenses/by/4.0/).