Abstract
Scientific studies confirm the existence of a crisis caused by climate change, in which global causes produce local effects. Despite climate agreements, greenhouse gas emissions continue to fall short of targets to limit global warming. There is still a need for comparable data for Sustainable Development Goal (SDG) 13—Climate Action. The motivation of the research is to provide data for decision-making and to propose solutions to address the climate crisis. The article aims to propose a Fuzzy Logic algorithm to evaluate the SDG13 indicators and to deepen the discussion on climate change. The research is applied explanatory with a combined approach (quantitative-qualitative) through modeling, simulation, and case studies. As a result, the OWA operator ranks 10 Ibero-American countries to SDG13, indicating Colombia, Peru, and Cuba in the first positions. The main contributions are the reduction of identified knowledge gaps and proposals for action for policy and decision-makers. A limitation of this study would be the number of participating countries. The authors indicate future lines of research.
MSC:
03E75
1. Introduction
Climate change is one of the most complex problems we face [1] because its causes and effects are interconnected in various areas, such as economic, social, environmental, political, and health [2]. In addition, it is a dynamic problem marked by increasingly frequent and intense meteorological events [3]. Carbon dioxide (CO2) emissions are the major contributor to global warming [4], and its effects cause sea level rise [5], loss of biodiversity [6], and reduced quality of life [7]. One of the alternative solutions to this problem would be using renewable energy, an effective policy to mitigate global warming in the South Asian region [8].
Approximately 10% of the world’s population lives in low-lying coastal regions that may be affected by sea level rise [9], leading to infiltration of seawater into fresh groundwater reserves, degradation of croplands, and accelerated coastal erosion [9]. Research also reveals an increase in concerns about severe heat waves [10], forest fires [11], heavy rains [12], and droughts [13], leading to an increase in casualties [14] and social tensions [15]. In the same direction, research [15] carried out in Sicily, Italy, revealed climatic effects with the constant loss of fertile soil for the agricultural sector and advancing phenomena such as drought and desertification. The same authors warned of the risk of severe socioeconomic consequences for this region shortly [15].
Natural imbalances bring other implications, such as the costs associated with infrastructure destruction [16], floods [3], and reduction of agricultural crop yields [17]. In addition, drought is expected to displace 700 million people by 2030 [18], which may increase social, political, and economic tensions worldwide [19]. The most appropriate measures are to be found in adaptation and mitigation strategies [19], which will generate economic costs. In this direction, it is ratified that proactive adaptation has been less burdensome in life cycle cost than reactive adaptation strategies [16]. Therefore, a crisis caused by climate change is confirmed, in which global causes produce local effects, and we are all affected. The solutions will depend on an urgent effort by all.
As an alternative to solve these problems, the United Nations (UN) launched the 17 Sustainable Development Goals (SDGs) in 2015. These goals seek solutions to significant global environmental, economic and social challenges, designing an agenda for 2030 [20]. SDG13—Climate Action, seeks to adopt urgent measures to address climate change and its effects and is composed of three targets and six specific indicators [21]. Along these lines, this goal has become the primary orientation for countries in this area [20]. Despite the efforts, energy-related CO2 emissions by 2021 increased by 6%, reaching the highest level in history [18]. To avoid the worst consequences of climate change, as stated in the Paris Agreement [22], global greenhouse gas (GHG) emissions should reach zero by 2050. However, GHG emissions will increase by almost 14% by 2030 [18]. Therefore, this research confirms the relevance of SDG13.2.2 (total GHG emissions per year) among the other indicators for minimizing the impacts of global warming [4,22]. However, this relevance needs to be present in the configuration of SDG13 [21] as the indicators have the same weight. A theoretical contribution would be establishing specific weights to the indicators correcting this problem.
The UN [18] acknowledges some progress in data availability for the SDGs, with, for example, SDG3 (health) and SDG7 (energy) having the highest data availability, with more than 80% of countries having at least one data point since 2015. However, despite progress, the need for comparable data for SDG13 persists, as only 20% of countries have data for this target [18]. In this sense, the availability of data on SDG 13 would benefit policymakers in formulating public policies tailored to the reality of each country, and these actions can generate a more significant impact on society. For these reasons, the primary motivation of this article is to provide comparable data on SDG13 and simultaneously propose solutions to address climate change and reduce the first knowledge gap.
On the other hand, studies [20,23] highlight that policy and decision-makers need to understand the correlation between the SDGs, mainly climate change (SDG13), which influences natural resource management (SDG14 and SDG15) and food production (SDG2). Conversely, climate stability (SDG13) and prevention of ocean acidification (SDG14) will support sustainable food production and fisheries (SDG2) [24]. Therefore, the manuscript will seek to moderate this second knowledge gap by broadening the discussion on climate change and its importance among the SDGs, followed by recommendations that positively impact society.
Additionally, researchers [25] have proposed a bounded framework for the planet, identifying a safe operating space for humanity in which climate change and the integrity of the biosphere occupy a central place. However, the framework needs to include how societies should develop. The same authors [25] point out that the human factor should be a priority in public policies concerning climate change. In this sense, this article will advance the frontier of knowledge with proposals to reduce this third identified gap.
Furthermore, this research identified the need to include weightings for the six SDG13 indicators, as each indicator has a different relevance to climate change [4,22]. Including weights would allow a more realistic comparison of SDG13 data and facilitate policymakers in formulating climate strategies and actions. For these reasons, the authors choose Fuzzy Logic [26] as an alternative methodological approach and apply the Ordered Weighted Averaging (OWA) operator [27] to reduce the fourth knowledge gap.
Fuzzy Logic [26] was born to guide decision models that reduce uncertainty and facilitate decision-making [28]. These models have practical applications ranging from consumption to intelligent products [29]. Their effectiveness also responds to new societal needs, such as sustainable development [20], climate change [30], and the COVID-19 pandemic [31]. In the case of the OWA operator, it is a practical algorithm for evaluation and prioritization [32]. It is also flexible in the modeling and simulation process since it is defined by a vector of weights and not by a single parameter [32]. Other researchers claim that this aggregation operator helps merge numerical information and decision-making problems [33]. Scientists applied the OWA operator to facilitate decision-making by public managers in sustainable transport [34]. Another study evaluated companies listed on the Lima Stock Exchange considering the level of compliance with the Principles of Good Corporate Governance [32] and in the decision-making of consumers in the city of Barcelona regarding the selection of groceries by neighborhoods that best suit their needs [35]. Finally, the literature review of this article also showed few publications of the OWA operator applied to climate change, evidencing the fifth knowledge gap and an opportunity for academic contribution. As a drawback, this algorithm depends on the quality of the information received [32], and to overcome this problem, the authors will use data from official sources to perform the calculations. In addition, the results will be validated by three academic specialists from Latin American universities.
This research is applied, explanatory, with a combined approach (quantitative-qualitative) through modeling and simulation, and case studies [36]. As an advantage, the combined method generates added value to the research since the modeling and simulation method is born to understand a real problem and provide solutions [37]. In addition, the case study based on official data is an empirical investigation of a contemporary phenomenon within its actual context [38]. Lastly, the combined research method supports model validation and generates interesting theoretical and practical implications [32]. Figure 1 presents the research classification.
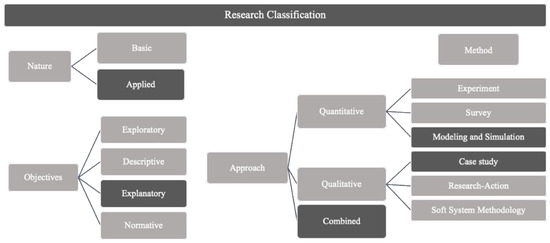
Figure 1.
Research classification. Source: [36].
In this context, the research aims to propose an algorithm to evaluate SDG13 indicators and to deepen the discussion on climate change. The research is novel because it includes weightings in the SDG13 indicators and evaluates the 10 Ibero-American countries by applying the OWA operator. As was found in the literature review, the OWA operator is the most recommended to meet the research objectives, and this algorithm was little applied to climate change. For these reasons, the research is a scientific novelty for reducing this knowledge gap regarding applying fuzzy logic algorithms to climate change.
The main results reveal a ranking of the countries regarding climate action, with Colombia, Peru, and Cuba in the top positions. As main contributions, at a theoretical level, the research advances the frontier of knowledge on climate change by reducing the five knowledge gaps identified. On a practical level, the study reveals a ranking of 10 Ibero-American countries concerning SDG13 and presents recommendations to policymakers that will positively impact society. A limitation would be the number of countries participating in the study, and future research lines may explore this algorithm’s application among other countries. The article is organized as follows. Section 2 explains the materials and methods. Section 3 presents the simulation results applying the OWA operator. Section 4 details a discussion of the results. Finally, Section 5 specifies the conclusions.
2. Materials and Methods
The section is organized into six parts to explain the materials and methods of the study. First, a literature review on climate change and OWA operators is presented. Second, the study sample is detailed, followed by the methodology. Next, the variables and measures used, and the data collection process is presented. Finally, the application of the OWA operator to SDG13 in Latin American countries is presented. Figure 2 shows the workflow for conducting scientific research.
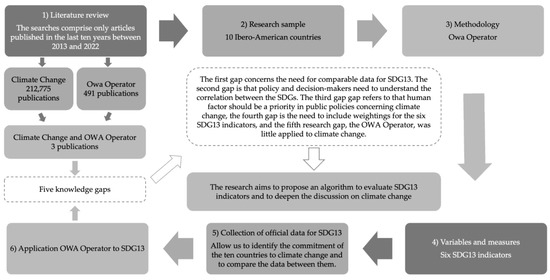
Figure 2.
Workflow for conducting scientific research. Source: Own elaboration.
2.1. Literature Review
The subsection presents the literature review supported by a bibliometric study on Climate Change and OWA operators, and it was conducted on 10 November 2022, through the Web of Science (WoS) database. The searches comprise only articles published in the last ten years between 2013 and 2022, with the keywords “Climate Change”, “OWA operator”, and the combination between “Climate Change” AND “OWA operator”. The results are presented below.
2.1.1. Climate Change
The results show the importance and academic interest in climate change in the last ten years with the number of articles published and citations. Figure 3 shows the distribution of 212,775 publications and 529,686 citations, confirming a positive trend in these two indicators.
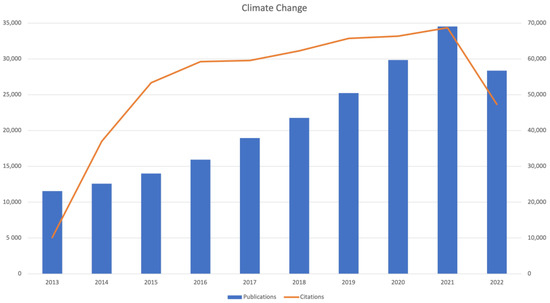
Figure 3.
Bibliometric study using the keywords “Climate change.” Source: WoS (2022).
The main areas of research on climate change are “Environmental Sciences Ecology” in the first instance, with 90,956 published articles. In second place is “Ecology” with 24,760, followed by “Meteorology Atmospheric Sciences” with 24,034 publications. Another bibliometric indicator shows the countries conducting the most research on the subject. In the first position is the USA with 61,941, followed by China with 37,691, and in the third position is England with 21,618 publications. Below is a summary of the three most cited articles on climate change.
First, with 4783 citations, the researchers [25] provide an in-depth analysis of the planetary boundary framework. The results indicate that climate change and biosphere integrity are centrally based on their fundamental importance to the Earth system. These two variables could drive the Earth system to a new state should they be substantially and persistently transgressed. The authors [25] caution that policy decisions must consider human dimensions, including equity. As the main contribution, the research identifies a safe operating space for humanity by establishing a framework of planetary boundaries [25].
Second, with 4480 citations, the authors [39] describe the general configuration of ERA5, which is based on the Integrated Climate Prediction System, which, when completed, will incorporate a detailed record of the global atmosphere, land surface, and ocean waves. The paper also assesses its features and performance, focusing on the publicly available dataset. The results indicate that the higher temporal and spatial resolution allows the detailed evolution of weather systems [39].
Third, with 3045 citations, researchers [40] present systematic analyses of the global disease burden. The results indicate that natural catastrophes claimed thousands of lives in various parts of the world between 2004 and 2015, such as 1870 Hurricane Katrina in the United States in 2005. In 2008, 138,000 by a cyclone in Myanmar, and more than 300 by floods in India in 2015 [40].
In summary, the most cited articles on climate change highlight the limits of the planet [25], the role of policy and decision-makers [25], the improvement in the weather system and climate prediction [39], and the consequences of climate change with deaths caused by natural disasters [40].
Finally, the bibliometric study identified four knowledge gaps in climate change. The first gap concerns the need for comparable data for SDG13 [18]. The second gap is that policy and decision-makers need to understand the correlation between the SDGs [20,23], the third gap refers to that human factor should be a priority in public policies concerning climate change [25], and the fourth gap is the need to include weightings for the six SDG13 indicators [4,22]. In this context, the research is scientifically relevant to reduce the identified gaps and propose solutions to climate change.
2.1.2. OWA Operator
The results of the bibliometric study show academic interest in the OWA operator over the last ten years with the number of articles published and citations. Figure 4 shows the distribution of 491 publications and 8751 citations, which confirms stability in the number of articles published annually and the high number of citations in this period.
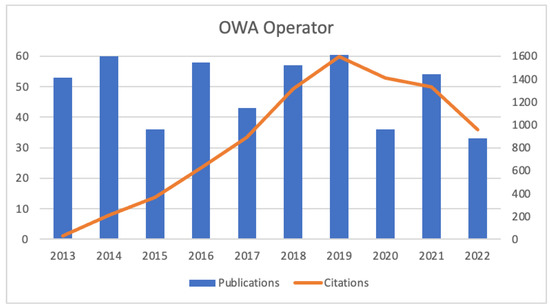
Figure 4.
Bibliometric study using the keywords “OWA operator.” Source: WoS (2022).
The main areas of research on OWA operators are “Computer Science” in the first position with 309 publications, “Engineering” occupies the second position with 100 published articles, and in third place is “Mathematics” with 76 publications. The countries with the most research on OWA operators are China, in first place with 249 published articles, Spain with 78 articles, and Chile, with 48 publications, in third place. Below is a summary of the three most cited articles on OWA operators.
In the first position, with 290 citations, the researchers [41] introduce the Hesitant Fuzzy Linguistic Term Sets (HFLTS) methodology, whose main advantage is facilitating computational processes with words in fuzzy multicriteria decision models. The article also presents a multicriteria decision problem of supplier selection solved with a Technique for Order Preference by Similarity to the Ideal Solution (TOPSIS) model that handles comparative linguistic expressions [41].
In the second position, with 217 citations, the authors [42] develop a method for Pythagorean multicriteria decision-making (MCDM) problems with aggregation operators and distance measures. In addition, the paper introduces a hybrid TOPSIS method for a Pythagorean fuzzy MCDM problem with the proposed operator as the basis. As an advantage, this method reflects the degrees of the attribute’s personal information and the decision maker’s attitude. It also provides a complete representation of the decision process by considering different scenarios according to their interests [42].
In the third position, with 199 citations, researchers [33] present the 2-tuple induced generalized linguistic generalized 2-tuple OWA (2-TILGOWA) operator. This aggregation operator uses generalized means, order-inducing variables in its argument reordering, and uncertain information evaluated with the 2-tuple linguistic representation model. The article highlights flexibility as the main advantage of this operator since a wide range of specific cases can be included, which allows for considering several different situations and selecting the one that best suits the interests of the decision maker [33].
In summary, the articles on OWA operator show new extensions and applications, such as in word computation processes [41], decision methods considering different scenarios with personal information of the decision maker [42], and finally, method with a qualitative approach based on linguistic evaluations [33].
2.1.3. Climate Change and OWA Operator
The results of the bibliometric study combining the topics “Climate Change” and “OWA operator” indicate only three research. This result shows that there are few studies compared to the searches for the terms separately. A summary of the articles in this combination is presented below.
In the first study, the researchers [43] employed the method to study climate change in some provinces of Iran using data from 15 synoptic stations. The results showed the usefulness of this algorithm, which takes into account the risk attitudes of the decision-maker, and helps environmental managers to cope with climate uncertainties [43]. The OWA operator showed acceptable performance and is recommended by the authors in other climate change studies [43].
In the second research [44] conducted in Spain, the results showed the OWA operator as a robust decision-making tool to assess the performance of future climate projections and to design sustainable policies under uncertainty and risk tolerance [44]. In addition, the methodology made it possible to address stakeholder attitudes and risk preferences regarding actions to be taken and to minimize uncertainties associated with other climate projection methods [44].
In the third study conducted in China, operator OWA measured agricultural carbon emissions in Fujian between 2008 and 2017 [45]. In addition, the present researcher’s recommendations to governments to reduce emissions include rational land development and utilization and optimization of land use structure. Other measures would be controlling the total amount of industrial land to avoid the severe shortage of arable land and improving the ecological carrying capacity of agricultural land [45].
Finally, the validity and reliability of the OWA operator applied to climate change, such as in environmental management, climate projections, and carbon measurements in agriculture, are confirmed. It should be noted that all three investigations used accurate data from official sources, which reinforces the use of the OWA operator in this research. Alternative methods or extensions of the OWA operator would be recommended in cases where the available information could be more precise or where numerical data cannot be analyzed [33].
In summary, the bibliometric study indicated 212,775 records for Climate Change, 491 for OWA operators, and three for the combination of two terms. The results reveal a trend of growth in the research over time and an increase in publications and citations. It reinforces the interest in this topic and advances the frontier of knowledge in these lines of research. In addition, the result indicates the existence of a fifth research gap, as the OWA operator was little applied to climate change. Therefore, this algorithm would be recommended to reduce the lack of comparable data to SDG13 [18], another study’s scientific merit.
2.2. Research Sample
The research sample comprises 10 Ibero-American countries, and the group comprises Argentina, Brazil, Chile, Colombia, Cuba, Ecuador, Mexico, Peru, Portugal, and Spain. These countries have historical, cultural, scientific, and economic ties and participate in the Ibero-American Intelligent Systems and Expert Computational Models Network project, project number 522RT0130, in the Ibero-American Program of Science and Technology for Development [46]. The project is a 4-year plan (2022–2025) with more than 60 researchers, integrating collaboration, cooperation, and synergy activities that seek to identify areas of competence where the applications of Fuzzy models can beneficially interfere and maximize social and productive benefits in the region with an Ibero-American vision [46]. This project [46] has four phases: Diagnosis and Training (Year 1), Algorithm Production (Year 2), Consolidation and Synergy (Year 3), and Implementation and Transfer (Year 4). In this context, this research is in Phase 1 of diagnosis, and the literature review identified the need for comparable SDG13 data among the ten countries. Therefore, this research is relevant to this project, and the results will be helpful for the participating countries. For these reasons, ten countries were selected for this research.
2.3. Methodology
According to other studies [32,33,34], the OWA operator [27] is a suitable algorithm for evaluation and prioritization, and for these reasons, the authors will apply it in this research. In 1998, Ronald Robert Yager established the OWA aggregation operators, generalizing a model that uses four decision criteria: Optimistic Criterion, Pessimistic Criterion or Wald Criterion, Hurwicz Criterion, and Laplace Criterion [26]. According to the same author [27], an OWA operator of dimension n is an application of de , which has an associated weighting vector, as:
where
and is the kth largest element of the collection .
Formula (1) indicates that each element is associated with a weighting vector. In other words, we are evaluating six SDG13 indicators; each indicator is weighted according to the established criteria, and the sum of the weights must equal 1. Table 1 shows the weights (W1, W2, …, W6) for each SDG13 indicator. Formula (2) presents the level of adequacy to a given criterion based on the sum of the corresponding weighting vector multiplied by the largest element of collection x, as indicated in Formula (1). In this research, the calculation of the OWA operator is performed by applying Formula (2), using the values presented in Table 1 (weighting vector) and Table 2 (evaluation of each indicator by country). Other researchers [34] agree that a critical aspect of OWA operators is reordering weighting. For, an aggregate is not associated with a weight, but rather the weight is associated with an ordered position j of the arguments. Therefore, this ordering introduces nonlinearity in the aggregation process [34,47].

Table 1.
Vector of weights determined of the SDG13 indicators.
Table 2.
Fuzzy subset of the six SDG13 indicators.
2.4. Variables and Measures
The SDG13—Climate Action indicators will be the OWA operator’s application variables. SDG13 is composed of three targets and six specific indicators [21]. It should be noted that indicators 13.1.1 and 13.3.1 are composed of four additional indicators. Table A1 presents the SDG13 targets and indicators in detail. The study uses the endecadary scale [48] to facilitate comparability between indicators. Table A2 presents the scale used in the research. Thus, the value closest to 1 expresses an approach to SDG13, and the value closest to 0 shows a move away from this target.
2.5. Collection of Official Data for SDG13
Official data collection [49,50,51] on the six SDG13 indicators occurred in September and October 2022 and referred to the base year of 2020. The authors chose this baseline for the study as 2020 contemplates more data available for the ten countries. The data obtained are detailed below.
Figure 5 presents the results of each country on the SDG13.1.1 indicator in 2020. In this case, Chile and Mexico present the best results with a comparative approach to SDG13. On the other hand, Cuba and Brazil moved away from this target due to the need for more available data on the additional indicators 13.1.1a and 13.1.1b presented in Table A3. As recommendations, policymakers should keep information on SDG13 updated in official databases [49,50,51] and invest in information technology systems for data collection and processing [18]. Second, adaptation and mitigation strategies are the most appropriate measures to improve the results of indicator 13.1.1 [19]. In this case, governments should work proactively [16] by strengthening the resilience of communities to natural disasters with investment in protective infrastructure in flood risk areas [52]. Another strategy would be to facilitate the relocation of people living in vulnerable areas to safer places [53,54].
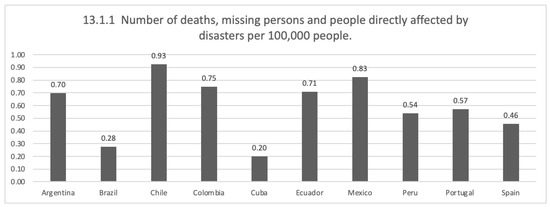
Figure 5.
SDG13.1.1 Indicator (2020). Source: Own elaboration based on [49,50,51].
Figure 6 presents the data for SDG13.1.2 in 2020. In this case, Colombia, Mexico, and Spain show the best results with a coefficient of 1.00, close to SDG13. On the other hand, Ecuador shows a greater distance from this target with a coefficient of 0.68. In terms of strategic planning, the Sendai Framework is essential, as it recognizes the strong connection between health and disasters and promotes the concept of health resilience at all times [55]. However, the same researchers warn that measuring health-related indicators is a challenge, as health data recording in disasters needs to be standardized [55]. For this reason, governments should strengthen care and health data records [18].
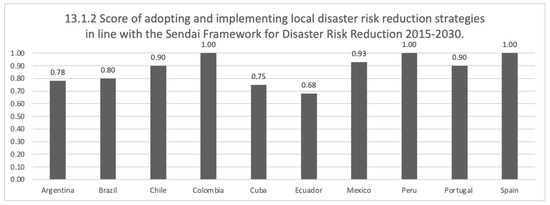
Figure 6.
SDG13.1.2 Indicator (2020). Source: Own elaboration based on [49,50,51].
Figure 7 shows each country’s information on the SDG13.1.3 indicator in 2020. In this case, Peru presents the best result with a maximum coefficient of 1.00 and a comparative approach to SDG13. On the other hand, Mexico shows a distance from this target with a coefficient of 0.30. One of the reasons for this low performance is the need for more available data. Therefore, recommendations to central governments involve more significant participation of local governments [56] and provide data on this indicator.
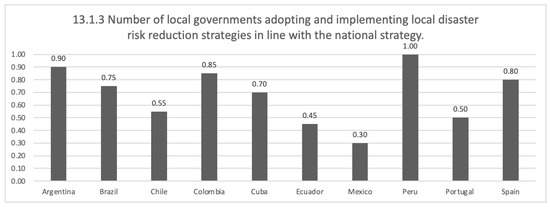
Figure 7.
SDG13.1.3 Indicator (2020). Source: Own elaboration based on [49,50,51].
Figure 8 presents each country’s data on SDG13.2.1 in 2020. In this case, all ten countries present a comparative approach to SDG13 with the highest score. However, a critical analysis of this result is warranted, as indicator 13.2.1 refers to the establishment or implementation of policy, strategy, or plan and does not identify which countries are in the implementation or planning phase. A recommendation would be to create additional indicators to provide this information in greater detail.
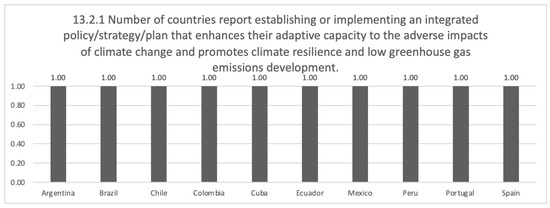
Figure 8.
SDG13.2.1 Indicator (2020). Source: Own elaboration based on [49,50,51].
Figure 9 shows the information on the SDG13.2.2 indicator in 2020. In this case, Cuba and Portugal present the best results with a comparative approach to SDG13. On the other hand, Brazil is a move away from this target. According to other research [4,25], this indicator would be the most important to SDG13 since CO2 emissions are responsible for global warming [4] and the climate crisis. Therefore, SDG13.2.2 should be the priority of policy and decision-makers, such as renewable energies [8], circular economy [57], and optimization of agricultural areas [45].
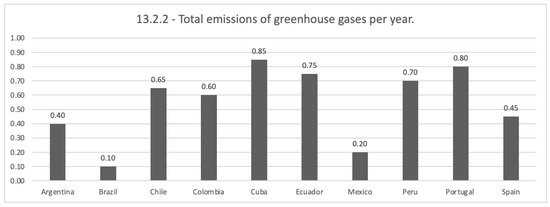
Figure 9.
SDG13.2.2 Indicator (2020). Source: Own elaboration based on [49,50,51].
Figure 10 reveals the results of indicator SDG13.3.1 in 2020. In this case, Cuba, Brazil, and Spain present the best results with a comparative approach to SDG13, which shows the importance of education in climate change awareness. On the other hand, countries such as Argentina, Chile, Ecuador, and Portugal presented the worst results due to the need for more available data in the additional indicators presented in Table A4. Proposals for action would be to invest in climate change education curricula [58] and improve data management [59].
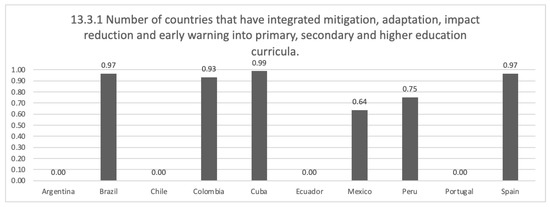
Figure 10.
SDG13.3.1 Indicator (2020). Source: Own elaboration based on [49,50,51].
Finally, Figure 11 presents the consolidated data for the ten countries in the three SDG13 targets in 2020. In this case, Colombia presents the best result for target 13.1 with a coefficient of 0.87, followed by Peru with 0.85, Argentina and Chile with 0.79. The result also reveals Cuba leading in target 13.2 with a coefficient of 0.93 and target 13.3 with a coefficient of 0.99.
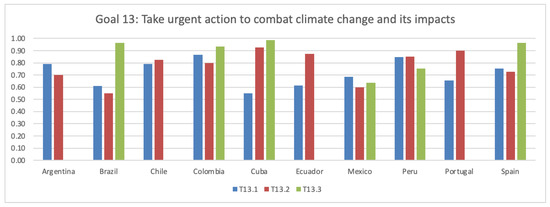
Figure 11.
SDG13 Targets (2020). Note: T13.1 Strengthen resilience and adaptive capacity to climate-related hazards and natural disasters in all countries; T13.2 Integrate climate change measures into national policies, strategies, and planning; 13.3 Improve education, awareness-raising and human and institutional capacity on climate change mitigation, adaptation, impact reduction, and early warning. Source: Own elaboration based on [49,50,51].
In summary, the data collected on the SDG13 indicators allow us to identify the commitment of the ten countries to climate change and to compare the data between them. However, the literature review [4,25] showed that each indicator has a different relevance, but they are calculated with the same weight [49,50,51]. As an opportunity to improve SDG13, the authors propose the inclusion of different weights for each indicator based on official data and scientific studies [4,18,25], which will allow prioritization of the most relevant indicators to climate change and a more realistic ranking of countries. Finally, the results of this proposal can guide policymakers and decision-makers in the solutions to address the climate crisis. The application of the OWA operator to SDG13 is detailed below as the authors’ theoretical contribution to climate change.
2.6. Application of the OWA Operator to SDG13
First, the weights are established by applying the formula (1) supported by official data [18] and scientific studies [4,25]. Table 1 shows the weights (W1, W2, … W6) for each SDG13 indicator.
Secondly, from official sources [49,50,51], data is collected, with 2020 as a reference year, and each indicator is valued using an endecadary scale [48]. Indicators 13.1.1 and 13.3.1 represent the results of an average value of the additional indicators presented in Table A3 and Table A4. Table 2 shows the consolidated result.
Finally, the calculation of the OWA operator is performed by applying the Formula (2), using the values presented in Table 1 (weighting vector) and Table 2 (evaluation of each indicator by country). For example, follow the calculations made for Argentina (C1), Brazil (C2), and Spain (C10). OWACi, for i = 1, 2, …, and 10.
OWAC1 = (0.05 ∗ 1.00 + 0.10 ∗ 0.90 + 0.10 ∗ 0.78 + 0.25 ∗ 0.70 + 0.45 ∗ 0.40 + 0.05 ∗ 0.00) = 0.573
OWAC2 = (0.05 ∗ 1.00 + 0.10 ∗ 0.97 + 0.10 ∗ 0.80 + 0.25 ∗ 0.75 + 0.45 ∗ 0.28 + 0.05 ∗ 0.10) = 0.5455
OWAC10 = (0.05 ∗ 1.00 + 0.10 ∗ 1.00 + 0.10 ∗ 0.97 + 0.25 ∗ 0.80 + 0.45 ∗ 0.46 + 0.05 ∗ 0.45) = 0.6765
The following section presents the complete results applying the OWA operator.
3. Results Applying OWA Operator to SDG13
The result of the algorithm indicates that Colombia (C4) reached the highest coefficient of 0.8230, which means that C4 obtains a better level of adequacy to SDG13. In second place is Peru (C8), with a coefficient of 0.7795, followed by C5 (0.7465), C10 (0.6765), and C3 (0.6430), respectively. Countries C4 and C8 are in the top positions, mainly due to the results on targets 13.1, 13.2, and 13.3. Also, these countries due to the availability of data in all indicators. Table 3 presents the complete result and the ranking of the ten countries.
Table 3.
Ranking of countries applying the OWA operator.
The second half of the ranking is Portugal (C9), with a coefficient of 0.5875. Followed by Argentina (C1) at 0.5730 and Ecuador (C6) at 0.5685, respectively. On the other hand, Brazil (C2) and Mexico (C7) were in the last positions with coefficients 0.5455 and 0.5310, respectively. The low values can explain these results in indicator 13.2.2. Figure 12 shows the level of adequacy of the ten countries to SDG13.
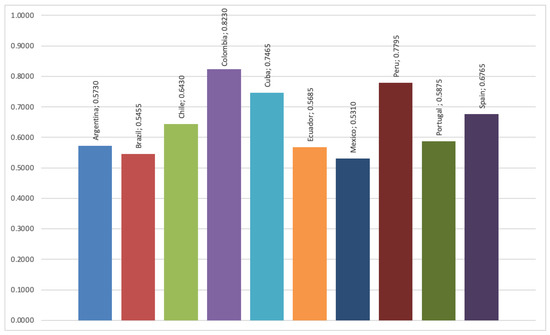
Figure 12.
Own elaboration applying the OWA operator based on [49,50,51].
In addition, the results allow us to classify the countries into sets according to the level of adequacy of SDG13. In this case, the results indicate four groups of countries, the first set being at the strong level S3 = {C4} represented by Colombia. Two countries form the second set at the considerable level S4 = {C8, C5} constituted by Peru and Cuba. The third set is at the fair level S5 = {C10, C3} with Spain and Chile. Finally, the fourth set S6 = {C9, C1, C6, C2, C7} is composed of five countries, Portugal, Argentina, Ecuador, Brazil, and Mexico, and are at the intermediate level. Table 4 presents the classification of countries by level of adequacy to SDG13.
Table 4.
Classification of countries by adequacy level to the SDG 13.
The cluster ranking reveals the degree to which a grouping of countries is on SDG13 and helps to understand each country’s progress and weaknesses, facilitating the search for collaborative solutions among countries. Policy and decision-makers can use this information to review national and international plans to combat climate change. The following section is devoted to discussions of the results.
4. Discussion of the Results
This research applied the OWA operator in ten Ibero-American nations, which allowed evaluating, ranking, and classifying these countries concerning SDG13. The results can help policymakers review their climate action targets, identify weaknesses, and strengthen actions to address the climate crisis. In addition, the study generated relevant findings for academics, policymakers, and decision-makers.
In response to the authors [18], the research compiled information on SDG13 indicators from Argentina, Brazil, Chile, Colombia, Cuba, Ecuador, Mexico, Peru, Portugal, and Spain from official databases. The OWA operator was then applied using the data collected, considering specific weights for each indicator defined by other studies [4,18,25]. As a result, the article reduced the first concomitance gap [18] by revealing a ranking of the countries and allowing the comparison of data between them on SDG13. However, another alternative prioritization method, such as the Pythagorean Fuzzy Uncertain Environments [60], can be used in future research to compare the results obtained.
The results of the literature review made it possible to warn [25] and raise awareness among policy and decision-makers about the correlation between the SDGs [20] and the urgency of curbing global warming [4], giving priority to the reduction of CO2 emissions through renewable energies [8], circular economy [57], and optimization of agricultural areas [45]. Along these lines, the research narrowed the second knowledge gap [20,23].
The study also confirmed the findings of other researchers [55] by highlighting the importance of the Sendai Framework and recognizing the connection between health and natural disasters [25]. In the same direction, the study highlighted protection solutions in flood-risk areas [52] and social justice by relocating people to safer areas [53,54]. Therefore, the inclusion of the human factor in decision-making is reinforced [25], diminishing the third knowledge gap.
Additionally, in response to other studies [4,22], the authors proposed the inclusion of weights in the SDG13 indicators by applying the OWA operator [27]. As a result, the algorithm generated more reliable data, facilitating policymakers’ formulation of climate strategies and reducing the fourth knowledge gap.
Finally, in response to other studies [43,44,45], the OWA operator was shown to be appropriate for evaluating, prioritizing, and comparing data across countries to SDG13. Determining weights for each indicator based on official data and scientific studies [4,18,25] allowed for prioritizing the most relevant climate change indicators and presenting a more realistic ranking of countries. Besides, the results were validated by three academic specialists from Ibero-American countries. Furthermore, the method enabled it to merge numerical information, contributing to decision-making [33] and minimizing the fifth gap identified.
5. Conclusions
The study proposed applying a fuzzy logic algorithm to evaluate the SDG13 indicators and deepened the debate on climate change. The following are the main conclusions of this work:
First, the research broadened the debate on climate change, showing that it is a complex and dynamic problem. It was confirmed that we are going through a climate crisis in which global causes produce local effects and that solutions will depend on an urgent effort by all.
Second, the literature review identified five knowledge gaps related to climate change and the OWA operator. For this reason, the authors applied this algorithm as a methodological alternative to evaluate 10 Ibero-American countries and respond to these gaps.
Thirdly, the research ratified that the OWA operator contributes to decision-making in prioritization processes by ranking Ibero-American countries with SDG13. The study’s main results indicated that Colombia with the best level of alignment with SDG13, followed by Peru and Cuba. The last positions are Brazil and Mexico. In addition, the results revealed the importance of having comparable data on SDG13 to identify solutions and contribute to sustainable development with possible action methods.
Fourth, as theoretical contributions, the manuscript advanced the frontier of knowledge on Climate Change and operator OWA from a bibliometric study between 2013 and 2022. The study showed the scientific performance in this period, and the highlighted publications alerted us about the challenges and solutions to address the climate crisis. The study also revealed a growing interest in these lines of research. Moreover, the research reduced the five knowledge gaps identified. Finally, academics can benefit from comparable data on SDG13 to deepen their research on climate change and apply this algorithm to other groups of countries.
Fifth, as practical contributions, the applied study offers governments, society, academia, and decision-makers solutions to address climate change. The research presented a diagnosis of the 10 Ibero-American countries on six SDG13 indicators. It showed proposals for action aimed at policy and decision-makers to strengthen resilience, integrate climate change measures into public policies and improve climate change education. As main recommendations, policymakers should prioritize actions to reduce CO2 emissions, such as renewable energies, circular economy, and optimization of agricultural areas. On the other hand, the authors recommend keeping information on SDG13 updated in official databases and investing in IT systems for data collection and processing. In addition, countries should prioritize climate change adaptation and mitigation strategies, such as strengthening the resilience of communities to natural disasters by investing in protective infrastructure in areas at risk of flooding and facilitating the relocation of people to safer areas. Lastly, the OWA operator helped prioritize and compare data across countries, facilitating the identification of weaknesses and solutions related to SDG Climate Action. Other researchers can use these findings in their research, and policymakers can compare their country’s results with those of other participating countries and take urgent action to combat climate change and generate a positive impact on society.
Finally, as the main scientific merit of the study, the manuscript was novel for applying the OWA operator to SDG13 in Ibero-American countries. The authors included different weightings for each indicator based on official data and scientific studies, which allowed prioritization of the most relevant indicators for climate change and a more realistic ranking of countries. Also, it reduced the need for comparable data for the climate action goal. A limitation of the research would be the number of participating countries. As a suggestion, future studies can expand the sample used and explore the application of this algorithm among other countries.
Author Contributions
Conceptualization, L.B.-P.; methodology, L.B.-P. and A.M.G.-L.; validation, L.B.-P. and A.M.G.-L.; formal analysis, A.C.-R.; investigation, L.B.-P.; resources, L.B.-P.; writing—original draft preparation, L.B.-P.; writing—review and editing, L.B.-P. and A.C.-R.; supervision, A.M.G.-L. All authors have read and agreed to the published version of the manuscript.
Funding
Research supported by Red Sistemas Inteligentes y Expertos Modelos Computacionales Iberoamericanos (SIEMCI), project number 522RT0130 in Programa Iberoamericano de Ciencia y Tecnología para el Desarrollo (CYTED).
Data Availability Statement
Not applicable.
Acknowledgments
The authors wish to thank The Royal Academy of Economic and Financial Sciences and the University of Barcelona from Spain, and CENTRUM Católica Graduate Business School, Peru.
Conflicts of Interest
The authors declare no conflict of interest.
Appendix A
Table A1.
Targets and SDG13 Indicators.
Table A1.
Targets and SDG13 Indicators.
| Targets | SDG13 Indicators |
|---|---|
| 13.1 Strengthen resilience and adaptive capacity to climate-related hazards and natural disasters in all countries. | 13.1.1 Number of deaths, missing persons, and people directly affected by disasters per 100,000 people. a. Deaths—Exposure to forces of nature—Sex: Both—Age: All Ages (Rate). b. Number of deaths and missing persons attributed to disasters per 100,000 population. c. Internally displaced persons, new displacement associated with disasters. d. Number of directly affected persons attributed to disasters per 100,000 population. |
| 13.1.2 Score of adopting and implementing local disaster risk reduction strategies in line with the Sendai Framework for Disaster Risk Reduction 2015–2030. 13.1.3 Number of local governments adopting and implementing local disaster risk reduction strategies in line with the national strategy. | |
| 13.2 Integrate climate change measures into national policies, strategies, and planning. | 13.2.1 Number of countries report establishing or implementing an integrated policy/strategy/plan that enhances their adaptive capacity to the adverse impacts of climate change and promotes climate resilience and low greenhouse gas emissions development. 13.2.2—Total emissions of greenhouse gases per year. |
| 13.3 Improve education, awareness-raising, and human and institutional capacity on climate change mitigation, adaptation, impact reduction, and early warning. | 13.3.1 Number of countries that have integrated mitigation, adaptation, impact reduction, and early warning into primary, secondary, and higher education curricula. a. Extent to which global citizenship education and education for sustainable development are mainstreamed in curricula. b. Extent to which global citizenship education and education for sustainable development are mainstreamed in national education policies. c. Extent to which global citizenship education and education for sustainable development are mainstreamed in student assessment. d. Extent to which global citizenship education and education for sustainable development are mainstreamed in teacher education. |
Source: Own elaboration based on [61].
Table A2.
Endecadary scale.
Table A2.
Endecadary scale.
| Adequacy Level | Evaluation |
|---|---|
| Null | 0 |
| Practically null | 0.1 |
| Almost weak | 0.2 |
| Very weak | 0.3 |
| Weak | 0.4 |
| Intermediate | 0.5 |
| Fair | 0.6 |
| Considerable | 0.7 |
| Strong | 0.8 |
| Very strong | 0.9 |
| Absolute | 1 |
Source: Own elaboration based on [48].
Table A3.
SDG13.1.1 Indicators.
Table A3.
SDG13.1.1 Indicators.
| Indicator/ Countries | C1 | C2 | C3 | C4 | C5 | C6 | C7 | C8 | C9 | C10 |
|---|---|---|---|---|---|---|---|---|---|---|
| a. | 1 | 0.9 | 0.8 | 0.85 | 0.7 | 0.6 | 1 | 0.2 | 1 | 1 |
| b. | 0 | 0 | 1 | 0.9 | 0 | 0.3 | 0.95 | 0.85 | 0.2 | 0 |
| c. | 0.89 | 0.2 | 0.9 | 0.6 | 0.1 | 0.94 | 0.5 | 0.8 | 0.98 | 0.82 |
| d. | 0.9 | 0 | 1 | 0.65 | 0 | 1 | 0.85 | 0.3 | 0.1 | 0 |
| Total | 0.6975 | 0.275 | 0.925 | 0.75 | 0.2 | 0.71 | 0.825 | 0.5375 | 0.57 | 0.455 |
Note: a. Deaths—Exposure to forces of nature—Sex: Both—Age: All Ages (Rate); b. Number of deaths and missing persons attributed to disasters per 100,000 population; c. Internally displaced persons, new displacement associated with disasters; d. Number of directly affected persons attributed to disasters per 100,000 population.
Table A4.
SDG13.3.1 Indicators.
Table A4.
SDG13.3.1 Indicators.
| Indicator/ Countries | C1 | C2 | C3 | C4 | C5 | C6 | C7 | C8 | C9 | C10 |
|---|---|---|---|---|---|---|---|---|---|---|
| a. | 0 | 0.94 | 0 | 0.88 | 1 | 0 | 0 | 0.81 | 0 | 0.91 |
| b. | 0 | 1 | 0 | 1 | 1 | 0 | 0.75 | 1 | 0 | 1 |
| c. | 0 | 0.92 | 0 | 1 | 1 | 0 | 1 | 1 | 0 | 1 |
| d. | 0 | 1 | 0 | 0.85 | 0.95 | 0 | 0.8 | 0.2 | 0 | 0.95 |
| Total | 0 | 0.965 | 0 | 0.9325 | 0.9875 | 0 | 0.6375 | 0.7525 | 0 | 0.965 |
Note: a. Extent to which global citizenship education and education for sustainable development are mainstreamed in curricula; b. Extent to which global citizenship education and education for sustainable development are mainstreamed in national education policies, c. Extent to which global citizenship education and education for sustainable development are mainstreamed in student assessment; d. Extent to which global citizenship education and education for sustainable development are mainstreamed in teacher education.
References
- Haeffner, M.; Hames, F.; Barbour, M.M.; Reeves, J.M.; Platell, G.; Grover, S. Expanding collaborative autoethnography into the world of natural science for transdisciplinary teams. One Earth 2022, 5, 157–167. [Google Scholar] [CrossRef] [PubMed]
- Barcellos-Paula, L.; Gil-Lafuente, A.M.; Castro-Rezende, A. Socio-Economic and Health Management of Pandemics Based on Forgotten Effects Theory. Cybern. Syst. 2022, 54, 1–27. [Google Scholar] [CrossRef]
- Yazdani, M.; Mojtahedi, M.; Loosemore, M.; Sanderson, D. A modelling framework to design an evacuation support system for healthcare infrastructures in response to major flood events. Prog. Disaster Sci. 2022, 13, 100218. [Google Scholar] [CrossRef]
- Hu, Y. From global warming to complex physical systems: Reading of the 2021 Nobel Prize in Physics. Chin. Sci. Bull. 2022, 67, 548–556. [Google Scholar] [CrossRef]
- Bernet, M.; Torres Acosta, L. Rising sea level and increasing tropical cyclone frequency are threatening the population of San Andrés Island, Colombia, western Caribbean. BSGF Earth Sci. Bull. 2022, 193, 4. [Google Scholar] [CrossRef]
- Chaika, V.; Lisovyy, M.; Lakyda, M.; Konotop, Y.; Taran, N.; Miniailo, N.; Fedorchuk, S.; Klymenko, T.; Trembitska, O.; Chaika, S. Impact of climate change on biodiversity loss of entomofauna in agricultural landscapes of Ukraine. J. Cent. Eur. Agric. 2021, 22, 830–835. [Google Scholar] [CrossRef]
- Gosens, J.; Lu, Y.; He, G.; Bluemling, B.; Beckers, T.A.M. Sustainability effects of household-scale biogas in rural China. Energy Policy 2013, 54, 273–287. [Google Scholar] [CrossRef]
- Waheed, A.; Tariq, M. The Impact of Renewable Energy on Carbon Dioxide Emissions: An Empirical Analysis of Selected South Asian Countries. Ukr. J. Ecol. 2019, 9, 527–534. [Google Scholar] [CrossRef]
- Siegert, M.; Pearson, P. Reducing Uncertainty in 21st Century Sea-Level Predictions and Beyond. Front. Environ. Sci. 2021, 9, 751978. [Google Scholar] [CrossRef]
- Sánchez-Benítez, A.; Goessling, H.; Pithan, F.; Semmler, T.; Jung, T. The July 2019 European Heat Wave in a Warmer Climate: Storyline Scenarios with a Coupled Model Using Spectral Nudging. J. Clim. 2022, 35, 2373–2390. [Google Scholar] [CrossRef]
- Boccard, N. On the prevalence of forest fires in Spain. Nat. Hazards 2022, 114, 1043–1057. [Google Scholar] [CrossRef]
- Ahmad, D.; Afzal, M. Flood hazards and agricultural production risks management practices in flood-prone areas of Punjab, Pakistan. Environ. Sci. Pollut. Res. 2022, 29, 20768–20783. [Google Scholar] [CrossRef] [PubMed]
- Hochman, A.; Marra, F.; Messori, G.; Pinto, J.G.; Raveh-Rubin, S.; Yosef, Y.; Zittis, G. Extreme weather and societal impacts in the eastern Mediterranean. Earth Syst. Dyn. 2022, 13, 749–777. [Google Scholar] [CrossRef]
- Khraishah, H.; Alahmad, B.; Ostergard, R.L.; AlAshqar, A.; Albaghdadi, M.; Vellanki, N.; Chowdhury, M.M.; Al-Kindi, S.G.; Zanobetti, A.; Gasparrini, A.; et al. Climate change and cardiovascular disease: Implications for global health. Nat. Rev. Cardiol. 2022, 19, 798–812. [Google Scholar] [CrossRef] [PubMed]
- Monforte, P.; Ragusa, M.A. Temperature Trend Analysis and Investigation on a Case of Variability Climate. Mathematics 2022, 10, 2202. [Google Scholar] [CrossRef]
- Swarna, S.T.; Hossain, K. Climate change impact and adaptation for highway asphalt pavements: A literature review. Can. J. Civ. Eng. 2022, 49, 1109–1120. [Google Scholar] [CrossRef]
- Zhu, X.; Liu, T.; Xu, K.; Chen, C. The impact of high temperature and drought stress on the yield of major staple crops in northern China. J. Environ. Manag. 2022, 314, 115092. [Google Scholar] [CrossRef]
- United Nations. The Sustainable Development Goals Report 2022, 1st ed.; Jensen, L., Ed.; United Nations Publications: New York, NY, USA, 2022; ISBN 978-92-1-101448-8. [Google Scholar]
- Pörtner, H.-O.; Roberts, D.C.; Tignor, M.; Poloczanska, E.S.; Mintenbeck, K.; Alegría, A.; Craig, M.S.; Langsdorf, S.; Löschke, V.; Möller, V. (Eds.) Climate Change 2022: Impacts, Adaptation and Vulnerability Working Group II Contribution to the Sixth Assessment Report of the Intergovernmental Panel on Climate Change; Cambridge University Press: New York, NY, USA, 2022. [Google Scholar]
- Barcellos-Paula, L.; De la Vega, I.; Gil-Lafuente, A.M. The Quintuple Helix of Innovation Model and the SDGs: Latin-American Countries’ Case and Its Forgotten Effects. Mathematics 2021, 9, 416. [Google Scholar] [CrossRef]
- Hwang, H.; An, S.; Lee, E.; Han, S.; Lee, C. Cross-Societal Analysis of Climate Change Awareness and Its Relation to SDG 13: A Knowledge Synthesis from Text Mining. Sustainability 2021, 13, 5596. [Google Scholar] [CrossRef]
- Mitchell, D.; Allen, M.R.; Hall, J.W.; Muller, B.; Rajamani, L.; Le Quéré, C. The myriad challenges of the Paris Agreement. Philos. Trans. R. Soc. A Math. Phys. Eng. Sci. 2018, 376, 20180066. [Google Scholar] [CrossRef]
- Pradhan, P.; Costa, L.; Rybski, D.; Lucht, W.; Kropp, J.P. A Systematic Study of Sustainable Development Goal (SDG) Interactions. Earth’s Futur. 2017, 5, 1169–1179. [Google Scholar] [CrossRef]
- Nilsson, M.; Griggs, D.; Visbeck, M. Policy: Map the interactions between Sustainable Development Goals. Nature 2016, 534, 320–322. [Google Scholar] [CrossRef] [PubMed]
- Steffen, W.; Richardson, K.; Rockström, J.; Cornell, S.E.; Fetzer, I.; Bennett, E.M.; Biggs, R.; Carpenter, S.R.; de Vries, W.; de Wit, C.A.; et al. Planetary boundaries: Guiding human development on a changing planet. Science 2015, 347, 1259855. [Google Scholar] [CrossRef]
- Zadeh, L.A. Fuzzy sets. Inf. Control. 1965, 8, 338–353. [Google Scholar] [CrossRef]
- Yager, R.R. On ordered weighted averaging aggregation operators in multicriteria decisionmaking. IEEE Trans. Syst. Man. Cybern. 1988, 18, 183–190. [Google Scholar] [CrossRef]
- Barcellos-Paula, L.; de La Vega, I.; Gil-Lafuente, A.M. Bibliometric review of research on decision models in uncertainty, 1990–2020. Int. J. Intell. Syst. 2022, 37, 7300–7333. [Google Scholar] [CrossRef]
- Nădăban, S. Fuzzy Logic and Soft Computing—Dedicated to the Centenary of the Birth of Lotfi A. Zadeh (1921–2017). Mathematics 2022, 10, 3216. [Google Scholar] [CrossRef]
- Wilberforce, T.; El-Hassan, Z.; Khatib, F.N.; Al Makky, A.; Baroutaji, A.; Carton, J.G.; Olabi, A.G. Developments of electric cars and fuel cell hydrogen electric cars. Int. J. Hydrog. Energy 2017, 42, 25695–25734. [Google Scholar] [CrossRef]
- Melin, P.; Monica, J.C.; Sanchez, D.; Castillo, O. Multiple Ensemble Neural Network Models with Fuzzy Response Aggregation for Predicting COVID-19 Time Series: The Case of Mexico. Healthcare 2020, 8, 181. [Google Scholar] [CrossRef]
- Barcellos-Paula, L.; Agüero-Olivos, C. The strengthening of corporate governance based on applied fuzzy logic. Corp. Soc. Responsib. Environ. Manag. 2022, 29, 1736–1746. [Google Scholar] [CrossRef]
- Merigó, J.M.; Gil-Lafuente, A.M. Induced 2-tuple linguistic generalized aggregation operators and their application in decision-making. Inf. Sci. 2013, 236, 1–16. [Google Scholar] [CrossRef]
- Barcellos de Paula, L.; Marins, F.A.S. Algorithms applied in decision-making for sustainable transport. J. Clean. Prod. 2018, 176, 1133–1143. [Google Scholar] [CrossRef]
- Vizuete-Luciano, E.; Boria-Reverter, S.; Merigó-Lindahl, J.M.; Gil-Lafuente, A.M.; Solé-Moro, M.L. Fuzzy Branch-and-Bound Algorithm with OWA Operators in the Case of Consumer Decision Making. Mathematics 2021, 9, 3045. [Google Scholar] [CrossRef]
- Will, M.; Bertrand, J.; Fransoo, J.C. Operations management research methodologies using quantitative modeling. Int. J. Oper. Prod. Manag. 2002, 22, 241–264. [Google Scholar] [CrossRef]
- Harper, A.; Mustafee, N.; Yearworth, M. Facets of trust in simulation studies. Eur. J. Oper. Res. 2021, 289, 197–213. [Google Scholar] [CrossRef]
- Yin, R. Case Study Research, Design Methods, 5th ed.; SAGE Publications Ltd.: Thousand Oaks, CA, USA, 2014; ISBN 978-1452242569. [Google Scholar]
- Hersbach, H.; Bell, B.; Berrisford, P.; Hirahara, S.; Horányi, A.; Muñoz-Sabater, J.; Nicolas, J.; Peubey, C.; Radu, R.; Schepers, D.; et al. The ERA5 global reanalysis. Q. J. R. Meteorol. Soc. 2020, 146, 1999–2049. [Google Scholar] [CrossRef]
- Wang, H.; Naghavi, M.; Allen, C.; Barber, R.M.; Bhutta, Z.A.; Carter, A.; Casey, D.C.; Charlson, F.J.; Chen, A.Z.; Coates, M.M.; et al. Global, regional, and national life expectancy, all-cause mortality, and cause-specific mortality for 249 causes of death, 1980–2015: A systematic analysis for the Global Burden of Disease Study 2015. Lancet 2016, 388, 1459–1544. [Google Scholar] [CrossRef]
- Liu, H.; Rodríguez, R.M. A fuzzy envelope for hesitant fuzzy linguistic term set and its application to multicriteria decision making. Inf. Sci. 2014, 258, 220–238. [Google Scholar] [CrossRef]
- Zeng, S.; Chen, J.; Li, X. A Hybrid Method for Pythagorean Fuzzy Multiple-Criteria Decision Making. Int. J. Inf. Technol. Decis. Mak. 2016, 15, 403–422. [Google Scholar] [CrossRef]
- Amir Rahmani, M.; Zarghami, M. A new approach to combine climate change projections by ordered weighting averaging operator; applications to northwestern provinces of Iran. Glob. Planet Change 2013, 102, 41–50. [Google Scholar] [CrossRef]
- Llopis-Albert, C.; Merigó, J.M.; Xu, Y.; Liao, H. Improving Regional Climate Projections by Prioritized Aggregation via Ordered Weighted Averaging Operators. Environ. Eng. Sci. 2017, 34, 880–886. [Google Scholar] [CrossRef]
- Chen, Y.; Li, M.; Su, K.; Li, X. Spatial-Temporal Characteristics of the Driving Factors of Agricultural Carbon Emissions: Empirical Evidence from Fujian, China. Energies 2019, 12, 3102. [Google Scholar] [CrossRef]
- SIEMCI Red Temática Número 522RT0130 en Programa Iberoamericano de Ciencia y Tecnología para el Desarrollo (CYTED) 2022–2025. Available online: https://siemci.org/proyecto/ (accessed on 18 December 2022).
- Barcellos de Paula, L. Modelos de Gestión Aplicados a la Sostenibilidad Empresarial. Ph.D. Thesis, Universitat de Barcelona, Barcelona, Spain, 2011. [Google Scholar]
- Kaufmann, A.; Gil Aluja, J. Introducción de la Teoría de los Subconjuntos Borrosos a la Gestión de las Empresas; Milladoiro: Santiago de Compostela, Spain, 1986; ISBN 9788439876304. [Google Scholar]
- Ritchie, H.; Roser, M.; Mispy, O.-O. Measuring Progress towards the Sustainable Development Goals. Available online: https://sdg-tracker.org (accessed on 29 September 2022).
- United Nations UN Office for Disaster Risk Reduction. Available online: https://www.undrr.org (accessed on 28 September 2022).
- Ritchie, H.; Roser, M.; Rosado, P. CO2 and Greenhouse Gas Emissions. Available online: https://ourworldindata.org/co2-and-other-greenhouse-gas-emissions (accessed on 29 September 2022).
- Haer, T.; Botzen, W.J.W.; Zavala-Hidalgo, J.; Cusell, C.; Ward, P.J. Economic evaluation of climate risk adaptation strategies: Cost-benefit analysis of flood protection in Tabasco, Mexico. Atmósfera 2017, 30, 101–120. [Google Scholar] [CrossRef]
- Collier, P.; Conway, G.; Venables, T. Climate change and Africa. Oxf. Rev. Econ. Policy 2008, 24, 337–353. [Google Scholar] [CrossRef]
- Lei, Y.; Finlayson, C.; Thwaites, R.; Shi, G.; Cui, L. Using Government Resettlement Projects as a Sustainable Adaptation Strategy for Climate Change. Sustainability 2017, 9, 1373. [Google Scholar] [CrossRef]
- Maini, R.; Clarke, L.; Blanchard, K.; Murray, V. The Sendai Framework for Disaster Risk Reduction and Its Indicators—Where Does Health Fit in? Int. J. Disaster Risk Sci. 2017, 8, 150–155. [Google Scholar] [CrossRef]
- Kelly, S.; Pollitt, M. An assessment of the present and future opportunities for combined heat and power with district heating (CHP-DH) in the United Kingdom. Energy Policy 2010, 38, 6936–6945. [Google Scholar] [CrossRef]
- Zajac, M.; Skocek, J.; Ben Haha, M.; Deja, J. CO2 Mineralization Methods in Cement and Concrete Industry. Energies 2022, 15, 3597. [Google Scholar] [CrossRef]
- Tormey, D.; Dongying, W.; Aixia, F. Geoheritage Education as a Gateway to Developing a Conservation Ethic in High School Students from China and the USA. Geoheritage 2022, 14, 79. [Google Scholar] [CrossRef]
- Fady, B.; Geburek, T.; Scotti, I. Science needs management data for a better prediction of climate change effects on socio-ecosystems. Ann. For. Sci. 2019, 76, 12. [Google Scholar] [CrossRef]
- Wang, L.; Garg, H.; Li, N. Pythagorean fuzzy interactive Hamacher power aggregation operators for assessment of express service quality with entropy weight. Soft Comput. 2021, 25, 973–993. [Google Scholar] [CrossRef]
- United Nations. Goal 13: Take Urgent Action to Combat Climate Change and Its Impacts. Available online: https://www.un.org/sustainabledevelopment/climate-change/ (accessed on 11 October 2022).
Disclaimer/Publisher’s Note: The statements, opinions and data contained in all publications are solely those of the individual author(s) and contributor(s) and not of MDPI and/or the editor(s). MDPI and/or the editor(s) disclaim responsibility for any injury to people or property resulting from any ideas, methods, instructions or products referred to in the content. |
© 2023 by the authors. Licensee MDPI, Basel, Switzerland. This article is an open access article distributed under the terms and conditions of the Creative Commons Attribution (CC BY) license (https://creativecommons.org/licenses/by/4.0/).