
Predicting PM10 Concentrations Using Evolutionary Deep Neural Network and Satellite-Derived Aerosol Optical Depth


Abstract
:1. Introduction
1.1. Paper Contributions
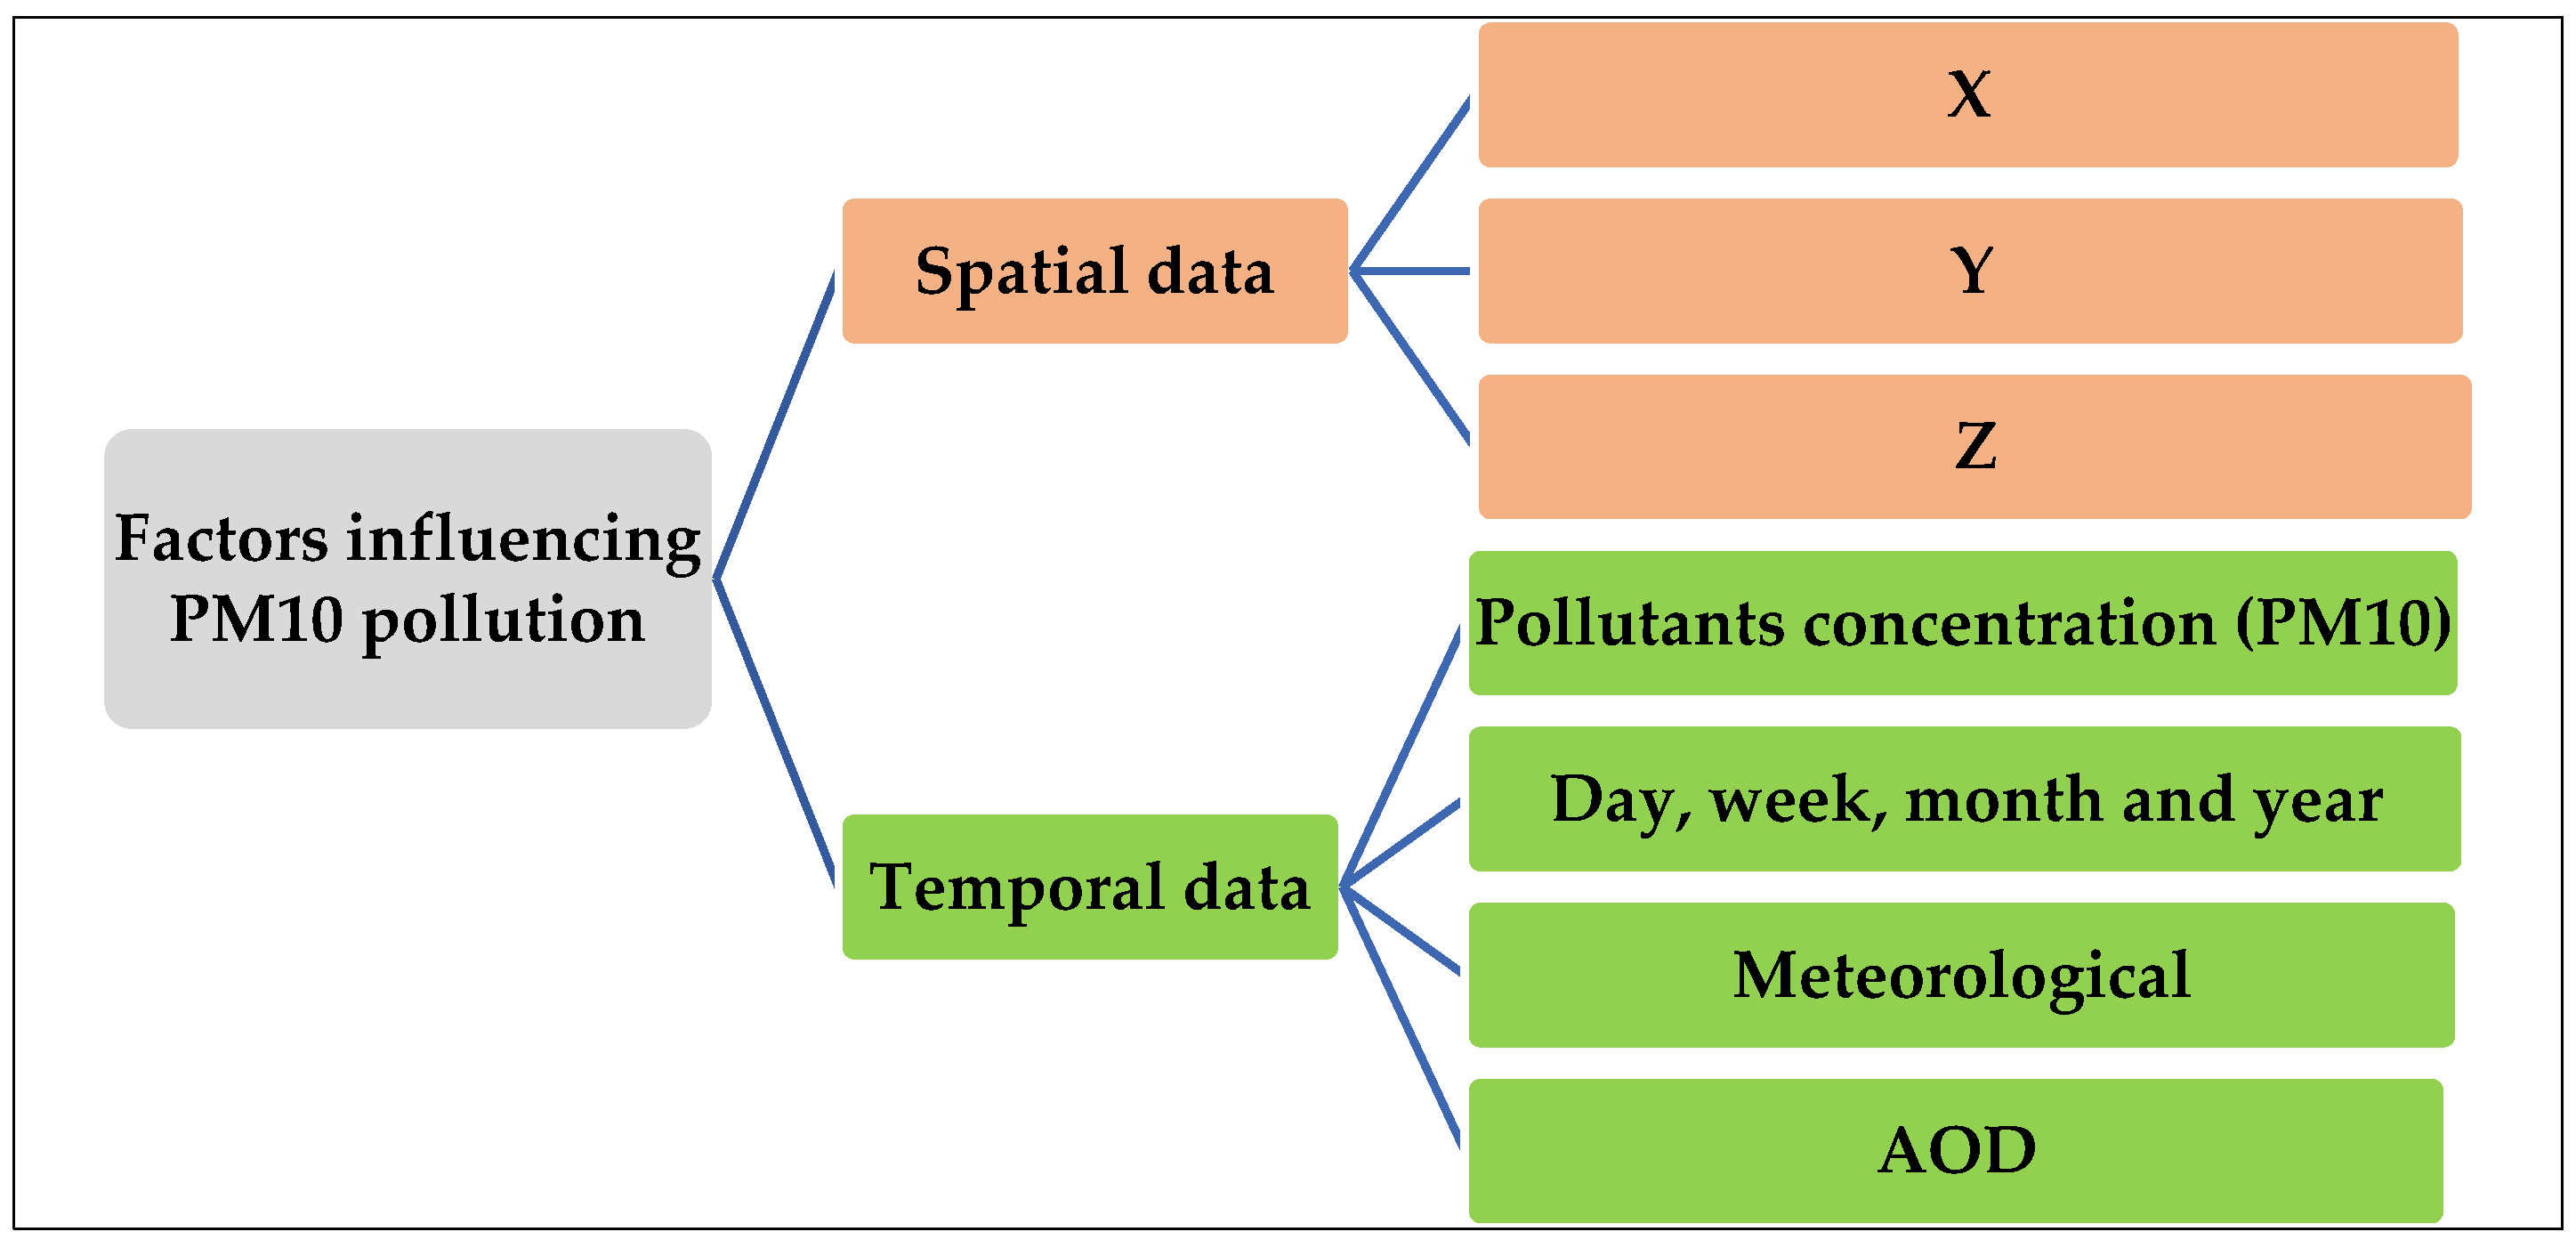
- This paper employs the fusion of AOD and meteorological data within an evolutionary DNN architecture to enhance the accuracy of air pollution forecasting.
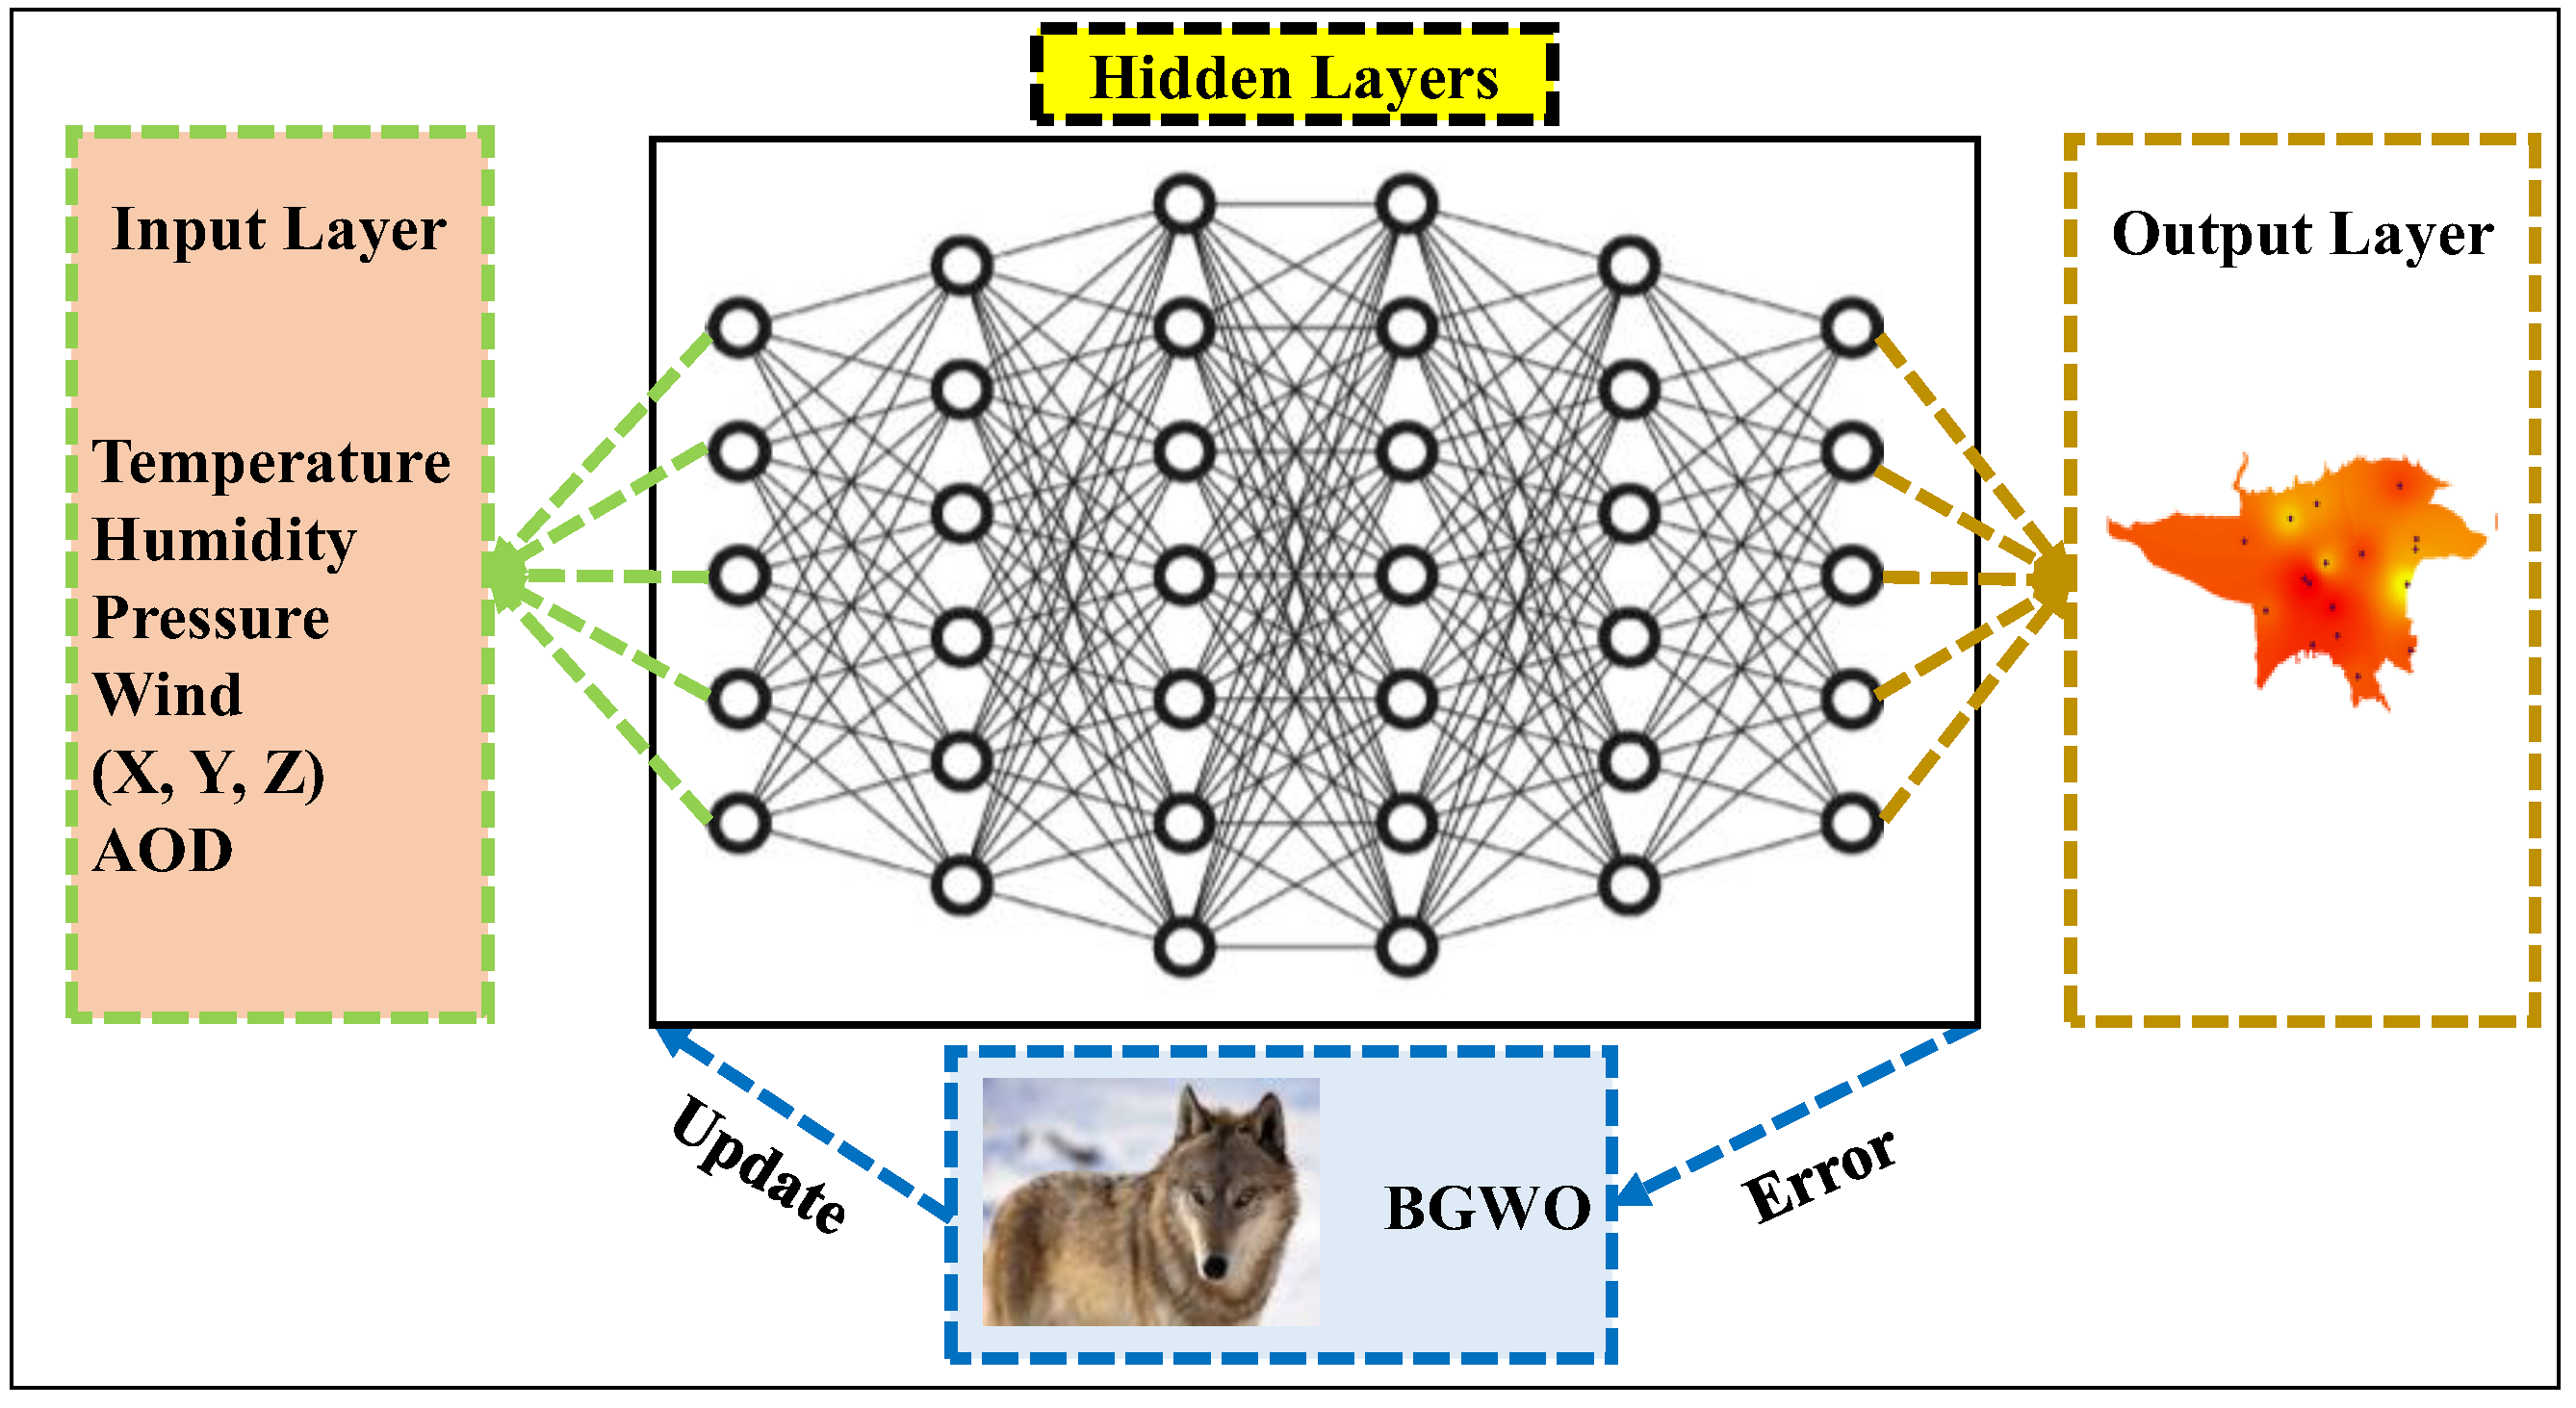
- This paper presents an innovative BGWO algorithm designed to enhance the refinement of optimization parameters in DNN models, leading to more accurate and reliable air pollution predictions. In the introduced BGWO framework, a fresh method for adjusting the positions of the wolves is put forth. This involves the utilization of a novel sigmoid function as the transfer function.
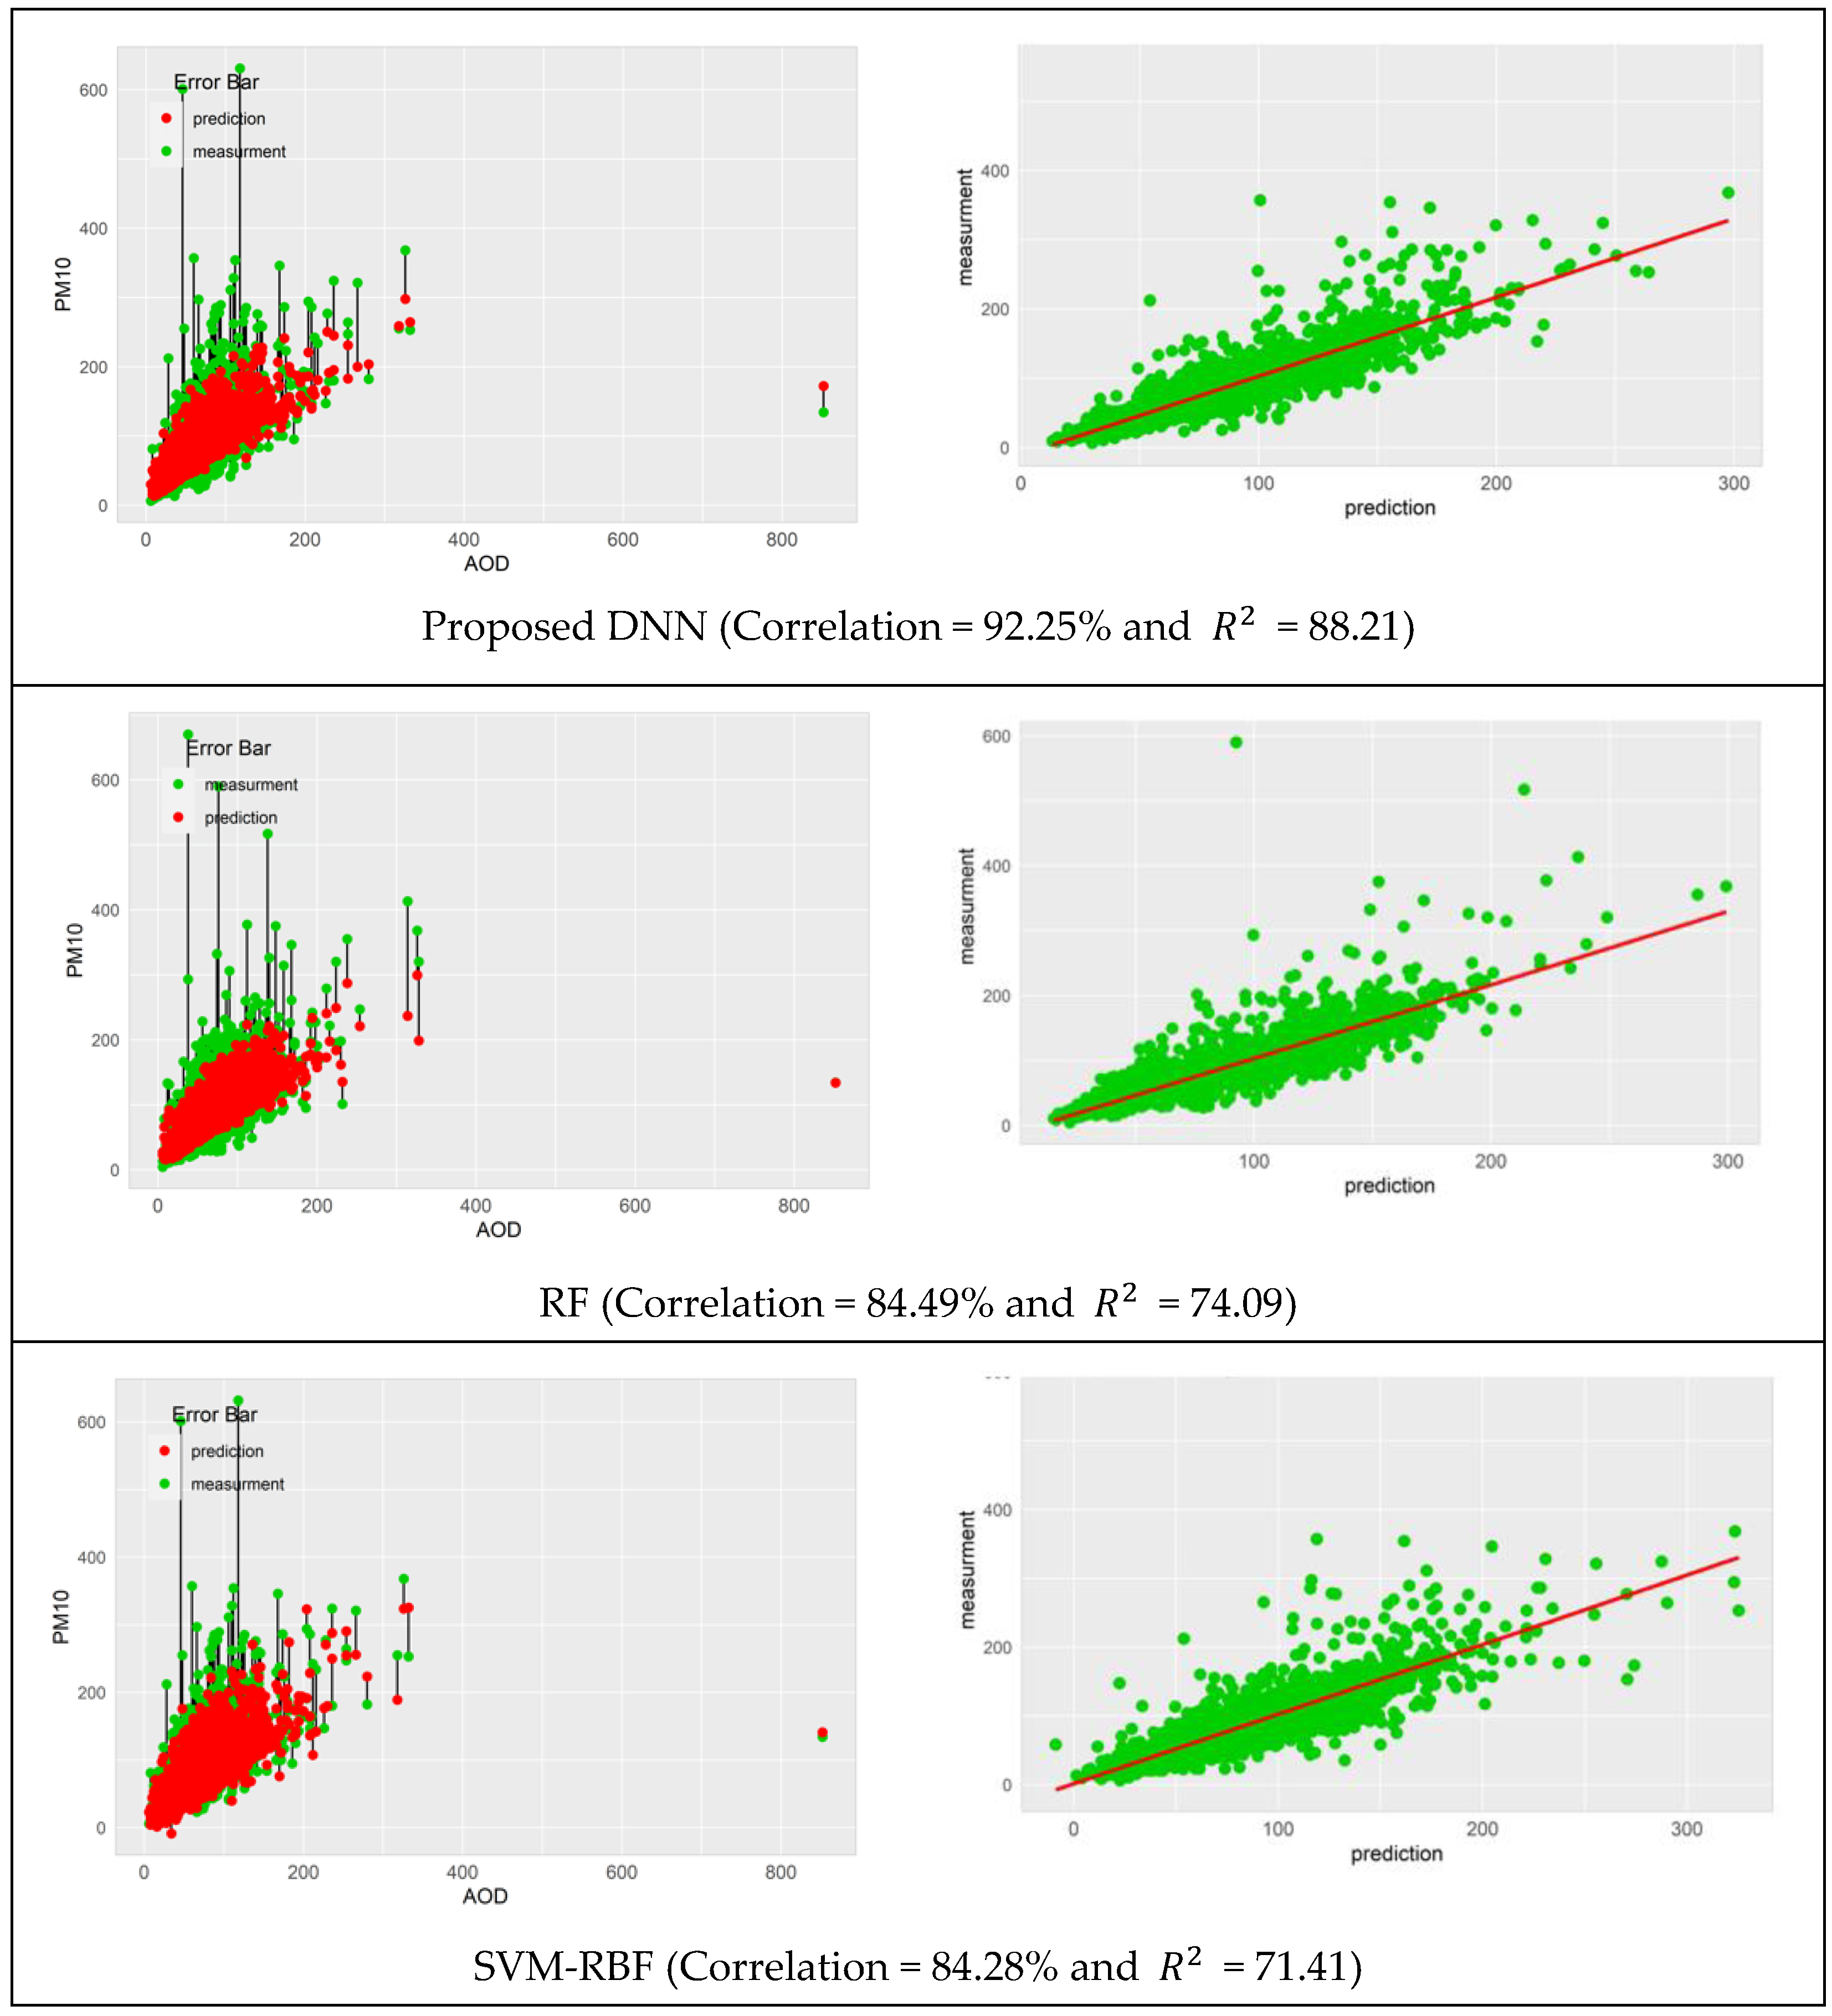
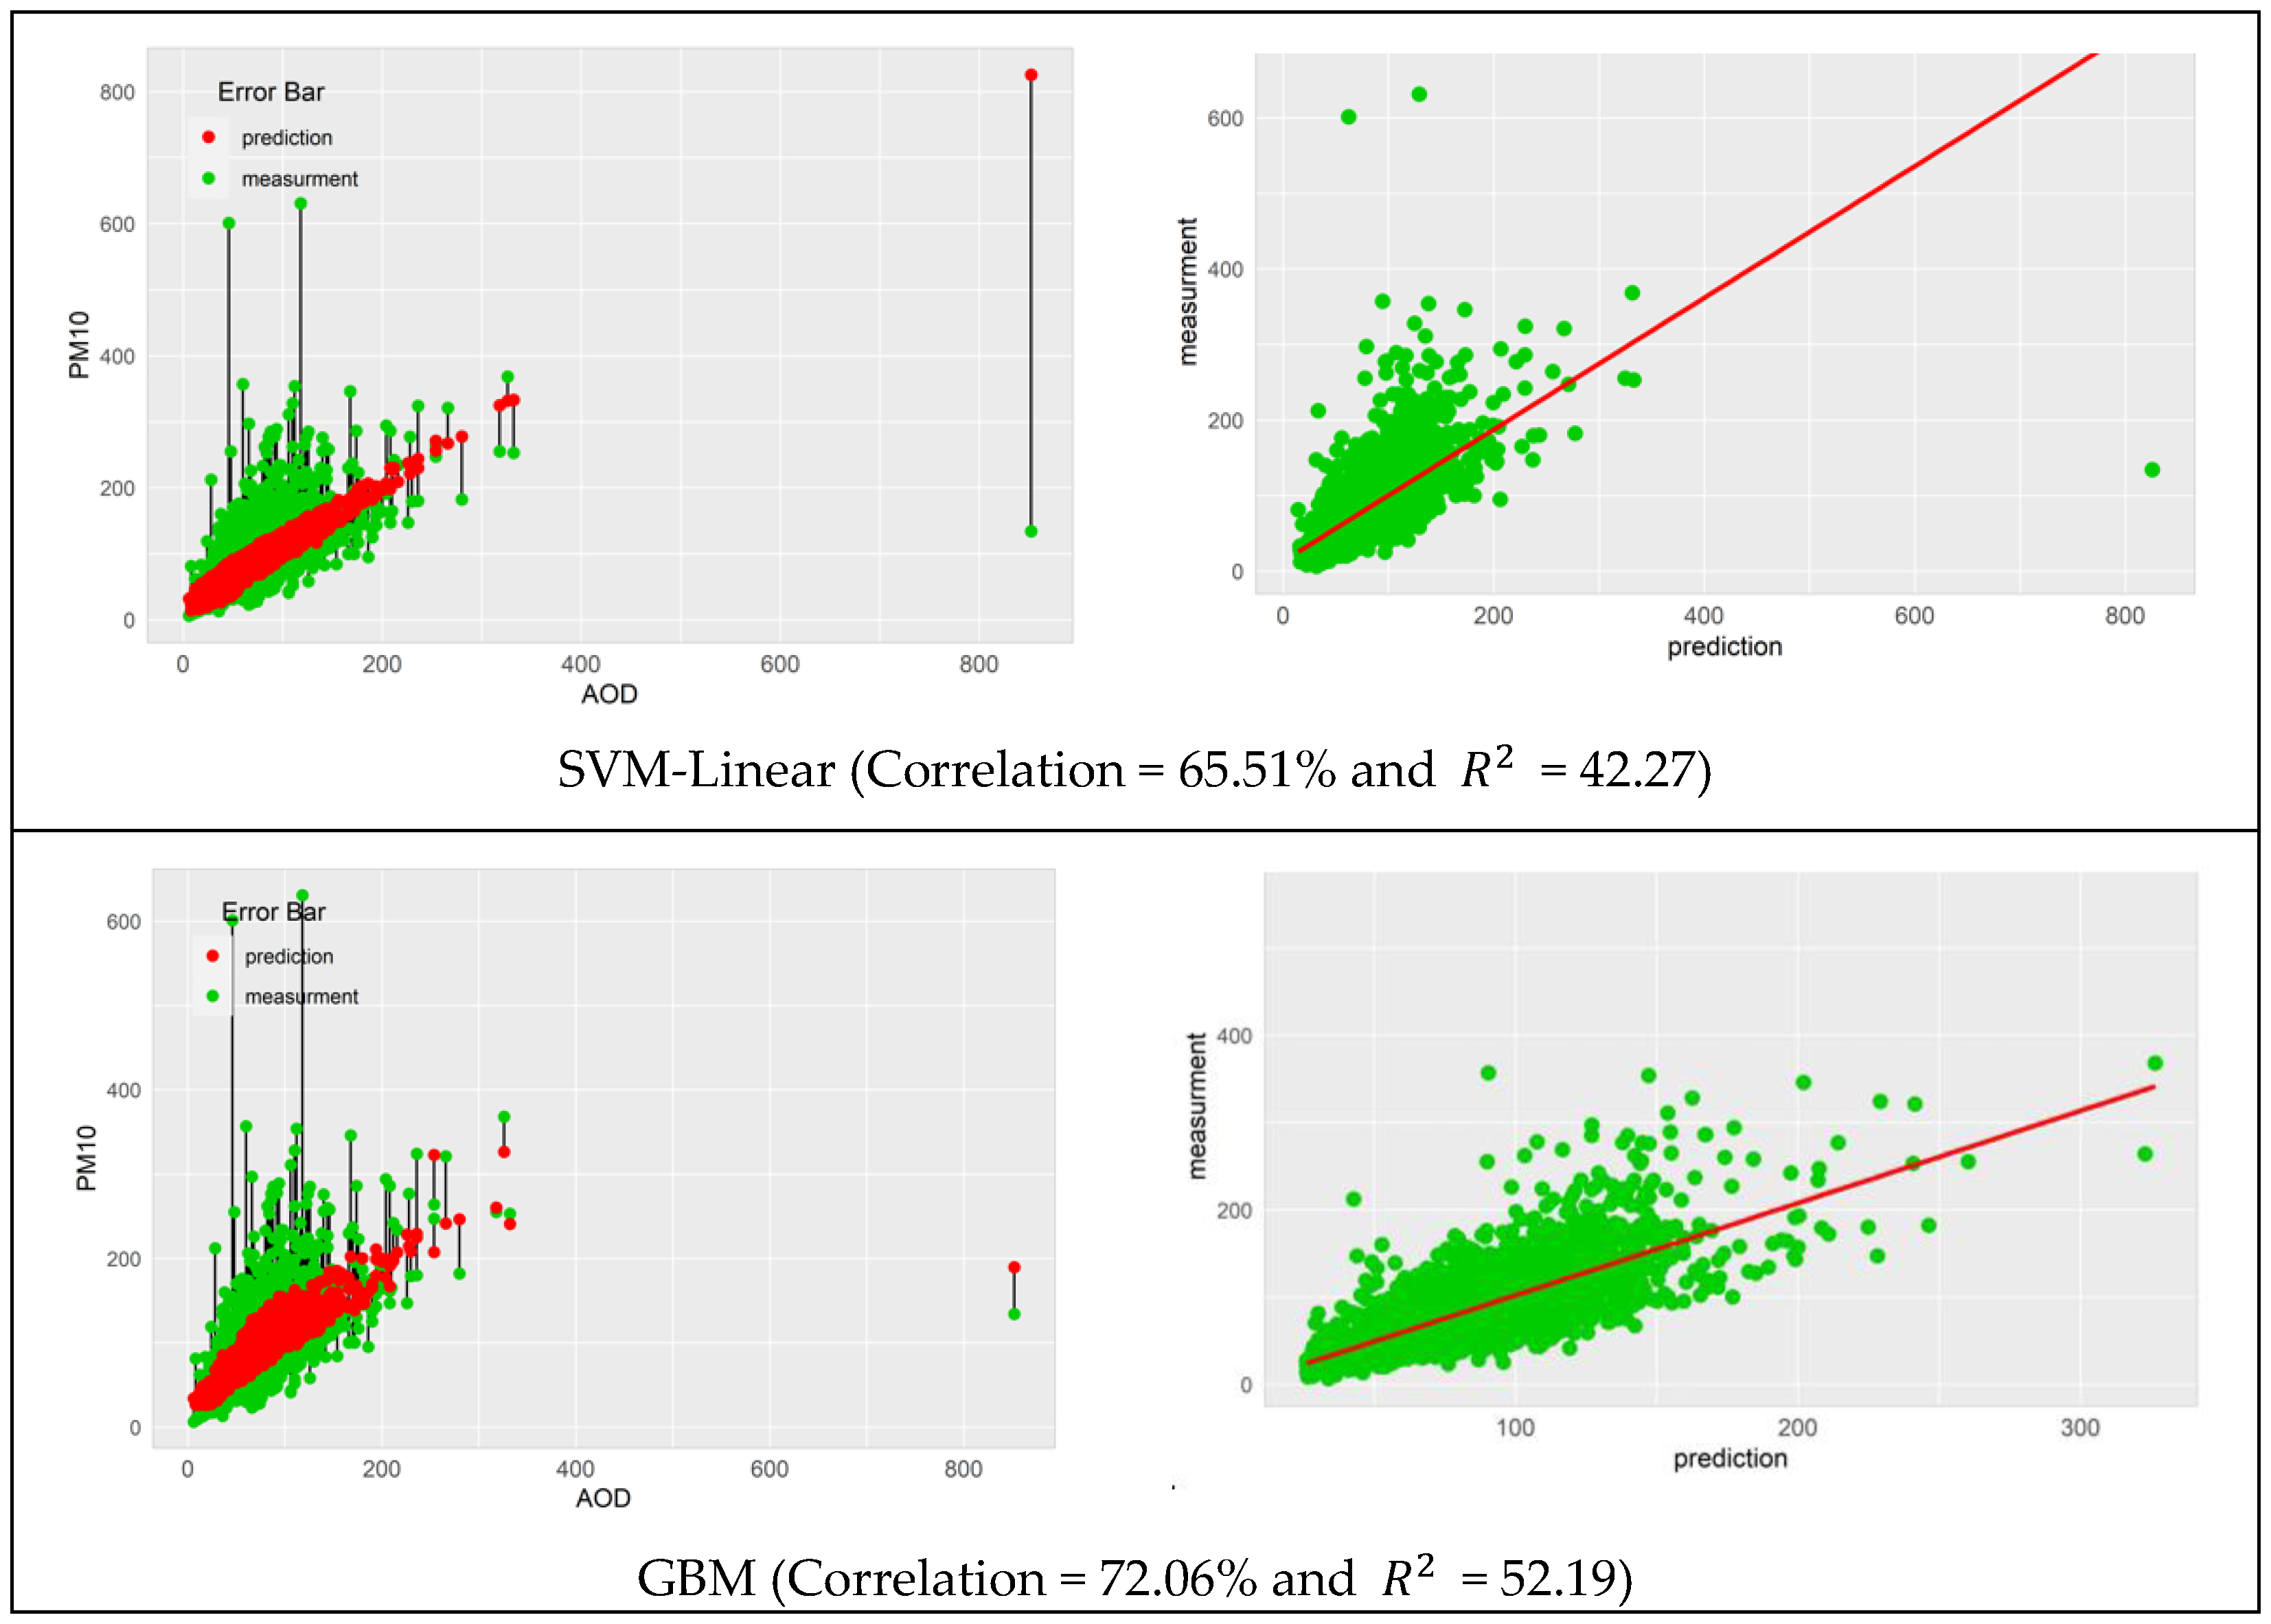
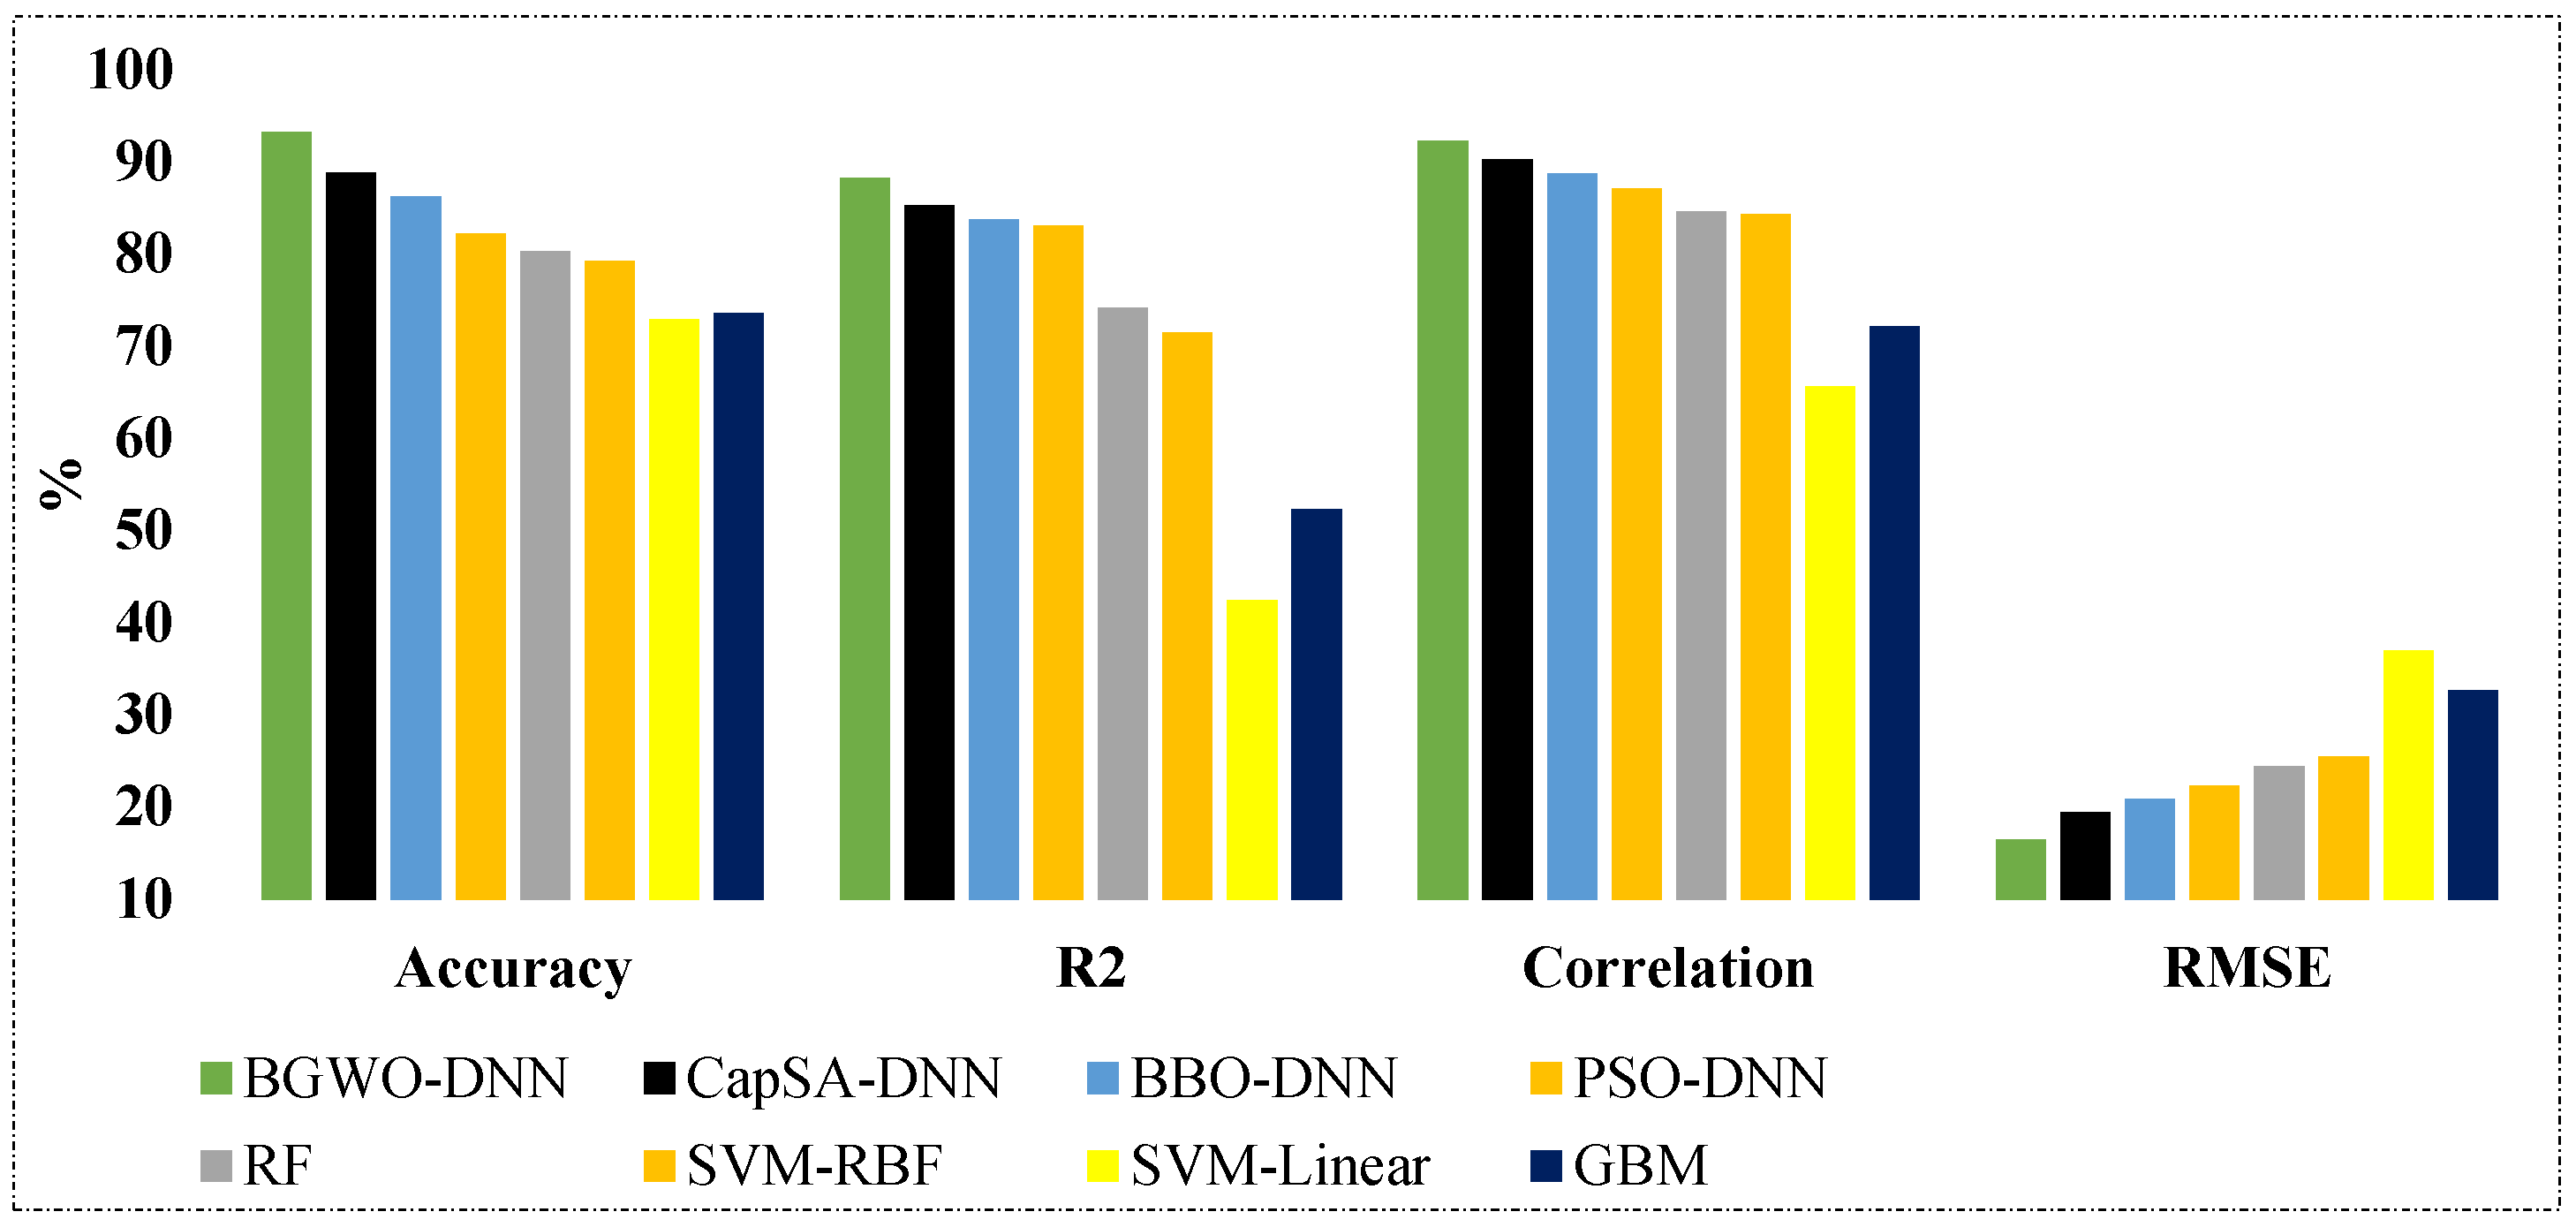
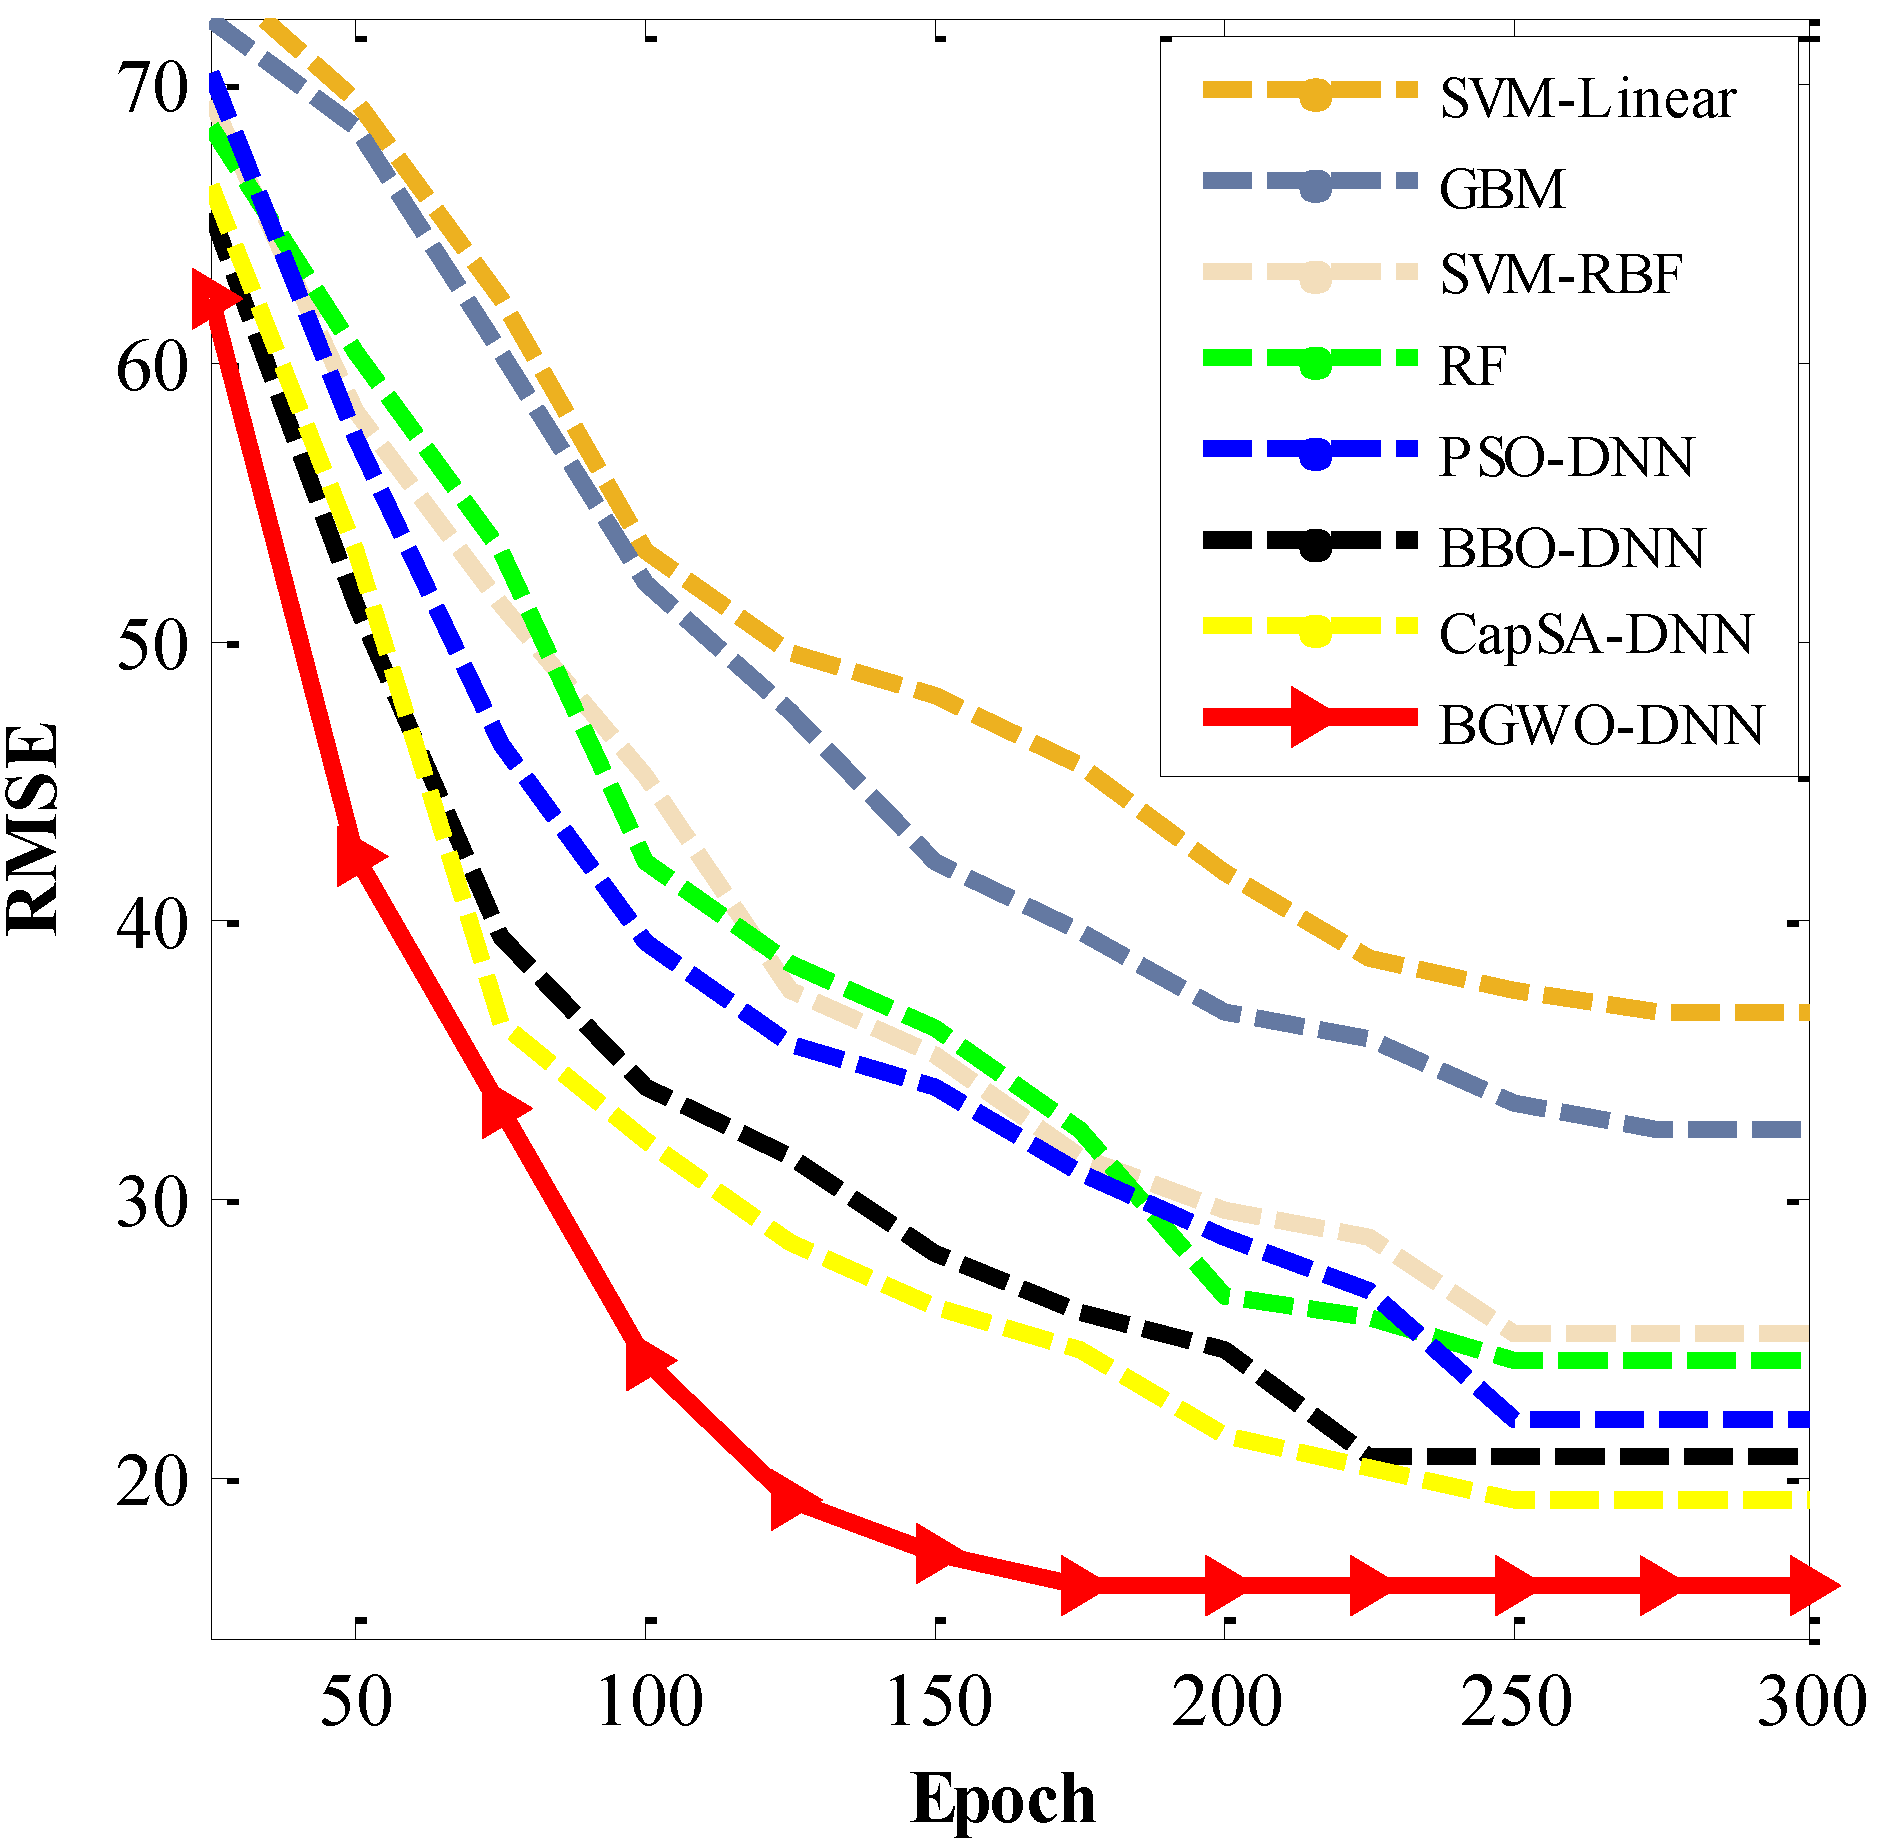
- The efficacy of the BGWO-DNN is benchmarked against seven distinct ML models: capuchin search algorithm (CapSA), biogeography-based optimization (BBO), PSO, random forest (RF), support vector machine with radial basis function kernel (SVM-RBF), linear support vector machine (SVM-linear), and gradient boosting model (GBM).
- The practical evaluation of the proposed BGWO-DNN using air pollution data showcases its superior performance compared to conventional ML approaches. The BGWO algorithm enhances the optimization process of weights and biases within the DNN framework, leading to an enhanced capability of the DNN to precisely apprehend and illustrate the underlying patterns and correlations present in the data.
1.2. Paper Questions
- How can ML algorithms be utilized to design and implement an air pollution prediction system?
- How does the combination of the BGWO with DNN contribute to improving the optimization of models for air pollution prediction, and how does it address the NP-hard problem associated with learning the weights and biases of the DNN?
- Which ML method is considered the most effective for estimating PM10 concentration?
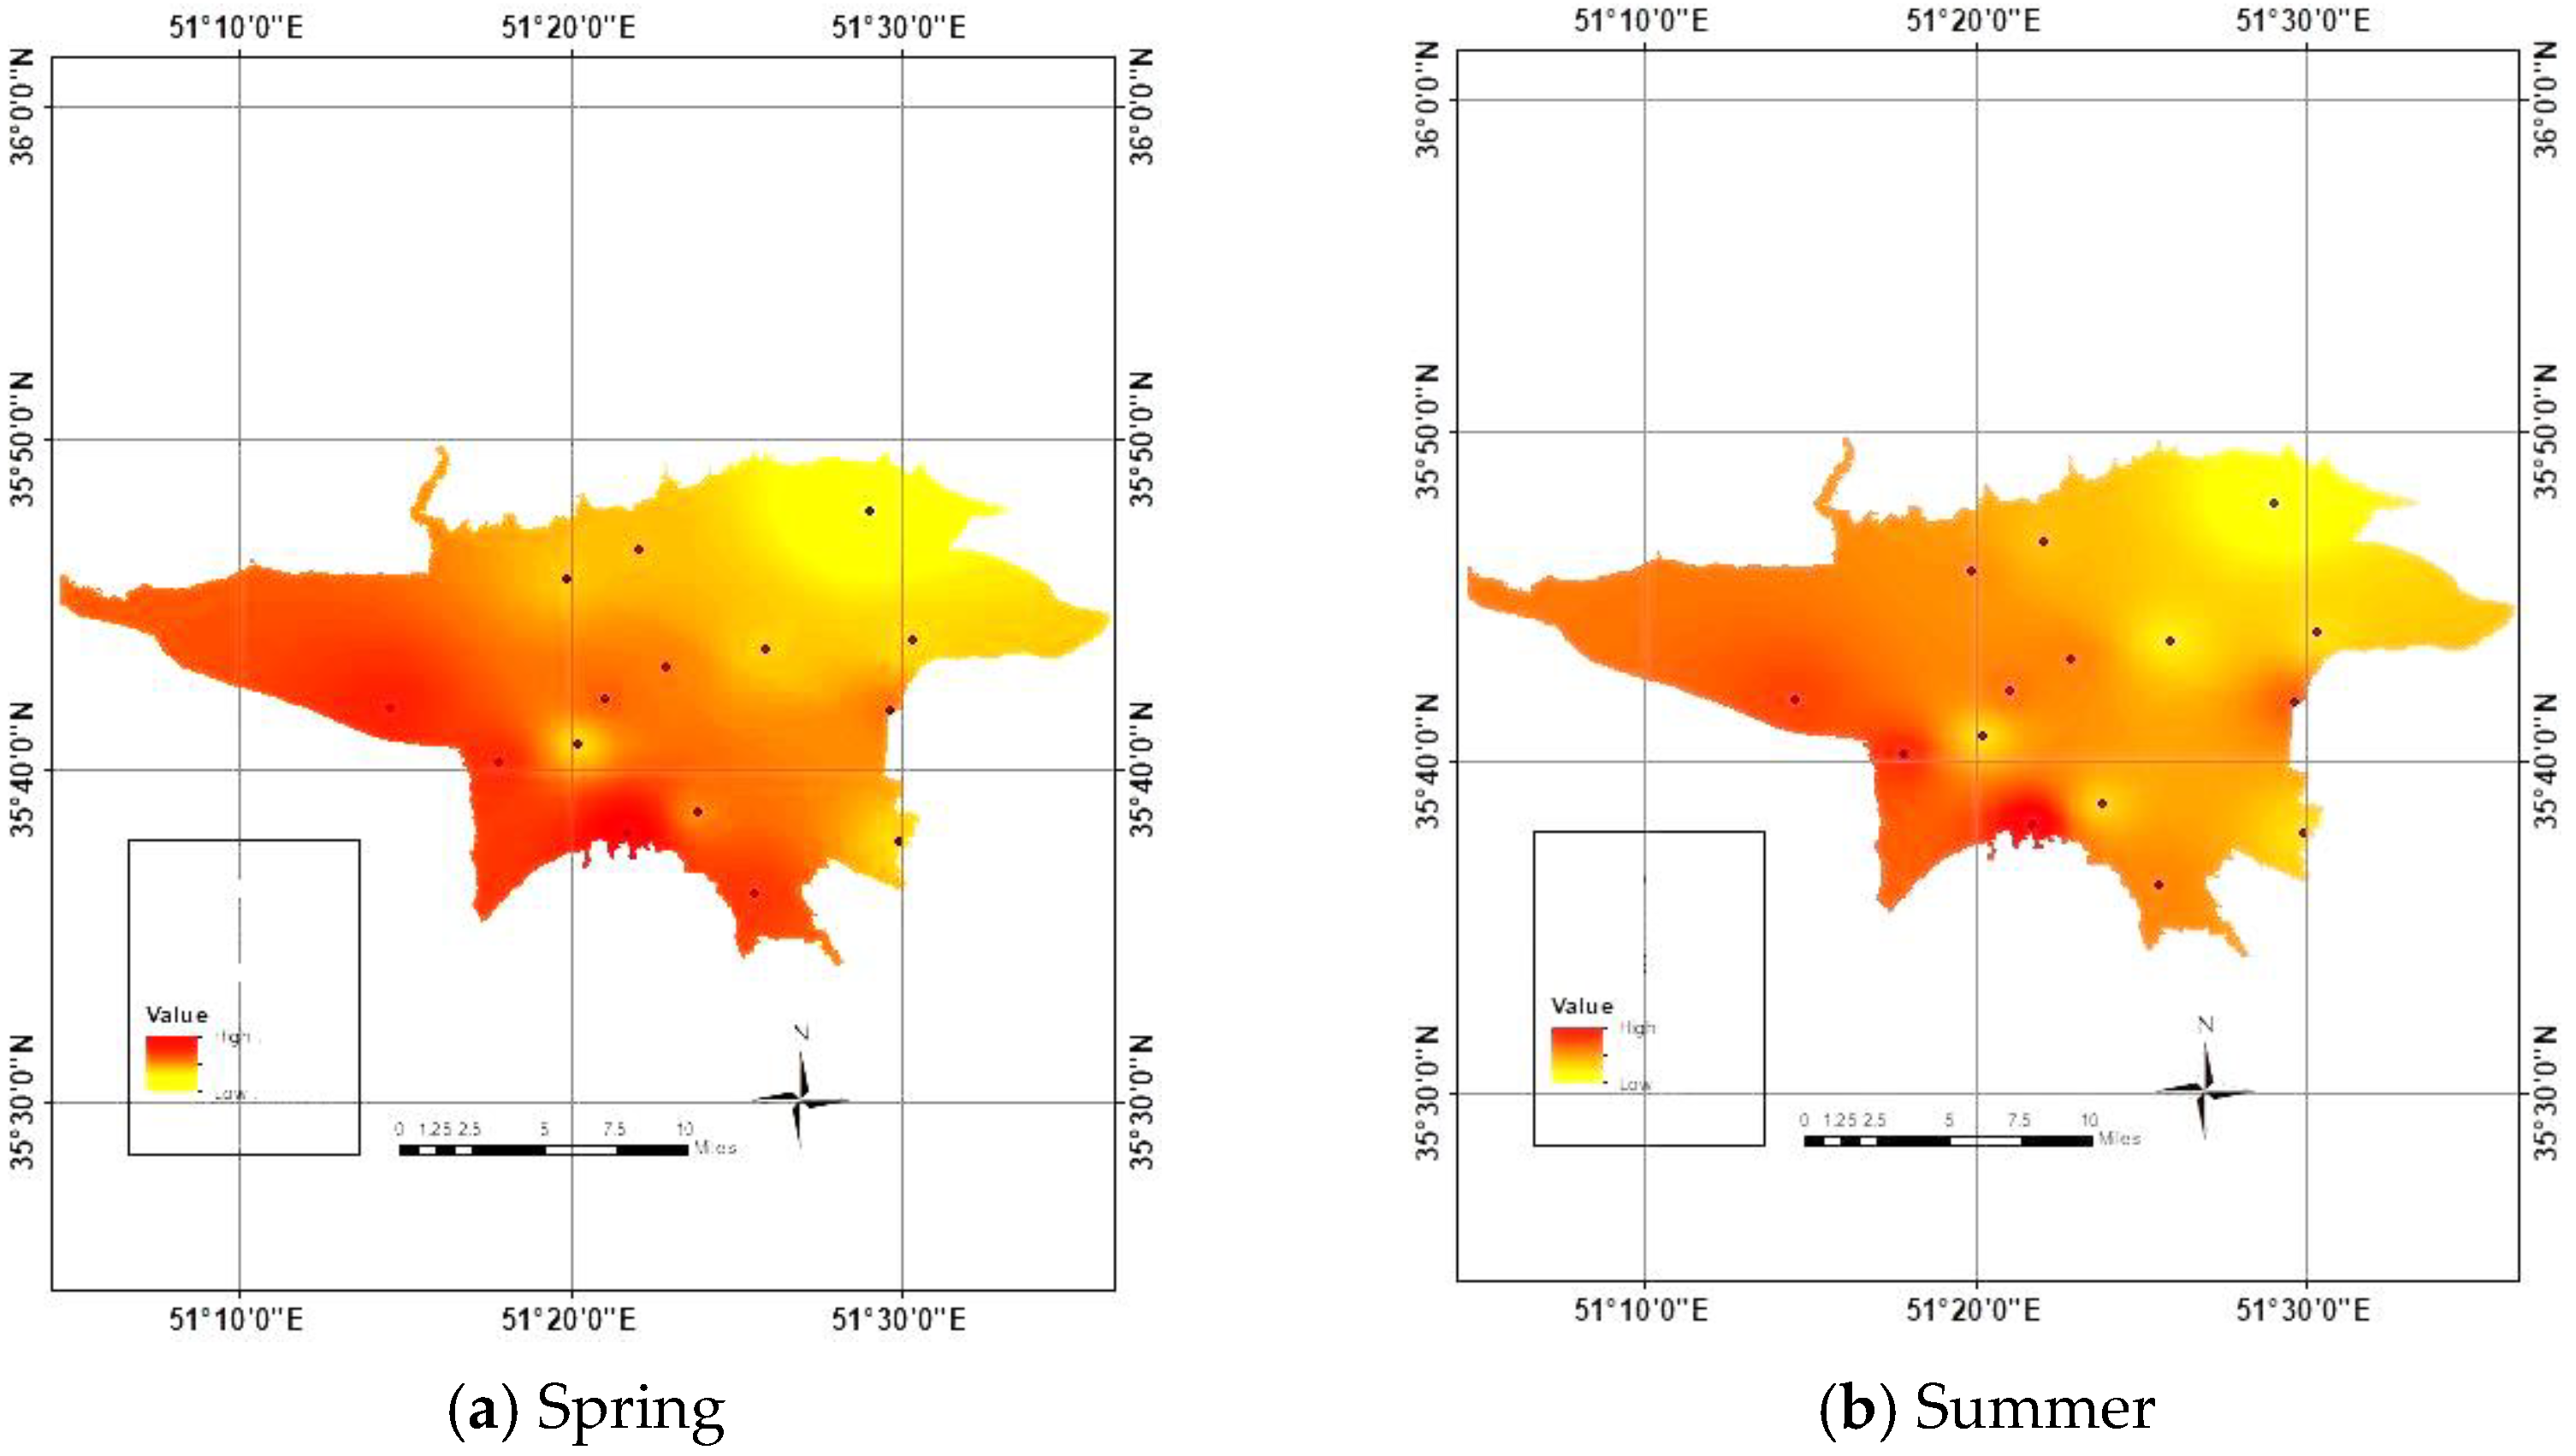
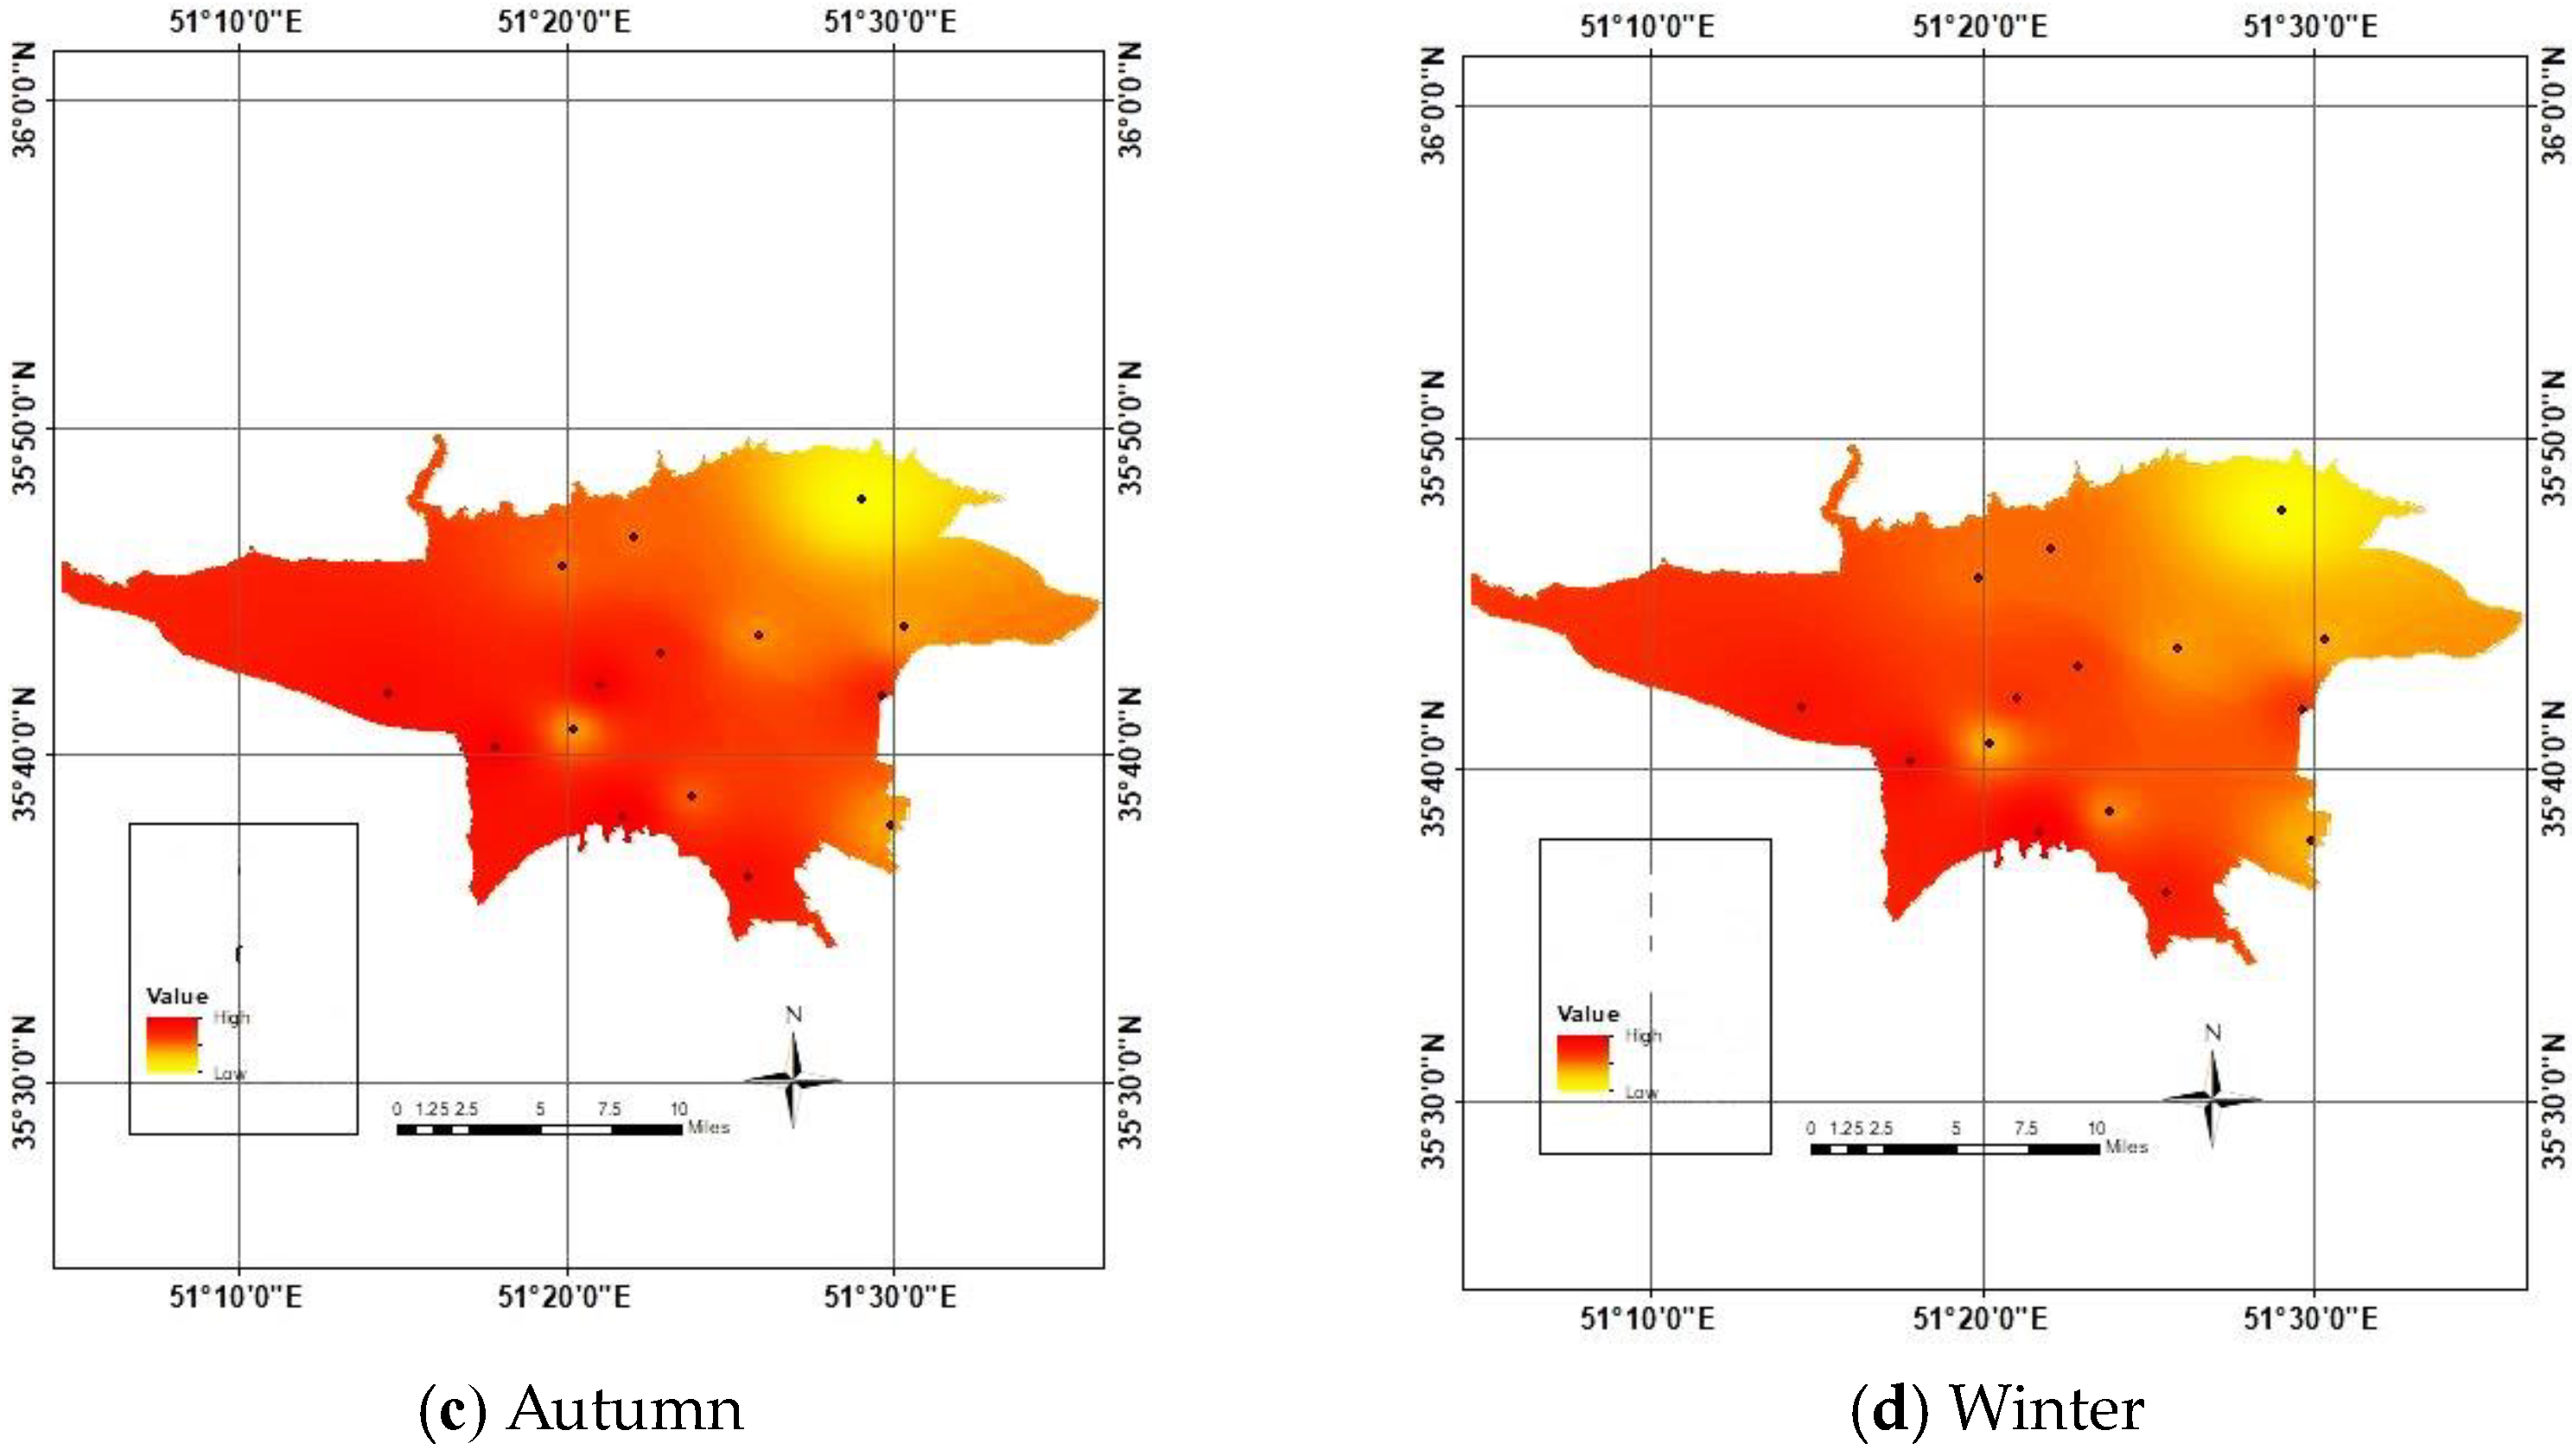
- During which seasons of the year does air pollution tend to be more pronounced?
1.3. Paper Organization
2. Materials and Methods
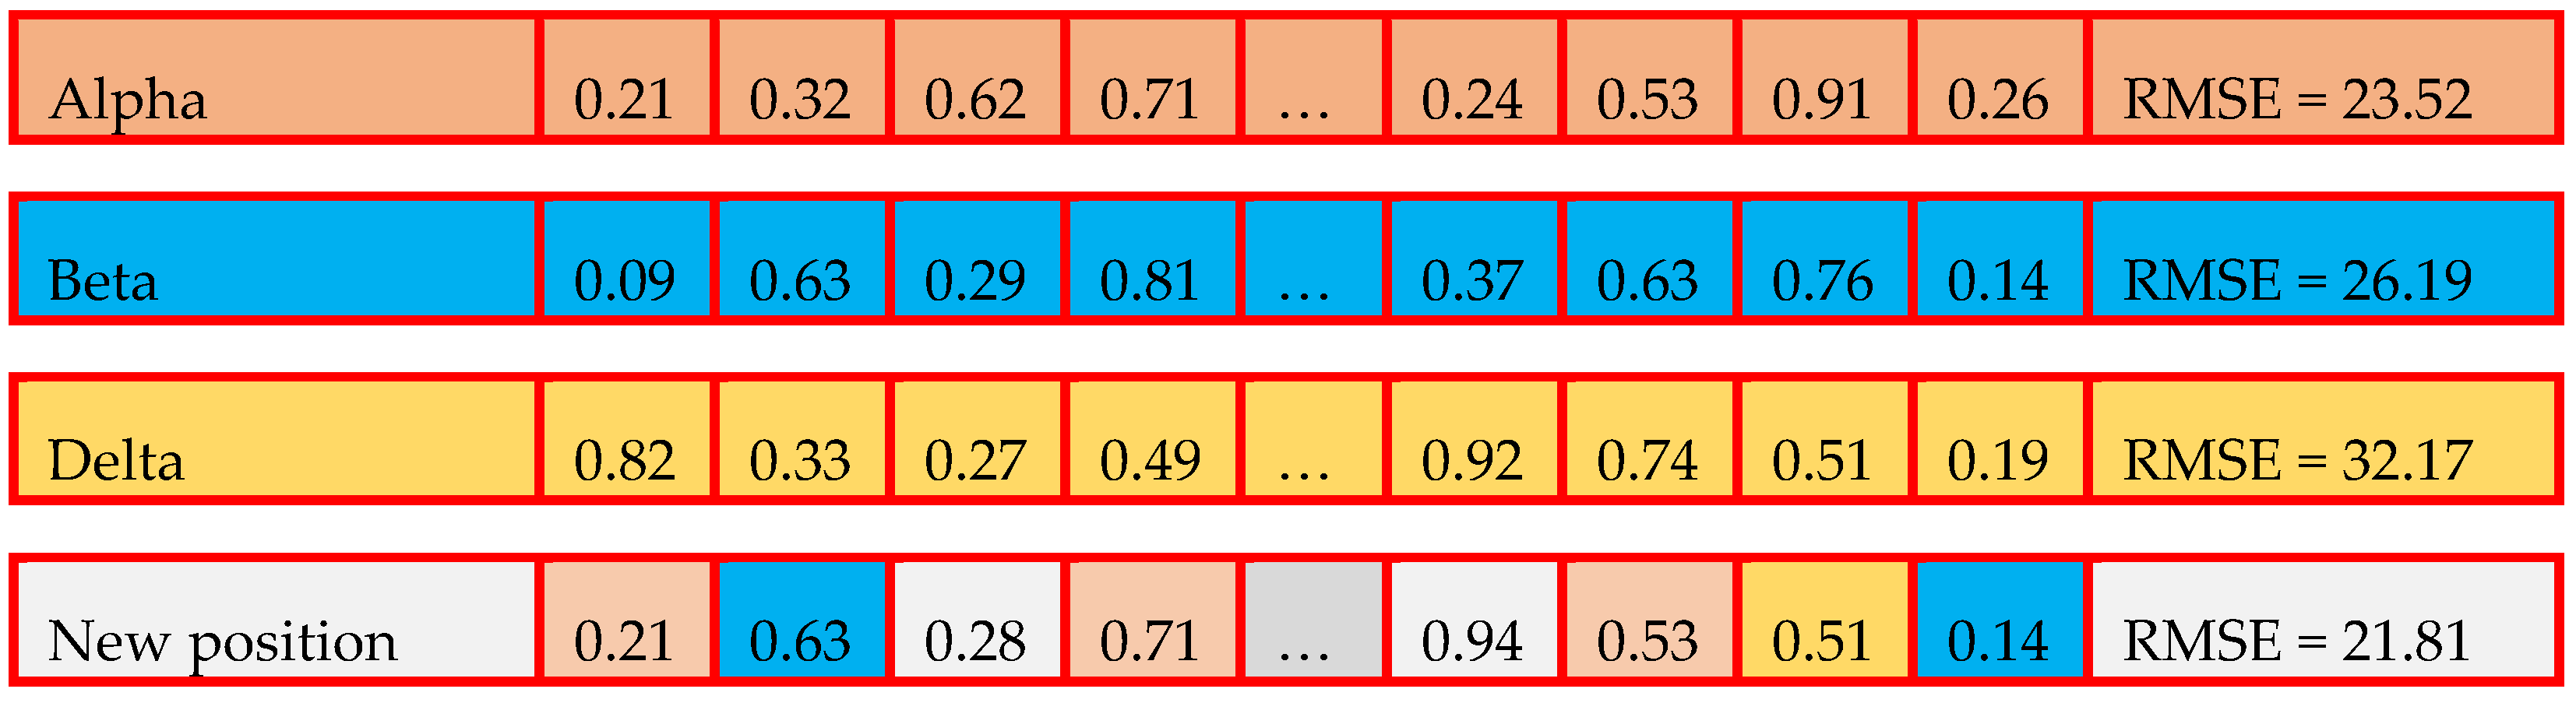
2.1. Novel Binary GWO
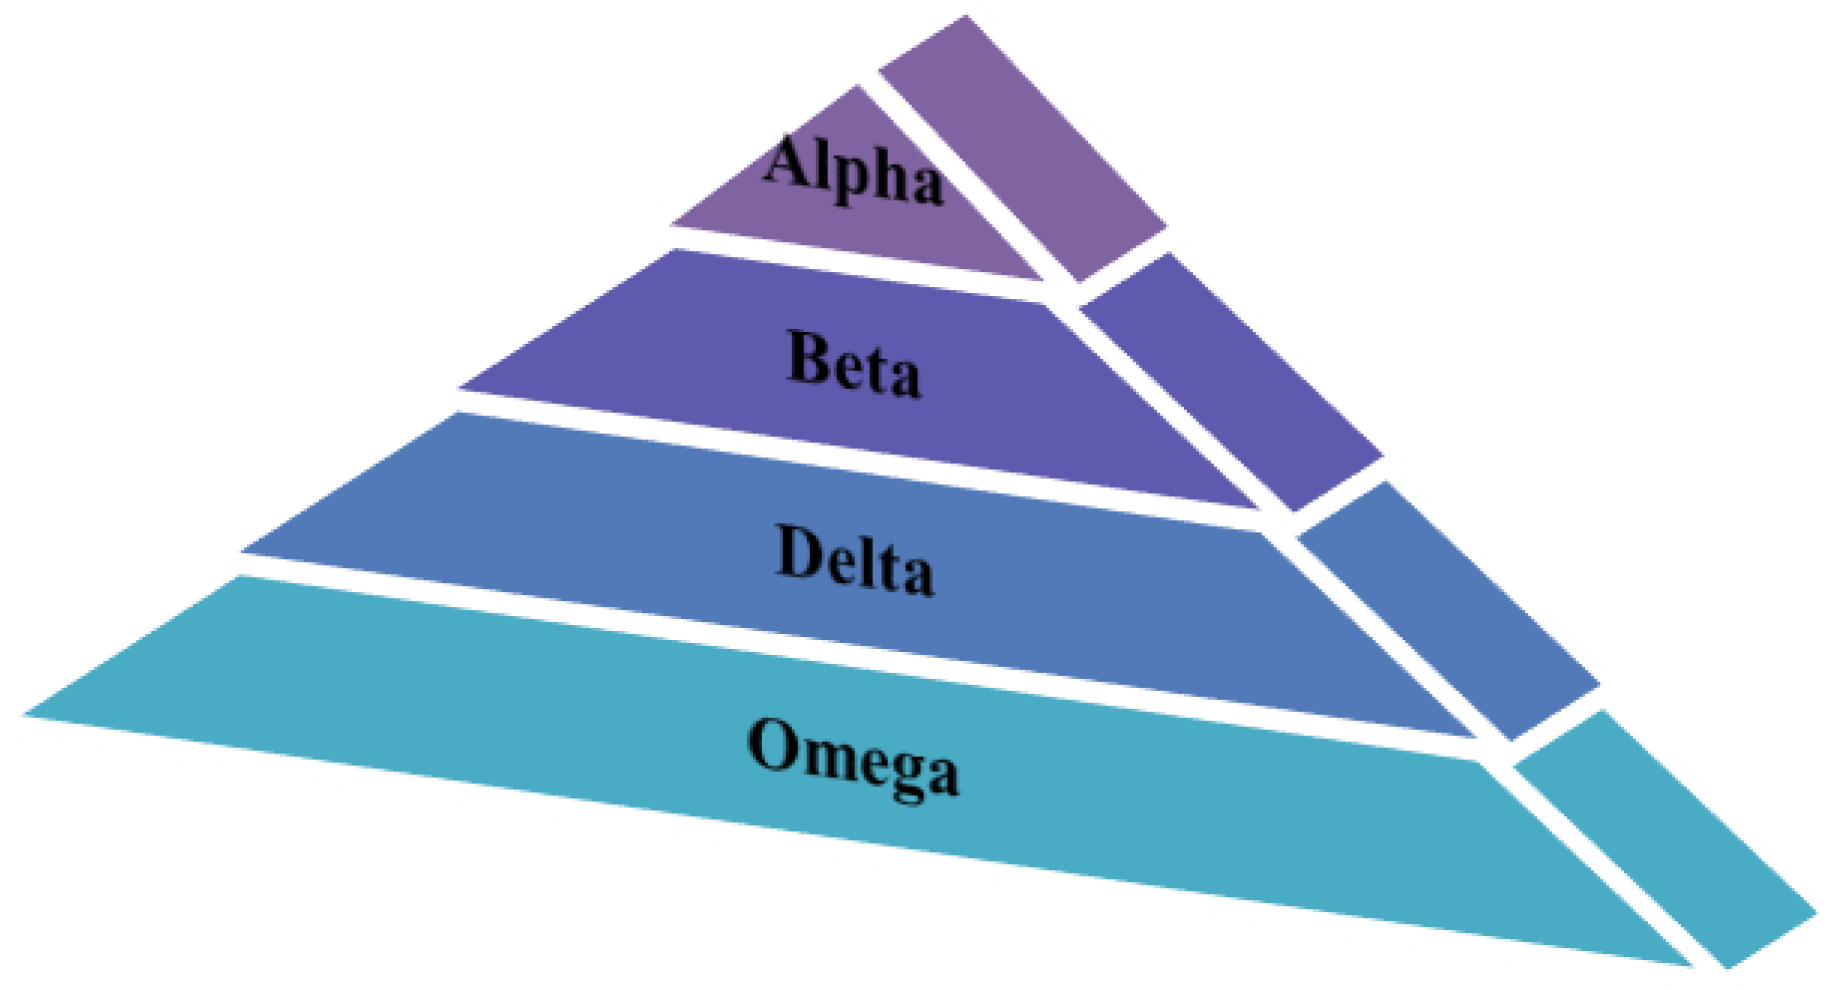
- Initialization: The positions of the alpha, beta, and delta wolves are initially set randomly within the search space, representing potential solutions.
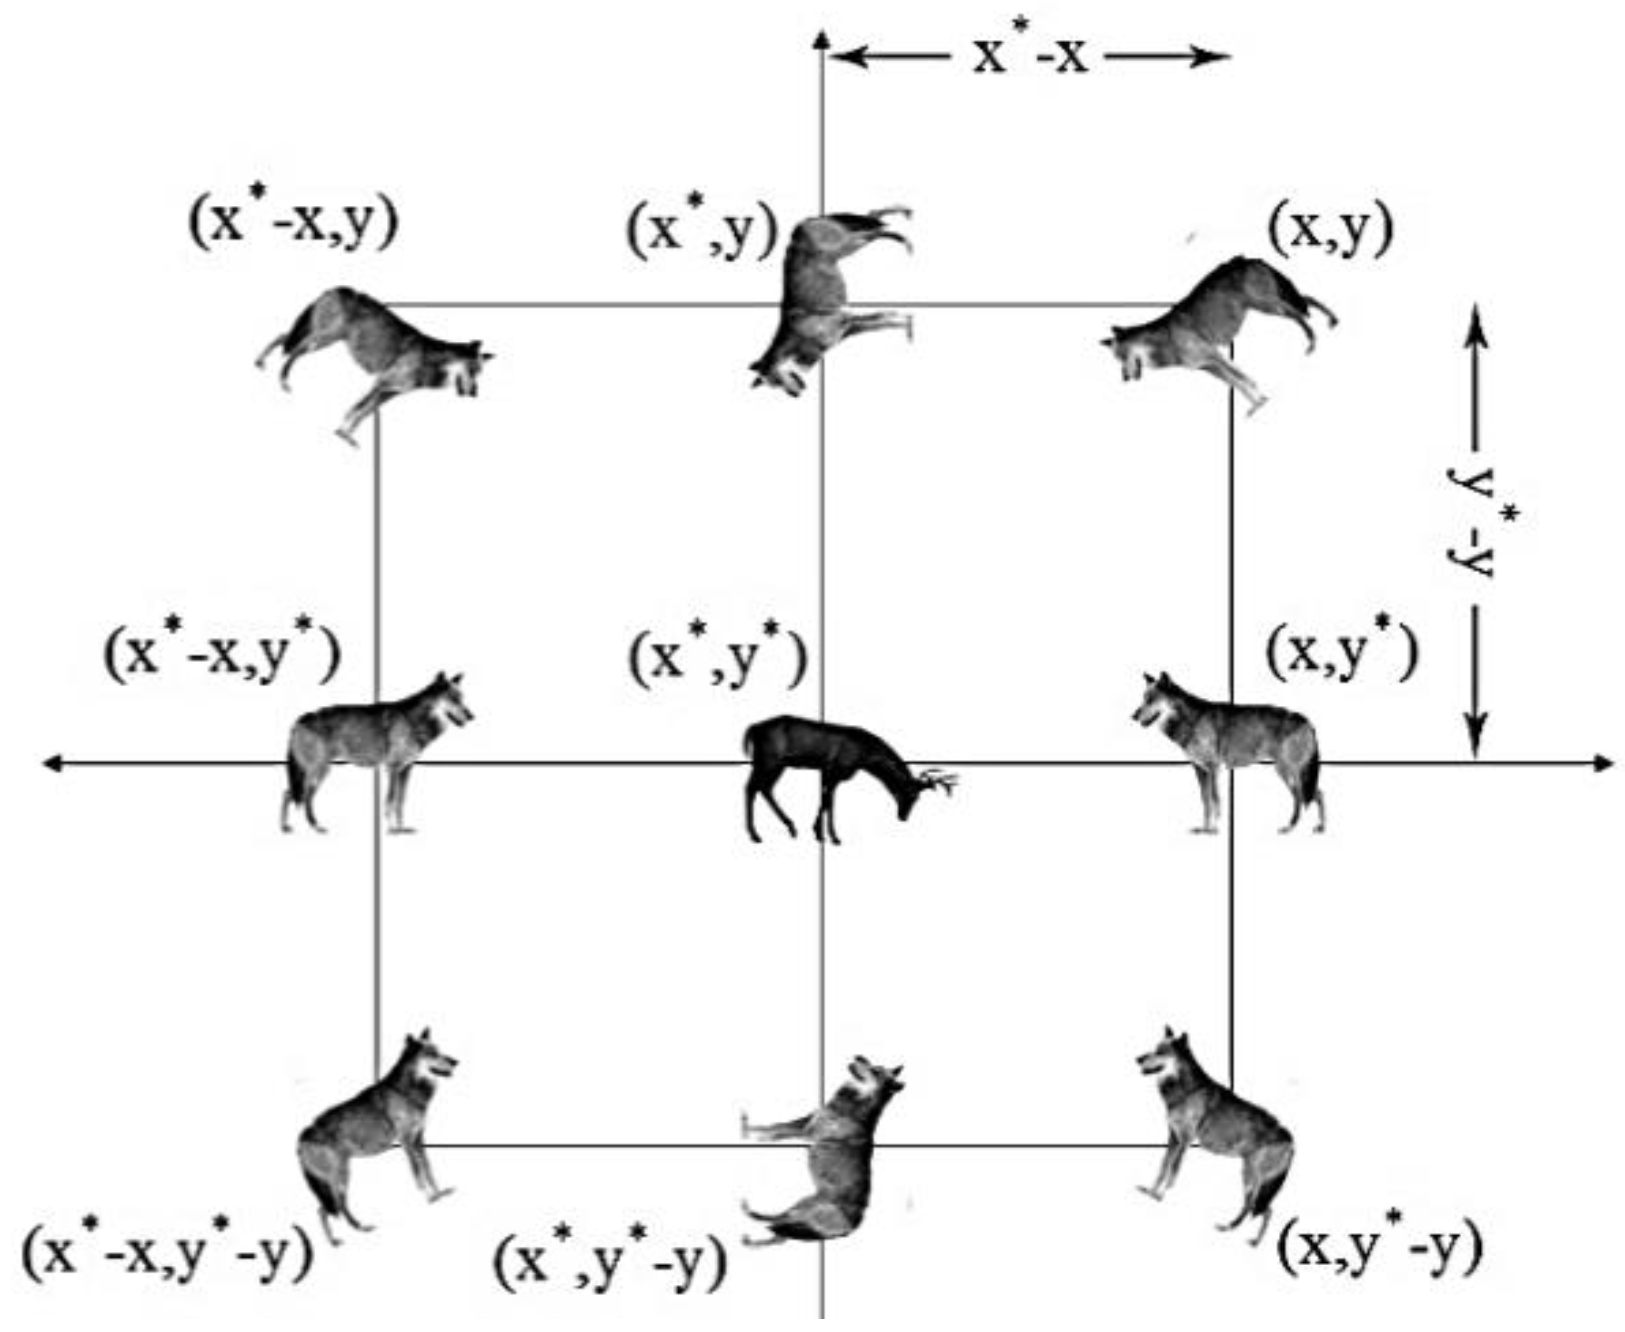
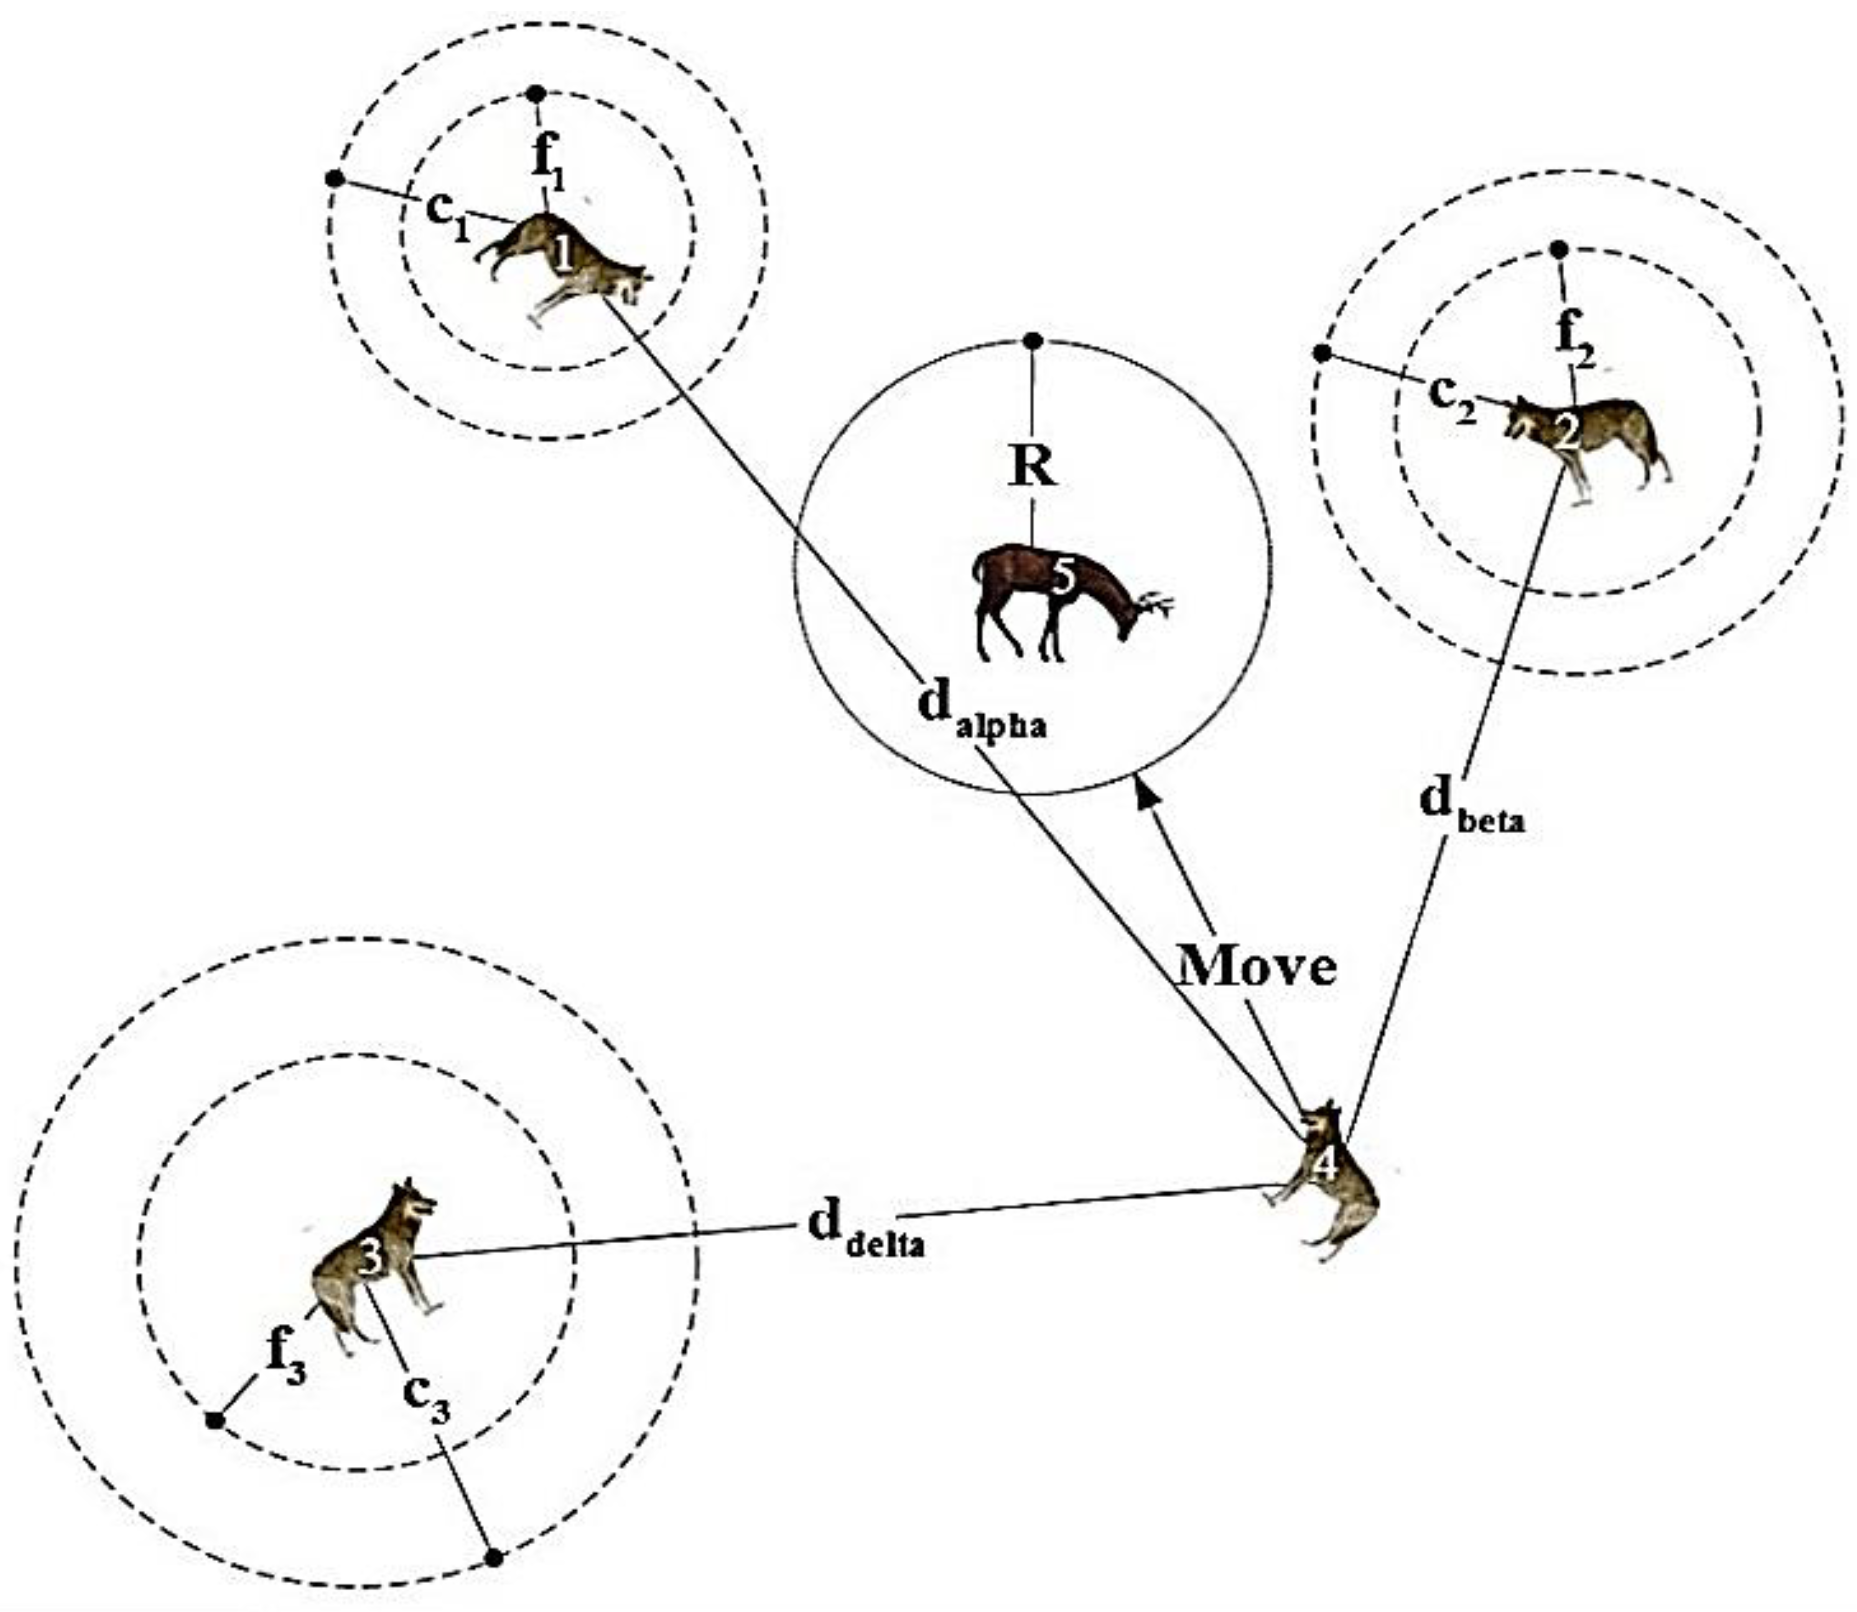
- Search Phase: Other wolves in the pack adjust their positions based on the positions of the alpha, beta, and delta wolves. This adjustment is influenced by the social hierarchy and the concept of exploration and exploitation. The algorithm aims to strike a balance between exploring new areas of the search space and exploiting promising regions.
- Update: The alpha, beta, and delta wolves’ positions are updated based on their fitness values and the positions of other wolves. This update helps refine the positions of the leaders, guiding the search towards better solutions.
- Smooth Transformation: Sigmoid functions offer a smooth and continuous transformation of input values. This smoothness aids in the convergence of optimization algorithms, as it enables gradual adjustments to the solutions being explored. This can help prevent abrupt and erratic changes in the search space, leading to more stable optimization processes.
- Non-Linearity: This non-linearity can help algorithms explore diverse regions of the search space and escape local optima. It enables the algorithm to adapt and respond to different types of fitness landscapes, including those with complex and irregular shapes.
- Sigmoid Shaping: Sigmoid functions can shape the transfer functions effectively. They can map the real-valued outputs of the optimization algorithm to binary values (0 or 1) in a controlled and gradual manner. This ensures that the binary versions of meta-heuristic algorithms maintain their effectiveness while working with discrete solutions.
- Compatibility: Sigmoid functions are compatible with various optimization algorithms, making them a valuable choice for adapting algorithms such as GWO to binary optimization.
- Transfer Function Design: Researchers have developed a deep understanding of how to design sigmoid transfer functions to suit different optimization scenarios. This knowledge base has led to the development of novel sigmoid functions specifically tailored for binary optimization, further enhancing their effectiveness.
- Empirical Success: The empirical success of using sigmoid functions in binary optimization is well-documented in the literature.
| Algorithm 1: The Pseudo code of the proposed BGWO. |
| Input: n: Number of grey wolves, N: Number of iterations. Output: Xα: Optimal grey wolf binary position, F (Xα): Best fitness value. Initialize a population of n wolves’ positions at random [0, 1]. Find the solutions based on fitness. While stopping criteria not met do pack do Update position to a binary position according to Equation (8). end Update, A, C. Evaluate the positions of individual wolves. Update. End |
2.2. Optimized DNN
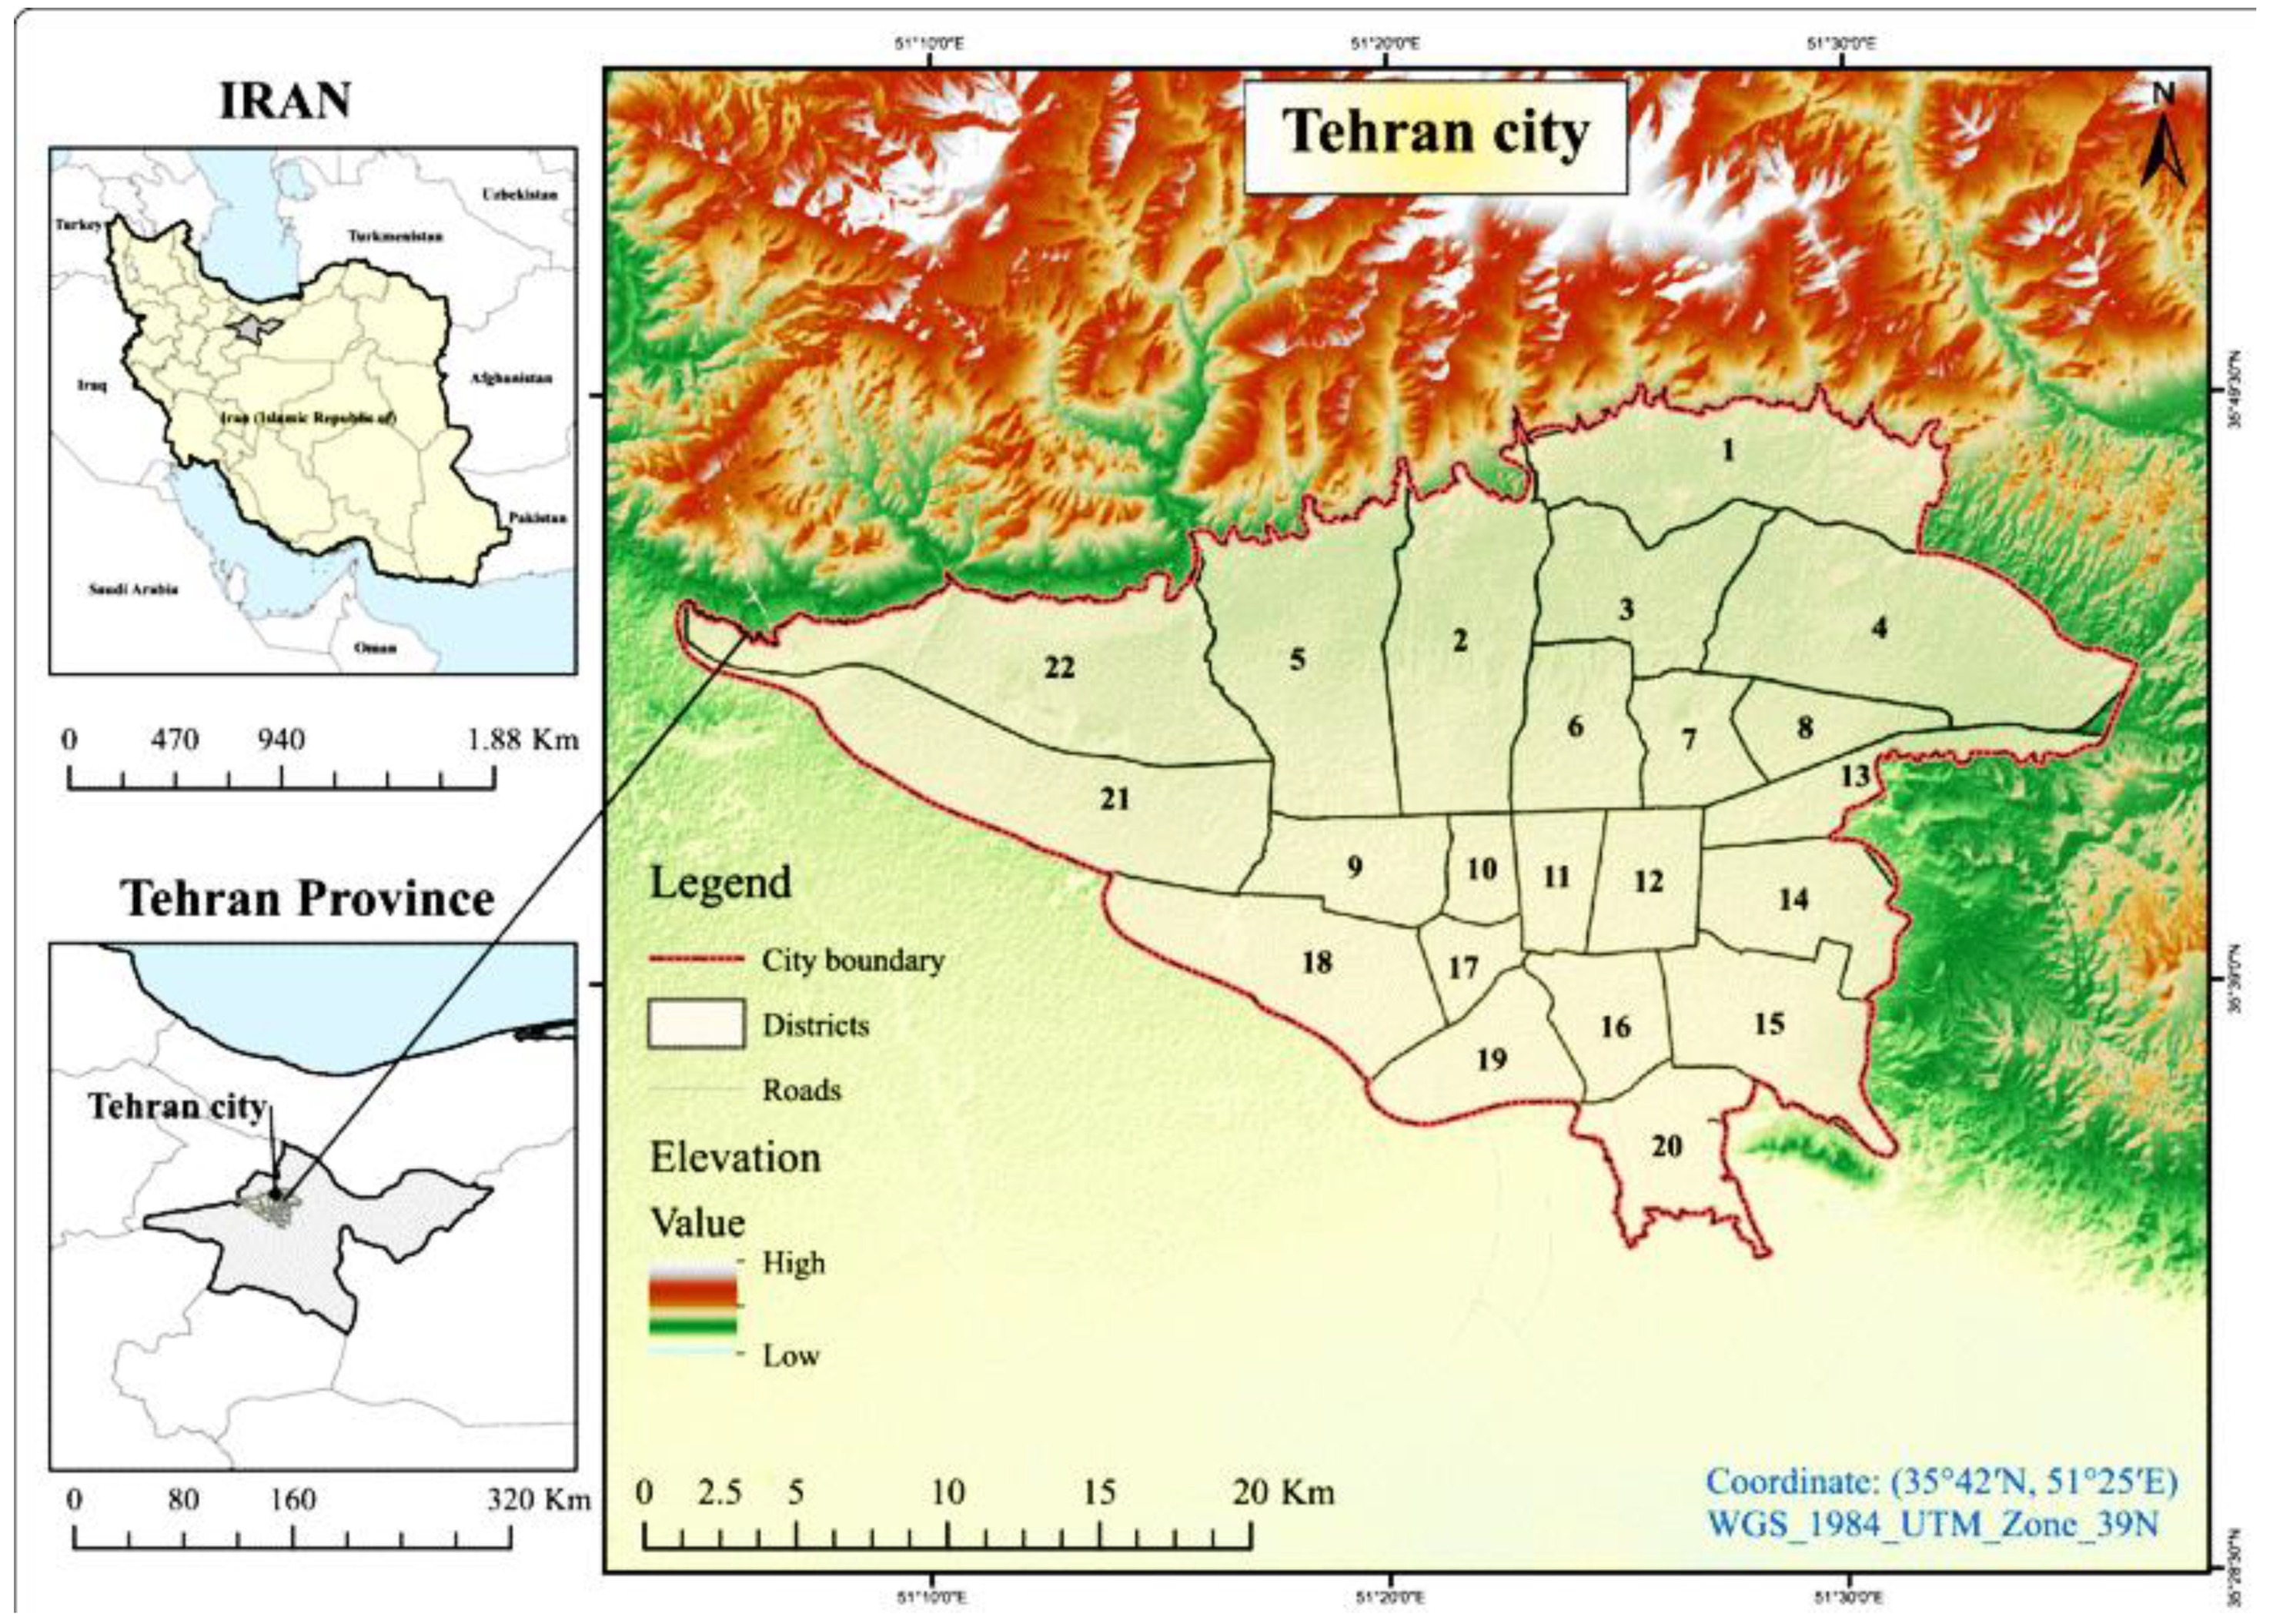
2.3. Case Study
3. Results
4. Conclusions
Author Contributions
Funding
Data Availability Statement
Acknowledgments
Conflicts of Interest
References
- Shepelev, V.; Glushkov, A.; Slobodin, I.; Cherkassov, Y. Measuring and Modelling the Concentration of Vehicle-Related PM2. 5 and PM10 Emissions Based on Neural Networks. Mathematics 2023, 11, 1144. [Google Scholar] [CrossRef]
- Park, D.H.; Kim, S.W.; Kim, M.H.; Yeo, H.; Park, S.S.; Nishizawa, T.; Kim, C.H. Impacts of local versus long-range transported aerosols on PM10 concentrations in Seoul, Korea: An estimate based on 11-year PM10 and lidar observations. Sci. Total Environ. 2021, 750, 141739. [Google Scholar] [CrossRef] [PubMed]
- Chen, B.; Song, Z.; Shi, B.; Li, M. An interpretable deep forest model for estimating hourly PM10 concentration in China using Himawari-8 data. Atmos. Environ. 2022, 268, 118827. [Google Scholar] [CrossRef]
- Tadano, Y.D.S.; Bacalhau, E.T.; Casacio, L.; Puchta, E.; Pereira, T.S.; Antonini Alves, T.; Siqueira, H.V. Unorganized machines to estimate the number of hospital admissions due to respiratory diseases caused by PM10 concentration. Atmosphere 2021, 12, 1345. [Google Scholar] [CrossRef]
- Tırınk, S.; Öztürk, B. Evaluation of PM10 concentration by using Mars and XGBOOST algorithms in Iğdır Province of Türkiye. Int. J. Environ. Sci. Technol. 2023, 20, 5349–5358. [Google Scholar] [CrossRef]
- Hong, W.Y.; Koh, D.; Yu, L.E. Development and Evaluation of Statistical Models Based on Machine Learning Techniques for Estimating Particulate Matter (PM2. 5 and PM10) Concentrations. Int. J. Environ. Res. Public Health 2022, 19, 7728. [Google Scholar] [CrossRef]
- Mohammadi, Y.; Zandi, O.; Nasseri, M.; Rashidi, Y. Spatiotemporal modeling of PM10 via committee method with in-situ and large scale information: Coupling of machine learning and statistical methods. Urban Clim. 2023, 49, 101494. [Google Scholar] [CrossRef]
- Hongthong, A.; Nanthapong, K.; Kanabkaew, T. Estimation of Respiratory Disease Burden Attributed to Particulate Matter from Biomass Burning in Northern Thailand Using 1-km Resolution MAIAC-AOD. Appl. Environ. Res. 2023, 45, 2. [Google Scholar] [CrossRef]
- Shao, H.; Li, H.; Jin, S.; Fan, R.; Wang, W.; Liu, B.; Gong, W. Exploring the Conversion Model from Aerosol Extinction Coefficient to PM1, PM2. 5 and PM10 Concentrations. Remote Sens. 2023, 15, 2742. [Google Scholar] [CrossRef]
- Lee, S.; Park, S.; Lee, M.I.; Kim, G.; Im, J.; Song, C.K. Air quality forecasts improved by combining data assimilation and machine learning with satellite AOD. Geophys. Res. Lett. 2022, 49, e2021GL096066. [Google Scholar] [CrossRef]
- Tuna Tuygun, G.; Elbir, T. Estimation of particulate matter concentrations in Türkiye using a random forest model based on satellite AOD retrievals. Stoch. Environ. Res. Risk Assess. 2023, 2023, 3469–3491. [Google Scholar] [CrossRef]
- Imani, M. Concentration Estimation of Air Pollutants (PM2. 5 and PM10) Using MODIS Satellite Data, Deep Neural Network and Random Forest. Soft Comput. J. 2023, 12, 1–19. [Google Scholar]
- You, W.; Zang, Z.; Zhang, L.; Li, Z.; Chen, D.; Zhang, G. Estimating ground-level PM10 concentration in northwestern China using geographically weighted regression based on satellite AOD combined with CALIPSO and MODIS fire count. Remote Sens. Environ. 2015, 168, 276–285. [Google Scholar] [CrossRef]
- Machupalli, R.; Hossain, M.; Mandal, M. Review of ASIC accelerators for deep neural network. Microprocess. Microsyst. 2022, 89, 104441. [Google Scholar] [CrossRef]
- Fard, S.S.; Kaveh, M.; Mosavi, M.R.; Ko, S.B. An efficient modeling attack for breaking the security of XOR-Arbiter PUFs by using the fully connected and long-short term memory. Microprocess. Microsyst. 2022, 94, 104667. [Google Scholar] [CrossRef]
- Najafi, F.; Kaveh, M.; Martín, D.; Reza Mosavi, M. Deep PUF: A highly reliable DRAM PUF-based authentication for IoT networks using deep convolutional neural networks. Sensors 2021, 21, 2009. [Google Scholar] [CrossRef]
- Aghapour, S.; Kaveh, M.; Mosavi, M.R.; Martín, D. An ultra-lightweight mutual authentication scheme for smart grid two-way communications. IEEE Access. 2021, 9, 74562–74573. [Google Scholar] [CrossRef]
- Baniasadi, S.; Rostami, O.; Martín, D.; Kaveh, M. A novel deep supervised learning-based approach for intrusion detection in IoT systems. Sensors 2022, 22, 4459. [Google Scholar] [CrossRef]
- Kaveh, M.; Mesgari, M.S. Application of meta-heuristic algorithms for training neural networks and deep learning architec-tures: A comprehensive review. Neural Process. Lett. 2022, 55, 4519–4622. [Google Scholar] [CrossRef] [PubMed]
- Kaya, U.; Yılmaz, A.; Aşar, S. Sepsis Prediction by Using a Hybrid Metaheuristic Algorithm: A Novel Approach for Optimizing Deep Neural Networks. Diagnostics 2023, 13, 2023. [Google Scholar] [CrossRef]
- Khan, M.S.; Jabeen, F.; Ghouzali, S.; Rehman, Z.; Naz, S.; Abdul, W. Metaheuristic algorithms in optimizing deep neural network model for software effort estimation. IEEE Access. 2021, 9, 60309–60327. [Google Scholar] [CrossRef]
- Kaveh, M.; Mesgari, M.S.; Martín, D.; Kaveh, M. TDMBBO: A novel three-dimensional migration model of biogeography-based optimization (case study: Facility planning and benchmark problems). J. Supercomput. 2023, 79, 9715–9770. [Google Scholar] [CrossRef]
- Kaveh, M.; Aghapour, S.; Martin, D.; Mosavi, M.R. A secure lightweight signcryption scheme for smart grid communications using reliable physically unclonable function. In Proceedings of the 2020 IEEE International Conference on Environment and Electrical Engineering and 2020 IEEE Industrial and Commercial Power Systems Europe (EEEIC/I&CPS Europe), Madrid, Spain, 9–12 June 2020; pp. 1–6. [Google Scholar]
- Kaveh, M.; Mesgari, M.S.; Saeidian, B. Orchard Algorithm (OA): A new meta-heuristic algorithm for solving discrete and continuous optimization problems. Math. Comput. Simul. 2023, 208, 19–35. [Google Scholar] [CrossRef]
- Mirjalili, S.; Mirjalili, S.M.; Lewis, A. Grey wolf optimizer. Adv. Eng. Softw. 2014, 69, 46–61. [Google Scholar] [CrossRef]
- Mirjalili, S.; Hashim, S.Z.M. BMOA: Binary magnetic optimization algorithm. Int. J. Mach. Learn. Comput. 2012, 2, 204. [Google Scholar] [CrossRef]
- Emary, E.; Zawbaa, H.M.; Hassanien, A.E. Binary grey wolf optimization approaches for feature selection. Neurocomputing 2016, 172, 371–381. [Google Scholar] [CrossRef]
- Guha, R.; Ghosh, M.; Chakrabarti, A.; Sarkar, R.; Mirjalili, S. Introducing clustering based population in binary gravitational search algorithm for feature selection. Appl. Soft Comput. 2020, 93, 106341. [Google Scholar] [CrossRef]
- Montavon, G.; Samek, W.; Müller, K.R. Methods for interpreting and understanding deep neural networks. Digit. Signal Process. 2018, 73, 1–15. [Google Scholar] [CrossRef]
- Samek, W.; Montavon, G.; Lapuschkin, S.; Anders, C.J.; Müller, K.R. Explaining deep neural networks and beyond: A review of methods and applications. Proc. IEEE 2021, 109, 247–278. [Google Scholar] [CrossRef]
- Gawlikowski, J.; Tassi, C.R.N.; Ali, M.; Lee, J.; Humt, M.; Feng, J.; Zhu, X.X. A survey of uncertainty in deep neural networks. Artif. Intell. Rev. 2023, 1–77. [Google Scholar] [CrossRef]
- Abdou, M.A. Literature review: Efficient deep neural networks techniques for medical image analysis. Neural Comput. Appl. 2022, 34, 5791–5812. [Google Scholar] [CrossRef]
- Vafa-Arani, H.; Jahani, S.; Dashti, H.; Heydari, J.; Moazen, S. A system dynamics modeling for urban air pollution: A case study of Tehran, Iran. Transp. Res. Part D Transp. Environ. 2014, 31, 21–36. [Google Scholar] [CrossRef]
- Habibi, R.; Alesheikh, A.A.; Mohammadinia, A.; Sharif, M. An assessment of spatial pattern characterization of air pollution: A case study of CO and PM2. 5 in Tehran, Iran. ISPRS Int. J. Geo-Inf. 2017, 6, 270. [Google Scholar] [CrossRef]
- Wang, M.; Wang, Y.; Teng, F.; Li, S.; Lin, Y.; Cai, H. Estimation and Analysis of PM2. 5 Concentrations with NPP-VIIRS Nighttime Light Images: A Case Study in the Chang-Zhu-Tan Urban Agglomeration of China. Int. J. Environ. Res. Public Health 2022, 19, 4306. [Google Scholar] [CrossRef] [PubMed]
- Wang, Y.; Wang, M.; Huang, B.; Li, S.; Lin, Y. Estimation and analysis of the nighttime PM2. 5 concentration based on lj1-01 images: A case study in the pearl river delta urban agglomeration of china. Remote Sens. 2021, 13, 3405. [Google Scholar] [CrossRef]
- Vahidi, M.; Aghakhani, S.; Martín, D.; Aminzadeh, H.; Kaveh, M. Optimal Band Selection Using Evolutionary Machine Learning to Improve the Accuracy of Hyper-spectral Images Classification: A Novel Migration-Based Particle Swarm Optimization. J. Classif. 2023, 2023, 1–36. [Google Scholar] [CrossRef]
- Mohammadi, R.; Sahebi, M.R.; Omati, M.; Vahidi, M. Synthetic aperture radar remote sensing classification using the bag of visual words model to land cover studies. Int. J. Geol. Environ. Eng. 2018, 12, 588–591. [Google Scholar]
- Khajehyar, R.; Vahidi, M.; Tripepi, R. Determining Nitrogen Foliar Nutrition of Tissue Culture Shoots of Little-Leaf Mockorange By Using Spectral Imaging. In Proceedings of the 2021 ASHS Annual Conference, Denver, CO, USA, 5–9 August 2021; pp. 1–8. [Google Scholar]


| Algorithm | Parameter | Value |
|---|---|---|
| BGWO | C | 0.7 |
| A | 0.3 | |
| A | [0, 2] | |
| 20 | ||
| 0.49 | ||
| 0.98 | ||
| Population size | 150 | |
| Iteration | 300 | |
| CapSA | Velocity control constants | 1.00 |
| Inertia parameter | 0.64 | |
| Balance and elasticity factors | 0.73, 9 | |
| Population size | 150 | |
| Iteration | 300 | |
| BBO | The probability range for migrating | [0, 1] |
| Elitism percent | 9% | |
| Mutation rate | 0.13 | |
| Population size | 150 | |
| Iteration | 300 | |
| PSO | The inertial movement rate (α) | 0.12 |
| Movement toward the best personal experience rate | 0.66 | |
| Movement toward the best global experience rate | 0.92 | |
| Population size | 150 | |
| Iteration | 300 | |
| DNN | Number of hidden layers | {6, 7, 8} |
| Number of neurons in hidden layers | {10, 25, 55} | |
| Learning rate | 0.21 | |
| Momentum | 0.32 | |
| Activation | Linear and Tanh | |
| Optimizer | SGD and BGWO | |
| GBM | Number of estimators | 100 |
| Learning rate | 1.09 | |
| Regularization parameters | 0.07 | |
| Maximum depth | 11 | |
| RF | Number of estimators | 100 |
| Maximum depth of trees | 10 | |
| Minimum samples per split | 5 | |
| SVM | C (regularization parameter) | 10 |
| Kernel type | Linear and RBF | |
| Gamma | 0.002 | |
| Iteration | 300 |
| Models | Criteria | |||
|---|---|---|---|---|
| Correlation (%) | Accuracy (%) | R2 (%) | RMSE | |
| BGWO-DNN | 92.25 | 93.17 | 88.21 | 16.28 |
| CapSA-DNN | 90.19 | 88.73 | 85.24 | 19.26 |
| BBO-DNN | 88.62 | 86.12 | 83.65 | 20.74 |
| PSO-DNN | 87.06 | 82.10 | 82.95 | 22.16 |
| RF | 84.49 | 80.21 | 74.09 | 24.25 |
| SVM_RBF | 84.28 | 79.19 | 71.41 | 25.30 |
| SVM-Linear | 65.51 | 72.85 | 42.27 | 36.82 |
| GBM | 72.06 | 73.46 | 52.19 | 32.50 |
Disclaimer/Publisher’s Note: The statements, opinions and data contained in all publications are solely those of the individual author(s) and contributor(s) and not of MDPI and/or the editor(s). MDPI and/or the editor(s) disclaim responsibility for any injury to people or property resulting from any ideas, methods, instructions or products referred to in the content. |
© 2023 by the authors. Licensee MDPI, Basel, Switzerland. This article is an open access article distributed under the terms and conditions of the Creative Commons Attribution (CC BY) license (https://creativecommons.org/licenses/by/4.0/).
Share and Cite
Ghajari, Y.E.; Kaveh, M.; Martín, D. Predicting PM10 Concentrations Using Evolutionary Deep Neural Network and Satellite-Derived Aerosol Optical Depth. Mathematics 2023, 11, 4145. https://doi.org/10.3390/math11194145
Ghajari YE, Kaveh M, Martín D. Predicting PM10 Concentrations Using Evolutionary Deep Neural Network and Satellite-Derived Aerosol Optical Depth. Mathematics. 2023; 11(19):4145. https://doi.org/10.3390/math11194145
Chicago/Turabian StyleGhajari, Yasser Ebrahimian, Mehrdad Kaveh, and Diego Martín. 2023. "Predicting PM10 Concentrations Using Evolutionary Deep Neural Network and Satellite-Derived Aerosol Optical Depth" Mathematics 11, no. 19: 4145. https://doi.org/10.3390/math11194145
APA StyleGhajari, Y. E., Kaveh, M., & Martín, D. (2023). Predicting PM10 Concentrations Using Evolutionary Deep Neural Network and Satellite-Derived Aerosol Optical Depth. Mathematics, 11(19), 4145. https://doi.org/10.3390/math11194145