
Volatility Spillover Dynamics and Determinants between FinTech and Traditional Financial Industry: Evidence from China


Abstract
:1. Introduction
2. Literature Review
2.1. The Interconnectedness of FinTech
2.2. The Measurement Approaches of Connectedness
3. Research Methodology
3.1. DY Spillover Measurement Framework
3.2. BK Frequency Domain Spillover Measurement Framework
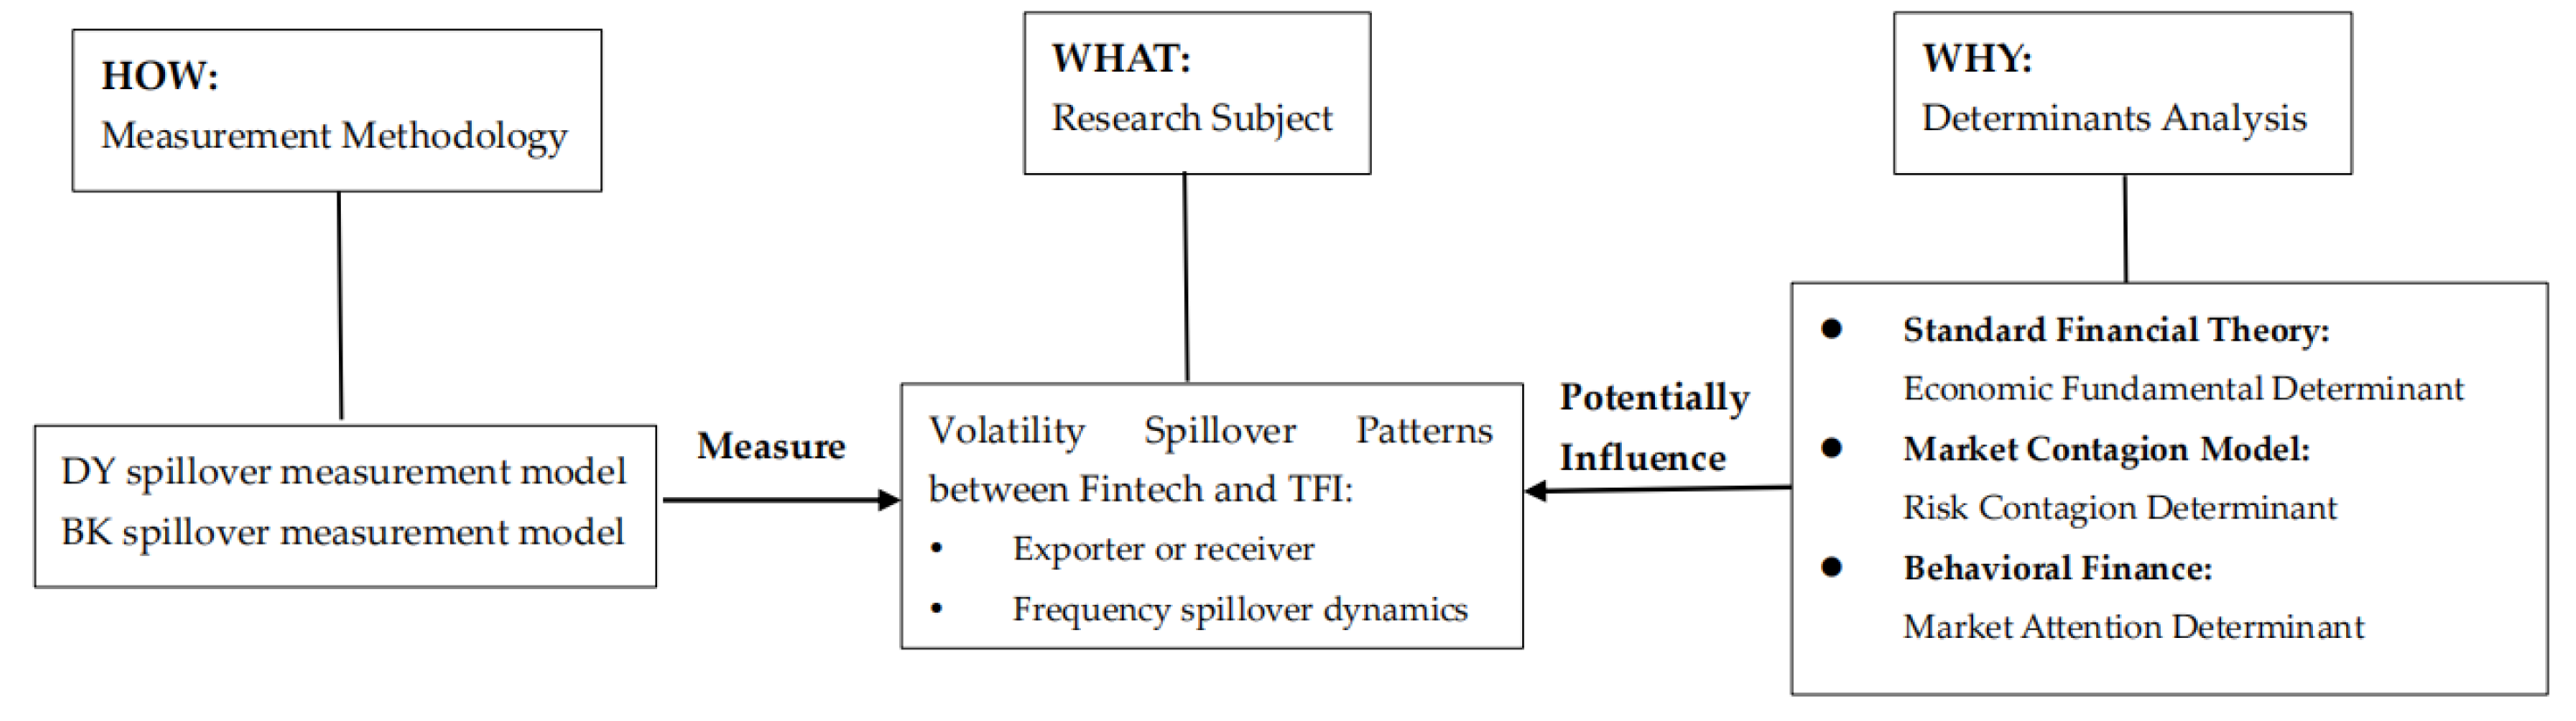
3.3. Determinants of Volatility Spillover between FinTech and Traditional Financial Industry: Conceptual Framework and Empirical Analysis
4. Data
- (I)
- Economic fundamental determinants. The first type of economic fundamental determinant is the macroeconomic variable, which captures the status of the economic and financial environment. The following variables are selected after considering the limited number of macroeconomic variables available in China.
- China financial condition index (CFCI). CFCI reflects the financial condition, financing accessibility, and measures that the monetary policy is either expansionary or contractionary. A high CFCI indicates a contractionary monetary policy, whereas a low CFCI implies the opposite case. Abundant evidence has shown that monetary policy is a critical driver of volatility spillover across markets [96,97]. We use the daily CFCI developed by CBN Research Institute.
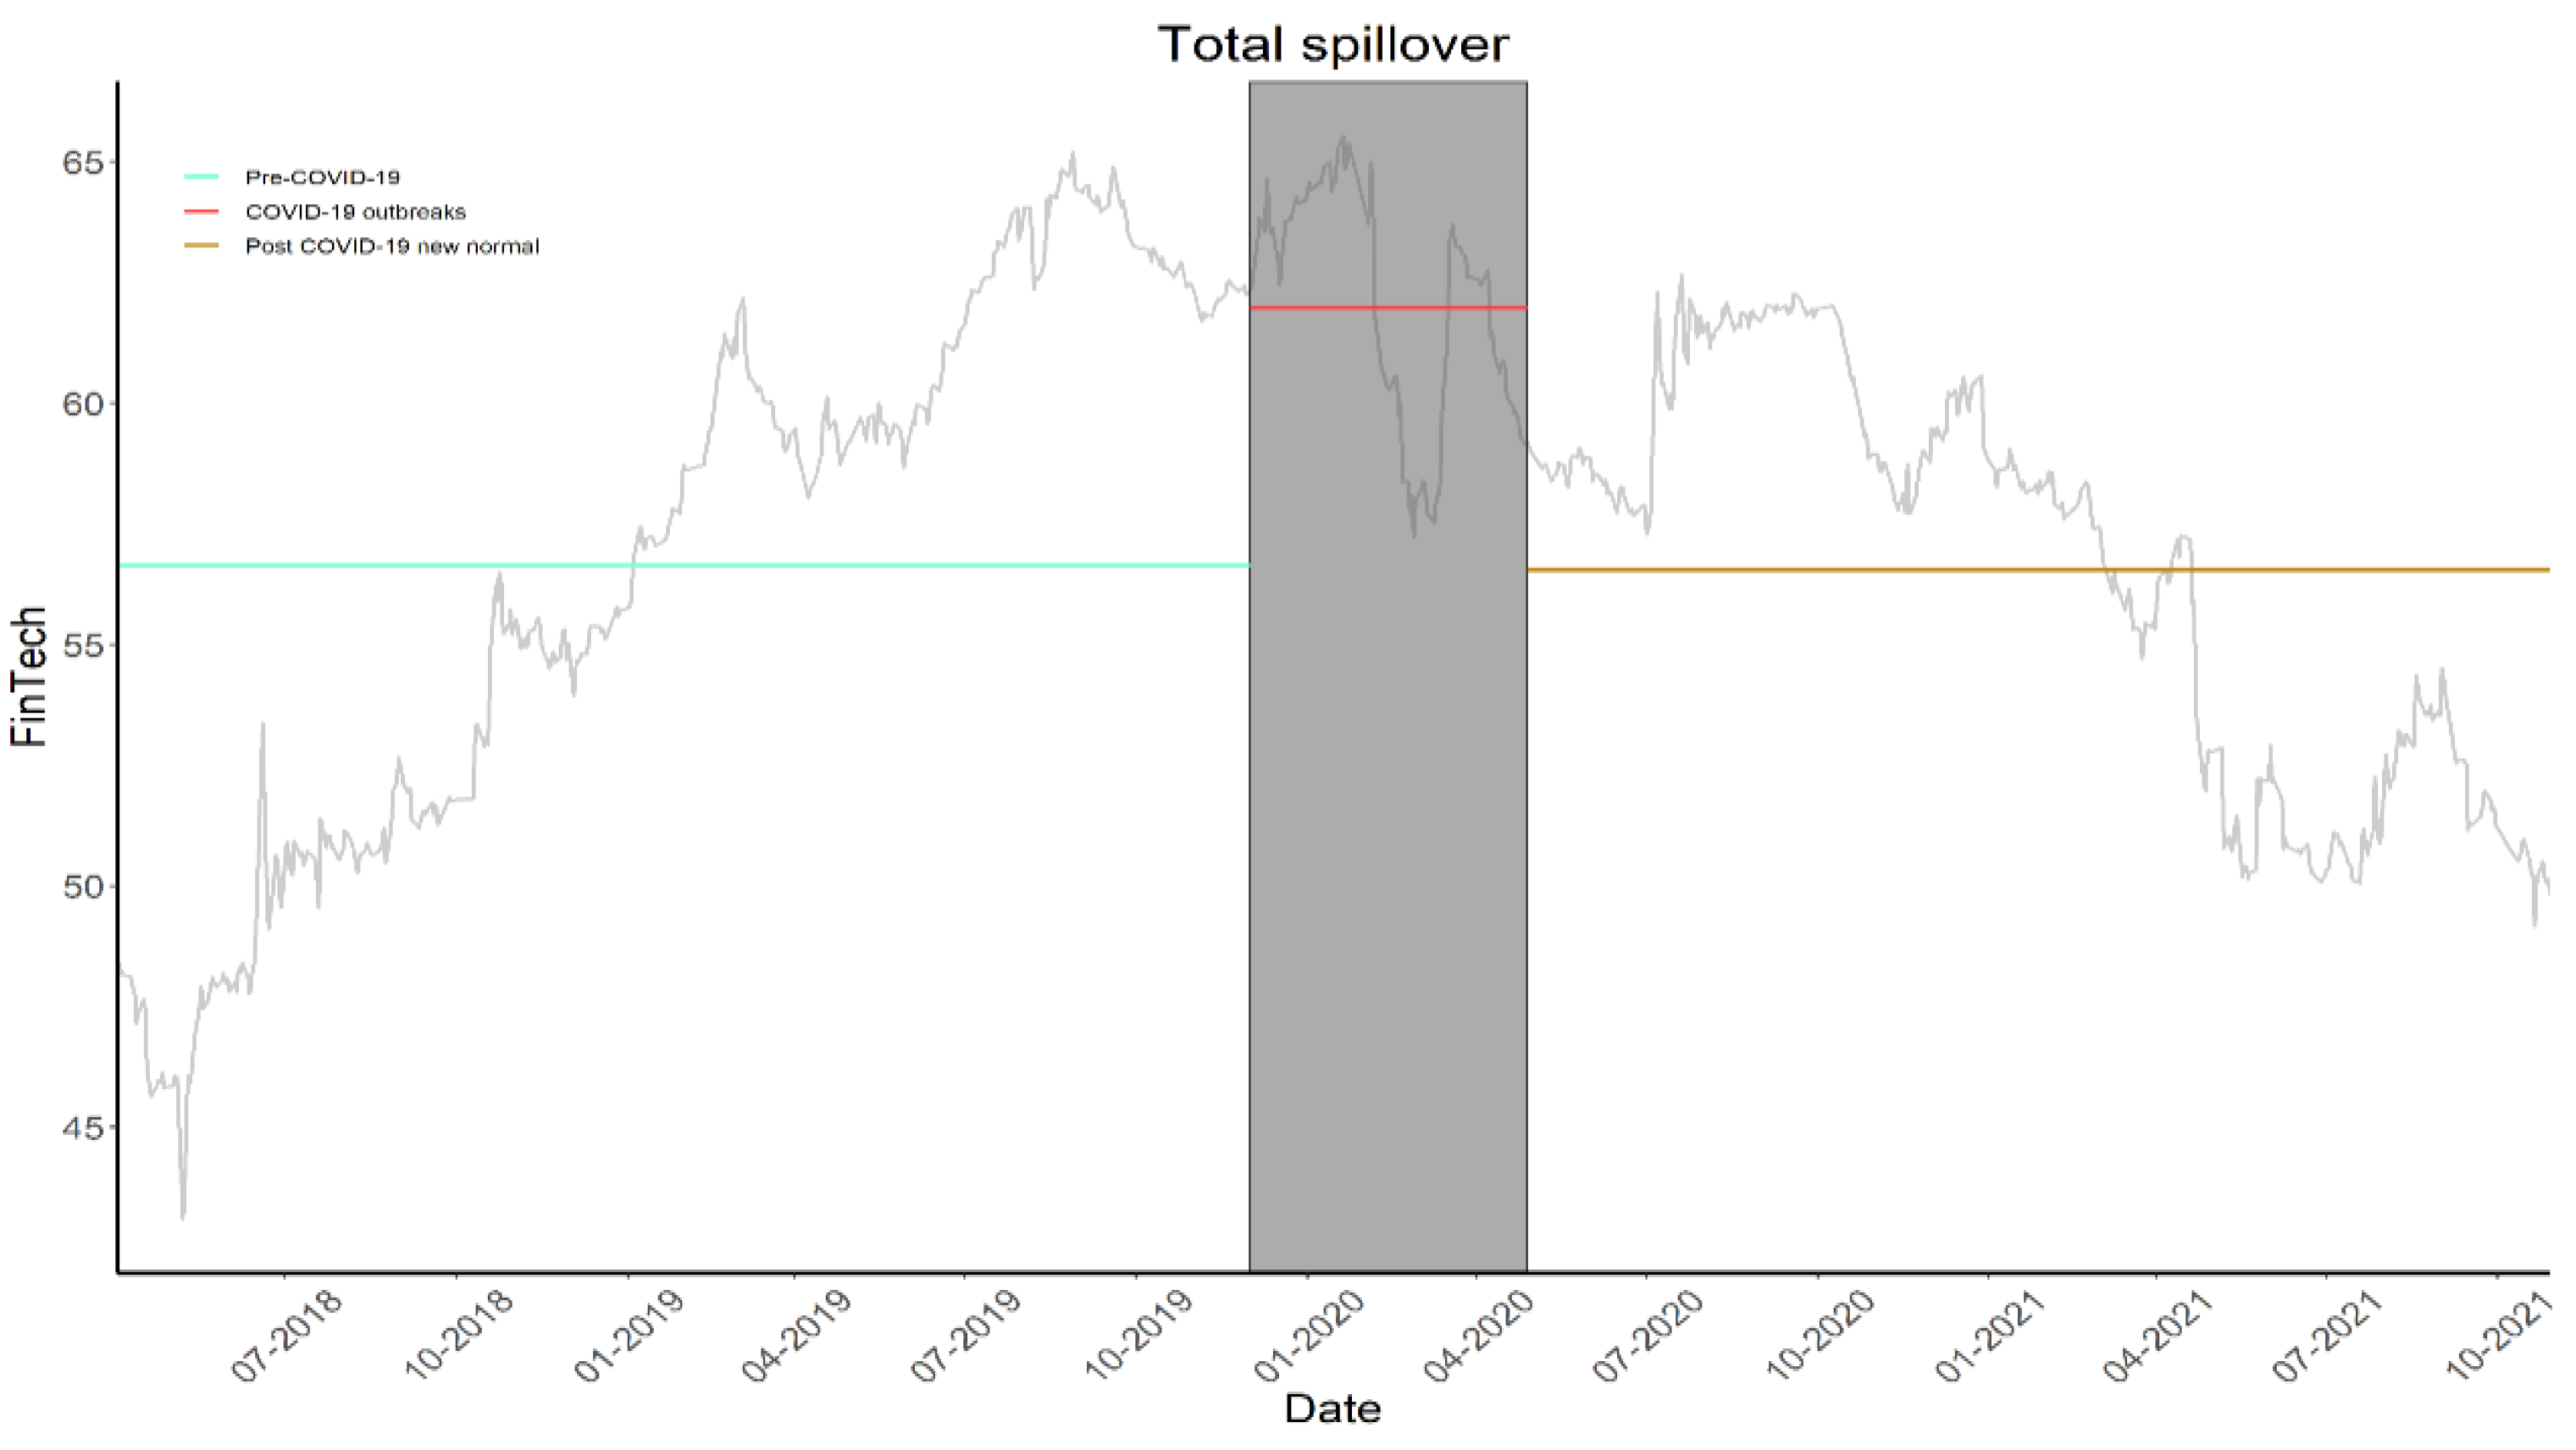
- The second type of economic fundamental determinant is related to major events (ME). The COVID-19 pandemic is a very major event between 2017 and 2021 and was found to cause an increase stock market volatility dramatically [67]. We use a dummy variable to represent the COVID-19 pandemic. Concretely, China’s COVID-19 outbreak period (1 December 2019 to 28 April 2020, defined by Fighting COVID-19: China in Action) is denoted as 1, and the remaining observations are labeled as 0.
- (II)
- Risk contagion determinant. Risk contagion determinant is valid when increments and decrements in the same direction are observed in markets volatility and volatility spillovers. Inspired by Jiang, et al. (2022) [98], we employ weighted average volatility (WAV) of FinTech, Banking, Security, Diversified, and Insurance indices as a proxy of risk contagion.
- (III)
- Market attention determinant. The growing literature has built theoretical framework and empirical models to demonstrate market attention, which is uncorrelated with fundamentals and has a great effect on the volatility spillover of a financial asset [81,87]. Market attention is typically measured by the Google search volume index (GSVI) in previous studies, which was proposed by Da et al. (2011) [99], who argued that search activity is a revealed attention measure. For instance, if an individual searches for a certain stock in Google, she is interested in the stock and pays attention on it. However, because local retail investors account for a major part of trading volume in China’s stock market, we employ the Baidu index, a type of search volume index similar to GSVI, which is powered by the most used search engine in China. The Baidu index shows the search volumes for certain keywords over a given period. Because we focus mainly on the volatility spillover between the TFI and FinTech in China, we search keywords of “banking” , “security” , “insurance”, “diversified financials” and “FinTech” in Chinese and sum up the daily search volumes (DSV) of the keywords as a proxy of market attention.
5. Empirical Analysis
5.1. TSI Dynamics
5.2. DSI and NSI Dynamics
5.3. Frequency Spillover Dynamics
5.4. Determinants of Volatility Spillovers
5.4.1. Determinants of Total Spillover Index
5.4.2. Determinants of Net Spillover Index
5.5. Robustness Checks
6. Conclusions and Implications
Author Contributions
Funding
Data Availability Statement
Conflicts of Interest
References
- FSB. Financial Stability Implications from FinTech: Supervisory and Regulatory Issues that Merit Authorities’ Attention, 27 June 2017. Available online: https://www.fsb.org/wp-content/uploads/R270617.pdf (accessed on 6 September 2018).
- Varga, D. Fintech, the new era of financial services. Vez.-Bp. Manag. Rev. 2017, 2, 22–32. [Google Scholar] [CrossRef]
- Muthukannan, P.; Tan, B.; Tan, F.T.C.; Leong, C. Novel mechanisms of scalability of financial services in an emerging market context: Insights from Indonesian Fintech Ecosystem. Int. J. Inf. Manag. 2021, 61, 102403. [Google Scholar] [CrossRef]
- Ding, N.; Gu, L.; Peng, Y. Fintech, financial constraints and innovation: Evidence from China. J. Corp. Financ. 2022, 73, 102194. [Google Scholar] [CrossRef]
- Gomber, P.; Kauffman, R.J.; Parker, C.; Weber, B.W. On the fintech revolution: Interpreting the forces of innovation, disruption, and transformation in financial services. J. Manag. Inf. Syst. 2018, 2, 220–265. [Google Scholar] [CrossRef]
- Palmié, M.; Wincent, J.; Parida, V.; Caglar, U. The evolution of the financial technology ecosystem: An introduction and agenda for future research on disruptive innovations in ecosystems. Technol. Forecast. Soc. Chang. 2020, 151, 119779. [Google Scholar] [CrossRef]
- Basdekis, C.; Christopoulos, A.; Katsampoxakis, I.; Vlachou, A. FinTech’s rapid growth and its effect on the banking sector. J. Bank. Financ. Technol. 2022, 2, 159–176. [Google Scholar] [CrossRef]
- KMPG. The Pulse of Fintech H2 2020. 2021. Available online: https://assets.kpmg.com/content/dam/kpmg/xx/pdf/2021/02/pulse-of-fintech-h2-2020.pdf (accessed on 25 March 2021).
- Gabor, D.; Brooks, S. The digital revolution in financial inclusion: International development in the fintech era. New Political Econ. 2017, 22, 423–436. [Google Scholar] [CrossRef]
- Senyo, P.K.; Osabutey, E.L. Unearthing antecedents to financial inclusion through FinTech innovations. Technovation 2020, 98, 102155. [Google Scholar] [CrossRef]
- Abbasi, K.; Alam, A.; Du, M.A.; Huynh, T.L.D. FinTech, SME efficiency and national culture: Evidence from OECD countries. Technol. Forecast. Soc. Chang. 2021, 163, 120454. [Google Scholar] [CrossRef]
- Wang, Y.; Xiuping, S.; Zhang, Q. Can fintech improve the efficiency of commercial banks?—An analysis based on big data. Res. Int. Bus. Financ. 2021, 55, 101338. [Google Scholar] [CrossRef]
- Fung, D.W.; Lee, W.Y.; Yeh, J.J.; Yuen, F.L. Friend or foe: The divergent effects of FinTech on financial stability. Emerg. Mark. Rev. 2020, 45, 100727. [Google Scholar] [CrossRef]
- Cheng, W.G.; de Oliveira Leite, R.; Caldieraro, F. Financial contagion in internet lending platforms: Who pays the price? Financ. Res. Lett. 2022, 45, 102187. [Google Scholar] [CrossRef]
- Caporale, G.M.; Kang, W.Y.; Spagnolo, F.; Spagnolo, N. Cyber-attacks, spillovers and contagion in the cryptocurrency markets. J. Int. Financ. Mark. Inst. Money 2021, 74, 101298. [Google Scholar] [CrossRef]
- Chen, Z.; Zheng, C.; Hao, X. Volatility spillover effect between internet finance and banks. J. Bus. Res. 2022, 141, 512–519. [Google Scholar] [CrossRef]
- Le, L.T.N.; Yarovaya, L.; Nasir, M.A. Did COVID-19 change spillover patterns between Fintech and other asset classes? Res. Int. Bus. Financ. 2021, 58, 101441. [Google Scholar] [CrossRef]
- Le, T.L.; Abakah, E.J.A.; Tiwari, A.K. Time and frequency domain connectedness and spillover among fintech, green bonds and cryptocurrencies in the age of the fourth industrial revolution. Technol. Forecast. Soc. Chang. 2021, 162, 120382. [Google Scholar] [CrossRef]
- Wu, G.; Luo, J.; Tao, K. Research on the influence of FinTech development on credit supply of commercial banks: The case of China. Appl. Econ. 2023, 1–17. [Google Scholar] [CrossRef]
- Tseng, P.L.; Guo, W.C. Fintech, credit market competition, and bank asset quality. J. Financ. Serv. Res. 2022, 2, 285–318. [Google Scholar] [CrossRef]
- Van Loo, R. Making innovation more competitive: The case of fintech. UCLA Law Rev. 2022, 65, 232. [Google Scholar]
- Cheng, M.; Qu, Y. Does bank FinTech reduce credit risk? Evidence from China. Pac.-Basin Financ. J. 2020, 63, 101398. [Google Scholar] [CrossRef]
- Rafay, A. FinTech as a Disruptive Technology for Financial Institutions; IGI Global: Hershey, PA, USA, 2019. [Google Scholar]
- Dranev, Y.; Frolova, K.; Ochirova, E. The impact of fintech M&A on stock returns. Res. Int. Bus. Financ. 2019, 48, 353–364. [Google Scholar]
- Pi, T.; Hu, H.; Lu, J.; Chen, X. The analysis of Fintech risks in China: Based on fuzzy models. Mathematics 2022, 2, 1395. [Google Scholar] [CrossRef]
- Li, J.; Li, J.; Zhu, X.; Yao, Y.; Casu, B. Risk spillovers between FinTech and traditional financial institutions: Evidence from the US. Int. Rev. Financ. Anal. 2020, 71, 101544. [Google Scholar] [CrossRef]
- Haddad, C.; Hornuf, L. How do fintech start-ups affect financial institutions’ performance and default risk? Eur. J. Financ. 2022, 29, 1761–1792. [Google Scholar] [CrossRef]
- Soloviev, V.I. Fintech ecosystem and landscape in Russia. J. Rev. Glob. Econ. 2018, 7, 377–390. [Google Scholar] [CrossRef]
- Soloviev, V. Fintech ecosystem in Russia. In Proceedings of the 2018 Eleventh International Conference “Management of Large-Scale System Development” (MLSD), Moscow, Russia, 1–3 October 2018; pp. 1–5. [Google Scholar]
- Lee, I.; Shin, Y.J. Fintech: Ecosystem, business models, investment decisions, and challenges. Bus. Horiz. 2018, 2, 35–46. [Google Scholar] [CrossRef]
- Mills, K.G. The Fintech Innovation Cycle. Fintech, Small Business & the American Dream; Springer: Berlin/Heidelberg, Germany, 2018; pp. 67–81. [Google Scholar]
- Goodell, J.W. COVID-19 and finance: Agendas for future research. Financ. Res. Lett. 2020, 35, 101512. [Google Scholar] [CrossRef] [PubMed]
- Giese, J.; Haldane, A. COVID-19 and the financial system: A tale of two crises. Oxf. Rev. Econ. Policy 2020, 36 (Suppl. S1), S200–S214. [Google Scholar] [CrossRef]
- Chevallier, J. COVID-19 pandemic and financial contagion. J. Risk Financ. Manag. 2020, 2, 309. [Google Scholar] [CrossRef]
- Marcu, M.R. The impact of the COVID-19 pandemic on the banking sector. Manag. Dyn. Knowl. Econ. 2021, 9, 205–223. [Google Scholar]
- Li, S.; Yan, Y. DATA-driven shock impact of COVID-19 on the market financial system. Inf. Process. Manag. 2022, 2, 102768. [Google Scholar] [CrossRef]
- Ji, X.; Wang, S.; Xiao, H.; Bu, N.; Lin, X. Contagion effect of financial markets in crisis: An analysis based on the DCC–MGARCH model. Mathematics 2022, 2, 1819. [Google Scholar] [CrossRef]
- Bao, Z.; Huang, D. Shadow banking in a crisis: Evidence from FinTech during COVID-19. J. Financ. Quant. Anal. 2021, 2, 2320–2355. [Google Scholar] [CrossRef]
- Lucey, B.M.; Vigne, S.A.; Yarovaya, L.; Wang, Y. The cryptocurrency uncertainty index. Financ. Res. Lett. 2021, 45, 102147. [Google Scholar] [CrossRef]
- Diniz-Maganini, N.; Diniz, E.H.; Rasheed, A.A. Bitcoin’s price efficiency and safe haven properties during the COVID-19 pandemic: A comparison. Res. Int. Bus. Financ. 2021, 58, 101472. [Google Scholar] [CrossRef] [PubMed]
- Belhassine, O.; Karamti, C. Contagion and portfolio management in times of COVID-19. Econ. Anal. Policy 2021, 72, 73–86. [Google Scholar] [CrossRef]
- Kamran, M.; Butt, P.; Abdel-Razzaq, A.; Djajadikerta, H.G. Is Bitcoin a safe haven? Application of FinTech to safeguard Australian stock markets. Stud. Econ. Financ. 2022, 2, 386–402. [Google Scholar] [CrossRef]
- Chen, Y.; Chiu, J.; Chung, H. Givers or Receivers? Return and volatility spillovers between Fintech and the Traditional Financial Industry. Financ. Res. Lett. 2022, 46, 102458. [Google Scholar] [CrossRef]
- Wang, R.; Liu, J.; Luo, H. Fintech development and bank risk taking in China. Eur. J. Financ. 2021, 27, 397–418. [Google Scholar] [CrossRef]
- Global Fintech Development Report 2020. Available online: http://www.aif.zju.edu.cn/index.php/news/detail/1721.html (accessed on 29 September 2020).
- America Comes First in the Ranking of Global Financial Centers, with China Ranking Third. Available online: http://gb.mofcom.gov.cn/article/jmxw/202106/20210603079385.shtml (accessed on 16 June 2021).
- Diebold, F.X.; Yilmaz, K. Better to give than to receive: Predictive directional measurement of volatility spillovers. Int. J. Forecast. 2012, 2, 57–66. [Google Scholar] [CrossRef]
- Baruník, J.; Křehlík, T. Measuring the frequency dynamics of financial connectedness and systemic risk. J. Financ. Econom. 2018, 2, 271–296. [Google Scholar] [CrossRef]
- Alshater, M.M.; Polat, O.; El Khoury, R.; Yoon, S.-M. Dynamic connectedness among regional FinTech indices in times of turbulences. Appl. Econ. Lett. 2022, 1–6. [Google Scholar] [CrossRef]
- Urom, C. Time–frequency dependence and connectedness between financial technology and green assets. Int. Econ. 2023, 175, 139–157. [Google Scholar] [CrossRef]
- Ha, L.T. Dynamic connectedness between FinTech innovation and energy volatility during the war in time of pandemic. Environ. Sci. Pollut. Res. 2023, 30, 83530–83544. [Google Scholar] [CrossRef] [PubMed]
- El Khoury, R.; Nasrallah, N.; Hussainey, K.; Assaf, R. Spillover analysis across FinTech, ESG, and renewable energy indices before and during the Russia–Ukraine war: International evidence. J. Int. Financ. Manag. Account. 2023, 2, 279–317. [Google Scholar] [CrossRef]
- Abakah, E.J.A.; Tiwari, A.K.; Lee, C.C.; Ntow-Gyamfi, M. Quantile price convergence and spillover effects among Bitcoin, Fintech, and artificial intelligence stocks. Int. Rev. Financ. 2023, 2, 187–205. [Google Scholar] [CrossRef]
- Pacelli, V.; Miglietta, F.; Foglia, M. The extreme risk connectedness of the new financial system: European evidence. Int. Rev. Financ. Anal. 2022, 84, 102408. [Google Scholar] [CrossRef]
- Bhatnagar, M.; Özen, E.; Taneja, S.; Grima, S.; Rupeika-Apoga, R. The Dynamic Connectedness between Risk and Return in the Fintech Market of India: Evidence Using the GARCH-M Approach. Risks 2022, 2, 209. [Google Scholar] [CrossRef]
- Su, X. Dynamic behaviors and contributing factors of volatility spillovers across G7 stock markets. N. Am. J. Econ. Financ. 2020, 53, 101218. [Google Scholar] [CrossRef]
- Khalfaoui, R.; Mefteh-Wali, S.; Viviani, J.L.; Jabeur, S.B.; Abedin, M.Z.; Lucey, B.M. How do climate risk and clean energy spillovers, and uncertainty affect US stock markets? Technol. Forecast. Soc. Chang. 2022, 185, 122083. [Google Scholar] [CrossRef]
- Papież, M.; Rubaszek, M.; Szafranek, K.; Śmiech, S. Are European natural gas markets connected? A time-varying spillovers analysis. Resour. Policy 2022, 79, 103029. [Google Scholar] [CrossRef]
- Golitsis, P.; Gkasis, P.; Bellos, S.K. Dynamic spillovers and linkages between gold, crude oil, S&P 500, and other economic and financial variables. Evidence from the USA. N. Am. J. Econ. Financ. 2022, 63, 101785. [Google Scholar]
- Grampp, W.D. Adam Smith and the economic man. J. Political Econ. 1948, 56, 315–336. [Google Scholar] [CrossRef]
- Markowiz, H. Portfolio selection. J. Financ. 1952, 7, 77–91. [Google Scholar]
- Corradi, V.; Distaso, W.; Mele, A. Macroeconomic determinants of stock volatility and volatility premiums. J. Monet. Econ. 2013, 60, 203–220. [Google Scholar] [CrossRef]
- Engle, R.F.; Ghysels, E.; Sohn, B. Stock market volatility and macroeconomic fundamentals. Rev. Econ. Stat. 2013, 95, 776–797. [Google Scholar] [CrossRef]
- Zhang, P.; Sha, Y.; Xu, Y. Stock market volatility spillovers in G7 and BRIC. Emerg. Mark. Financ. Trade 2021, 57, 2107–2119. [Google Scholar] [CrossRef]
- Hasan, F.; Al-Okaily, M.; Choudhury, T.; Kayani, U. A comparative analysis between FinTech and traditional stock markets: Using Russia and Ukraine war data. Electron. Commer. Res. 2023, 1–26. [Google Scholar] [CrossRef]
- Yang, Z.; Zhou, Y. Quantitative easing and volatility spillovers across countries and asset classes. Manag. Sci. 2017, 63, 333–354. [Google Scholar] [CrossRef]
- Engelhardt, N.; Krause, M.; Neukirchen, D.; Posch, P.N. Trust and stock market volatility during the COVID-19 crisis. Financ. Res. Lett. 2021, 38, 101873. [Google Scholar] [CrossRef]
- Gharbi, O.; Trichili, Y.; Abbes, M.B. Impact of the COVID-19 pandemic on the relationship between uncertainty factors, investor’s behavioral biases and the stock market reaction of US Fintech companies. J. Acad. Financ. 2022, 13, 101–122. [Google Scholar] [CrossRef]
- King, M.A.; Wadhwani, S. Transmission of volatility between stock markets. Rev. Financ. Stud. 1990, 3, 5–33. [Google Scholar] [CrossRef]
- Harasim, J. FinTechs, BigTechs and Banks—When Cooperation and When Competition? J. Risk Financ. Manag. 2021, 14, 614. [Google Scholar] [CrossRef]
- Temelkov, Z. Fintech firms opportunity or threat for banks? Int. J. Inf. Bus. Manag. 2018, 2, 137–143. [Google Scholar]
- Wang, Y.; Nor, E. The Competition and Cooperation Relationship between Financial Technology and Commercial Banks. Glob. Bus. Manag. Res. 2022, 14, 1105–1117. [Google Scholar]
- Anifa, M.; Ramakrishnan, S.; Joghee, S.; Kabiraj, S.; Bishnoi, M.M. Fintech Innovations in the Financial Service Industry. J. Risk Financ. Manag. 2022, 15, 287. [Google Scholar] [CrossRef]
- Peng, L.; Xiong, W. Investor attention, overconfidence and category learning. J. Financ. Econ. 2006, 2, 563–602. [Google Scholar] [CrossRef]
- Zhang, W.; Shen, D.; Zhang, Y.; Xiong, X. Open source information, investor attention, and asset pricing. Econ. Model. 2013, 33, 613–619. [Google Scholar] [CrossRef]
- Hendershott, T.; Menkveld, A.J.; Praz, R.; Seasholes, M. Asset price dynamics with limited attention. Rev. Financ. Stud. 2022, 2, 962–1008. [Google Scholar] [CrossRef]
- Mbanga, C.; Darrat, A.F.; Park, J.C. Investor sentiment and aggregate stock returns: The role of investor attention. Rev. Quant. Financ. Account. 2019, 53, 397–428. [Google Scholar] [CrossRef]
- Lee, W.Y.; Jiang, C.X.; Indro, D.C. Stock market volatility, excess returns, and the role of investor sentiment. J. Bank. Financ. 2002, 26, 2277–2299. [Google Scholar] [CrossRef]
- Kumari, J.; Mahakud, J. Does investor sentiment predict the asset volatility? Evidence from emerging stock market India. J. Behav. Exp. Financ. 2015, 8, 25–39. [Google Scholar] [CrossRef]
- Rupande, L.; Muguto, H.T.; Muzindutsi, P.F. Investor sentiment and stock return volatility: Evidence from the Johannesburg Stock Exchange. Cogent Econ. Financ. 2019, 2, 1600233. [Google Scholar] [CrossRef]
- Andrei, D.; Hasler, M. Investor attention and stock market volatility. Rev. Financ. Stud. 2015, 2, 33–72. [Google Scholar] [CrossRef]
- Joseph, K.; Wintoki, M.B.; Zhang, Z. Forecasting abnormal stock returns and trading volume using investor sentiment: Evidence from online search. Int. J. Forecast. 2011, 2, 1116–1127. [Google Scholar] [CrossRef]
- Huang, T.L.; Chen, M.L.; Kuo, H.J.; Lai, K.L. How do web search activity and financial media coverage affect asset pricing? J. Financ. Stud. 2016, 2, 25–53. [Google Scholar]
- Chen, H.Y.; Lo, T.C. Online search activities and investor attention on financial markets. Asia Pac. Manag. Rev. 2019, 2, 21–26. [Google Scholar] [CrossRef]
- Audrino, F.; Sigrist, F.; Ballinari, D. The impact of sentiment and attention measures on stock market volatility. Int. J. Forecast. 2020, 2, 334–357. [Google Scholar] [CrossRef]
- Pham, L.; Huynh, T.L.D. How does investor attention influence the green bond market? Financ. Res. Lett. 2020, 35, 101533. [Google Scholar] [CrossRef]
- Wu, Y.; Han, L.; Yin, L. Our currency, your attention: Contagion spillovers of investor attention on currency returns. Econ. Model. 2019, 80, 49–61. [Google Scholar] [CrossRef]
- Ibikunle, G.; McGroarty, F.; Rzayev, K. More heat than light: Investor attention and bitcoin price discovery. Int. Rev. Financ. Anal. 2020, 69, 101459. [Google Scholar] [CrossRef]
- Al Guindy, M. Cryptocurrency price volatility and investor attention. Int. Rev. Econ. Financ. 2021, 76, 556–570. [Google Scholar] [CrossRef]
- Smales, L.A. Investor attention in cryptocurrency markets. Int. Rev. Financ. Anal. 2022, 79, 101972. [Google Scholar] [CrossRef]
- The Total Assets of Financial Institutions Reached 419.64 Trillion Yuan by the End of 2022. Available online: http://www.pbc.gov.cn/goutongjiaoliu/113456/113469/4820197/index.html (accessed on 15 March 2023).
- Abakah, E.J.A.; Gil-Alana, L.A.; Arthur, E.K.; Tiwari, A.K. Measuring volatility persistence in leveraged loan markets in the presence of structural breaks. Int. Rev. Econ. Financ. 2022, 78, 141–152. [Google Scholar] [CrossRef]
- Yarovaya, L.; Elsayed, A.H.; Hammoudeh, S. Determinants of Spillovers between Islamic and Conventional Financial Markets: Exploring the Safe Haven Assets during the COVID-19 Pandemic. Financ. Res. Lett. 2021, 43, 101979. [Google Scholar] [CrossRef]
- Hajilee, M.; Al Nasser, O.M. Exchange rate volatility and stock market development in emerging economies. J. Post Keynes. Econ. 2014, 37, 163–180. [Google Scholar] [CrossRef]
- Zhao, H. Dynamic relationship between exchange rate and stock price: Evidence from China. Res. Int. Bus. Financ. 2010, 24, 103–112. [Google Scholar] [CrossRef]
- Demirer, R.; Gabauer, D.; Gupta, R.; Ji, Q. Monetary policy and speculative spillovers in financial markets. Res. Int. Bus. Financ. 2021, 56, 101373. [Google Scholar] [CrossRef]
- Nazlioglu, S.; Erdem, C.; Soytas, U. Volatility spillover between oil and agricultural commodity markets. Energy Econ. 2013, 36, 658–665. [Google Scholar] [CrossRef]
- Jiang, S.; Li, Y.; Lu, Q.; Wang, S.; Wei, Y. Volatility communicator or receiver? Investigating volatility spillover mechanisms among Bitcoin and other financial markets. Res. Int. Bus. Financ. 2022, 59, 101543. [Google Scholar] [CrossRef]
- Da, Z.; Engelberg, J.; Gao, P. In search of attention. J. Financ. 2011, 66, 1461–1499. [Google Scholar] [CrossRef]
- Wang, G.J.; Chen, Y.Y.; Si, H.B.; Xie, C.; Chevallier, J. Multilayer information spillover networks analysis of China’s financial institutions based on variance decompositions. Int. Rev. Econ. Financ. 2021, 73, 325–347. [Google Scholar] [CrossRef]
- Yao, S.; He, H.; Chen, S.; Ou, J. Financial liberalization and cross-border market integration: Evidence from China’s stock market. Int. Rev. Econ. Financ. 2018, 58, 220–245. [Google Scholar] [CrossRef]
- Corbet, S.; Hou, Y.G.; Hu, Y.; Oxley, L.; Xu, D. Pandemic-related financial market volatility spillovers: Evidence from the Chinese COVID-19 epicentre. Int. Rev. Econ. Financ. 2021, 71, 55–81. [Google Scholar] [CrossRef]
- Alvarez, F.; Argente, D.; Lippi, F. A simple planning problem for COVID-19 lock-down, testing, and tracing. Am. Econ. Rev. Insights 2021, 3, 367–382. [Google Scholar] [CrossRef]
- Chen, R.; Chen, H.; Jin, C.; Wei, B.; Yu, L. Linkages and spillovers between internet finance and traditional finance: Evidence from China. Emerg. Mark. Financ. Trade 2020, 2, 1196–1210. [Google Scholar] [CrossRef]
- Sahay, M.R.; von Allmen, M.U.E.; Lahreche, M.A.; Khera, P.; Ogawa, M.S.; Bazarbash, M.; Beaton, M.K. The Promise of Fintech: Financial Inclusion in the Post COVID-19 Era; International Monetary Fund: Washington, DC, USA, 2020. [Google Scholar]
- Dew-Becker, I.; Giglio, S. Asset pricing in the frequency domain: Theory and empirics. Rev. Financ. Stud. 2016, 29, 2029–2068. [Google Scholar] [CrossRef]
- Liu, B.; Xia, X.; Xiao, W. Public information content and market information efficiency: A comparison between China and the US. China Econ. Rev. 2020, 60, 101405. [Google Scholar] [CrossRef]
- Karali, B.; Ramirez, O.A. Macro determinants of volatility and volatility spillover in energy markets. Energy Econ. 2014, 46, 413–421. [Google Scholar] [CrossRef]
- Wang, X. Frequency dynamics of volatility spillovers among crude oil and international stock markets: The role of the interest rate. Energy Econ. 2020, 91, 104900. [Google Scholar] [CrossRef]
- Apostolou, A.; Beirne, J. Volatility spillovers of unconventional monetary policy to emerging market economies. Econ. Model. 2019, 79, 118–129. [Google Scholar] [CrossRef]

| FinTech | Banking | Security | Diversified | Insurance | |
|---|---|---|---|---|---|
| Max | 94.3836 | 91.3839 | 116.9834 | 110.3308 | 91.3600 |
| Min | 6.5145 | 9.5641 | 3.0048 | 5.8045 | 9.4590 |
| Mean | 26.0872 | 23.5595 | 34.5324 | 37.3558 | 28.6733 |
| Std. Dev. | 13.3090 | 9.9436 | 17.1615 | 14.3152 | 12.6611 |
| Skewness | 1.3120 | 1.7228 | 1.6059 | 1.6865 | 1.3545 |
| Kurtosis | 1.8502 | 5.0740 | 2.8702 | 3.5768 | 2.5440 |
| ADF test | −6.9330 (0.0000) | −8.4282 (0.0000) | −6.5552 (0.0000) | −6.3036 (0.0000) | −8.7850 (0.0000) |
| TSI | ER | CFCI | ME | WAV | DSV | |
|---|---|---|---|---|---|---|
| ER | 0.683 *** | 1 | ||||
| CFCI | −0.490 *** | −0.140 *** | 1 | |||
| ME | 0.341 *** | 0.358 *** | −0.208 *** | 1 | ||
| WAV | 0.071 ** | −0.058 * | −0.075 ** | −0.021 | 1 | |
| DSV | −0.078 ** | −0.132 *** | 0.319 *** | −0.266 *** | 0.273 *** | 1 |
| Dependent Variable | Model 1 | Model 2 | Model 3 |
|---|---|---|---|
| TSI | TSI | TSI | |
| ER | 12.454 *** | 12.557 *** | 12.565 *** |
| (28.56) | (28.99) | (30.51) | |
| CFCI | −2.390 *** | −2.349 *** | −2.624 *** |
| (−21.37) | (−20.94) | (−23.27) | |
| ME | 0.614 * | 0.634 * | 1.104 *** |
| (1.90) | (1.90) | (2.94) | |
| WAV | 0.029 *** | 0.013 | |
| (3.79) | (1.62) | ||
| DSV | 0.001 *** | ||
| (7.30) | |||
| Constant | −27.987 *** | −29.619 *** | −34.828 *** |
| (−9.53) | (−10.12) | (−11.84) | |
| Adj.R2 | 0.625 | 0.630 | 0.648 |
| Dependent Variable | Model 4 | Model 5 | Model 6 | Model 7 | Model 8 |
|---|---|---|---|---|---|
| NSI | NSI | NSIS | NSIM | NSIL | |
| ER | 4.109 *** | 3.635 *** | 0.856 *** | 0.399 *** | 2.380 *** |
| (8.37) | (7.41) | (7.85) | (2.65) | (6.60) | |
| CFCI | −0.783 *** | −1.136 *** | −0.711 *** | −0.227 *** | −0.198 ** |
| (−7.45) | (−8.28) | (−15.51) | (−6.16) | (−2.29) | |
| ME | 0.237 | 0.032 | 0.278 *** | 0.569 *** | −0.815 *** |
| (0.56) | (0.07) | (3.21) | (4.48) | (−2.76) | |
| WAV | −0.051 *** | −0.056 *** | −0.011 *** | −0.015 *** | −0.030 *** |
| (−6.62) | (−6.75) | (−5.26) | (−6.55) | (−4.53) | |
| DSV | −0.000 *** | −0.000 *** | −0.000 | −0.000 *** | −0.000 *** |
| (−4.44) | (−2.90) | (−0.08) | (−3.24) | (−2.80) | |
| DAV | −0.018 * | −0.009 *** | −0.004 | −0.005 | |
| (−1.74) | (−2.92) | (−1.41) | (−0.65) | ||
| DDSV | −0.001 *** | −0.000 *** | −0.000 ** | −0.001 *** | |
| (−4.21) | (−4.08) | (−2.01) | (−3.68) | ||
| Constant | −24.760 *** | −23.375 *** | −6.353 *** | −2.483 *** | −14.538 *** |
| (−7.96) | (−7.68) | (−8.60) | (−2.65) | (−6.48) | |
| Adj.R2 | 0.229 | 0.241 | 0.449 | 0.199 | 0.122 |
| Dependent Variable | 20-Day Forecasting Horizon | 50-Day Forecasting Horizon | ||
|---|---|---|---|---|
| TSI | NSI | TSI | NSI | |
| ER | 12.427 *** | 3.624 *** | 12.563 *** | 3.633 *** |
| (30.51) | (7.56) | (30.51) | (7.41) | |
| CFCI | −2.596 *** | −1.110 *** | −2.623 *** | −1.135 *** |
| (−23.16) | (−8.25) | (−23.27) | (−8.28) | |
| ME | 1.094 *** | 0.200 | 1.101 *** | 0.034 |
| (2.99) | (0.48) | (2.94) | (0.08) | |
| WAV | 0.014 * | −0.055 *** | 0.013 | −0.056 *** |
| (1.76) | (−6.84) | (1.63) | (−6.75) | |
| DSV | 0.001 *** | −0.000 *** | 0.001 *** | −0.000 *** |
| (7.55) | (−3.04) | (7.30) | (−2.90) | |
| DAV | −0.018 * | −0.018 * | ||
| (−1.73) | (−1.74) | |||
| DDSV | −0.001 *** | −0.001 *** | ||
| (−4.15) | (−4.21) | |||
| Constant | −34.160 *** | −23.247 *** | −34.816 *** | −23.361 *** |
| (−11.72) | (−7.82) | (−11.84) | (−7.68) | |
| Adj.R2 | 0.646 | 0.251 | 0.648 | 0.241 |
| Dependent Variable | Lag Length = 3 | Lag Length = 4 | CSI 300 as Proxy | |||
|---|---|---|---|---|---|---|
| TSI | NSI | TSI | NSI | TSI | NSI | |
| ER | 13.345 *** | 2.285 *** | 13.589 *** | 1.680 *** | 12.513 *** | 3.931 *** |
| (31.23) | (5.52) | (30.53) | (3.88) | (30.36) | (7.72) | |
| CFCI | −3.044 *** | −0.586 *** | −3.041 *** | −0.952 *** | −2.658 *** | −0.822 *** |
| (−23.60) | (−5.36) | (−24.03) | (−8.26) | (−23.99) | (−6.97) | |
| MV | 0.968 *** | 0.423 | 1.371 *** | 0.756 *** | 1.146 *** | 0.152 |
| (2.59) | (1.51) | (3.51) | (2.68) | (3.06) | (0.35) | |
| WAV | 0.011 | −0.048 *** | 0.008 | −0.045 *** | ||
| (1.28) | (−6.80) | (0.98) | (−6.84) | |||
| DSV | 0.001 *** | −0.000 *** | 0.001 *** | −0.000 ** | 0.001 *** | −0.000 *** |
| (7.38) | (−5.69) | (7.12) | (−2.40) | (7.84) | (−4.64) | |
| DAV | −0.008 | −0.014 | ||||
| (−1.02) | (−1.65) | |||||
| DDSV | −0.000 ** | −0.000 ** | −0.001 *** | |||
| (−2.44) | (−2.49) | (−3.35) | ||||
| VCSI300 | −0.008 | −0.064 *** | ||||
| (−0.71) | (−5.14) | |||||
| Constant | −41.233 *** | −11.946 *** | −42.729 *** | −10.724 *** | −34.466 *** | −24.543 *** |
| (−13.77) | (−4.60) | (−13.65) | (−4.05) | (−11.75) | (−7.73) | |
| Adj.R2 | 0.654 | 0.234 | 0.658 | 0.197 | 0.647 | 0.221 |
Disclaimer/Publisher’s Note: The statements, opinions and data contained in all publications are solely those of the individual author(s) and contributor(s) and not of MDPI and/or the editor(s). MDPI and/or the editor(s) disclaim responsibility for any injury to people or property resulting from any ideas, methods, instructions or products referred to in the content. |
© 2023 by the authors. Licensee MDPI, Basel, Switzerland. This article is an open access article distributed under the terms and conditions of the Creative Commons Attribution (CC BY) license (https://creativecommons.org/licenses/by/4.0/).
Share and Cite
Wang, Z.; Xia, Y.; Fu, Y.; Liu, Y. Volatility Spillover Dynamics and Determinants between FinTech and Traditional Financial Industry: Evidence from China. Mathematics 2023, 11, 4058. https://doi.org/10.3390/math11194058
Wang Z, Xia Y, Fu Y, Liu Y. Volatility Spillover Dynamics and Determinants between FinTech and Traditional Financial Industry: Evidence from China. Mathematics. 2023; 11(19):4058. https://doi.org/10.3390/math11194058
Chicago/Turabian StyleWang, Ziyao, Yufei Xia, Yating Fu, and Ying Liu. 2023. "Volatility Spillover Dynamics and Determinants between FinTech and Traditional Financial Industry: Evidence from China" Mathematics 11, no. 19: 4058. https://doi.org/10.3390/math11194058
APA StyleWang, Z., Xia, Y., Fu, Y., & Liu, Y. (2023). Volatility Spillover Dynamics and Determinants between FinTech and Traditional Financial Industry: Evidence from China. Mathematics, 11(19), 4058. https://doi.org/10.3390/math11194058