Article

Change-Point Detection in the Volatility of Conditional Heteroscedastic Autoregressive Nonlinear Models

by
Mohamed Salah Eddine Arrouch
1,
Echarif Elharfaoui
1 and
Joseph Ngatchou-Wandji
2,3,*
1
Department of Mathematics, Faculty of Sciences, Chouaïb Doukkali University, El Jadida 24000, Morocco
2
EHESP French School of Public Health, Université de Rennes, 35043 Rennes, France
3
Institut Élie Cartan de Lorraine, Université de Lorraine, 54052 Vandoeuvre-Lès-Nancy, France
*
Author to whom correspondence should be addressed.
Mathematics 2023, 11(18), 4018; https://doi.org/10.3390/math11184018
Submission received: 19 August 2023 / Revised: 17 September 2023 / Accepted: 18 September 2023 / Published: 21 September 2023
(This article belongs to the Special Issue Parametric and Nonparametric Statistics: From Theory to Applications)

Abstract

:
This paper studies single change-point detection in the volatility of a class of parametric conditional heteroscedastic autoregressive nonlinear (CHARN) models. The conditional least-squares (CLS) estimators of the parameters are defined and are proved to be consistent. A Kolmogorov–Smirnov type-test for change-point detection is constructed and its null distribution is provided. An estimator of the change-point location is defined. Its consistency and its limiting distribution are studied in detail. A simulation experiment is carried out to assess the performance of the results, which are compared to recent results and applied to two sets of real data.
MSC:
62F10; 62G10; 62M10; 62M15; 62M20

1. Introduction

Detecting jumps in a series of real numbers and determining their number and locations is known in statistics as a change-point problem. This is usually solved by testing for the stationarity of the series and estimating the change locations when the null hypothesis of stationarity is rejected.
Change-point problems can be encountered in a wide range of disciplines, such as quality control, genetic data analysis and bioinformatics (see, e.g., [1,2]) and financial analysis (see, e.g., [3,4,5]). The study of conditional variations in financial and economic data receives particular attention as a result of its interest in hedging strategies and risk management.
The literature on change-points is vast. Parametric or non-parametric approaches are used for independent and identically distributed (iid) data as well as for dependent data. The pioneering works of [6,7] proposed tests for identifying a deviation in the mean of iid Gaussian variables from industrial quality control. Ref. [8] proposed a test for detecting changes in the mean. This criterion was later generalized by [9], which envisioned a much more general model allowing incremental changes. Refs. [10,11,12] presented a documentary analysis of several non-parametric procedures.
A popular alternative to using the likelihood ratio test was employed in [13,14]. Ref. [15] reviewed the asymptotic behavior of likelihood ratio statistics for testing a change in the mean in a series of iid Gaussian random variables. Ref. [16] came up with statistics based on linear rank statistical processes with quantum scores. Ref. [17] looked at detection tests and change-point estimation methods for models based on the normal distribution. The contribution of [18] is related to the change in mean and variance. Ref. [19] proposed permutation tests for the location and scale parameters of a law. Ref. [20] developed a change-point test using the empirical characteristic functions. Ref. [21] proposed several CUSUM approaches. Ref. [22] proposed tests for change detection in the mean, variance, and autoregressive parameters of a p-order autoregressive model. Ref. [23] used a weighted CUSUM procedure to identify a potential change in the mean and covariance structure of linear processes.
There are several types of changes depending on the temporal behavior of the series studied. The usual ones are abrupt change, gradual change, and intermittent change. These are studied in the frameworks of on-line or off-line data. Some papers dealing with this problem are [24,25]. In this paper, we focus on abrupt change in the conditional variance of off-line data issue from a class of CHARN models (see [26,27]). These models are of the most famous and significant ones in finance, which include many financial time series models. We suggest a hybrid estimation procedure, which combines CLS and non-parametric methods to estimate the change location. Indeed, conditional least-squares estimators own a computational advantage and require no knowledge of the innovation process.
The rest of the paper is organized as follows. Section 2 presents the class of models studied, the notation, the main assumptions and the main result on the CLS estimators of the parameters. Section 3 presents the change-point test and the change location LS estimation. The asymptotic distribution of the test statistic under the null hypothesis is investigated. The consistency rates are obtained for the change location estimator and its limit distribution is derived. Section 4 presents the simulation results from a few simple time series models. Here, our results are compared to some recent methods. They are also applied to two real data sets. Our work ends with a conclusion in Section 5. The proofs and auxiliary results are given in Appendix A.

2. Model and Assumptions

2.1. Notation and Assumptions

Let l and r be positive integers. For given real functions A ( α ; z ) defined on a non-empty subset of R × R p , = l , r and K ( ψ ; z ) defined on a non-empty subset of R r × R l × R p , α = α 1 , , α , ψ = ρ , θ , ρ = ρ 1 , , ρ r , θ = θ 1 , , θ l . We denote:
α A ( α ; z ) = A α 1 ( α ; z ) , , A α ( α ; z )
α 2 2 A ( α ; z ) = 2 A α i α j ( α ; z ) ; 1 i , j
ρ K ( ψ ; z ) = K ρ 1 ( ψ ; z ) , , K ρ r ( ψ ; z )
θ K ( ψ ; z ) = K θ 1 ( ψ ; z ) , , K θ l ( ψ ; z )
ρ θ 2 K ( ψ ; z ) = 2 K ρ i θ j ( ψ ; z ) ; 1 i r , 1 j l
θ ρ 2 K ( ψ ; z ) = 2 K θ i ρ j ( ψ ; z ) ; 1 i l , 1 j r
ρ 2 2 K ( ψ ; z ) = 2 K ρ i ρ j ( ψ ; z ) ; 1 i , j r
θ 2 2 K ( ψ ; z ) = 2 K θ i θ j ( ψ ; z ) ; 1 i , j l .
For a vector or matrix function ζ ( x ) , we denote by ζ ( x ) , the transpose of ζ ( x ) . We define:
K ( ψ ; z ) = ρ K ( ψ ; z ) θ K ( ψ ; z ) and 2 K ( ψ ; z ) = ρ 2 2 K ( ψ ; z ) ρ θ 2 K ( ψ ; z ) θ ρ 2 K ( ψ ; z ) θ 2 2 K ( ψ ; z ) .
All along the text, the notations d and D denote, respectively, the weak convergence in functional spaces and the convergence in distribution.
We place ourselves in the framework where the observations at hand are assumed to be issued from the following CHARN ( p , p ) model:
X t = m ρ ; Z t 1 + σ θ ; Z t 1 ε t , t Z ,
where p N ; m ( · ) and σ ( · ) are two real-valued functions of known forms depending on unknown parameters ρ and θ , respectively; for all t Z , Z t 1 = X t 1 , X t 2 , , X t p ; ε t t Z is a sequence of stationary random variables with E ε t Z t 1 = 0 and V ar ε t Z t 1 = 1 such that ε t is independent of the σ algebra F t 1 = σ Z k , k < t . The case p = is treated in [28,29,30] where the stationarity and the ergodicity of the process X t t Z is studied. Although we restrict to p < , all the results stated here also hold for  p = .
Let ψ = ρ , θ Ψ = int ( Θ ) × int ( Θ ~ ) R r × R l , the vector of the parameters of the model (1) and ψ 0 = ρ 0 , θ 0 the true parameter vector. Denote by M an appropriate norm of a vector or a matrix M. We assume that all the random variables in the whole text are defined on the same probability space Ω , F , P . We make the following assumptions:
(A1)
The common fourth order moment of the ε t is finite.
(A2)
  • The function m ( · ) is twice continuously differentiable, a.e., with respect to ρ in some neighborhood B 1 of ρ 0 .
  • The function σ ( . ) is twice continuously differentiable, a.e., with respect to θ in some neighborhood B 2 of θ 0 .
  • There exists a positive function ω such that E ω 4 Z 0 < , and
    max { sup ρ int ( Θ ) m ( ρ ; z ) , sup ρ int ( Θ ) ρ m ( ρ ; z ) , sup ρ int ( Θ ) ρ 2 2 m ( ρ ; z ) } ω ( z )
    max sup θ int ( Θ ~ ) σ ( θ ; z ) , sup θ int ( Θ ~ ) θ σ ( θ ; z ) , sup θ int ( Θ ~ ) θ 2 2 σ ( θ ; z ) ω ( z ) .
(A3)
There exists a positive function β such that E β 4 Z 0 < , and for all ρ 1 , ρ 2 int ( Θ ) , and θ 1 , θ 2 int ( Θ ~ ) ,
max { m ρ 1 ; z m ρ 2 ; z , ρ m ρ 1 ; z ρ m ρ 2 ; z , ρ 2 2 m ρ 1 ; z ρ 2 2 m ρ 2 ; z , σ θ 1 ; z σ θ 2 ; z , θ σ θ 1 ; z θ σ θ 2 ; z , θ 2 2 σ θ 1 ; z θ 2 2 σ θ 2 ; z } β ( z ) min ρ 1 ρ 2 2 , θ 1 θ 2 2 .
(A4)
The sequence ε t t Z is stationary and satisfies either of the following two conditions:
  • α -mixing with mixing coefficient satisfying n 1 α ( n ) δ / ( 2 + δ ) < and E | ε 0 | 2 + δ < for some δ > 0 ;
  • ϕ -mixing with mixing coefficient satisfying n 1 ϕ ( n ) 1 / 2 < and E ε 0 4 + δ < for some δ > 0 .

2.2. Parameter Estimation

2.2.1. Conditional Least-Squares Estimation

The conditional mean and the conditional variance of X t are given, respectively, by E X t F t 1 = m ρ ; Z t 1 and V ar X t F t 1 = σ 2 θ ; Z t 1 . From these, one has that for all z R p ,
E X 1 Z 0 = z = m ρ ; z and E X 1 m ρ ; Z 0 2 Z 0 = z = σ 2 θ ; z .
Therefore, for any bounded measurable functions g ( · ) and k ( · ) , we have
E X 1 m ρ ; Z 0 g ( Z 0 ) = 0 and E X 1 m ρ ; Z 0 2 σ 2 θ ; Z 0 k ( Z 0 ) = 0 .
Without a loss of generality, in the following we take, for all z R p , g ( z ) = k ( z ) = 1 . Now, given X p + 1 ,   ,   X 1 ,   X 0 ,   X 1 ,   ,   X n with n p , we let X n = ( X p + 1 ,   ,   X 1 ,   X 0 ,   X 1 ,   ,   X n ) and consider the sequences of random functions
Q n ( ρ ) = Q n ( ρ ; X n ) = t = 1 n X t E X t F t 1 2 = t = 1 n X t m ρ ; Z t 1 2 S n ( ρ , θ ) = S n ( ρ , θ ; X n ) = t = 1 n X t m ρ ; Z t 1 2 σ 2 θ ; Z t 1 2 .
We have the following theorem:
Theorem 1.
Under assumptions ( A 1 ) ( A 3 ) , there exists a sequence of estimators ψ ^ n = ρ ^ n , θ ^ n such that ψ ^ n ψ 0 almost surely, and for any ϵ > 0 , there exists an event E with P E > 1 ϵ , and a non-negative integer n 0 such that on E, for n > n 0 ,
  • Q n ρ ρ ^ n ; X n = 0 and Q n ( ρ ; X n ) attains a relative minimum at ρ = ρ ^ n ;
  • assuming ρ ^ n fixed, S n θ ψ ^ n ; X n = 0 and S n ρ ^ n , θ ; X n attains a relative minimum at  θ = θ ^ n .
Proof. 
This result is an extension of [31] to the case ( ε t ) t Z is a mixing martingale difference. The proof can be handled in the same lines and is left to the reader.    □

3. Change-Point Study

3.1. Change-Point Test and Change Location Estimation

We essentially use the techniques of [32], who studied the estimation of the shift in the mean of a linear process by a LS method. We first consider the model (1) for known ρ , and σ θ ; Z t 1 = θ ̲ δ 0 Z t 1 , for some known positive real-valued function δ 0 ( · ) defined on R p and for an unknown positive real number θ ̲ . We wish to test
H 0 : θ ̲ = ϑ 1 = ϑ 2 over t n
against
H 1 : θ ̲ = ϑ 1 , t = 1 , , t ϑ 2 , t = t + 1 , , n . ϑ 1 ϑ 2
where ϑ 1 , ϑ 2 and t are unknown parameters.
We are also interested in estimating ϑ 1 , ϑ 2 and the change location t , when H 0 is rejected. It is assumed that t = [ n τ ] for some τ 0 , 1 , with [ x ] standing for the integer part of any real number x. From (1), one can easily check that
X t m ρ ; Z t 1 2 = δ 2 Z t 1 + δ 2 Z t 1 ε t 2 1 , t Z
from which we define the LS estimator t ^ of t as follows:
t ^ : = arg min 1 k < n min ϑ 1 , ϑ 2 t = 1 k W t 2 ϑ 1 2 2 + t = k + 1 n W t 2 ϑ 2 2 2 ,
where W t = X t m ( ρ ; Z t 1 ) / δ 0 Z t 1 . Thus, the change location is estimated by minimizing the sum of squares of residuals among all possible sample slits.
Letting
W ¯ k = 1 k t = 1 k W t 2 , W ¯ n k = 1 n k t = k + 1 n W t 2 and W ¯ = 1 n t = 1 n W t 2 ,
it is easily seen that for some k, the LS estimator of ϑ 1 2 t k and ϑ 2 2 t > k are W ¯ k and W ¯ n k , respectively, and that (3) can be written as
t ^ = arg min 1 k < n t = 1 k W t 2 W ¯ k 2 + t = k + 1 n W t 2 W ¯ n k 2 = arg min 1 k < n S k 2 .
Let S 2 = t = 1 n W t 2 W ¯ 2 . A simple algebra gives
S 2 = S k 2 + U k ,
where
U k = k W ¯ k W ¯ 2 + n k W ¯ n k W ¯ 2 .
From (4) and (5), we have
t ^ = arg min 1 k < n S 2 U k = arg max 1 k < n U k .
From (6), a simple algebraic computation gives the following alternative expression for U k :
U k = n k ( n k ) t = 1 k W t 2 W ¯ 2 = n k ( n k ) t = 1 k W t 2 W ¯ 2 = T k 2 .
It results from (7) and (8) that
t ^ = arg max 1 k < n T k 2 = arg max 1 k < n | T k | .
Writing T k 2 = n Δ k 2 , it is immediate that
Δ k 2 = 1 k ( n k ) t = 1 k W t 2 W ¯ 2 = k ( n k ) W ¯ k W ¯ 2 .
Simple computations give
Δ k 2 = k ( n k ) n 2 W ¯ n k W ¯ k 2 ,
from which we have
t ^ = arg max 1 k < n Δ k 2 = arg max 1 k < n Δ k .
The test statistic we use for testing H 0 against H 1 is a scale version of max 1 k n 1 | T k | .
One can observe that under some conditions (e.g., ε t i.i.d. with ε t N ( 0 , 1 ) ), this statistic is the equivalent likelihood based test statistic for testing H 0 against H 1 (see, e.g., [33]).
Let
C k = t = 1 k W t 2 , C n k = t = k + 1 n W t 2 and C n = t = 1 n W t 2 .
By simple calculations, we obtain
T k = n k ( n k ) t = 1 k W t 2 W ¯ = q k n 1 1 n C k k n C n ,
where q ( · ) is a positive weight function defined for any x 0 , 1 by q x = x 1 x .

3.2. Asymptotics

3.2.1. Asymptotic Distribution of the Test Statistic

The study of the asymptotic distribution of the test statistic under H 0 , is based on that of the the process ξ n ( · ) defined for any s [ 0 , 1 ] by
ξ n ( s ) = C n ( s ) s C n ( 1 ) ,
where
C n ( s ) = 0 if 0 s < 1 n and 1 1 n < s < 1 t = 1 [ n s ] W t 2 if 1 n s 1 1 n t = 1 n W t 2 if s = 1 ,
where we recall that [ n s ] is the integer part of n s . For some δ ( 1 / n , 1 / 2 ) and for any s in δ , 1 δ , we define
T n ( s ) = ξ n ( s ) n q ( s ) and Λ n = max δ s 1 δ | T n ( s ) | σ ^ w ,
where q ( s ) = s ( 1 s ) and σ ^ w is any consistent estimator of
σ w 2 = E W 1 2 E W 1 2 2 + 2 t 2 E W 1 2 E W 1 2 W t 2 E W t 2 .
For δ ( 0 , 1 / 2 ) , we denote by D δ D δ , 1 δ the space of all right continuous functions with left limits on δ , 1 δ endowed with the Skorohod metric. It is clear that C n ( · ) , ξ n ( · ) D 0 and T n ( · ) D δ .
Theorem 2.
Assume that the assumptions ( A 1 ) ( A 4 ) hold. Then, under H 0 , we have
1. 
ξ n ( s ) σ w n d B ~ ( s ) in D 0 as n ;
2. 
Λ n D sup δ s 1 δ | B ~ ( s ) | q ( s ) as n ,
where B ~ ( s ) , 0 s 1 is a Brownian Bridge on [ 0 , 1 ] .
Proof. 
See Appendix A.    □
It is worth noting that if the change occurs at the very beginning or at the very end of the data, we may not have sufficient observations to obtain consistent LSE estimators of the parameters or these may not be unique. This is why we stress on the truncated version of the test statistic given in [21] that we recall:
Λ n = max ν n s 1 ν n | T n ( s ) | σ ^ w , for any 1 ν < n 2 .
By Theorem 2, it is easy to see that for any 1 ν < n / 2 ,
sup ν n s 1 ν n | T n ( s ) | σ ^ w sup ν n s 1 ν n | B ~ ( s ) | q ( s ) D 0 as n ,
which yields the asymptotic null distribution of the test statistic. With this, at level of significance α ( 0 , 1 ) , H 0 is rejected if Λ n > C α , n , where C α , n is the ( 1 α ) -quantile of the distribution of the above limit. This quantile can be computed by observing that under H 0 , for larger values of n, one has
α = P sup ν n s 1 ν n | T n ( s ) | σ ^ w > C α , n P sup h ν ( n ) s 1 h ν ( n ) | B ~ ( s ) | q ( s ) > C α , n , where h ν ( n ) = ν n .
From the following relation (1.3.26) of [34], for each h ν ( n ) > 0 , and for larger real number x, we have
P sup h ν ( n ) s 1 h ν ( n ) | B ~ ( s ) | q ( s ) x = 1 2 π x exp x 2 2 [ ln 1 h ν ( n ) 2 h ν 2 ( n ) 1 x 2 ln 1 h ν ( n ) 2 h ν 2 ( n ) + 4 x 2 + O 1 x 4 ] ,
which gives an approximation of the tail distribution of sup h ν ( n ) s 1 h ν ( n ) | B ~ ( s ) | / q ( s ) . Thus, using σ ^ w , an estimation of C α , n can be obtained from this approximation. Monte Carlo simulations are often carried out to obtain accurate approximations of C α , n . In this purpose, it is necessary to make a good choice of ν . We selected ν = 0.9 × n 4 / 5 as our option, which we found to be a suitable choice for all the cases we examined. But, to avoid the difficulties associated with the computation of C α , n , a decision can also be taken by using the p-value method as in [35]. That is using the approximation (16), reject H 0 if
P | B ~ ( s ) | q ( s ) > Λ n α .
This idea is used in the simulation section.

3.2.2. Rate of Convergence of the Change Location Estimator

For the study of the estimator t ^ , we let κ = κ n = ϑ 2 2 ϑ 1 2 and assume without loss of generality that κ n > 0 ϑ 2 > ϑ 1 , κ n 0 as n (see, e.g., [36]) and that the unknown change point t depends on the sample size n. We have the following result:
Theorem 3.
Assume that A 4 is satisfied, t / n a , 1 a for some 0 < a < 1 / 2 , t = n τ for some τ 0 , 1 and as n , κ n 0 and κ n n ln n . Then, we have
t ^ t = O P 1 κ n 2 ,
where O P denotes a “big-O” of Landau in probability.
Proof. 
See Appendix A.    □

3.2.3. Limit Distribution of the Location Estimator

In this section, we study the asymptotic behavior of the location estimator. We make the additional assumptions that κ n > > n 1 2 and that as n ,
κ n n ln n and n 1 2 ζ κ n for some ζ 0 , 1 2 .
By (10), we have
t ^ = arg max 1 k < n n Δ k 2 Δ t 2 .
To derive the limiting distribution of t ^ , we study the behavior of n Δ k 2 Δ t 2 for those ks in the neighborhood of t such that k = t + r κ n 2 , where r varies in an arbitrary bounded interval N , N . For this purpose, we define
P n r : = n Δ n 2 t + r κ n 2 Δ n 2 t ,
where Δ n r = Δ r . In addition, we define the two-sided standard Wiener process B ( r ) , r R as follows:
B r : = B 1 r if r < 0 B 2 r if r 0 ,
where B i ( r ) , i = 1 , 2 are two independent standard Wiener processes defined on 0 , with B i 0 = 0 , i = 1 , 2 .
First, we identify the limit of the process P n r on r N for every given N > 0 . We denote by C N , N the space of all continuous functions on N , N endowed with the uniform metric.
Proposition 1.
Assume that A 4 holds, that t = n τ for some τ 0 , 1 and that as n , κ n 0 and κ n n ln n . Then, for every 0 < N < , the process P n r converges weakly in C N , N to the process P ( r ) = 2 σ w B ( r ) 1 2 r , where B ( · ) is the two-sided standard Wiener process defined above.
Proof. 
See Appendix A.    □
The above results make it possible to achieve a weak convergence result for n Δ k 2 Δ t 2 and then apply the Argmax-Continuous Mapping Theorem (Argmax-CMT). We have:
Theorem 4.
Assume that A 4 is satisfied, that t = n τ for some τ 0 , 1 and as n , κ n 0 and κ n n ln n . Then we have
κ n 2 t ^ t σ w 2 D S ,
where S : = arg max B ( u ) 1 2 u , u R .
Proof. 
See Appendix A.    □
This result yields the asymptotic distribution of the change location estimator. Refs. [37,38,39] investigated the density function of the random variable S (see Lemma 1.6.3 of [34] for more details). They also showed that S has a symmetric (with respect to 0) probability density function γ ( · ) defined for any x R by
γ ( x ) = 3 2 exp ( | x | ) Φ 3 2 | x | 1 2 Φ 1 2 | x | ,
where Φ ( · ) is the cumulative distribution function of the standard normal variable. From this result, a confidence interval for the change-point location can be obtained, if one has consistent estimates of κ n 2 and σ w 2 . With t ^ , consistent estimates of ϑ 1 2 and ϑ 2 2 are given, respectively, by
ϑ ^ 1 2 = W ¯ t ^ = 1 t ^ t = 1 t ^ W t 2 , and ϑ ^ 2 2 = W ¯ n t ^ = 1 n t ^ t = t ^ + 1 n W t 2 .
Thus, a consistent estimate of κ n 2 is given by
κ ^ n 2 = 1 n t ^ t = t ^ + 1 n W t 2 1 t ^ t = 1 t ^ W t 2 .
A consistent estimator of σ w 2 that we denote by σ ^ w 2 can be easily obtained by taking its empirical counterpart. So, at risk α ( 0 , 1 ) , letting q 1 α 2 be the quantile of order 1 α 2 of the distribution of the random variable S , an asymptotic confidence interval for t is given by
CI = t ^ ± q 1 α 2 σ ^ w 2 κ ^ n 2 + 1 .
Remark 1.
In the case that the parameter ρ is unknown, it can be estimated by the CLS method (see Section 2.2.1), and be substituted for its estimator in W t . Indeed, one can easily show that
1 k t = 1 k W t 2 = 1 k t = 1 k W ^ t 2 + o P ( 1 ) and 1 n k t = k + 1 n W t 2 = 1 n k t = k + 1 n W ^ t 2 + o P ( 1 ) ,
where for any t = 1 , , n , W ^ t = X t m ρ ^ n ; Z t 1 / δ 0 Z t 1 and ρ ^ n is the conditional least squares estimators of ρ obtained from Theorem 1. Hence, the same techniques as in the case where ρ is known can be used.

4. Practical Consideration

In this section we perform numerical simulations to evaluate the performances of our methods and these are applied to two sets of real data. We start with the presentation of the results of numerical simulations found with the software R 4.1.1. The trials are based on 1000 replications of observations of lengths n = 500 , 1000, 5000 and 10,000 generated from the model (1) for ρ = ρ 0 , ρ 1 , ρ 2 ;   θ = θ 0 , θ 1 , θ 2 ;   m ρ ; x  =  ρ 0 + ρ 1 exp ρ 2 x 2 x ;   σ θ ; x = θ ̲ δ 0 ( x ) with δ 0 ( x )  =  θ 0 2 + θ 1 2 x 2 exp θ 2 x 2 ;   ρ 2 > 0 , ρ 0 ρ 1 0 , θ 2 0 and 0 < θ ̲ 2 θ 1 2 < 1 ε t t Z is a white noise with density function f. We also assume the sufficient condition ρ 0 + ρ 1 + θ ̲ θ 1 + 2 ρ 0 ρ 1 < 1 , to ensure the strict stationarity and ergodicity of the process X t t Z (see, e.g., Theorem 3.2.11 of [40], p. 86 and [41], p. 5). The noise densities f that we employed were Gaussian.
Note that in the application to real data, only the points 2–7 of the above Algorithm 1 are considered, so that the change location estimation is given by point 7.
The change-point location is estimated using the following algorithm:
Algorithm 1 Change-point location estimation
1:
for  i = 1 , , 1000  do
2:
      for  t = 1 , , n  do  W t = X t m ( ρ ; X t 1 ) / δ 0 X t 1
3:
      end for
4:
       W ¯ = 1 n t = 1 n W t 2
5:
      for  k = 1 , , n 1  do  T k = n k ( n k ) t = 1 k W t 2 W ¯
6:
      end for
7:
      Compute t ^ i = arg max 1 k < n | T k | (that is the value of k for which | T k | is the largest)
8:
end for
9:
Compute L = t ^ 1 + t ^ 2 + + t ^ 1000 / 1000
10:
Change-point location estimation is given by t ^ = L , the integer part of L

4.1. Example 1

We consider the model (1) for ρ 0 = ρ 1 = 0 , θ 2 = 0 , δ 0 X t 1 = 0.04 + 0.36 X t 1 2 , ϑ 1 = 1 , ϑ 2 = 1 + ϕ and ε t N ( 0 , 1 ) . The resulting model is an ARCH(1). The change location estimators are calculated for ϕ = 0.3 , 0.8 and 1.5 at the locations t = τ × n for τ = 0.25 , 0.5 and 0.75 . In each case, we compute the bias and the standard error SE (SE = SD/ n , where SD denotes the standard deviation) of the change location estimator. Table 1 shows that the bias declines rapidly as ϕ increases. Also, as the sample size n increases, the bias and the SE decrease. This tends to show the consistency of t ^ , as expected from the asymptotic results.
We also consider the case ε t = β ε t 1 + γ t , where | β | < 1 and γ t N ( 0 , 1 β 2 ) . It is easy to check that with this ε t t Z is stationary and strongly mixing, and that E ε t = 0 and V ar ε t = 1 . In this case, we only study the SE for n = 5000 , 10,000 and the results are compared to those obtained for ε t N ( 0 , 1 ) , for the same values of ϕ as above but for τ = 0.25 and 0.75 . These results listed in Table 2 show that for ε t N ( 0 , 1 ) , the location estimator is more accurate and the SE decreases slightly compared to the case ε t AR ( 1 ) . It seems from these results that the nature of the white noise ε t does not much affect the location estimator for larger values of n and ϕ .
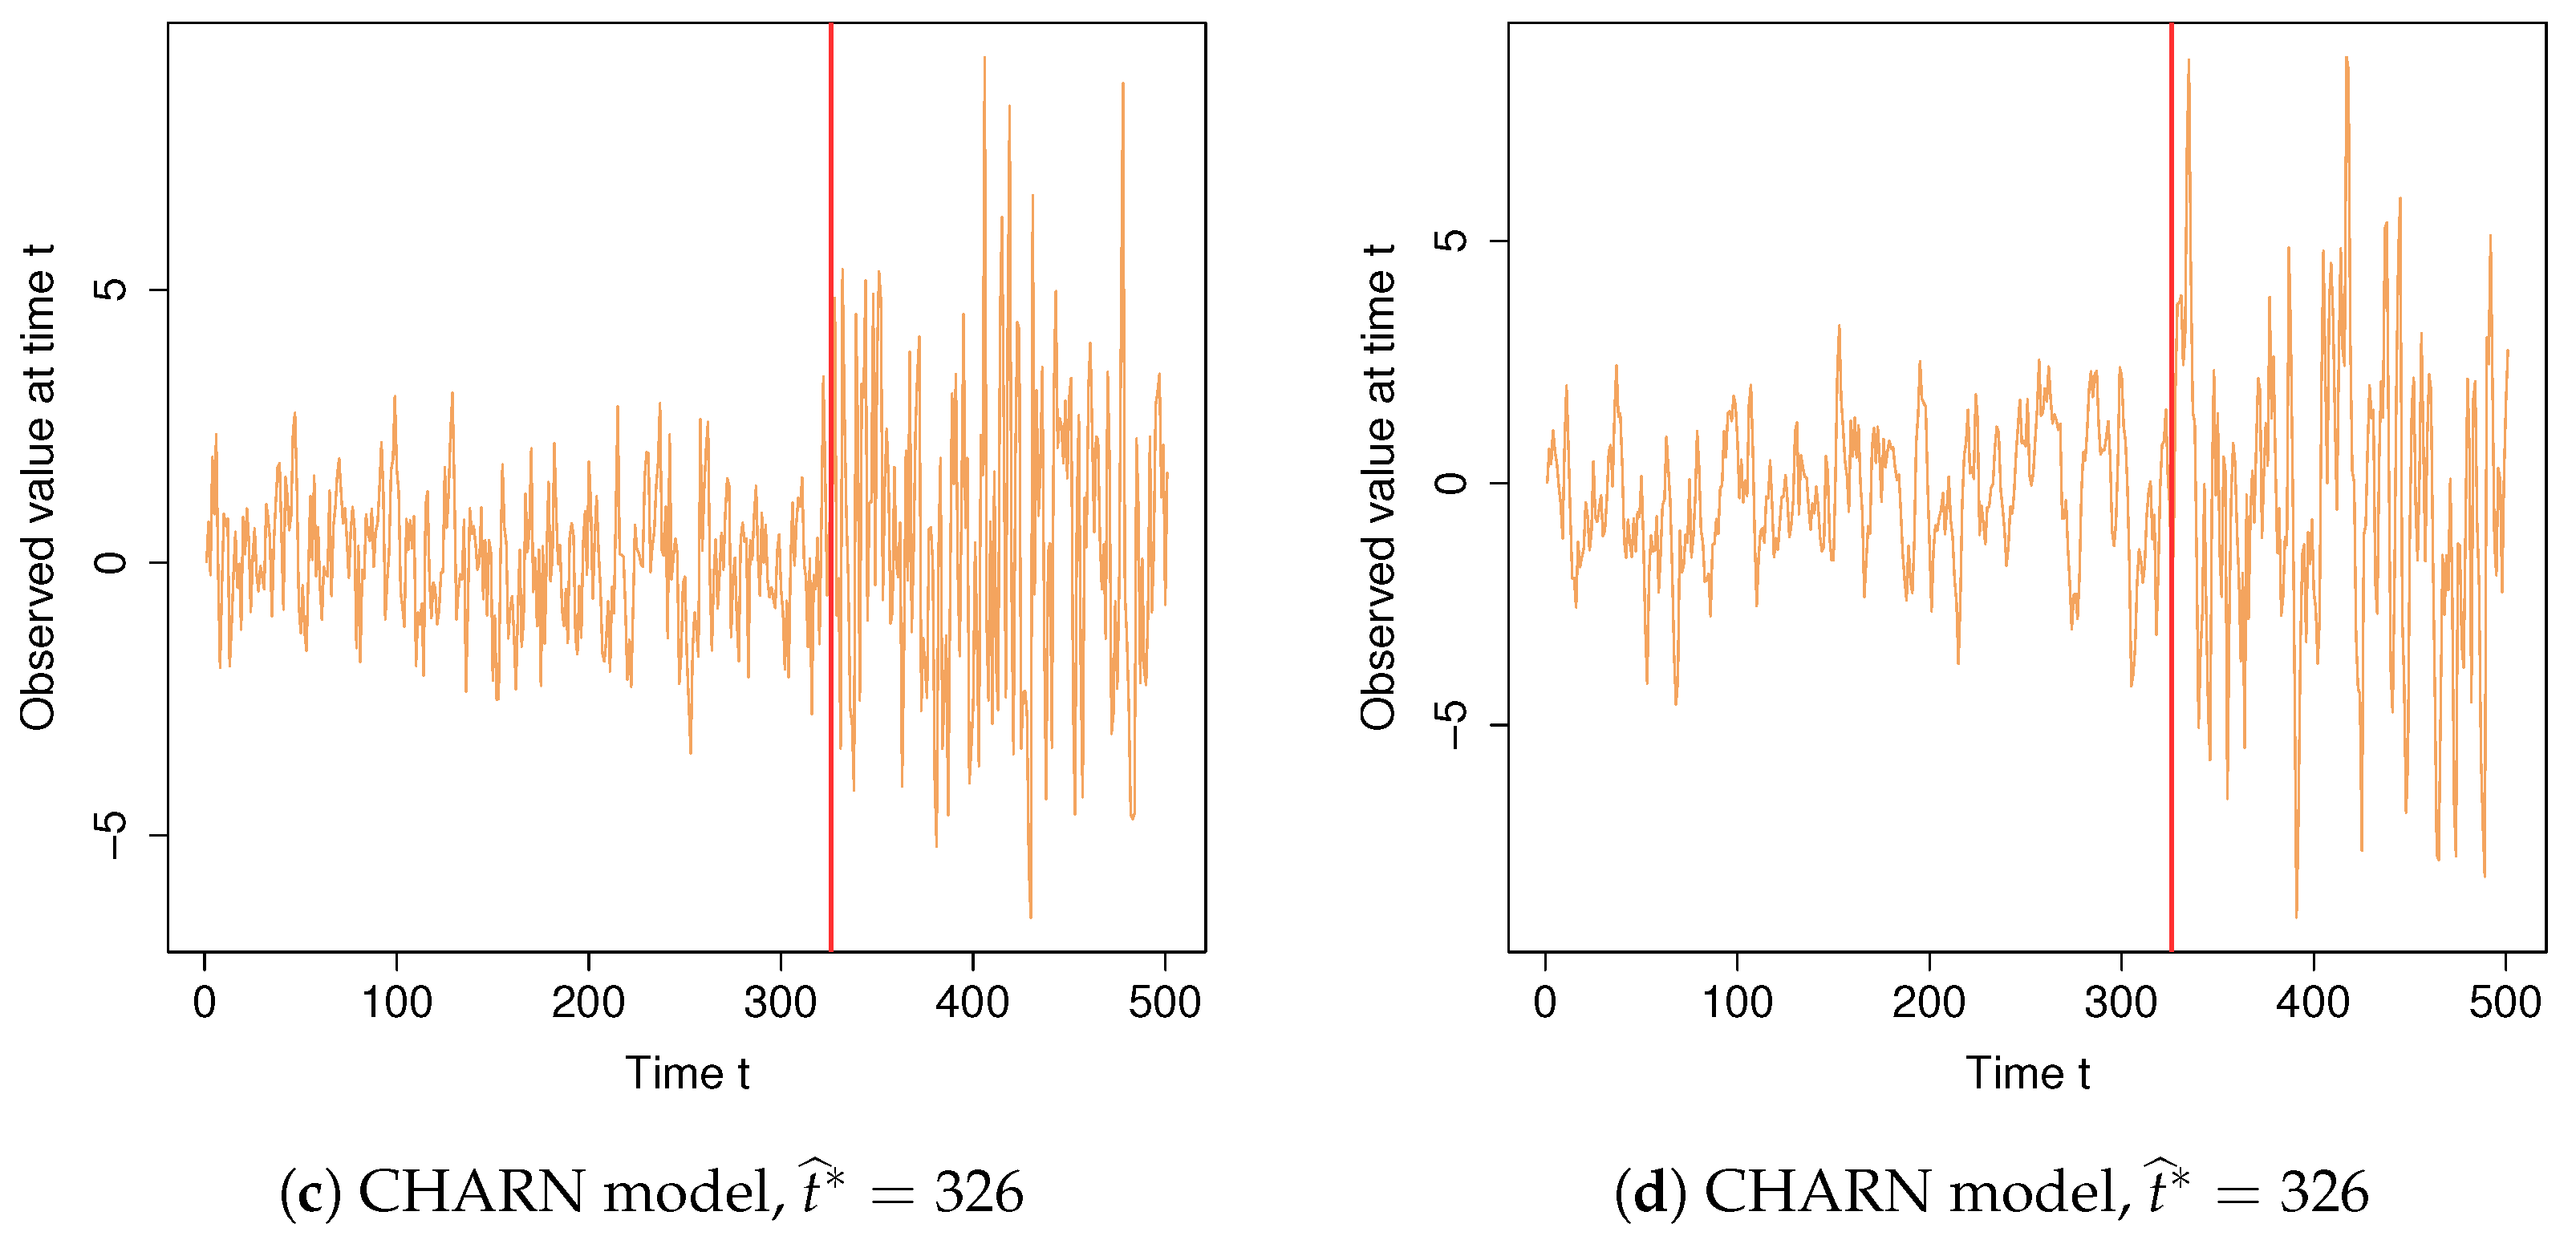
We present two graphs showing a change in volatility at a time t ^ . This is indicated by a vertical red line on both graphics where one can easily see the evolution of the time series before and after the change location estimator t ^ . The series in both figures are obtained for m ( ρ ; x ) = 0 , δ 0 ( x ) = 1 + 0.036 x 2 , n = 500 , τ = 0.65 , and ϕ = 0.8 . That in Figure 1a is obtained for standard iid Gaussian ε t s. In this case, using our method, the change location t = 0.65 × 500 = 325 is estimated by t ^ = 326 . The time series in Figure 1b is obtained with ε t AR(1). In this case, t is estimated by t ^ = 325 .

4.2. Example 2

We generate n observations from the model (1) for m ( ρ ; x ) = 0.5 exp 0.03 x 2 x and σ ( θ ; x ) = θ ̲ δ 0 ( x ) , δ 0 ( x ) = 1 + 0.02 x 2 , ϑ 1 = 1 , ϑ 2 = 1 + ϕ and ε t N ( 0 , 1 ) . We assume ρ = ( ρ 0 , ρ 1 , ρ 2 ) is unknown and estimated by CLS method and σ θ ; . is an unknown function that depends on the unknown parameter θ ̲ . We made 1000 replications for the lengths n = 500 , 1000 , 5000 and 10,000 from this model. The change location estimator, its bias and SE are calculated for the same values of ϕ and locations t as in the preceding example. The results given in Table 3 are very similar to those displayed in Table 1.
As in the previous example, we present two graphs illustrating our method’s ability to detect the change-point in the time series considered. On both graphics, one can easily see the evolution of the time series before and after the change location estimator. The series in both figures are obtained for m ( ρ ; x ) = 0.5 exp ( 0.03 x 2 ) x , δ 0 ( x ) = 1 + 0.02 x 2 , n = 500 , τ = 0.65 , and ϕ = 1.5 . That in Figure 1c is obtained for standard i.i.d. Gaussian ε t s. In this case, using our method, the change location t = 0.65 × 500 = 325 is estimated by t ^ = 326 . The time series in Figure 1d is obtained with AR(1) ε t ’s. In this case, t is estimated by t ^ = 326 .
When performing our test, we used the p-value method. In other words, for the nominal level α = 5 % , we simulated 1000 samples each of length n = 100 , 200 , 500 and 1000 from the model (1) for m ( ρ ; x ) = 0 and σ ( θ ; x ) = θ ̲ δ 0 ( x ) , δ 0 ( x ) = 0.99 + 0.2 x 2 , ϑ 1 = 1 , ϑ 2 = 1 + ϕ and ε t N ( 0 , 1 ) . We then calculated Λ n and counted the number of samples for which
1 2 π Λ n exp Λ n 2 2 ln 1 h ν ( n ) 2 h ν 2 ( n ) 1 Λ n 2 ln 1 h ν ( n ) 2 h ν 2 ( n ) + 4 Λ n 2 α ,
and we divided this number by 1000. This ratio corresponds to the empirical power of our statistical test for change in volatility. The results obtained are listed in Table 4. We can clearly see that, when ϕ = 0 , the empirical power of the test is almost the same as the nominal level α for all n sizes (see Table 4).

4.3. Comparison with Some Recent Algorithms

We compare our method, referred to as LS, with the Wild Binary Segmentation (WBS) method studied in [42], and one of its variants, called Narrowest-Over-Threshold (NOT), proposed by [43], as well as, the Iterative Cumulative Sum of Squares (ICSS) algorithm suggested by [24]. All these methods are implemented under R software, and can, respectively, be found in the packages wbs, not and ICSS.
Our comparison is based on n observations simulated from (1) for ρ 0 = ρ 1 = 0 , θ 2 = 0 , δ 0 X t 1 = 0.04 + 0.36 X t 1 2 , ϑ 1 = 1 , ϑ 2 = 1 + ϕ and ε t N ( 0 , 1 ) . The change location estimators are calculated for ϕ = 0.3 , 0.8 and 1.5 at the locations t = τ × n for τ = 0.25 and 0.75 .
From the results obtained (see Table 5), WBS, NOT and ICSS generate sequences of change-point location estimates, some of which have values close to the true locations. For n = 100 and n = 200 , LS generally provides more accurate estimates t ^ of the true change-point location than WBS, NOT and ICSS, for different ϕ and locations t . Among all, it is generally the best, especially for larger values of n and ϕ .

4.4. Application to Real Data

In this section, we apply our procedure to two sets of genuine time series, namely, the USA stock market prices and the Brent crude oil prices. As these have large values, we take their logarithms and differentiate the resulting series to remove their trends.

4.4.1. USA Stock Market

These data of length 2022 from the American stock market were recorded daily from 2 January 1992 to 31 December 1999. They represent the daily stock prices of the S&P 500 stock market (SPX). They are among the most closely followed stock market indices in the world and are considered as an indicator of the USA economy. They have also been recently examined by [44] and can be found at www.investing.com (accessed on 1 August 2023).
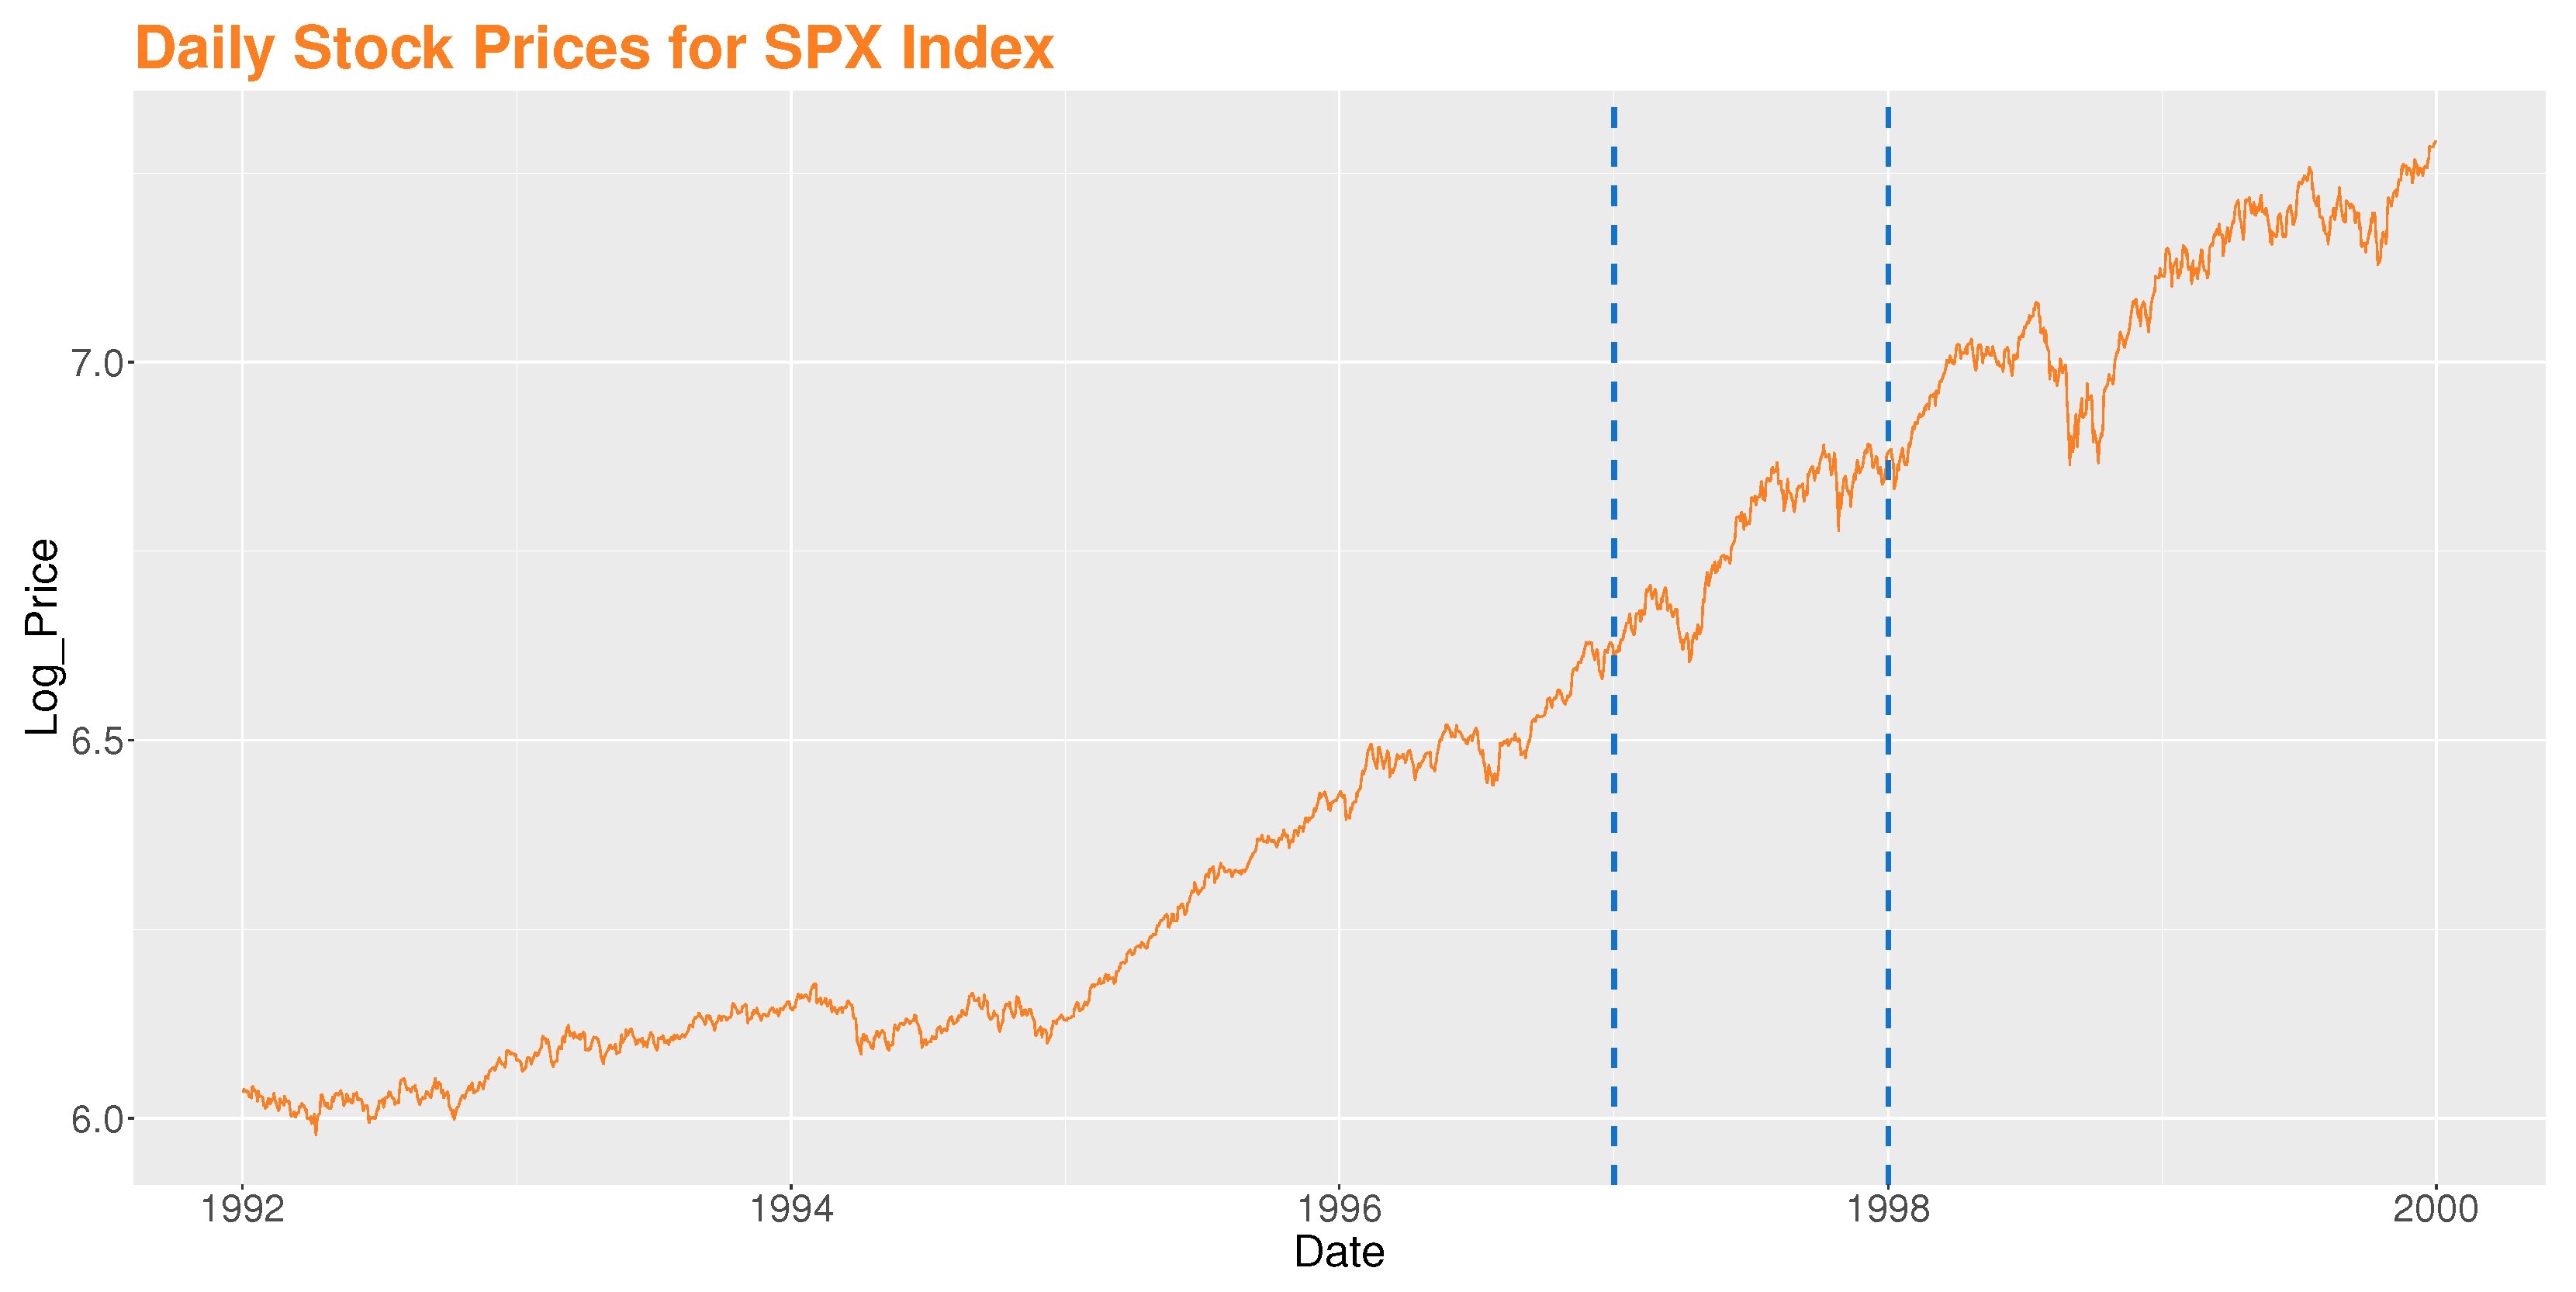
In Figure 2, we observe that the trend of the SPX daily stock price series is not constant over time. We also observe that stock prices have fallen sharply, especially in the time interval between the two vertical dashed blue lines (the period of the 1997–1998 Asian financial crisis).
Denote by D t the value of the stock price for the SPX index at day t, and the first difference of the logarithm of stock price, X t as
X t = log D t log D t 1 = log D t D t 1 .
X t is the logarithmic return of stock price for the SPX index at day t.
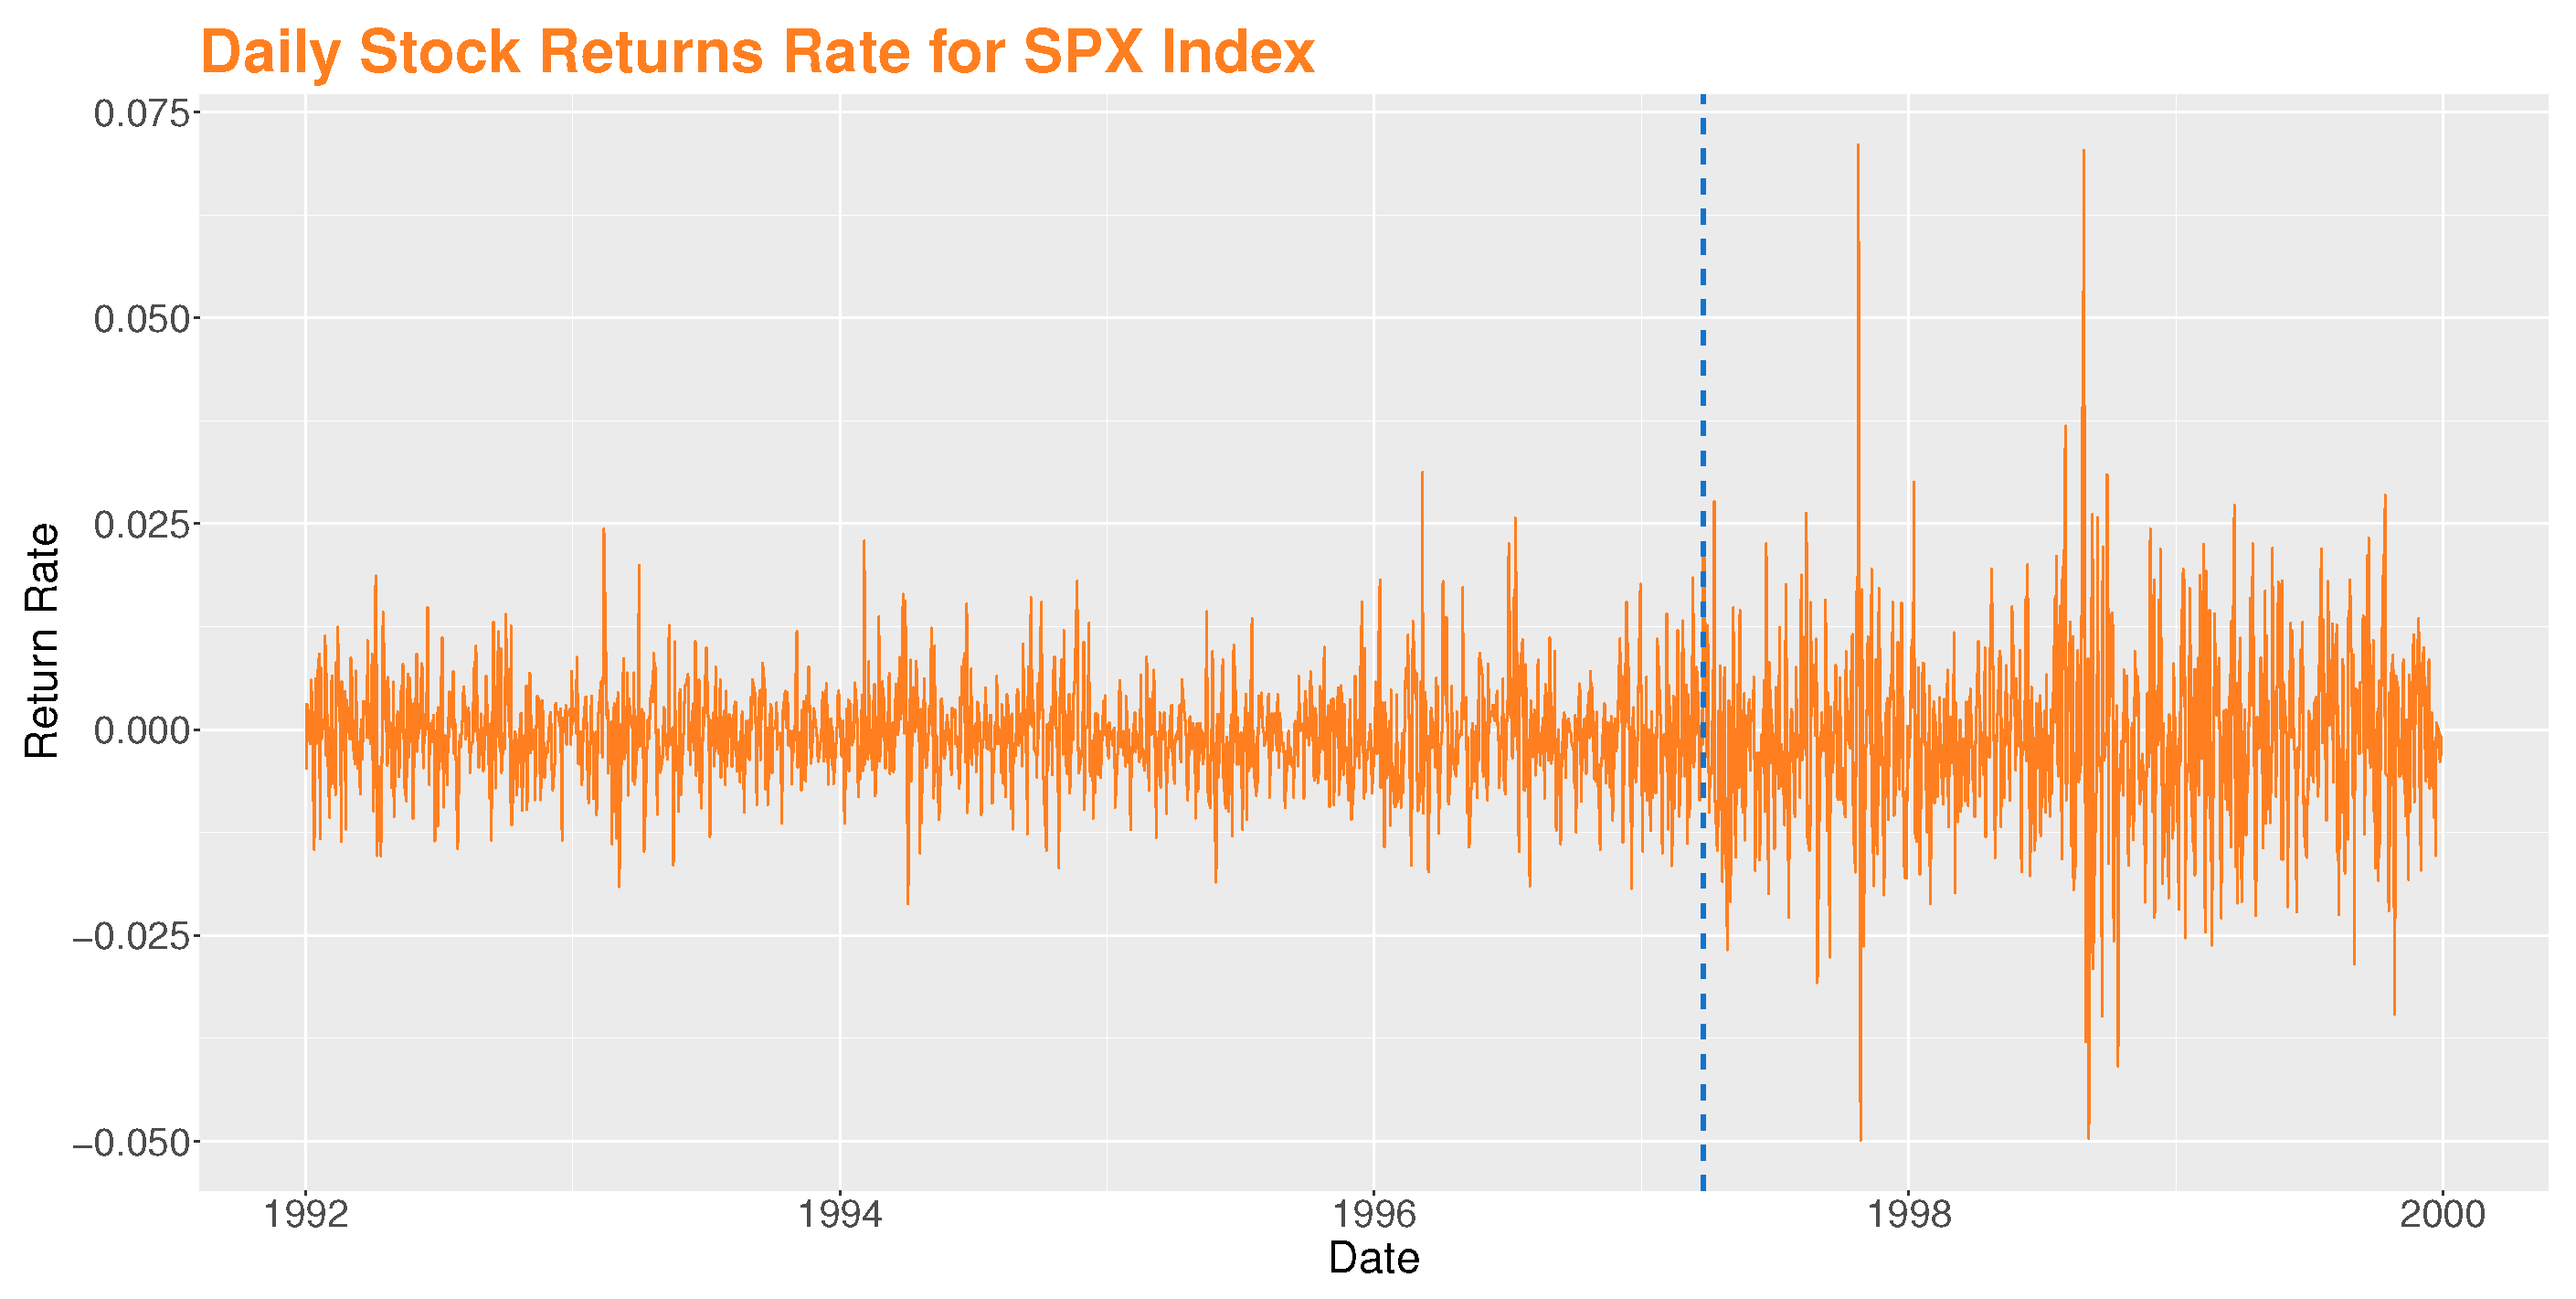
The series ( X t ) is approximately piece-wise stationary on two segments and symmetric around zero (see Figure 3). This brought us to consider a CHARN model with m ( ρ ; x ) = 0 , δ 0 ( x ) = θ 0 + θ 1 x 2 for θ 0 = 1 , θ 1 = 0 , ϑ 1 and ϑ 2 estimated by CLS described in Section 2.
Using our procedure, we found an important change point in stock price volatility on 26 March 1997, which is consistent with the date found by [44] (see Figure 3).
The vertical dashed blue line of Figure 3 represents the date at which the change occurred. It should be noted that the change in volatility coincides with the Asian crisis in 1997 when Thailand devalued its currency, the baht, against the US dollar. This decision led to a fall in the currencies and financial markets of several countries in its surroundings. The crisis then spread to other emerging countries with important social and political consequences and repercussions on the world economy.

4.4.2. Brent Crude Oil

These data of length 585 are based on Brent oil futures. They represent the prices of Brent oil (USD/barrel) on a daily basis between 4 January 2021 and 6 April 2023. They are available at www.investing.com (accessed on 1 August 2023).
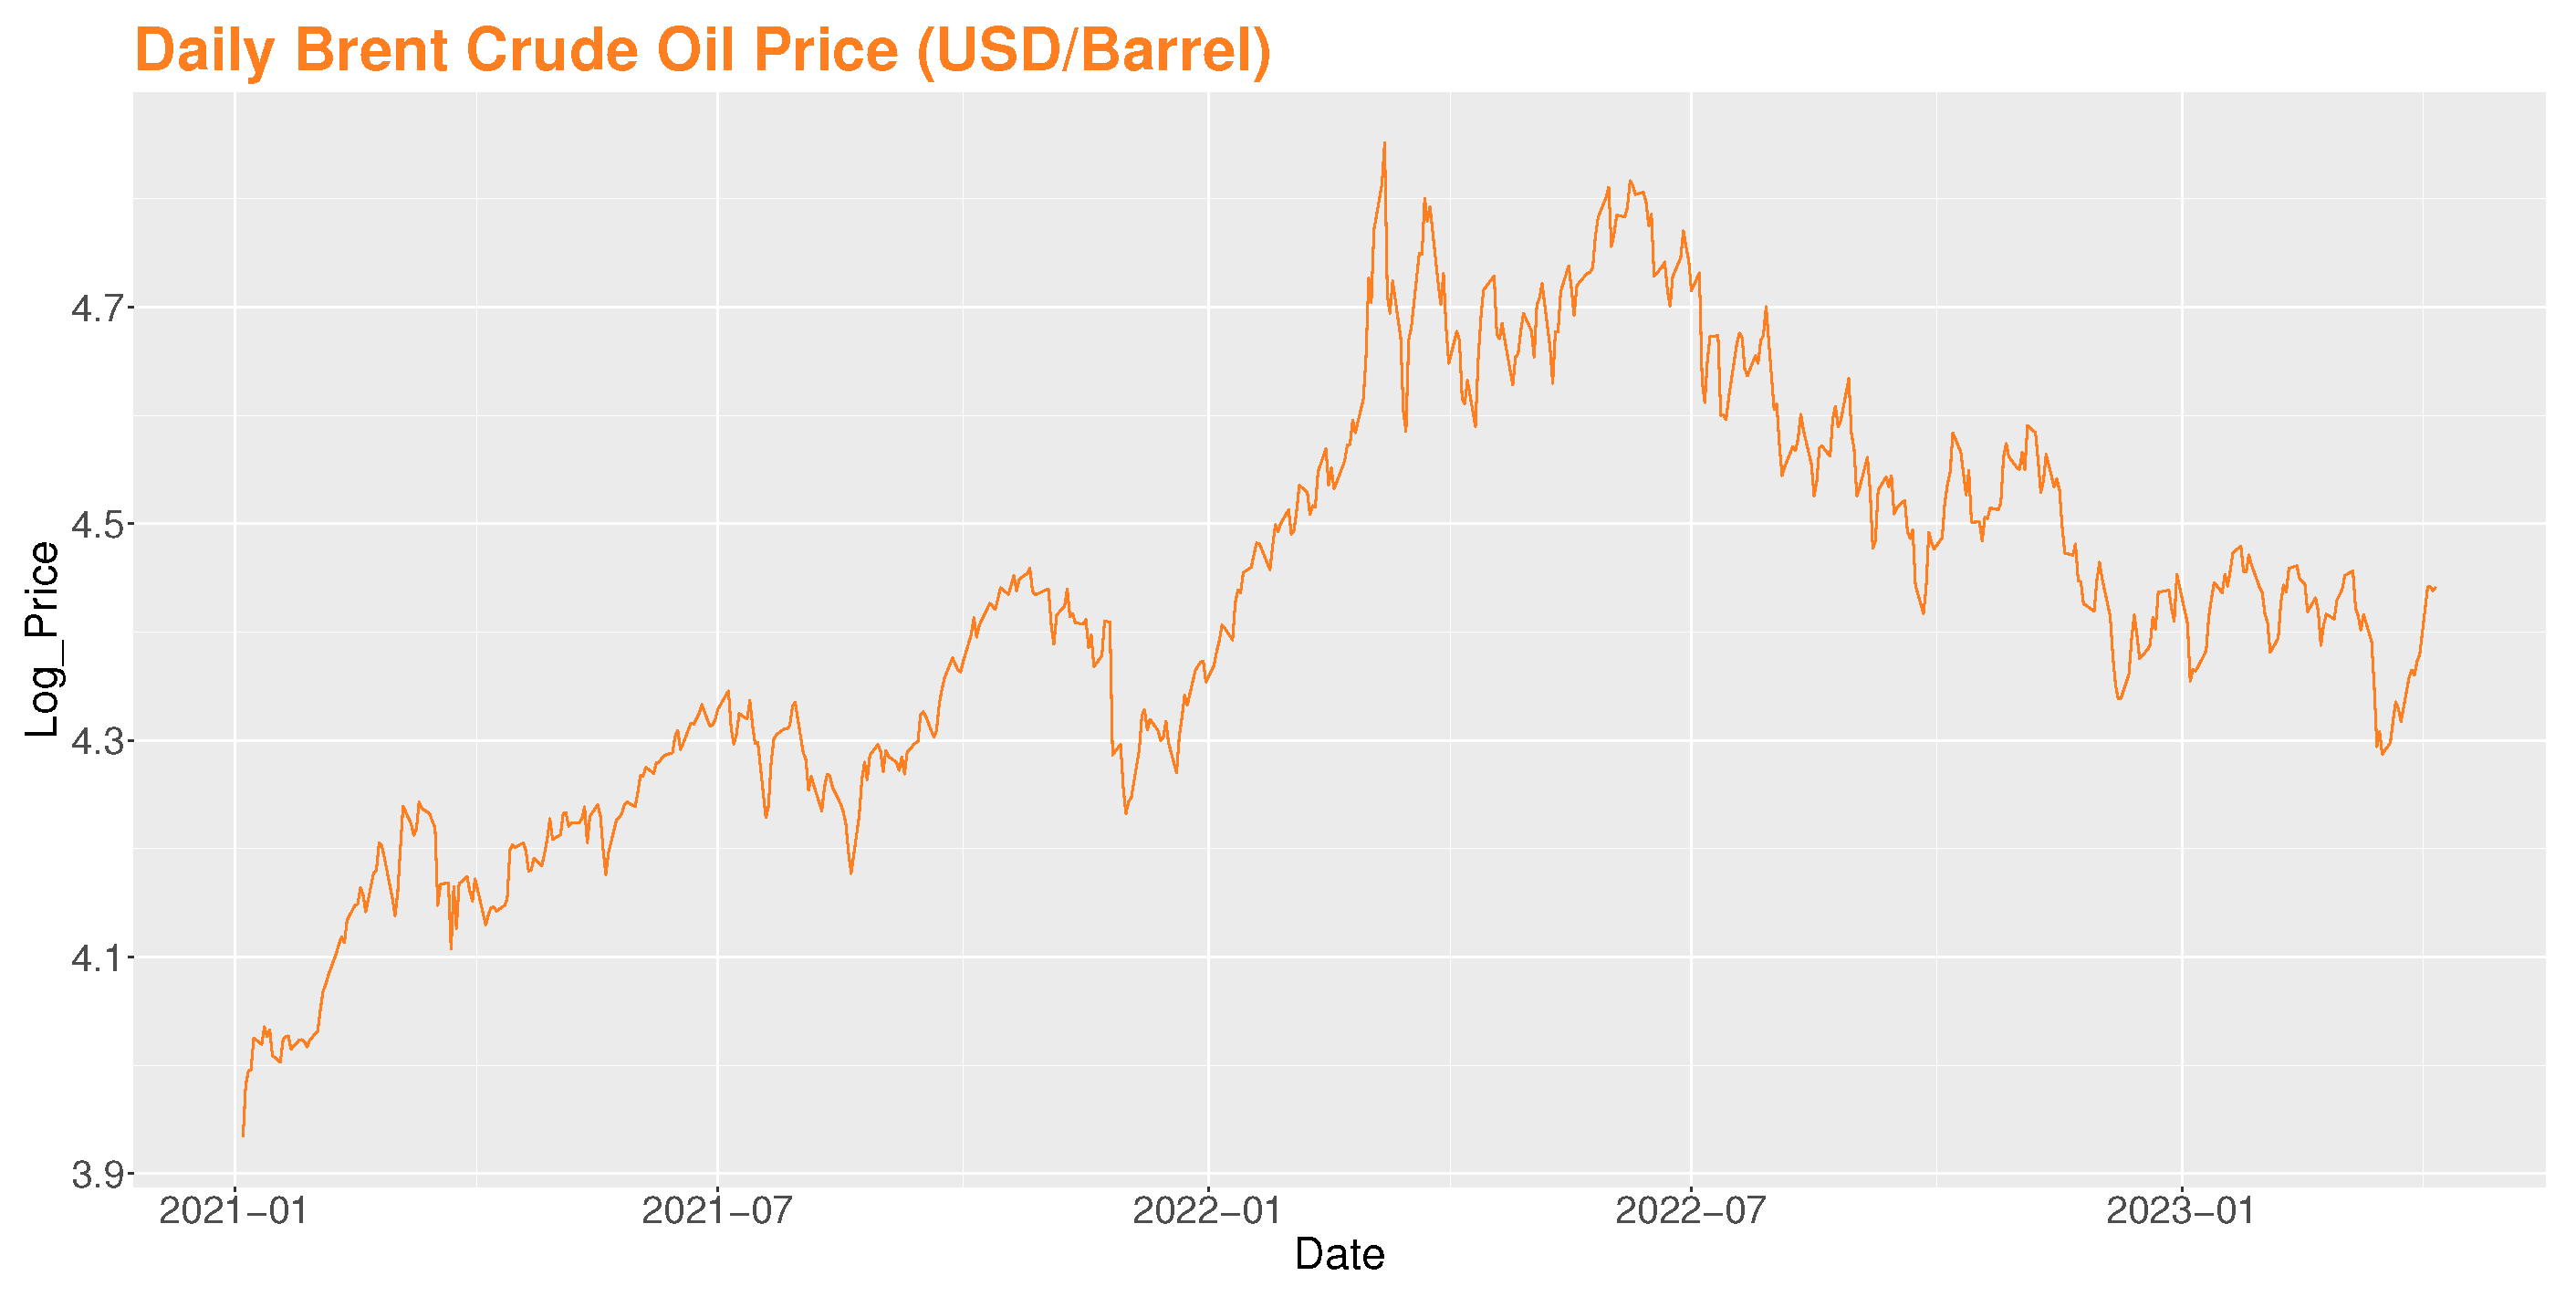
Figure 4 shows that the evolution of the daily series of Brent oil prices is non-stationary. It also shows that stock prices fell sharply, especially in early March 2022 (the date of the conflict between OPEC and Russia, when the latter refused to reduce its oil production in the face of declining global demand caused by the COVID-19 pandemic).
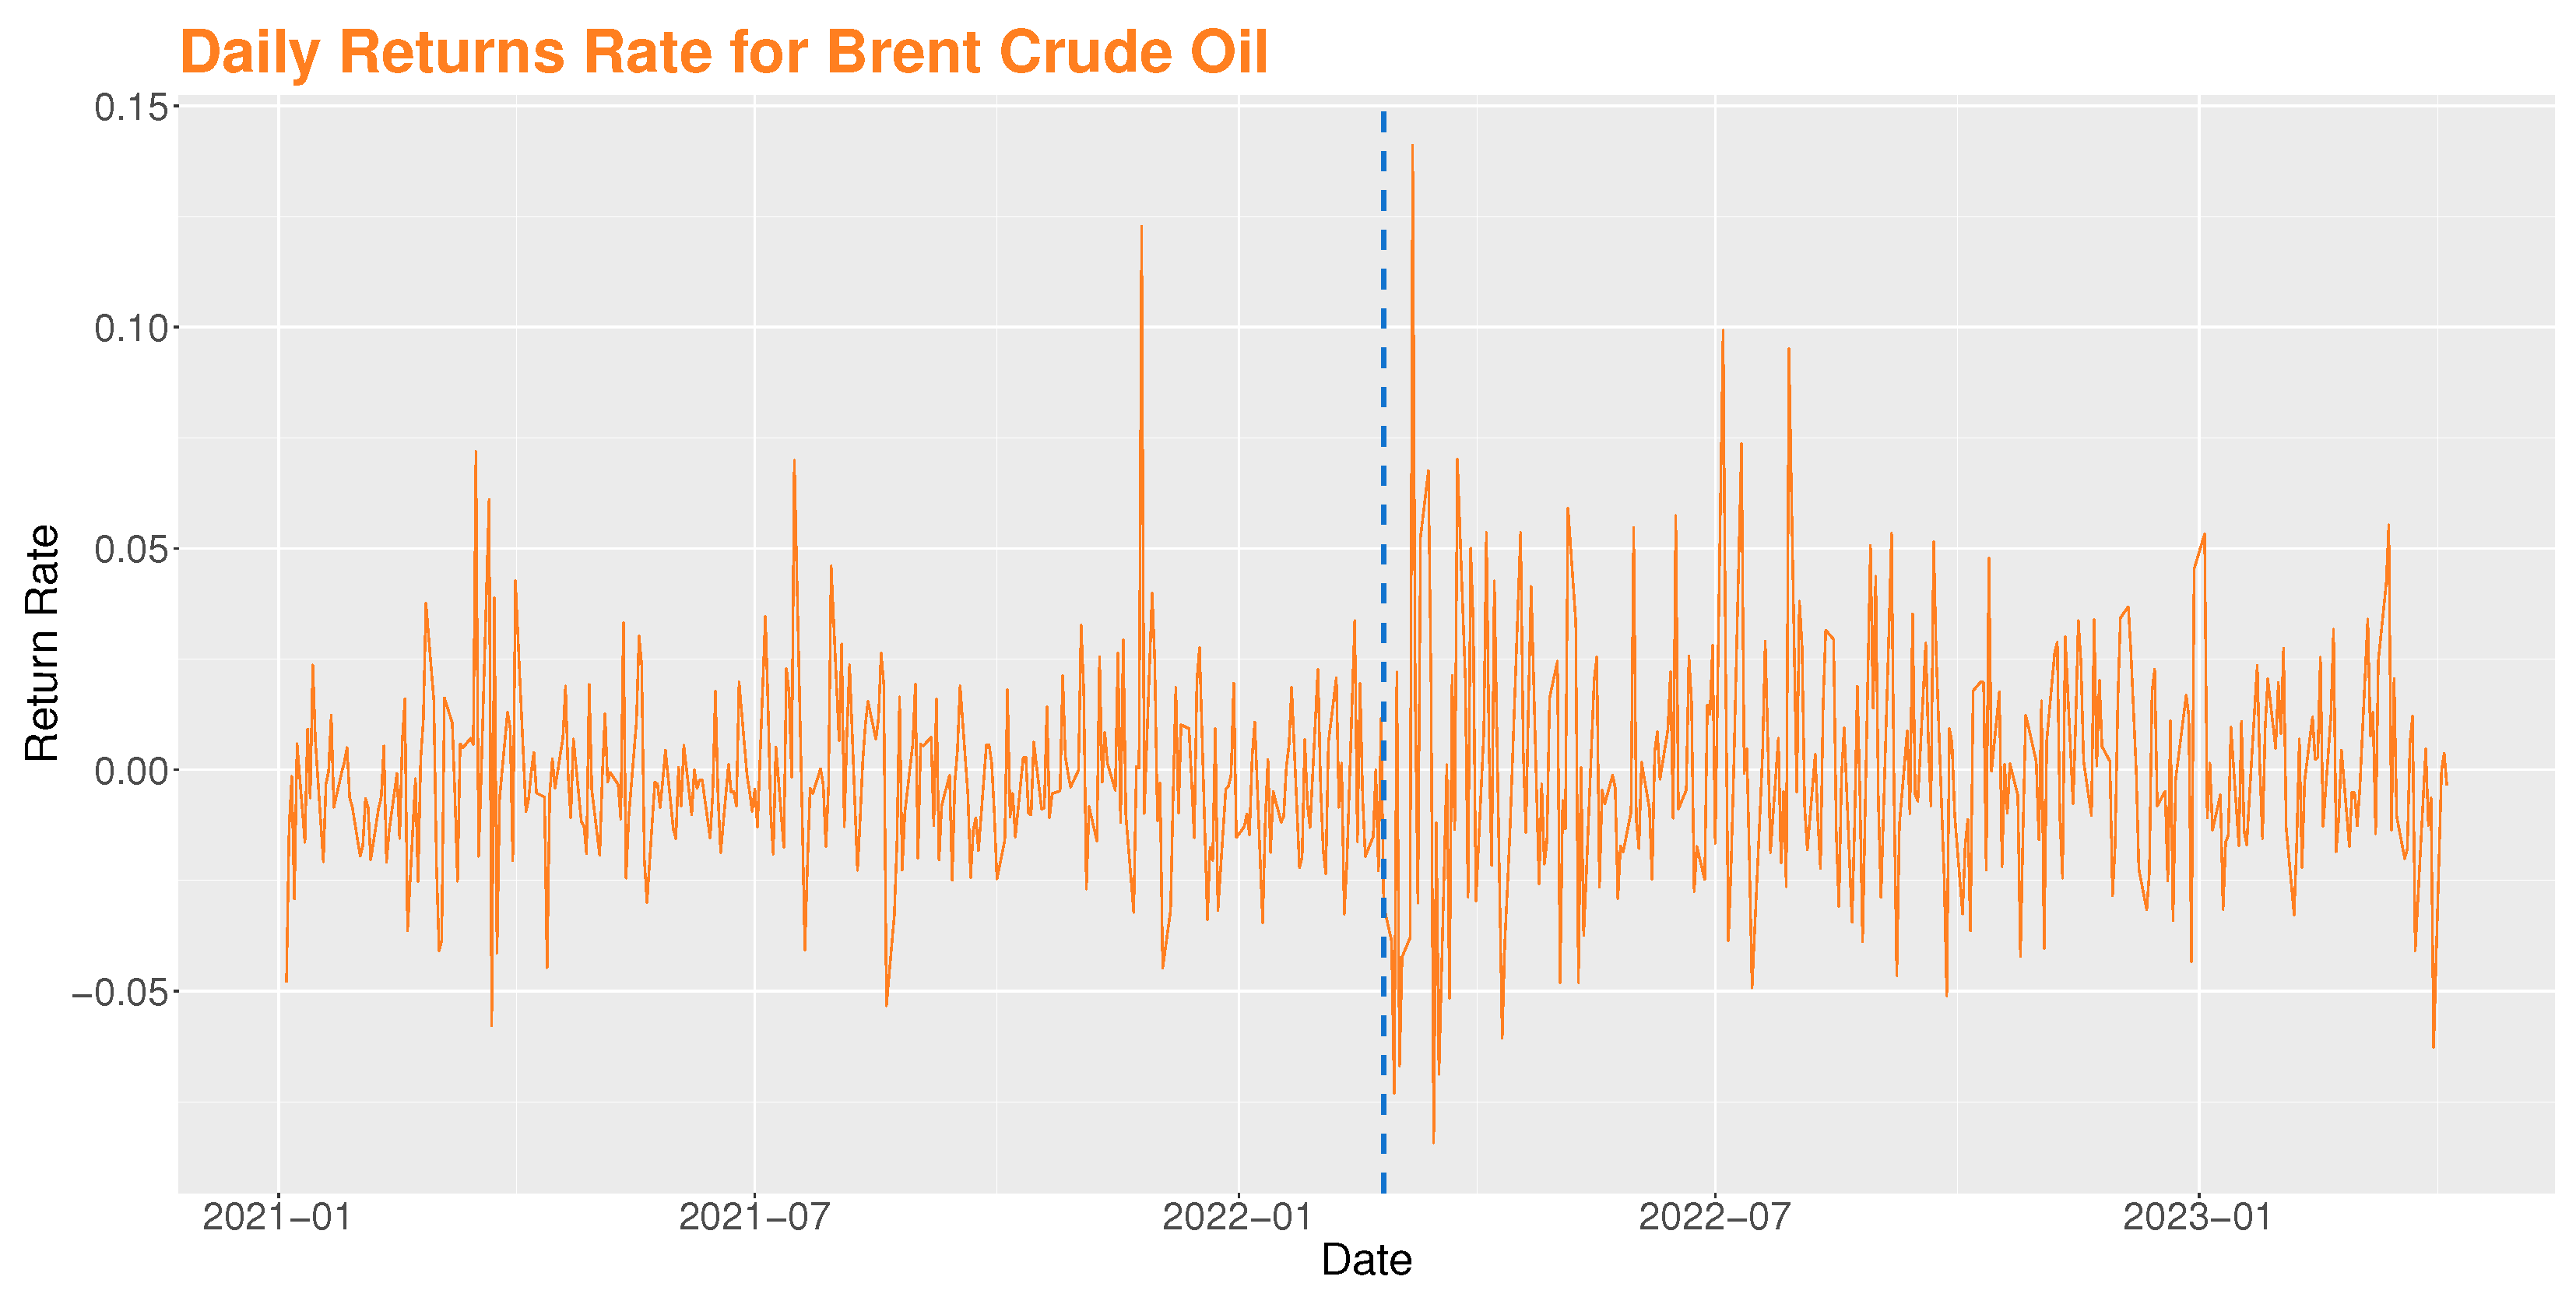
We follow the same procedure as in the previous example and obtain the logarithmic transformation of the daily rate of return series for Brent oil (see Figure 5 below). Proceeding as for the first data, the application of our procedure allows to find a change at 25 February 2022. The break date is marked by a dashed blue vertical line (see Figure 5).
It also performs well on these data. Indeed, oil volatility was very high in March 2022 due to the COVID-19 pandemic and the conflict between OPEC and Russia. The health crisis led to a significant drop in global oil demand, while Russia refused to cut oil production as proposed by OPEC, which caused oil prices to fall. Brent crude oil fell from over 60 dollars a barrel to less than 20 dollars in a month.

4.4.3. Comparison with WBS and ICSS

This time, we compare our LS method with both the WBS and ICSS algorithms for real S&P 500 stock market and Brent crude oil data, just as we carried out for simulated data. The results shown in Table 6, indicate that WBS and ICSS produce sequences of change-point location estimates, some of which are close to the actual locations. In contrast, LS provides more accurate t ^ estimates of the actual change-point location than WBS and ICSS. This clearly demonstrates that our method remains robust for both real and simulated data. Of all these methods, LS generally stands out as the best for the examples we have considered.

5. Conclusions

In this article, we have presented a CUSUM test based on a least-squares statistics for detecting an abrupt change in the volatility of CHARN models. We have shown that the test statistic converges to a supremum of a weighted standard Brownian Bridge. We have constructed a change location estimator and obtained its rate of convergence and its limiting distribution whose density function is given. A simulation experiment shows that on the example tested, our method generally performs better than the competitors considered. Applied to real equity price data and real Brent crude oil data, our procedure finds the change locations found in the literature. This is not the case with WBS and ICSS. The next step to this work is its extension to the detection of multiple changes in volatility of multivariate CHARN models.

Author Contributions

Conceptualization, M.S.E.A., E.E. and J.N.-W.; methodology, M.S.E.A., E.E. and J.N.-W.; software, M.S.E.A., E.E. and J.N.-W.; validation, E.E. and J.N.-W.; writing—original draft preparation, M.S.E.A., E.E. and J.N.-W.; writing—review and editing, M.S.E.A., E.E. and J.N.-W.; supervision, E.E. and J.N.-W. All authors have read and agreed to the published version of the manuscript.

Funding

This research received no external funding.

Data Availability Statement

Not applicable.

Acknowledgments

We express our gratitude to the referees for their comments and suggestions, which have been instrumental in improving this work.

Conflicts of Interest

The authors declare no conflict of interest.

Appendix A

This section is devoted to the proofs of the results. Here, recalling that for any i Z , W i = [ X i m ( ρ ; Z i 1 ) ] / δ 0 ( Z i 1 ) , the sequence ( Z i ) i Z is the process defined for any i Z by
Z i = W i 2 E ( W i 2 ) .
We first recall some definitions and preliminary results.

Appendix A.1. Preliminary Results

Recall that Ω , F , P is a probability space. Let X : = X k , k Z be a sequence of random variables (not necessarily stationary). For i j , define the σ field F i j : = σ X k , i k j and for each n 1 , define the following mixing coefficients:
α n : = sup j Z α F j , F j + n ; ϕ n : = sup j Z ϕ F j , F j + n .
The random sequence X is said to be “strongly mixing” or “ α -mixing” if α ( n ) 0 as n , “ ϕ -mixing” if ϕ ( n ) 0 as n . One shows that ϕ ( n ) α ( n ) , so that an α -mixing sequence of random variables is also ϕ -mixing. The following corollary serves to prove Lemma A1 below.
Corollary A1
([45]). Let X n , n 1 be a sequence of ϕ-mixing random variables with
n 1 ϕ ( n ) 1 / 2 < and b n , n 1 a positive non-decreasing real number sequence. For any ϵ > 0 and positive integers m < n , then there exists a constant C > 0 such that,
P max m k n 1 b k i = 1 k X i E X i ϵ C ϵ 2 j = 1 m σ j 2 b m 2 + j = m + 1 n σ j 2 b j 2 ,
where σ j 2 = V ar X j = E X j E X j 2 .
Lemma A1.
We assume A 4 is satisfied, then there exists a constant K 0 , such that for every ϵ > 0 and m > 0 , we have
P sup m k n 1 k i = 1 k Z i > ϵ K 0 ϵ 2 m .
Proof. 
By substituting b k by k, X i by W i 2 in Corollary A1, for any ϵ > 0 and positive integers m < n , we obtain
P max m k n 1 k i = 1 k Z i ϵ C ϵ 2 j = 1 m V ar W j 2 m 2 + j = m + 1 n V ar W j 2 j 2 .
Since
W t 2 = ϑ 1 2 ε t 2 if 1 t t ϑ 2 2 ε t 2 if t < t n ,
we have
E W t 4 = ϑ 1 4 E ε t 4 if 1 t t ϑ 2 4 E ε t 4 if t < t n ,
which in turn implies that for any 1 j n , there exists a real number M > 0 such that
V ar W t 2 = E W t 4 E W t 2 2 M .
From (A2) and (A3), we have
P max m k n 1 k i = 1 k Z i ϵ M C ϵ 2 1 m + j = m + 1 1 j 2 3 M C ϵ 2 m .
This proves Lemma A1 for K 0 = 3 M C .    □
Remark A1.
Taking b k = k and m = 1 and proceeding as in the proof of Lemma A1, one has by (A2) and (A3), for some C 2 > 0 ,
P max 1 k n 1 k i = 1 k Z i ϵ M C 1 ϵ 2 j = 1 n 1 j C 2 ln n ϵ 2 ,
from which it follows that,
sup 1 k n 1 k i = 1 k Z i = O P ln n .
Lemma A2.
We assume that A 4 is satisfied, and t = [ n τ ] for some τ 0 , 1 , then for every ϵ > 0 , there exists L 0 > 0 and N ϵ N such that, for all n N ϵ , the estimator t ^ satisfies
P t ^ t > L 0 n ln n κ n < ϵ .
Proof. 
For proving the consistency of an estimator obtained by maximizing an objective function, we must assert that the objective function converges uniformly in probability to a non-stochastic function, which has a unique global maximum. More often than not, it is to show that the objective function is close to its mean function. Our problem’s objective function is Δ k , k = 1 , 2 , , n 1 . It results from (10), that
t ^ = arg max 1 k < n Δ k 2 = arg max 1 k < n Δ k ,
where we recall that
Δ k = k ( n k ) n W ¯ n k W ¯ k .
It is possible to simplify the problem by working with Δ k without the absolute sign. We thus show that the expected value of Δ k has a unique maximum at t and that Δ k E Δ k , is uniformly small in k for a large n.
We have
Δ k Δ t Δ k E ( Δ k ) + Δ t E ( Δ t ) + E ( Δ k ) E ( Δ t ) 2 sup 1 k n Δ k E ( Δ k ) + E ( Δ k ) E ( Δ t ) .
In order to simplify without losing generality, it is assumed that n τ is an integer equal to t , i.e., τ = t / n . Let d = k / n and demonstrate first that
E ( Δ t ) E ( Δ k ) K τ κ n d τ ,
for some K τ > 0 , where κ n = ϑ 2 2 ϑ 1 2 such that κ n > 0 .
For this it is sufficient to consider the case where k t due to the symmetry. Then, from (A5) and according k t , we obtain
E ( Δ k ) = k ( n k ) n E W ¯ n k W ¯ k = k ( n k ) n E 1 n k i = k + 1 n W i 2 1 k i = 1 k W i 2 = k ( n k ) n E 1 n k i = k + 1 t W i 2 + i = t + 1 n W i 2 1 k i = 1 k W i 2 = d ( 1 d ) 1 n k t k ϑ 1 2 + n t ϑ 2 2 ϑ 1 2 = d ( 1 d ) t k ϑ 1 2 + n t ϑ 2 2 ( n k ) ϑ 1 2 n k = d ( 1 d ) t n ϑ 1 2 + n t ϑ 2 2 n k = d ( 1 d ) n t n k ϑ 2 2 ϑ 1 2 = d ( 1 d ) 1 τ 1 d κ n .
In particular, E Δ t = τ ( 1 τ ) κ n , therefore we obtain
E Δ t E Δ k = κ n τ ( 1 τ ) d ( 1 d ) 1 τ 1 d = κ n 1 τ τ 1 τ d 1 d = κ n τ d 1 d τ 1 τ + d 1 d 1 1 2 κ n τ d 1 τ τ .
Let K τ = 1 2 1 τ τ , then through (A8), we have shown that
E Δ t E Δ k K τ κ n d τ .
We clearly see that the previous inequality indicates that E Δ k achieves its maximum at k = t .
From Equations (A6) and (A9) and Δ t ^ Δ t 0 , immediately by replacing d by t ^ / n , we obtain
E Δ t E Δ t ^ 2 sup 1 k n Δ k E ( Δ k ) ,
and
E Δ t E Δ t ^ K τ κ n n t ^ t .
From (A10) and (A11), we obtain
t ^ t 2 n K τ κ n 1 sup 1 k n Δ k E ( Δ k ) .
From (A5), we obtain
Δ k E Δ k = k ( n k ) n W ¯ n k E W ¯ n k W ¯ k E W ¯ k = k ( n k ) n 1 n k i = k + 1 n Z i 1 k i = 1 k Z i = 1 n k n 1 n k i = k + 1 n Z i 1 n 1 k n 1 k i = 1 k Z i .
It results that,
Δ k E Δ k 1 n 1 n k i = k + 1 n Z i + 1 k i = 1 k Z i .
From (A4), we deduce that the right side of the inequality (A14) is O P ln n / n uniformly in k. It follows from (A4), (A12) and (A14) that
t ^ t = n κ n n O P ln n = O P n ln n κ n .
As a result, for all ϵ > 0 , there exists L 0 > 0 and N ϵ N such that, for all n N ϵ , we obtain
P t ^ t > L 0 n ln n κ n < ϵ .
Which completes the proof of Lemma A2.    □

Appendix A.2. Proofs of Theorems

Appendix A.2.1

Proof of Theorem 2.
Under H 0 (i.e., ϑ 1 = ϑ 2 ), by simple will of simplicity we take ϑ 1 = 1 .
Let ( Y t ) t Z = ( W t 2 1 ) t Z and S n Y = t = 1 n Y t = C n n . With this, E ( S n Y ) = 0 and from simple computations, E S n Y 2 = V ar ( C n ) = V ar t = 1 n ε t 2 .
Since V ar t = 1 n ε t 2 / n a . s . σ w 2 as n , E S n Y 2 / n a . s . σ w 2 as n . This result is guaranteed by assumption A 4 (see, e.g., [46], p. 172). It is possible to use weak invariance principles for the sum of the underlying errors (see, e.g., [47]). Let M n be the random variable defined from the partial sums S 0 Y , S 1 Y , , S n Y S 0 Y = 0 . For points k / n in [ 0 , 1 ] , we set
M n k n : = 1 σ w n S k Y ,
and for the remaining points s of [ 0 , 1 ] , M n ( s ) is defined by a linear interpolation, that is, for any k = 1 , , n 1 , and for any s in ( k 1 ) / n , k / n ,
M n ( s ) : = k n s 1 n M n k 1 n + s k 1 n 1 n M n k n = 1 σ w n S k 1 Y + n s k 1 n 1 σ w n Y k .
Since k 1 = [ n s ] if ( k 1 ) / n s < k / n , we may define the random function M n ( s ) more concisely by
M n ( s ) : = 1 σ w n S [ n s ] Y + n s [ n s ] Y [ n s ] + 1 .
Under assumption A 4 and by using a generalization of Donsker’s theorem in [46], we have
M n d B in D [ 0 , 1 ] as n ,
where B ( s ) , 0 s 1 denotes the standard Brownian motion on D [ 0 , 1 ] . We can also prove this outcome by using Theorem 20.1 of [46].
So,
M n ( s ) s M n ( 1 ) d B ~ ( s ) in D [ 0 , 1 ] as n ,
where B ~ ( s ) , 0 s 1 , stands for the Brownian Bridge on D [ 0 , 1 ] .
Let n s = k ; k = 1 , 2 , , n , then
M n ( s ) s M n ( 1 ) = 1 σ w n S [ n s ] Y s S [ n ] Y + n s [ n s ] σ w n Y [ n s ] + 1 .
Since
sup 0 s 1 n s [ n s ] σ w n Y [ n s ] + 1 P 0 as n ,
we have
1 σ w n S [ n s ] Y s S [ n ] Y d B ~ ( s ) in D [ 0 , 1 ] as n .
It is easy to check that
S [ n s ] Y s S [ n ] Y = ξ n ( s ) , this according to the relation ( 13 ) .
From (A15) and (A16), it follows that
ξ n ( s ) σ w n d B ~ ( s ) in D [ 0 , 1 ] as n .
Hence,
ξ n ( s ) σ w n d B ~ ( s ) in D [ δ , 1 δ ] as n ,
from which the proof of Part 1 is handled. Note that this proof could be found using Theorem 2.1 of [48]. For the proof of Part 2, by the continuous mapping theorem, it follows from (A17) that
sup δ s 1 δ ξ n ( s ) σ w n q ( s ) D sup δ s 1 δ | B ~ ( s ) | q ( s ) as n .
Whence, as σ ^ w is consistent to σ w , from (15) and (A18), we easily obtain
sup δ s 1 δ | T n ( s ) | σ ^ w D sup δ s 1 δ | B ~ ( s ) | q ( s ) as n .
This completes the proof of Part 2 and that of the Theorem 2.    □

Appendix A.2.2

Proof of Theorem 3.
We need only to prove that τ ^ τ = O P n 1 κ n 2 . For this, we use Lemmas A1 and A2. From Lemma A2, we have t ^ t = O P n ln n κ n 1 , which implies t ^ / n t / n = O P ln n / κ n n , which in turn is equivalent to τ ^ τ = ln n / κ n n O P ( 1 ) .
As, κ n 0 and κ n n / ln n , as n , it is clear that τ ^ τ = o P ( 1 ) , which shows that τ ^ is consistent to τ .
Since τ ( a , 1 a ) for some 0 < a < 1 / 2 , using the above results, it is clear that for all ϵ > 0 , P τ ^ ( a , 1 a ) < ϵ / 2 for larger n. Thus, it suffices to investigate the behavior of Δ k for n a k n n a . In this purpose, we prove that for all ϵ > 0 , P τ ^ τ > K n κ n 2 1 < ϵ for larger n and for some sufficiently large real number K > 0 .
We have
P τ ^ τ > K n κ n 2 P τ ^ τ > K n κ n 2 , τ ^ ( a , 1 a ) + P τ ^ ( a , 1 a ) P τ ^ τ > K n κ n 2 , τ ^ ( a , 1 a ) + ϵ 2 P sup k E n k Δ k Δ t + ϵ 2 ,
where E n k = k : n a k n n a , k t > K κ n 2 . We study the first term in the right-hand side of (A20). For this, it is easy to see that
P sup k E n k Δ k Δ t P sup k E n k Δ k + Δ t 0 + P sup k E n k Δ k Δ t 0 P 1 + P 2 ,
where P 1 = P sup k E n k Δ k + Δ t 0 and P 2 = P sup k E n k Δ k Δ t 0 .
As E Δ k 0 for all k , it is obvious that
Δ k + Δ t 0 Δ k E Δ k + Δ t E Δ t E Δ k E Δ t Δ k E Δ k + Δ t E Δ t E Δ t Δ k E Δ k 1 2 E Δ t or Δ t E Δ t 1 2 E Δ t Δ k E Δ k 1 2 E Δ t or Δ t E Δ t 1 2 E Δ t .
Then,
P 1 P sup k E n k Δ k E Δ k 1 2 E Δ t + P Δ t E Δ t 1 2 E Δ t 2 P sup k E n k Δ k E Δ k 1 2 E Δ t .
From (A13), we have
Δ k E Δ k = k ( n k ) n 1 n k i = k + 1 n Z i 1 k i = 1 k Z i .
Then,
P 1 2 P sup k E n k Δ k E Δ k 1 2 E Δ t 2 P sup k E n k k ( n k ) n 1 n k i = k + 1 n Z i 1 k i = 1 k Z i 1 2 E Δ t 2 P sup k E n k k n 1 k n 1 n k i = k + 1 n Z i 1 k i = 1 k Z i 1 2 E Δ t 2 P sup k E n k q k n 1 n k i = k + 1 n Z i 1 k i = 1 k Z i 1 2 E Δ t ,
where q k / n = k / n 1 k / n . As 0 q k / n 1 for all k = 1 , , n , we can write
P 1 2 P sup k E n k 1 n k i = k + 1 n Z i 1 k i = 1 k Z i 1 2 E Δ t 2 P sup k n n a 1 n k i = k + 1 n Z i 1 4 E Δ t + 2 P sup k n a 1 k i = 1 k Z i 1 4 E Δ t .
From (A22) and Lemma A1, there exists K 1 > 0 and K 2 > 0 such that,
P 1 2 K 1 n a 1 4 E Δ t 2 + 2 K 2 n a 1 4 E Δ t 2 32 a 1 E Δ t 2 K 1 + K 2 n ,
which implies that as n ,
ϵ > 0 , P 1 < ϵ 4 .
Now, we turn to the study of P 2 = P sup k E n k Δ k Δ t 0 . Observing that
Δ k Δ t 0 Δ k E Δ k Δ t E Δ t E Δ t E Δ k ,
and that from (A9)
E Δ t E Δ k K τ κ n n k t ,
it results from (A13) that
Δ k E Δ k Δ t E Δ t = q k n 1 n k i = k + 1 n Z i 1 k i = 1 k Z i q t n 1 n t i = t + 1 n Z i 1 t i = 1 t Z i = q t n 1 t i = 1 t Z i q k n 1 k i = 1 k Z i + q k n 1 n k i = k + 1 n Z i q t n 1 n t i = t + 1 n Z i = F 1 ( k ) + F 2 ( k ) ,
where
F 1 ( k ) = q t n 1 t i = 1 t Z i q k n 1 k i = 1 k Z i ,
and
F 2 ( k ) = q k n 1 n k i = k + 1 n Z i q t n 1 n t i = t + 1 n Z i .
By (A24)–(A26), we can observe that
Δ k Δ t 0 F 1 ( k ) + F 2 ( k ) K τ κ n n k t F 1 ( k ) K τ κ n 2 n k t or F 2 ( k ) K τ κ n 2 n k t .
From above, we obtain
P 2 = P sup k E n k Δ k Δ t 0 P sup k E n k n k t F 1 ( k ) K τ κ n 2 + P sup k E n k n k t F 2 ( k ) K τ κ n 2 = P 2 , 1 + P 2 , 2 .
It is suffices to consider the case where k t and k E n k due to the symmetry. Specifically, we restrict the values of k such that n a k n τ K κ n 2 .
From (A27), F 1 ( k ) can be rewritten as follows:
F 1 ( k ) = q t n k t k t i = 1 t Z i + q t n q k n 1 k i = 1 k Z i + q t n 1 k i = k + 1 t Z i .
As q k / n = k / n 1 k / n , k = 1 , , n , one can easily verify that
q t n q k n C n t k , for some C 0 .
From Equations (A30) and (A31) and k n a , one obtains
F 1 ( k ) t k a n t i = 1 t Z i + C t k a n 2 i = 1 k Z i + 1 a n i = k + 1 t Z i .
According to the previous inequality and the fact that n a k n τ K κ n 2 , one obtains
n k t F 1 ( k ) 1 a n τ i = 1 n τ Z i + C a n i = 1 k Z i + 1 a n τ k i = k + 1 n τ Z i .
Inequality (A33) implies that
n k t F 1 ( k ) K τ κ n 2 1 a n τ i = 1 n τ Z i + C a n i = 1 k Z i + 1 a n τ k i = k + 1 n τ Z i K τ κ n 2 1 n τ i = 1 n τ Z i a K τ κ n 6 or 1 n i = 1 k Z i a C 1 K τ κ n 6 or 1 n τ k i = k + 1 n τ Z i a K τ κ n 6 .
Which implies that
P 2 , 1 = P sup k E n k n k t F 1 ( k ) K τ κ n 2 P 1 n τ i = 1 n τ Z i a K τ κ n 6 + P sup k E n k 1 n i = 1 k Z i a C 1 K τ κ n 6 + P sup n a k n τ K κ n 2 1 n τ k i = k + 1 n τ Z i a K τ κ n 6 = P 2 , 1 , 1 + P 2 , 1 , 2 + P 2 , 1 , 3 .
From Lemma A1, all the three terms P 2 , 1 , 1 , P 2 , 1 , 2 and P 2 , 1 , 3 tend to 0 for larger n and for some sufficiently large real number K > 0 . This implies that for larger values of n and for all ϵ > 0 , P 2 , 1 < ϵ / 8 and P 2 , 2 < ϵ / 8 . It easily follows from these that for larger values of n,
ϵ > 0 , P 2 , 1 < ϵ 8 and P 2 , 2 < ϵ 8 .
It follows from (A21), (A23), (A29) and (A35) that
ϵ > 0 , P sup k E n k Δ k Δ t < ϵ 2 .
Thus, for larger values of n and for some sufficiently large real number K > 0 , from (A20) and (A36), we can conclude that, for all ϵ > 0 , P τ ^ τ > K / n κ n 2 < ϵ , that is τ ^ τ = O P 1 / n κ n 2 , equivalently
t ^ t = O P 1 κ n 2 ,
which completes the proof of Theorem 3.    □

Appendix A.2.3

Proof of Theorem 4.
It suffices to use Proposition 1 and apply the functional Continuous Mapping Theorem (CMT). Let C max N , N be the subset of continuous functions in C N , N for which the functions reach their maximum at a unique point in N , N , equipped with the uniform metric. It creates no doubt that Proposition 1 implies that the process n Δ n 2 t + r κ n 2 Δ n 2 t converges weakly in C N , N to 2 σ w B ( r ) r / 2 . Now, from (17), we define
t ^ N : = arg max 1 t + r κ n 2 < n n Δ t + r κ n 2 2 Δ t 2 , N r N .
Since the Argmax functional is continuous on C max N , N , by the Continuous Mapping Theorem,
κ n 2 t ^ N t D arg max r 2 σ w B ( r ) 1 2 r .
Since b B ( r ) and B b 2 r have the same distribution for every b R , by the change of variable r = σ w 2 u , it is easy to show that
arg max r 2 σ w B ( r ) 1 2 r = arg max u σ w 2 B ( u ) 1 2 u ,
and it follows that
κ n 2 t ^ N t σ w 2 D arg max B ( u ) 1 2 u , u N σ w 2 , N σ w 2 .
Clearly, almost surely, there is a unique random variable S N , such that
B S N 1 2 S N : = sup B ( u ) 1 2 u , u N σ w 2 , N σ w 2 ,
and S N S a . s . , as N , where S is an almost surely unique random variable such that
B S 1 2 S : = sup u R B ( u ) 1 2 u .
Hence,
κ n 2 t ^ t σ w 2 D arg max u R B ( u ) 1 2 u ,
and the proof of Theorem 4 is completed.    □

Appendix A.3. Proof of Propositions

Proof of Proposition 1.
We just study the case where r is negative. The other case can be handled in the same way by symmetry. Let E n N be the set defined by
E n N : = k ; k = t + r κ n 2 for all N r 0 .
We have
n Δ k 2 Δ t 2 = 2 n Δ t Δ k Δ t + n Δ k Δ t 2 = 2 n Δ t E Δ t Δ k Δ t + n Δ k Δ t 2 + 2 n E Δ t Δ k Δ t .
We first show that the first two in the right-hand side of the above equality are negligible on E n N . As from (A14), n Δ t E Δ t is stochastically bounded, it is therefore sufficient to show that n Δ k Δ t is negligible over E n N . For this, we write
n Δ k Δ t n Δ k E Δ k Δ t + E Δ t + n E Δ k E Δ t = n F 1 ( k ) + F 2 ( k ) + n E Δ k E Δ t n F 1 ( k ) + n F 2 ( k ) + n E Δ k E Δ t ,
where F 1 ( k ) and F 2 ( k ) are defined by (A27) and (A28), respectively, and prove that each of the right-hand terms of the above last inequality converges uniformly to 0 on E n N . Notice that if k E n N then k t and there exists 0 < a < 1 2 such that k n a . Thus, the inequality (A32) holds and we have
n F 1 ( k ) n t k a n t i = 1 t Z i + C n t k a n 2 i = 1 k Z i + n a n i = k + 1 t Z i .
On the one hand, for k E n N , we can write
n t k a n t i = 1 t Z i N κ n 2 a t 1 n i = 1 t Z i N a n τ κ n 2 1 n i = 1 t Z i = 1 n κ n 2 O P ln n = o P ( 1 )
uniformly in k, where o P denotes a “little-o” of Landau in probability. This is due to (A4) and to the fact that as n , n κ n 2 / ln n because n 1 2 ζ κ n for some ζ 0 , 1 2 . In a similar way, we have
C n t k a n 2 i = 1 k Z i C N κ n 2 k a n n 1 k i = 1 k Z i C N a n κ n 2 1 k i = 1 k Z i = 1 n κ n 2 O P ln n = o P ( 1 )
uniformly in k. On the other hand, if k E n N , there exists b > 0 such that κ n b / t k . Consequently, we have
n a n i = k + 1 t Z i = 1 a κ n n κ n i = k + 1 t Z i b a κ n n 1 t k i = k + 1 t Z i = 1 κ n n O P ln n = o P ( 1 )
uniformly in k, and we have proved that n F 1 ( k ) = o P ( 1 ) uniformly on E n N . Based on the same reasoning and the same way, we can establish that n F 2 ( k ) = o P ( 1 ) uniformly on E n N .
From (A7), we have
0 E ( Δ t ) E ( Δ k ) = τ ( 1 τ ) κ n d ( 1 d ) 1 τ 1 d κ n = q t n κ n q k n n t n k κ n = q t n q k n κ n + q k n t k n k κ n .
From (A31), since k E n N , it is obvious that
n E ( Δ t ) E ( Δ k ) n C n t k κ n + n t k n k κ n = O P 1 κ n n = o P ( 1 )
uniformly in k. Thus, we have proved that n Δ k Δ t = o P ( 1 ) uniformly on E n N .
Now study the asymptotic behavior of 2 n E Δ t Δ k Δ t for k E n N . For this, we write
2 n E Δ t Δ k Δ t = 2 n τ ( 1 τ ) κ n Δ t + r κ n 2 Δ t = 2 τ ( 1 τ ) n κ n Δ t + r κ n 2 Δ t .
For the sake of simplicity, we assume that t + r κ n 2 and r κ n 2 are integers. Then, from (A26), we have
n κ n Δ t + r κ n 2 Δ t = n κ n Δ k Δ t = n κ n Δ k E Δ k Δ t E Δ t n κ n E Δ t E Δ k = n κ n F 1 ( k ) + F 2 ( k ) n κ n E Δ t E Δ k ,
where F 1 ( k ) is given by (A30). Using the same reasoning as the one which led to (A39), one can prove easily that the first two terms of (A30) multiplied by n κ n are negligible on E n N , and that
n κ n q t n 1 k i = k + 1 t Z i = q t n n k κ n i = t + r κ n 2 + 1 t Z i = q t n n k κ n j = 1 r κ n 2 Z j + t + r κ n 2 = q t n n k κ n j = 1 r κ n 2 Z j + t + r κ n 2 .
A functional central limit theorem (invariance principle) is applied to Z j + t + r κ n 2 (see, e.g., [49]). Thus, we have
κ n j = 1 r κ n 2 Z j + t + r κ n 2 d σ w B 1 r in C N , 0 ,
where B 1 · is a standard Wiener process defined on 0 , with B 1 0 = 0 . It is clear that if k E n N , then n / k converges to τ 1 and q t / n converges to q τ = τ 1 τ . Consequently,
n κ n F 1 t + r κ n 2 d τ 1 τ τ 1 σ w B 1 r in C N , 0 .
By the same reasoning, one can show that
n κ n F 2 t + r κ n 2 = o P ( 1 ) + q t n n n t κ n j = 1 r κ n 2 Z j + t + r κ n 2 ,
and that
n κ n F 1 t + r κ n 2 + F 2 t + r κ n 2 d σ w τ 1 τ B 1 r in C N , 0 .
From (A7) and (A8), we have
n κ n E Δ t E Δ k = n κ n τ ( 1 τ ) κ n d ( 1 d ) 1 τ 1 d κ n = n κ n 2 τ d 1 d τ 1 τ + d 1 d 1 .
Using the fact that for k = t + r κ n 2 and d = k / n converges to τ , we find n κ n 2 τ d = r and
n κ n E Δ t E Δ t + r κ n 2 r 2 τ 1 τ .
From (A40)–(A43), we conclude that
2 n E Δ t Δ t + r κ n 2 Δ t d 2 σ w B 1 ( r ) r 2 in C N , 0 .
From the previous result and (A37), we find that
n Δ n 2 t + r κ n 2 Δ n 2 t d 2 σ w B 1 ( r ) r 2 in C N , 0 ,
which writes again
P n ( r ) d 2 σ w B 1 ( r ) r 2 in C N , 0 .
By the same reasoning, one can prove that
P n ( r ) d 2 σ w B 2 ( r ) r 2 in C 0 , N ,
where B 2 · is a standard Wiener process defined on 0 , with B 2 0 = 0 .
Given that B 1 · and B 2 · are two independent standard Wiener processes defined on 0 , ,
P n ( r ) d 2 σ w B ( r ) r 2 in C N , N ,
where B . is a two-sided standard Wiener process. This completes the proof of Proposition 1.    □

References

  1. Hocking, T.D.; Schleiermacher, G.; Janoueix-Lerosey, I.; Boeva, V.; Cappo, J.; Delattre, O.; Bach, F.; Vert, J.P. Learning smoothing models of copy number profiles using breakpoint annotations. BMC Bioinform. 2013, 14, 164. [Google Scholar] [CrossRef] [PubMed]
  2. Liu, S.; Wright, A.; Hauskrecht, M. Change-point detection method for clinical decision support system rule monitoring. Artif. Intell. Med. 2018, 91, 49–56. [Google Scholar] [CrossRef]
  3. Lavielle, M.; Teyssiere, G. Adaptive detection of multiple change-points in asset price volatility. In Long Memory in Economics; Springer: Berlin/Heidelberg, Germany, 2007; pp. 129–156. [Google Scholar]
  4. Frick, K.; Munk, A.; Sieling, H. Multiscale change point inference. J. R. Stat. Soc. Ser. B (Stat. Methodol.) 2014, 76, 495–580. [Google Scholar] [CrossRef]
  5. Bai, J.; Perron, P. Estimating and Testing Linear Models with Multiple Structural Changes. Econometrica 1998, 66, 47–78. [Google Scholar] [CrossRef]
  6. Page, E.S. Continuous inspection schemes. Biometrika 1954, 41, 100–115. [Google Scholar] [CrossRef]
  7. Page, E. A test for a change in a parameter occurring at an unknown point. Biometrika 1955, 42, 523–527. [Google Scholar] [CrossRef]
  8. Pettitt, A.N. A non-parametric approach to the change-point problem. J. R. Stat. Soc. Ser. C (Appl. Stat.) 1979, 28, 126–135. [Google Scholar] [CrossRef]
  9. Lombard, F. Rank tests for changepoint problems. Biometrika 1987, 74, 615–624. [Google Scholar] [CrossRef]
  10. Scariano, S.M.; Watkins, T.A. Nonparametric point estimators for the change-point problem. Commun. Stat. Theory Methods 1988, 17, 3645–3675. [Google Scholar] [CrossRef]
  11. Bryden, E.; Carlson, J.B.; Craig, B. Some Monte Carlo Results on Nonparametric Changepoint Tests; Federal Reserve Bank of Cleveland: Cleveland, OH, USA, 1995. [Google Scholar]
  12. Bhattacharya, P.; Zhou, H. Nonparametric Stopping Rules for Detecting Small Changes in Location and Scale Families. In From Statistics to Mathematical Finance; Springer: Cham, Switzerland, 2017; pp. 251–271. [Google Scholar]
  13. Hinkley, D.V. Inference about the change-point in a sequence of random variables. Biometrika 1970, 57, 1–17. [Google Scholar] [CrossRef]
  14. Hinkley, D.V. Time-ordered classification. Biometrika 1972, 59, 509–523. [Google Scholar] [CrossRef]
  15. Yao, Y.C.; Davis, R.A. The asymptotic behavior of the likelihood ratio statistic for testing a shift in mean in a sequence of independent normal variates. Sankhyā Indian J. Stat. Ser. A 1986, 48, 339–353. [Google Scholar]
  16. Csörgö, M.; Horváth, L. Nonparametric tests for the changepoint problem. J. Stat. Plan. Inference 1987, 17, 1–9. [Google Scholar] [CrossRef]
  17. Chen, J.; Gupta, A. Change point analysis of a Gaussian model. Stat. Pap. 1999, 40, 323–333. [Google Scholar] [CrossRef]
  18. Horváth, L.; Steinebach, J. Testing for changes in the mean or variance of a stochastic process under weak invariance. J. Stat. Plan. Inference 2000, 91, 365–376. [Google Scholar] [CrossRef]
  19. Antoch, J.; Hušková, M. Permutation tests in change point analysis. Stat. Probab. Lett. 2001, 53, 37–46. [Google Scholar] [CrossRef]
  20. Hušková, M.; Meintanis, S.G. Change point analysis based on empirical characteristic functions. Metrika 2006, 63, 145–168. [Google Scholar] [CrossRef]
  21. Zou, C.; Liu, Y.; Qin, P.; Wang, Z. Empirical likelihood ratio test for the change-point problem. Stat. Probab. Lett. 2007, 77, 374–382. [Google Scholar] [CrossRef]
  22. Gombay, E. Change detection in autoregressive time series. J. Multivar. Anal. 2008, 99, 451–464. [Google Scholar] [CrossRef]
  23. Berkes, I.; Gombay, E.; Horváth, L. Testing for changes in the covariance structure of linear processes. J. Stat. Plan. Inference 2009, 139, 2044–2063. [Google Scholar] [CrossRef]
  24. Inclan, C.; Tiao, G.C. Use of cumulative sums of squares for retrospective detection of changes of variance. J. Am. Stat. Assoc. 1994, 89, 913–923. [Google Scholar]
  25. Fryzlewicz, P.; Subba Rao, S. Multiple-change-point detection for auto-regressive conditional heteroscedastic processes. J. R. Stat. Soc. Ser. B Stat. Methodol. 2014, 76, 903–924. [Google Scholar] [CrossRef]
  26. Härdle, W.; Tsybakov, A. Local polynomial estimators of the volatility function in nonparametric autoregression. J. Econom. 1997, 81, 223–242. [Google Scholar] [CrossRef]
  27. Härdle, W.; Tsybakov, A.; Yang, L. Nonparametric vector autoregression. J. Stat. Plan. Inference 1998, 68, 221–245. [Google Scholar] [CrossRef]
  28. Bardet, J.M.; Wintenberger, O. Asymptotic normality of the Quasi Maximum Likelihood Estimator for multidimensional causal processes. Ann. Stat. 2009, 37, 2730–2759. [Google Scholar] [CrossRef]
  29. Bardet, J.M.; Kengne, W.; Wintenberger, O. Multiple breaks detection in general causal time series using penalized quasi-likelihood. Electron. J. Stat. 2012, 6, 435–477. [Google Scholar] [CrossRef]
  30. Bardet, J.M.; Kengne, W. Monitoring procedure for parameter change in causal time series. J. Multivar. Anal. 2014, 125, 204–221. [Google Scholar] [CrossRef]
  31. Ngatchou-Wandji, J. Estimation in a class of nonlinear heteroscedastic time series models. Electron. J. Stat. 2008, 2, 40–62. [Google Scholar] [CrossRef]
  32. Bai, J. Least squares estimation of a shift in linear processes. J. Time Ser. Anal. 1994, 15, 453–472. [Google Scholar] [CrossRef]
  33. Hawkins, D.M. Testing a sequence of observations for a shift in location. J. Am. Stat. Assoc. 1977, 72, 180–186. [Google Scholar] [CrossRef]
  34. Csörgö, M.; Horváth, L. Limit Theorems in Change-Point Analysis; Wiley: Hoboken, NJ, USA, 1997. [Google Scholar]
  35. Joseph, N.W.; Echarif, E.; Harel, M. On change-points tests based on two-samples U-Statistics for weakly dependent observations. Stat. Pap. 2022, 63, 287–316. [Google Scholar]
  36. Antoch, J.; Hušková, M.; Veraverbeke, N. Change-point problem and bootstrap. J. Nonparametr. Stat. 1995, 5, 123–144. [Google Scholar] [CrossRef]
  37. Bhattacharya, P.K. Maximum likelihood estimation of a change-point in the distribution of independent random variables: General multiparameter case. J. Multivar. Anal. 1987, 23, 183–208. [Google Scholar] [CrossRef]
  38. Picard, D. Testing and estimating change-points in time series. Adv. Appl. Probab. 1985, 17, 841–867. [Google Scholar] [CrossRef]
  39. Yao, Y.C. Approximating the distribution of the maximum likelihood estimate of the change-point in a sequence of independent random variables. Ann. Stat. 1987, 15, 1321–1328. [Google Scholar] [CrossRef]
  40. Taniguchi, M.; Kakizawa, Y. Asymptotic theory of estimation and testing for stochastic processes. In Asymptotic Theory of Statistical Inference for Time Series; Springer: New York, NY, USA, 2000; pp. 51–165. [Google Scholar]
  41. Ngatchou-Wandji, J. Checking nonlinear heteroscedastic time series models. J. Stat. Plan. Inference 2005, 133, 33–68. [Google Scholar] [CrossRef]
  42. Fryzlewicz, P. Wild Binary Segmentation for multiple change-point detection. Ann. Stat. 2014, 42, 2243–2281. [Google Scholar] [CrossRef]
  43. Baranowski, R.; Chen, Y.; Fryzlewicz, P. not: Narrowest-over-Threshold Change-Point Detection, R package version 1; CRAN: Vienna, Austria, 2019. [Google Scholar]
  44. Kouamo, O.; Moulines, E.; Roueff, F. Testing for homogeneity of variance in the wavelet domain. Depend. Probab. Stat. 2010, 200, 175. [Google Scholar]
  45. Gan, S.; Qiu, D. On the Hájek-Rényi inequality. Wuhan Univ. J. Nat. Sci. 2007, 12, 971–974. [Google Scholar] [CrossRef]
  46. Billingsley, P. Convergence of Probability Measures; John Wiley: New York, NY, USA, 1968. [Google Scholar]
  47. Doukhan, P.; Portal, F. Principe d’invariance faible pour la fonction de répartition empirique dans un cadre multidimensionnel et mélangeant. Probab. Math. Stat. 1987, 8, 117–132. [Google Scholar]
  48. Wooldridge, J.M.; White, H. Some invariance principles and central limit theorems for dependent heterogeneous processes. Econom. Theory 1988, 4, 210–230. [Google Scholar] [CrossRef]
  49. Hall, P.; Heyde, C.C. Martingale Limit Theory and Its Application; Academic Press: Cambridge, MA, USA, 1980. [Google Scholar]
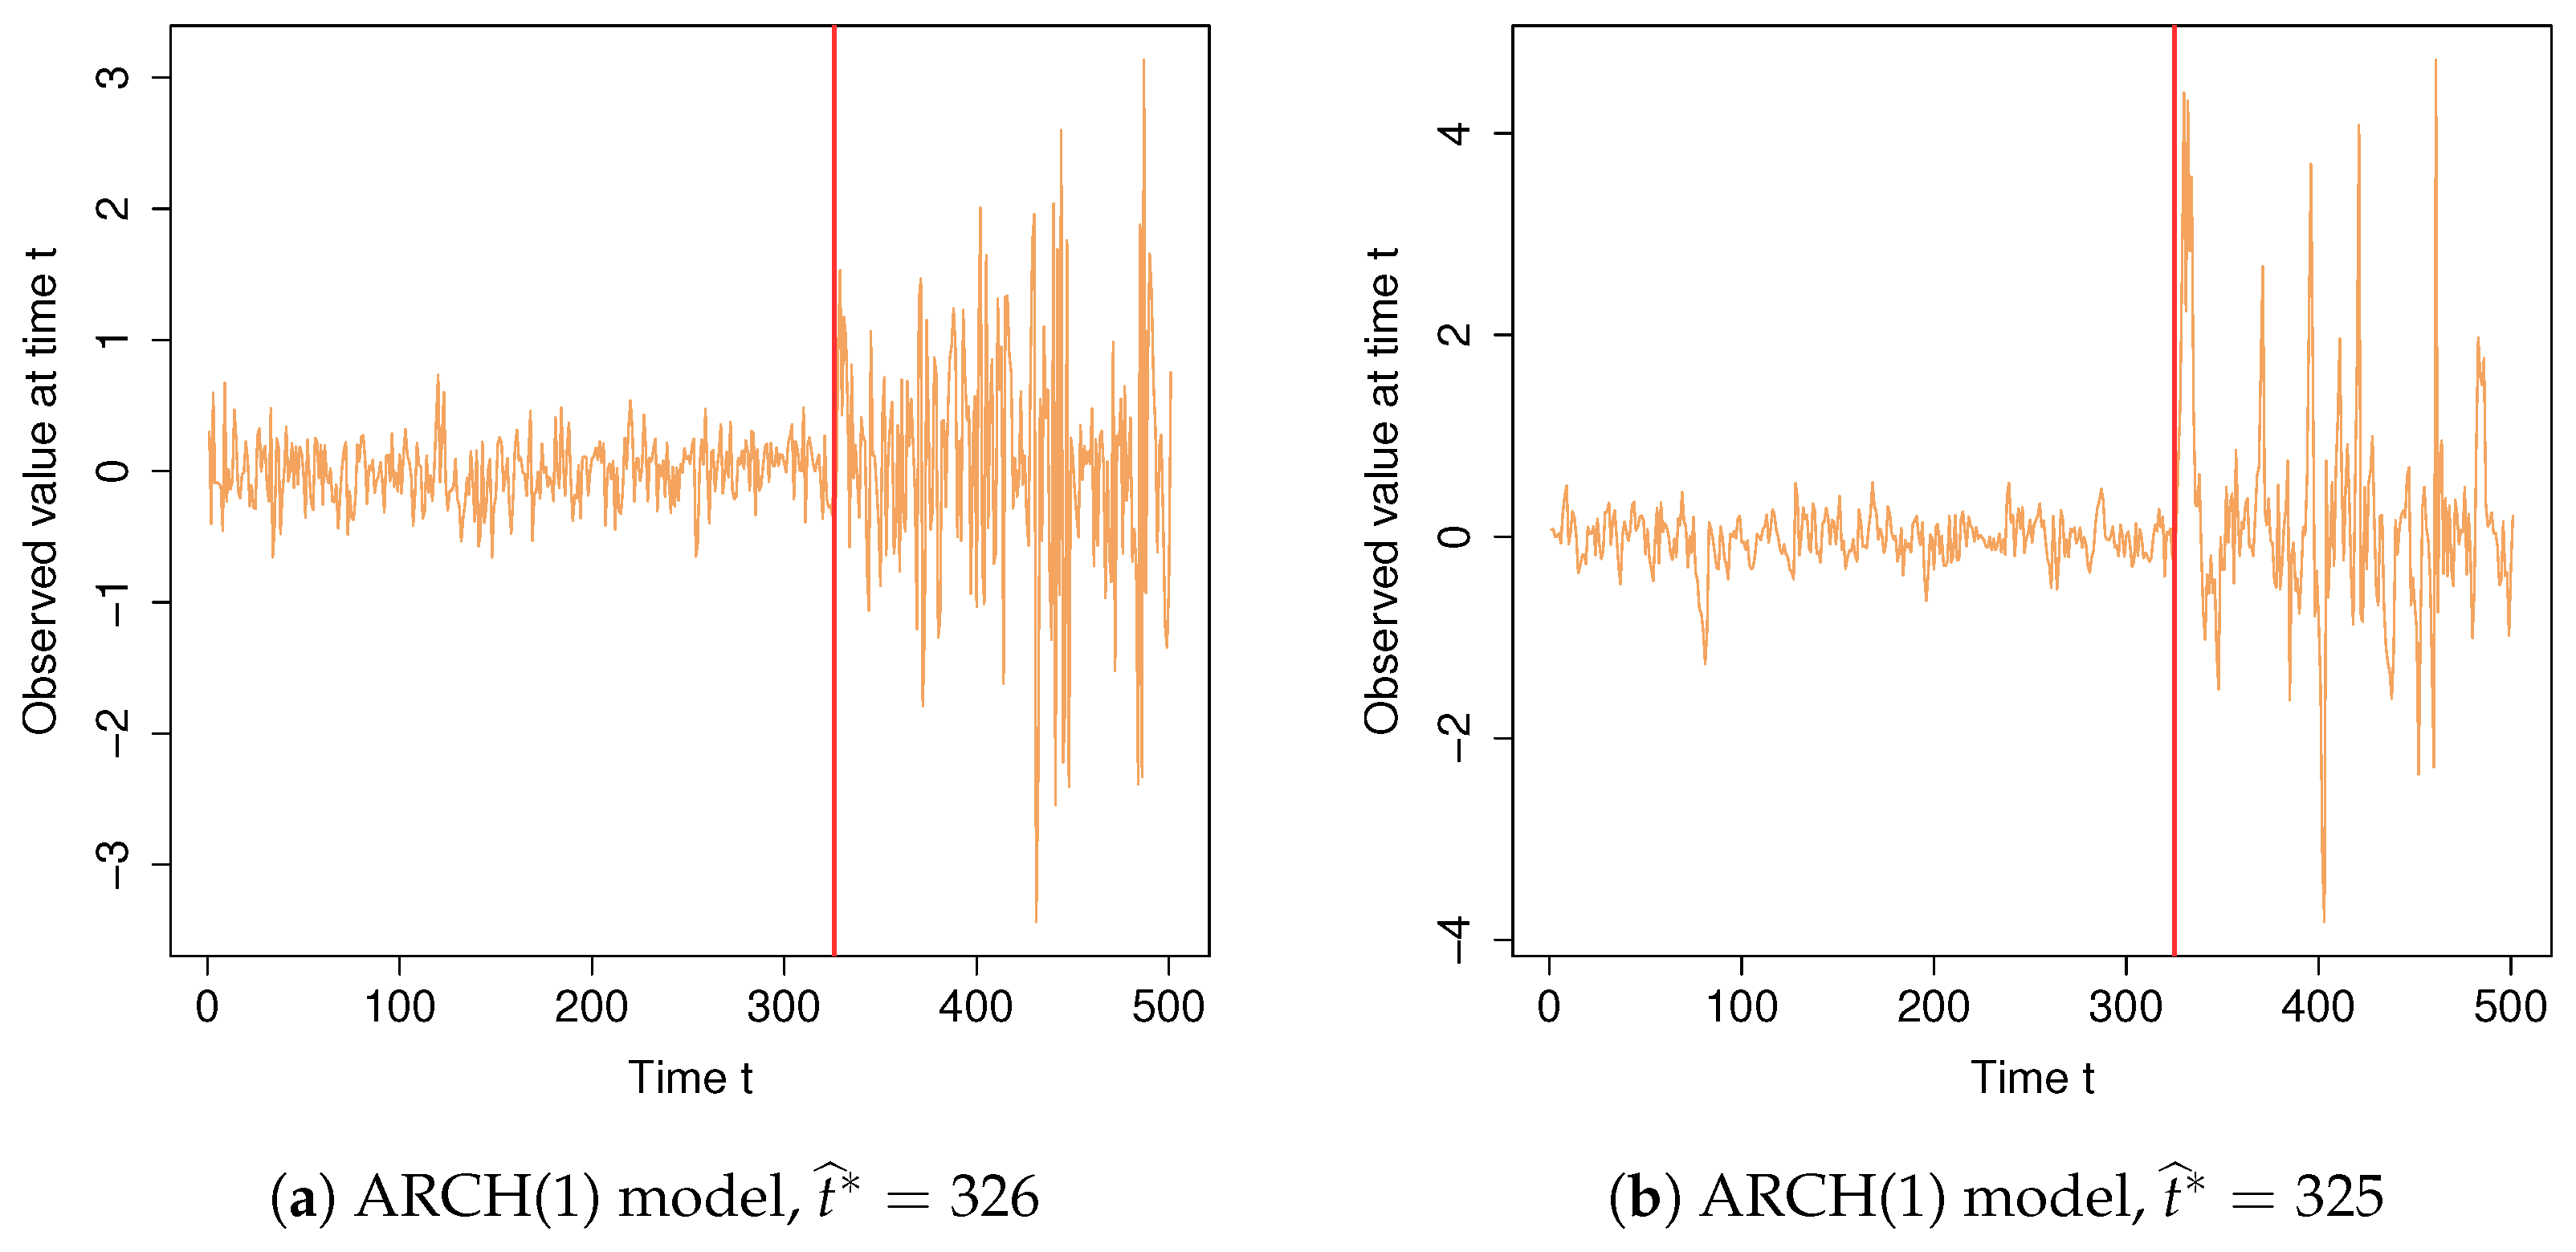
Figure 1. Estimation of change-point in volatility for 500 observations. (a) ARCH(1) model with change point at t ^ = 326 ; (b) ARCH(1) model with change point at t ^ = 325 ; (c) CHARN model with change point at t ^ = 326 ; (d) CHARN model with change point at t ^ = 326 .
Mathematics 11 04018 g001aMathematics 11 04018 g001b
Figure 2. Logarithmic series of S&P 500 stock prices from January 1992 to December 1999.
Mathematics 11 04018 g002
Figure 3. Location of the change point in the volatility of the logarithmic stock price return series of the SPX Index from January 1992 to December 1999.
Mathematics 11 04018 g003
Figure 4. Logarithmic series of Brent crude oil prices in (US dollars/barrel) from January 2021 to April 2023.
Mathematics 11 04018 g004
Figure 5. Location of change point in volatility of the logarithmic returns Brent oil series from January 2021 to April 2023.
Mathematics 11 04018 g005
Table 1. Change location estimation, its bias and SE for several values of ϕ , n and τ for iid ε t N ( 0 , 1 ) .
ϕn t = 0.25 n ( τ = 0.25 ) t = 0.5 n ( τ = 0.5 ) t = 0.75 n ( τ = 0.75 )
t ^ SE Bias t ^ SE Bias t ^ SE Bias
0.35001814.96670.11202773.42840.05403843.39930.0180
10002873.89610.03705222.49460.02207672.80240.0170
500012640.62700.002825160.62600.003237650.81720.0030
10,00025170.43980.001750150.41310.001575150.47010.0015
0.805001371.82860.02402580.96590.01603831.05140.0160
10002570.50790.00705070.66870.00707570.63780.0070
500012560.18740.001225060.17500.001237550.16020.0010
10,00025060.12300.000650060.13880.000675050.11690.0005
1.55001300.85380.01002540.47240.00803790.46110.0080
10002530.26620.00305040.28840.00407530.25620.0030
500012540.13440.000825030.10530.000637540.11740.0008
10,00025040.08800.000450040.08420.000475040.07530.0004
Table 2. Change location estimation, its bias and SE for several values of ϕ , n and τ for iid ε t N ( 0 , 1 ) and for ε t AR(1).
ϕn t = 0.25 n ( τ = 0.25 ) t = 0.75 n ( τ = 0.75 )
ε t N ( 0 , 1 ) ε t AR ( 1 ) ε t N ( 0 , 1 ) ε t AR ( 1 )
t ^ SE Bias t ^ SE Bias t ^ SE Bias t ^ SE Bias
0.3500012650.60910.003012862.62250.007237660.65960.003237761.22430.0052
10,00025160.44710.001625250.71360.002575150.41820.001575230.65630.0023
0.8500012560.17010.001212600.27600.002037560.18180.001237600.28700.0020
10,00025060.14820.000625100.19070.001075060.13380.000675090.18350.0009
1.5500012540.11650.000812560.18350.001237540.11540.000837560.17840.0012
10,00025030.08070.000325060.12840.000675040.07760.000475060.12630.0006
Table 3. Change location estimation, its bias and SE for several values of ϕ , n and τ for iid ε t N ( 0 , 1 ) .
ϕn t = 0.25 n ( τ = 0.25 ) t = 0.5 n ( τ = 0.5 ) t = 0.75 n ( τ = 0.75 )
t ^ SE Bias t ^ SE Bias t ^ SE Bias
0.35001824.99590.11402803.23960.06003873.04120.0180
10002984.35600.04805252.62780.02507702.33430.0200
500012671.79410.003425170.78520.003437670.79480.0034
10,00025170.47160.001750160.44540.001675130.42450.0013
0.85001392.09450.02802591.03860.01803840.90610.0180
10002591.17550.009005060.42050.00607570.54270.0070
500012560.17800.001225060.17130.001237570.21070.0014
10,00025060.13040.000650070.13750.000775060.12360.0006
1.55001351.80530.02002560.92480.01203820.72790.0140
10002550.32170.00505050.31380.00507550.46660.0050
500012540.14690.000825050.13780.001037540.13250.0008
10,00025050.10100.000550040.09120.000475040.09150.0004
Table 4. Statistical test powers for different ϕ values at different locations t = [ n τ ] .
τ n = 100 n = 200 n = 500 n = 1000
0.25 0.50 0.75 0.25 0.50 0.75 0.25 0.50 0.75 0.25 0.50 0.75
0 0.051 0.048 0.05 0.05
ϕ 0.030.1450.1470.1310.1210.1150.1090.0930.0890.0830.0710.0770.056
0.050.1500.1510.1500.1240.1200.1150.0980.0900.0850.0850.0840.060
0.080.1570.1770.1580.1470.1530.1310.1180.1000.0960.0900.0900.070
0.10.1910.1980.1770.1700.1740.1360.1450.1670.1010.1000.1100.098
0.30.2490.2960.2140.2710.3580.2480.4580.5300.3710.6850.7500.610
0.50.3440.4650.3150.4210.6090.4330.7650.8910.7800.9740.9980.992
0.70.4130.5610.4220.5910.8030.6160.9320.9780.9710.9950.9980.998
0.90.4770.7100.5320.7080.8870.7870.9710.9960.9930.9980.9990.999
1.10.5770.8060.6540.8080.9460.8970.9850.9980.9990.9991.0001.000
1.30.6340.8380.7210.8630.9640.9520.9900.9990.9991.0001.0001.000
1.50.6400.8600.8000.9070.9670.9670.9971.0001.0001.0001.0001.000
Table 5. Estimates of change location derived from LS, WBS, NOT and ICSS for a sample with a single break.
ϕ = 0.3 ϕ = 0.8 ϕ = 1.5
t = 0 . 25 n t = 0 . 75 n t = 0 . 25 n t = 0 . 75 n t = 0 . 25 n t = 0 . 75 n
Methods n t ^ t ^ t ^ t ^ t ^ t ^
LS100397031792878
WBS46∣4387∣9038∣3982∣8029∣3078∣76
NOT51∣559638∣4279∣82∣91∣9438∣3578∣82
ICSS42∣486831∣4378∣8133∣4178∣97
LS200571455415752155
WBS70∣66175∣17762∣59171∣16758∣57159∣158
NOT66∣70∣77175∣190∣19467∣70158∣16164∣68155∣162
ICSS66∣8780∣15961∣76∣8715959∣66∣170∣187156∣173
Table 6. Estimates of change location derived from LS, WBS, and ICSS for real data S&P 500 stock prices and Brent crude oil prices.
S&P 500 Stock PricesBrent Crude Oil Prices
Methods t ^ t ^
LS26 March 199725 February 2022
WBS12 May 199726 January 2022
ICSS22 December 1998 ∣ 26 January 199814 January 2022
20 April 1995 ∣ 14 November 1996
Disclaimer/Publisher’s Note: The statements, opinions and data contained in all publications are solely those of the individual author(s) and contributor(s) and not of MDPI and/or the editor(s). MDPI and/or the editor(s) disclaim responsibility for any injury to people or property resulting from any ideas, methods, instructions or products referred to in the content.