1. Introduction
In the contemporary business landscape, customer segmentation is a linchpin for companies aiming to comprehend and address their clientele’s multifaceted needs and preferences. Segmentation, a process of categorizing customers into distinct cohorts based on shared attributes such as demographics, behavioral tendencies, and purchase trajectories, paves the way for businesses to fine-tune their marketing endeavors, thereby bolstering customer satisfaction, allegiance, and retention [
1]. Such a nuanced understanding of customer segments translates to tailored marketing strategies, culminating in heightened customer satisfaction and augmented sales [
2]. To realize this, organizations harness many data sources, spanning demographic details, behavioral insights, and purchase histories, facilitating the discernment of patterns that delineate customer segments [
3,
4]. This segmentation subsequently guides bespoke marketing strategies, amplifying the efficacy of campaigns and propelling business growth [
5,
6].
Historically, customer segmentation has been anchored in statistical methodologies, including clustering, principal component analysis, and decision trees. Yet, these techniques occasionally falter in capturing the intricate nuances of customer behaviors and inclinations. This underscores the imperative for more refined and precise segmentation modalities. With its burgeoning applications in customer segmentation, machine learning has emerged as a potent tool in this domain [
7]. However, a notable limitation of traditional machine learning is its opacity, often challenging the interpretability of its outcomes [
8].
Recent advancements have spotlighted the potential of deep learning and explainable AI (XAI) in enhancing customer segmentation’s accuracy and transparency. With its proficiency in analyzing large datasets and XAI methods like Local Interpretable Model-Agnostic Explanations (Lime), deep learning provides a comprehensive answer [
9]. A preeminent XAI technique, Lime elucidates machine learning predictions with local and interpretable explanations. In contrast, deep learning continues to demonstrate exemplary performance across diverse tasks, including customer segmentation [
10,
11,
12].
In recent years, customer segmentation has emerged as a pivotal strategy for businesses to understand and cater to their clientele’s diverse preferences and behaviors. This process involves partitioning customers into groups based on shared characteristics, enabling targeted marketing efforts and personalized experiences. However, traditional customer segmentation methods often fail to capture the complex and nuanced patterns hidden within extensive datasets. In response to these challenges, the convergence of deep learning and explainable AI has paved the way for more accurate and interpretable customer segmentation methodologies.
The motivations driving the integration of deep learning and explainable AI in customer segmentation are rooted in the shortcomings of conventional techniques. Traditional methods, including RFM (Recency, Frequency, Monetary) analysis and clustering algorithms, often struggle to capture intricate relationships within data, leading to oversimplified representations and incomplete insights. This limitation becomes particularly pronounced as businesses navigate modern datasets with diverse dimensions and non-linear interactions. Deep learning, characterized by its ability to discern complex patterns in data, presents an opportunity to address these limitations and uncover meaningful customer segments.
DeepLimeSeg emerges as a response to two primary challenges faced by conventional approaches. First, there are issues with model trustworthiness and regulatory compliance due to deep learning models’ black-box nature, making them difficult to understand and explain. Second, firms have trouble properly tailoring their strategies to specific client groups because current methodologies cannot often deliver granular and meaningful insights. To solve these gaps, DeepLimeSeg combines the predictive ability of deep learning with the openness and interpretability of explainable AI.
DeepLimeSeg’s application of Lime-based Explainability is an interesting feature. Lime is an approach developed to make the predictions of sophisticated machine learning models more easily understood. When used in the context of DeepLimeSeg, Lime sheds light on the underlying decision-making process by explaining how individual features contribute to segmentation outcomes. This openness inspires trust in the models’ forecasts and equips companies with useful information, letting them improve their marketing and their customers’ experiences.
In this paper, we delve into the conceptual framework of DeepLimeSeg, elucidating its mathematical foundations and role in revolutionizing customer segmentation. By leveraging deep learning’s capacity to capture intricate patterns and Lime’s ability to render those patterns interpretable, DeepLimeSeg introduces a paradigm shift in how businesses approach customer segmentation, leading to enhanced accuracy, transparency, and strategic decision-making. The introduction of DeepLimeSeg is motivated by the observed challenges in traditional customer segmentation methodologies. With the increasing complexity of customer data and the need for actionable insights, there is a pressing demand for powerful and interpretable models. By synergizing deep learning with XAI, DeepLimeSeg offers a solution that addresses these challenges, providing depth and clarity in segmentation.
In response to the gaps mentioned above and the evolving landscape, this research introduces DeepLimeSeg, an avant-garde methodology for customer segmentation. This algorithm synergizes deep learning’s analytical capabilities with the transparency of XAI. By leveraging demographic data, behavioral patterns, and purchase histories, DeepLimeSeg delineates customers into distinct clusters, mirroring their unique preferences. The Lime-infused module elucidates the segmentation logic, enabling businesses to recalibrate their marketing strategies, optimize resource deployment, and enhance revenue streams. The validation and efficacy of DeepLimeSeg are demonstrated using two real-world datasets: Mall-Customer Segmentation Data and E-Commerce dataset. The key contributions of this paper are as follows:
- -
Mathematical DeepLimeSeg: Introduced a mathematical model for the DeepLimeSeg algorithm, blending deep learning and explainable AI for customer segmentation.
- -
Data Integration: Utilized demographics, behavioral patterns, and purchase history within DeepLimeSeg’s mathematical framework.
- -
Lime-based Explainability: Incorporated a mathematically detailed Lime module for clear segmentation explanations, enhancing marketing strategies.
- -
Validation and Comparison: Validated DeepLimeSeg using real-world datasets and compared it against the mathematically driven RFM analysis.
- -
Strategic Insights: Offered businesses a mathematically grounded approach for informed marketing and product decisions.
- -
Algorithmic Limitations: Discussed assumptions, overfitting, and underfitting, highlighting areas of improvement.
The organization of this paper is as follows:
Section 2 reviews the previous methods of customer segmentation.
Section 3 describes the methodology employed in this research.
Section 4 explores the mathematical model for DeepLimeSeg.
Section 5 presents the findings and compares the efficacy of the proposed algorithm with the already existing models.
Section 6 discusses the experimental results. Lastly,
Section 7 summarizes the key findings and concludes the paper.
2. Related Work
Several algorithms have been proposed for customer segmentation in recent years, including clustering-based, rule-based, and machine-learning-based methods. Clustering-based methodologies, including techniques like K-means and hierarchical clustering, are employed to group customers according to the similarity of their demographic, geographic, and behavioral attributes. Rule-based methods, such as decision trees and association rule mining, identify patterns and rules that explain customer behavior. Machine-learning-based methods, such as random forests and support vector machines, use predictive models to classify customers into different segments based on their attributes and behaviors [
6,
13]. In the context of mall-customer segmentation, several studies have used machine-learning-based methods to identify customer segments based on their spending patterns, demographics, and other attributes. For example, in a study by Singh and Pandey [
14], a K-means clustering algorithm was used to segment mall customers based on their spending habits.
However, one of the challenges of using machine-learning-based methods for customer segmentation is that the models are often difficult to interpret, making it challenging for marketers to understand the factors contributing to customer behavior. Explainable AI techniques like LIME can analyze machine learning models’ outputs by identifying the most important features in making predictions. The R programming language was used to apply a hierarchical agglomerative clustering (HAC) algorithm in machine learning (ML), as described in reference [
15]. This algorithm was applied to credit card datasets to segment customers and identify suitable marketing strategies. The authors of [
16] conducted a comparative analysis of various clustering algorithms and determined that the K-means clustering algorithm is the most effective solution. This study highlights the importance of choosing the appropriate clustering algorithm for a given dataset and problem. K-means clustering is a commonly used algorithm in unsupervised learning and is particularly useful for large datasets. It involves partitioning a dataset into k clusters based on the similarity of the data points. The algorithm iteratively assigns data points to the nearest cluster center and updates the center until convergence. Other clustering algorithms likely evaluated in the study include hierarchical, density-based, and spectral clustering. Each algorithm has its strengths and weaknesses, and the choice of algorithm will depend on the specific requirements of the problem at hand. Overall, the study’s findings in [
16] suggested that K-means clustering is a reliable and effective algorithm for clustering and should be considered when performing unsupervised learning tasks.
Although AI has been increasingly utilized in the financial industry, no complete system combines risk management and customer segmentation to handle and minimize potential financial risks. Consequently, an advanced and AI-based framework is necessary for managing and segmenting customers to recognize and reduce possible risks while creating personalized risk-management plans for different customer groups. There has been an increased interest in explainable AI in the last few years, but its use in unsupervised learning is still limited. This investigation aimed to amalgamate Explainability with clustering techniques, which inherently represent unsupervised methodologies. Customer segmentation is crucial in today’s competitive business environment, and clustering is the most widely used approach. However, interpreting cluster assignments can be challenging. To address this issue, the authors in [
17] implemented a decision-tree-based approach to improve the interpretability of cluster assignments for customer segmentation, which was applied to both small and large datasets.
Table 1 illustrates the most frequently employed models proposed for spending scores in the popular Mall-Customer Segmentation dataset, such as Linear Regression Models, Decision Tree Models, Random Forest Models, and Neural Networks (NN).
Considering the comparison above and additional insights, a Decision Tree or Random Forest model could be an apt choice for handling the dataset’s size and complexity. Both models possess the capability to capture complex relationships and manage categorical as well as continuous variables. Moreover, they offer relative ease of interpretation and can mitigate overfitting through proper tuning. Nevertheless, a Neural Network model may be deemed suitable if the data embody more intricate relationships. In the final analysis, the optimal model selection hinges upon the specific objectives of the investigation, the dataset’s size and complexity, and the computational resources at one’s disposal. The research gap can be summarized as follows:
- -
Feature Engineering: Existing studies often rely on basic features like demographics. A gap exists in leveraging advanced attributes, such as purchase history, for enhanced accuracy.
- -
Hyperparameter Exploration: Many models potentially use default or limited hyperparameters, missing out on optimal performance. Comprehensive exploration is needed.
- -
Model Interpretability: While many models prioritize accuracy, there is a gap in ensuring precision and clarity, especially in sectors like retail.
- -
Mathematical Rigor: A notable absence of in-depth mathematical content in segmentation methodologies needs addressing to align with rigorous academic standards.
This research endeavors to bridge the identified gaps by formulating and assessing a novel algorithm, DeepLimeSeg, which synergizes the predictive prowess of deep learning with the clarity of explainable AI (XAI). Our objectives encompass:
- -
Establishing a mathematically grounded customer segmentation methodology, integrating deep learning and XAI.
- -
DeepLimeSeg: Harnessing demographics, behavioral patterns, and purchase histories within a rigorous mathematical framework.
- -
Incorporating a Lime-based module to provide mathematically backed, interpretable segmentation results, fortifying targeted marketing strategies.
- -
Empirical validation of DeepLimeSeg using real-world datasets to underscore its efficacy.
- -
Facilitating data-driven, informed decisions in marketing and product development through the DeepLimeSeg approach.
3. DeepLimeSeg: Integrating Explainable AI with Deep Learning for Customer Segmentation
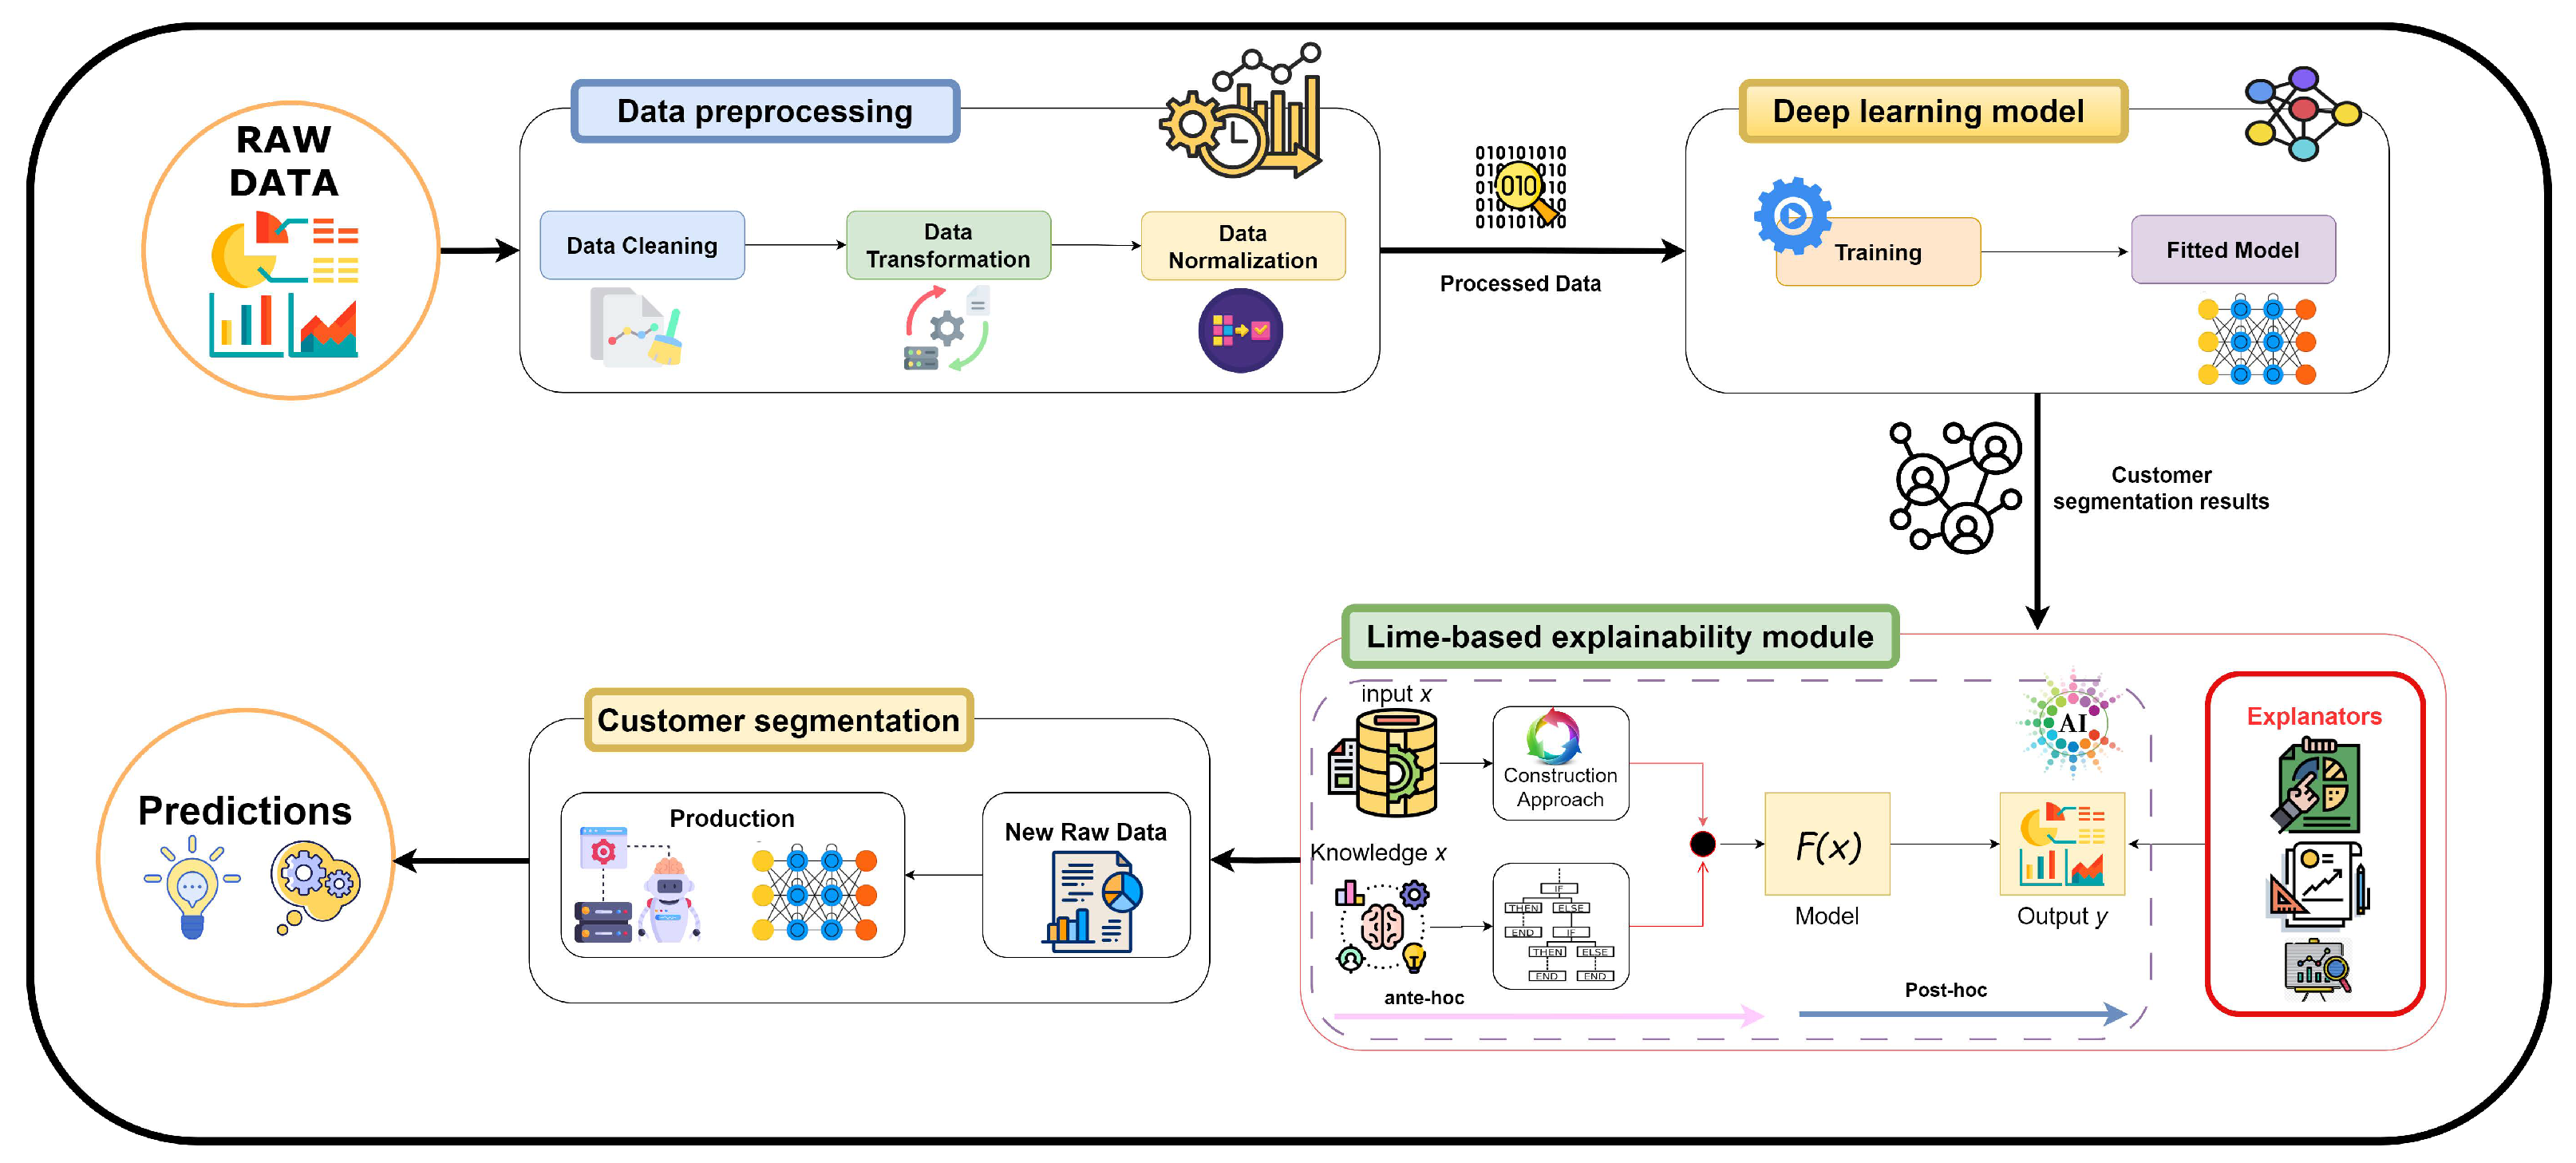
The proposed approach in this research paper is called DeepLimeSeg, which integrates explainable AI with deep learning for customer segmentation. The approach leverages demographic data, behavior patterns, and purchase history to segment customers into distinct groups based on their preferences and needs. The Lime-based Explainability module provides clear and understandable explanations for each customer’s segmentation. The main phases of the proposed DeepLimeSeg algorithm, as depicted in
Figure 1, are as follows:
- 1.
Data preprocessing: The first step is to preprocess the data, which involves cleaning, transforming, and encoding them to prepare them for analysis. This step includes removing missing values, transforming categorical variables into numerical ones, and normalizing the data.
- 2.
Deep learning model training: The next step is to train a deep learning model, such as a neural network, to learn patterns and relationships in the data. The deep learning model inputs the preprocessed data and outputs customer segmentation results.
- 3.
Lime-based Explainability module: The third step involves using the Lime-based Explainability module to provide clear and understandable explanations for each customer’s segmentation. Lime is a method for explaining the predictions of machine learning models. The Explainability module uses Lime to identify the features that contributed the most to each customer’s segmentation, providing businesses with insights into their customers’ preferences and needs.
- 4.
Customer segmentation: The final step is to segment customers into distinct groups based on their preferences and needs. The deep learning model and Explainability module work together to provide accurate and understandable customer segmentation results.
The DeepLimeSeg algorithm can be formulated as an optimization problem that seeks to maximize the accuracy of customer segmentation while ensuring clear and understandable explanations. Let
D be the dataset consisting of customer features
X and corresponding segmentation labels
y, where
X is a matrix of shape
, with
n samples and
m features. The objective function
can be defined as:
where
represents the parameters of the deep learning model, accuracy (
) measures the accuracy of customer segmentation achieved by the model, and Explainability(
) quantifies the quality of explanations generated by the Lime-based Explainability module. The trade-off parameter
balances the importance of accuracy and Explainability.
The neural network architecture used in DeepLimeSeg consists of multiple layers with activation functions, loss functions, and backpropagation equations. Let us denote the input to the network as
and the corresponding predicted segmentation as
. The activation function
A for each neuron can be defined as in Equation (
2).The loss function
L measures the discrepancy between the predicted segmentation and the actual labels, as in Equation (
3). The gradients for each layer’s parameters
can be computed using the chain rule, as in Equation (
4).
3.1. Data Preprocessing
The data preprocessing phase involves three main steps, as illustrated in Algorithm 1, to prepare the data for analysis. The main steps of the data processing phase are as follows: (i) Data cleaning: This step involves identifying and removing or correcting any errors, inconsistencies, or missing values in the data. This is important to ensure the quality and accuracy of the data. (ii) Data transformation: This step involves transforming the data to make them suitable for analysis. For example, this may involve converting categorical variables into numerical ones, such as using one-hot or label encoding. (iii) Data normalization: This step involves scaling the data to ensure all features have a similar range and distribution. This is important to avoid features with larger values dominating the analysis.
3.2. Deep Learning Model Training
The deep learning model training phase involves five main steps, as illustrated in Algorithm 2, to prepare the data for analysis. The main steps of the deep learning model training phase are: (i) Split the preprocessed data into training, validation, and test sets. (ii) Define the neural network’s architecture, including the number of layers, neurons, and activation functions. (iii) Compile the neural network by specifying the loss function, optimizer, and metrics to use during training. (iv) Train the neural network on the training data, using the validation data to monitor the model’s performance and prevent overfitting. Finally, (v) evaluate the trained model on the test data to assess its performance and generalization ability.
| Algorithm 1: Data Preprocessing Algorithm |
Input: Raw data Output: Preprocessed data // Identify missing values as follows: - 1
Check for missing values in the data.
- 2
Decide on a strategy for dealing with missing values.
// Transform categorical variables: - 3
If the dataset contains categorical variables, transform them into numerical ones.
- 4
Use one-hot encoding, label encoding, or binary encoding.
// Normalize the data: - 5
If the dataset contains variables with different scales or ranges, normalize the data.
- 6
Use techniques such as min-max scaling or z-score normalization.
// Carry out the Feature selection: - 7
Identify the most important variables in the dataset.
- 8
Use techniques such as correlation analysis, PCA, or mutual information.
// Split the data: - 9
Split the data into training and test sets.
- 10
Use the training set to train the machine learning model.
- 11
Use the test set to evaluate the performance of the model.
// Return the preprocessed data: - 12
Return Preprocessed data x, customer segmentation labels y
|
| Algorithm 2: Data Preprocessing Algorithm |
Input: Preprocessed data X and corresponding customer segmentation labels y Output: Trained neural network. // Define the architecture of the neural network as follows: - 1
Use various techniques, such as manually designing the layers or using pre-trained models. - 2
The architecture should be chosen based on the type of data and the problem being solved. - 3
model = define_neural_network_architecture()
// Split the preprocessed data into training and validation sets: - 4
ensures that the model does not overfit the training data. - 5
A common split is 80% for training and 20% for validation.
- 6
, , ,
// Train the neural network: - 7
Use the training set to fit the model to the data. - 8
Set the appropriate hyperparameters, such as the learning rate and the number of epochs. - 9
Specify the loss function and optimizer. - 10
history = train_neural_network(model, , , , ) // Evaluate the performance of the neural network: - 11
, = evaluate_neural_network(model, , ).
// Save the trained neural network for future use: - 12
save_neural_network(model). - 13
|
Table 2 lists the hyperparameter parameters for deep learning model training. A multi-layer feedforward neural network, often used and effective for various tasks, was selected as the model’s design. The activation function used is the Rectified Linear Activation (ReLU) function, which is renowned for successfully allowing the model to understand intricate correlations within the data. Gradient-based optimization using the Adam optimizer accelerates the convergence of the model. A batch size of 64 is utilized to update the model weights during each iteration, and a learning rate of 0.001 is chosen to regulate the step size during optimization.
The training phase lasts 50 epochs to ensure model generalization and reduce overfitting. The model architecture consists of three hidden layers with 128, 64, and 32 neurons each. A dropout rate 0.2 is introduced to the hidden layers to increase model resilience and prevent neuronal co-adaptation.
Regarding data partitioning, subsets of the dataset are created to make training, validating, and testing easier. In particular, the model can learn from a sizable dataset because the training set includes 70% of the preprocessed data. The 15% of the data in the validation set are used to adjust the hyperparameters and guard against overfitting. Lastly, the remaining 15% of the data comprise the test set, which acts as an impartial evaluation benchmark to rate the model’s effectiveness on hypothetical samples. This methodical partitioning ensures that the model’s generalization potential and prediction abilities are adequately evaluated while preventing data leaks and skewed assessments.
3.3. Lime-Based Explainability Module
The Lime-based Explainability phase involves five main steps, as illustrated in Algorithm 3, to prepare the data for analysis. The main steps of the Lime-based Explainability phase are: (i) Prepare the Lime explainer object. (ii) Choose a customer to explain and generate explanations for their segmentation. (iii) Visualize the explanation to understand the features that contributed the most to the customer’s segmentation. (iv) Repeat steps 2–3 for other customers to gain insights into their preferences and needs. Finally, (v) use the insights gained from the Lime-based Explainability module to inform targeted marketing strategies and product development. The Lime-based Explainability Algorithm (Mathematical Notation) is illustrated in Algorithm 4.
The Lime-based Explainability module is a crucial component of DeepLimeSeg, enhancing not only the transparency of the segmentation process but also the accuracy of the results and their alignment with human intuition. This module plays a pivotal role in shedding light on how the model’s predictions are influenced by specific features, thus offering insights into the segmentation outcomes.
Specific Aspects of Interpretability: Through the Lime-based module, DeepLimeSeg provides detailed insights into the contribution of individual features to the segmentation process. This means that for each customer segment, the model identifies which features had the most significant influence in assigning customers to that segment. For instance, in a retail context, the module might reveal that factors such as recent purchase activity, frequency of transactions, and spending amount played a substantial role in segmenting customers into “High-Value Shoppers”.
Alignment with Human Intuition: The Lime-based Explainability module ensures that the segmentation results align with human intuition by making the model’s decision-making process comprehensible. The module provides a clear and interpretable rationale behind each prediction by highlighting the specific features that led to a customer being assigned to a certain segment. This alignment is particularly valuable when segmentation outcomes, such as targeted marketing campaigns, guide strategic decisions. Business stakeholders can trust and validate the results when they can understand why certain customers were grouped based on identifiable patterns.
Moreover, the explainability offered by the Lime-based module helps identify potential discrepancies between the model’s predictions and domain expertise. If the model assigns a customer to a segment that contradicts human intuition, this discrepancy can be investigated and addressed by refining the model or reevaluating the segmentation criteria.
| Algorithm 3: Lime-based Explainability Algorithm |
Input: Preprocessed data X and corresponding customer segmentation labels y Output: Trained neural network. // Prepare the Lime explainer object: - 1
explainer = lime.lime_tabular.LimeTabularExplainer(training_data, mode=’classification’, feature_names=feature_names, class_names=class_names, discretize_continuous=True)
// Choose a customer to explain and generate explanations for their segmentation: - 2
customer = choose_customer(). - 3
explanation = generate_explanation(customer, explainer, model). - 4
def generate_explanation(customer, explainer, model): - 5
Generate an explanation for the given customer’s segmentation using the Lime explainer object. - 6
customer_features = extract_features(customer) - 7
explanation = explainer.explain_instance(customer_features, model.predict_proba, num_features=5) - 8
return explanation.
// Visualize the explanation to understand the features that contributed the most to the customer’s segmentation: - 9
def visualize_explanation(explanation): - 10
Visualize the explanation using a bar chart to show the contribution of each feature to the customer’s segmentation.. - 11
fig = explanation.as_pyplot_figure(). - 12
plt.show(fig).
// Repeat steps 2–12 for other customers to gain insights into their preferences and needs: - 13
For customer in customers: - 14
explanation = generate_explanation(customer, explainer, model). - 15
visualize_explanation(explanation). - 16
Use the insights gained from the Lime-based explainability module to inform targeted marketing strategies and product development.
|
3.4. Customer Segmentation
The Customer segmentation phase involves three main steps, as illustrated in Algorithm 5, to prepare the data for analysis. The main steps of the Customer segmentation phase are: (i) Use the trained deep learning model to predict customer segments for new or unseen data. (ii) Use the Lime-based Explainability module to generate clear and understandable explanations for each customer’s segmentation. Finally, (iii) use the customer segments and their corresponding explanations to inform marketing strategies and product development.
| Algorithm 4: Lime-based Explainability Algorithm (Mathematical Notation) |
Input: Preprocessed data matrix X ∈× m, trained neural network model f with parameters . Output: Lime explainer object E, explanations for customer segmentation explanations. // Prepare Lime Explainer: - 1
Initialize explainer E with X, mode=’classification’, feature_names, and class_names.
// Choose a Customer to Explain: - 2
Select a customer’s data from X (e.g., =)
// Generate Explanations: - 3
Extract customer features from . - 4
Use explainer E to explain_instance(,f,num_features) to obtain explanation . // Visualize Explanation: - 5
Visualize as a bar chart or suitable visualization.
// Repeat for Other Customers: - 6
For Customers in 1 to n: - 7
Apply steps 2–5 for each customer to obtain corresponding explanation
// Utilize Explanations: - 8
Use explanations to inform targeted marketing strategies and product development.
|
| Algorithm 5: Customer Segmentation Algorithm |
Input: Trained deep learning model. Output: Predictions // Use the trained deep learning model to predict customer segments for new or unseen data: - 1
predicted_segments = model.predict(X_new_data)
// Use the Lime-based explainability module to generate clear and understandable explanations for each customer’s segmentation: - 2
explanations = explain_model_segments(model, X_new_data, predicted_segments) - 3
def explain_model_segments(model, X_new_data, predicted_segments): - 4
Generate explanations for each customer’s segmentation using the Lime-based explainability module. explainer = LimeTabularExplainer(X_new_data, mode=’classification’) - 5
explanations = [] - 6
for i in range(len(X_new_data)): - 7
explanation = explainer.explain_instance(X_new_data[i], model.predict_proba, num_features=10, labels=predicted_segments[i]) - 8
explanations.append(explanation.as_list()) - 9
return explanations
// Use the customer segments and their corresponding explanations to inform marketing strategies and product development: - 10
for i in range(len(predicted_segments)): - 11
segment = predicted_segments[i] - 12
explanation = explanations[i]
// Utilize segment and explanation: - 13
Use segment and explanation to inform marketing strategies and product development
|
4. Mathematical Model for DeepLimeSeg
A core component of this research is the intricate mathematical foundation of DeepLimeSeg. To ensure clarity and reproducibility, we have expanded on the following aspects: We begin by defining the mathematical equations that govern the deep learning component of DeepLimeSeg. This includes the neural network’s architecture, the activation functions used, and the loss function optimized during training. The Lime-based Explainability is integrated using a specific mathematical approach. The Lime assigns weights to features and how these weights are used to interpret the deep learning model’s predictions. The optimization techniques employed to train the deep learning model are elaborated upon. This includes the specific optimization algorithm used, its parameters, and the rationale behind its selection. The mathematical criteria are used to validate the model’s predictions. This encompasses the metrics used and their significance in customer segmentation. The Lime-based Explainability module’s mathematical workings are detailed, explaining how it derives feature importance scores and how these scores provide interpretability to the model’s predictions. In light of the valuable input received, we have further elaborated on the mathematical framework that forms the basis of the DeepLimeSeg method, intending to enhance its clarity, depth, and replicability.
4.1. Formulation of the Deep Learning Component
The deep learning component of the DeepLimeSeg is governed by a set of equations representing the neural network’s architecture. Let
represent the neural network, where
x is the input and
denotes the network parameters. The activation function and their respective mathematical representations are shown in Equation (
5), ensuring clarity in the network’s operations.
where
represents the activation function,
W is the weight matrix, and
b is the bias.
4.2. Integration with Lime
The Lime-based Explainability is mathematically integrated using a weighting mechanism. Given a prediction
, Lime assigns weights
to features
based on their contribution to the predictions. Equation (
6) provides a quantifiable measure of feature importance, aiding in model interpretability.
4.3. Optimization Techniques
The optimization of the deep learning model is achieved using Equation (
7), which describes the calculation of the loss function
L.
where
N is the number of data points,
is the actual value, and
is the predicted value. The specific optimization algorithm employed and its parameters are elaborated upon in the subsequent sections.
4.4. Validation Metrics
To validate the model’s predictions, metrics such as Mean Squared Error (MSE), Mean Absolute Error (MAE), and
are evaluated in Equations (
8)–(
10).
where
is the mean of the actual values.
4.5. Interpretability through Lime
The Lime-based Explainability module derives feature importance scores using a perturbation technique. The scores are mathematically represented in Equation (
11).
where
represents the input without feature
.
5. Implementation and Evaluation
This section presents an overview of the datasets employed, the performance metrics utilized, and our study’s methodology adopted for performance evaluation.
5.1. Software
The software employed in this study includes the Python programming language (Version: Python 3.8.5), the LIME library (Version: LIME 0.2.0.1) for explainable artificial intelligence, the Pandas library (Version: Pandas 1.2.3) for data manipulation and analysis, and the Scikit-learn library (Version: Scikit-learn 0.24.2) for machine learning models and evaluation metrics. Python was chosen as the programming language due to its flexibility, ease of use, and availability of various libraries for machine learning and data analysis. LIME was used to provide interpretability to the machine learning models used in the study, enabling researchers to understand how the models make predictions.
5.2. Mall-Customer Segmentation Data
Mall-Customer Segmentation Data [
18] is a dataset that contains information about mall customers. It includes five features depicted in
Table 3.
The dataset contains 200 rows, each corresponding to a unique customer. The dataset is used for customer segmentation tasks, where the goal is to group customers based on their characteristics, preferences, and spending habits. The dataset is widely used in machine learning and data mining research as a benchmark for clustering and segmentation algorithms. A sample of the Mall-Customer Segmentation Dataset is shown in
Table 4.
5.3. Performance Metrics
To evaluate the performance of the proposed algorithm for predicting the spending score, we use three common regression metrics: Mean Squared Error (MSE), Mean Absolute Error (MAE), and R-squared.
MSE measures the average squared difference between the predicted and actual spending scores. MSE can be calculated as in Equation (
12). The MAE measures the average absolute difference between the predicted and actual spending scores. MAE can be calculated as in Equation (
13). The R-squared is a statistical measure representing the proportion of variance in the dependent variable explained by the independent variables. R-squared can be calculated as in Equation (
14).
where
n is the number of samples,
is the predicted spending score, and
is the actual Spending Score.
While various evaluation metrics are available, we chose Mean Squared Error (MSE), Mean Absolute Error (MAE), and R-squared () for several compelling reasons. MSE quantifies the average squared difference between predicted and actual values. In the context of customer segmentation, a lower MSE signifies that DeepLimeSeg’s predictions closely align with the true customer segments based on spending scores. Lower MSE values indicate higher accuracy in segmenting customers, which is crucial for targeted marketing efforts and resource allocation. A lower MSE suggests that the model’s predictions are more precise and less dispersed.
MAE calculates the average absolute difference between predicted and actual values. MAE is robust to outliers and measures the average prediction error. In the context of customer segmentation, MAE offers insights into the magnitude of errors in the model’s predictions. Smaller MAE values imply that DeepLimeSeg’s predictions are closer to the true segments, signifying higher accuracy and improved decision-making capabilities.
measures the proportion of variance in the target variable (spending scores, in our case) explained by the model. In customer segmentation, a higher indicates that DeepLimeSeg effectively captures the variability in spending scores among different customer segments. A higher value signifies the model’s capacity to explain and predict spending scores, demonstrating its predictive power and ability to uncover underlying patterns.
These metrics, MSE, MAE, and , are well-suited for customer segmentation tasks as they provide a holistic view of how well the model captures intricate patterns within the data:
Accuracy: MSE and MAE directly measure the accuracy of the segmentation by quantifying the errors between predicted and actual spending scores. Lower values indicate higher accuracy, which is essential for crafting precise marketing strategies.
Explainability: reflects the model’s ability to explain the variance in spending scores. A higher suggests that DeepLimeSeg offers insights into why customers belong to specific segments based on their spending behavior, aligning with our approach’s transparency and interpretability goals.
While these metrics were selected as primary evaluation measures due to their relevance to segmentation tasks, other metrics like silhouette score, Davies–Bouldin index, and within-cluster sum of squares (WCSS) used in clustering could also be valuable. However, they are typically suited for assessing cluster quality rather than predictive accuracy and do not provide as direct a reflection of the model’s segmentation performance in terms of customer spending scores.
5.4. Performance Evaluation
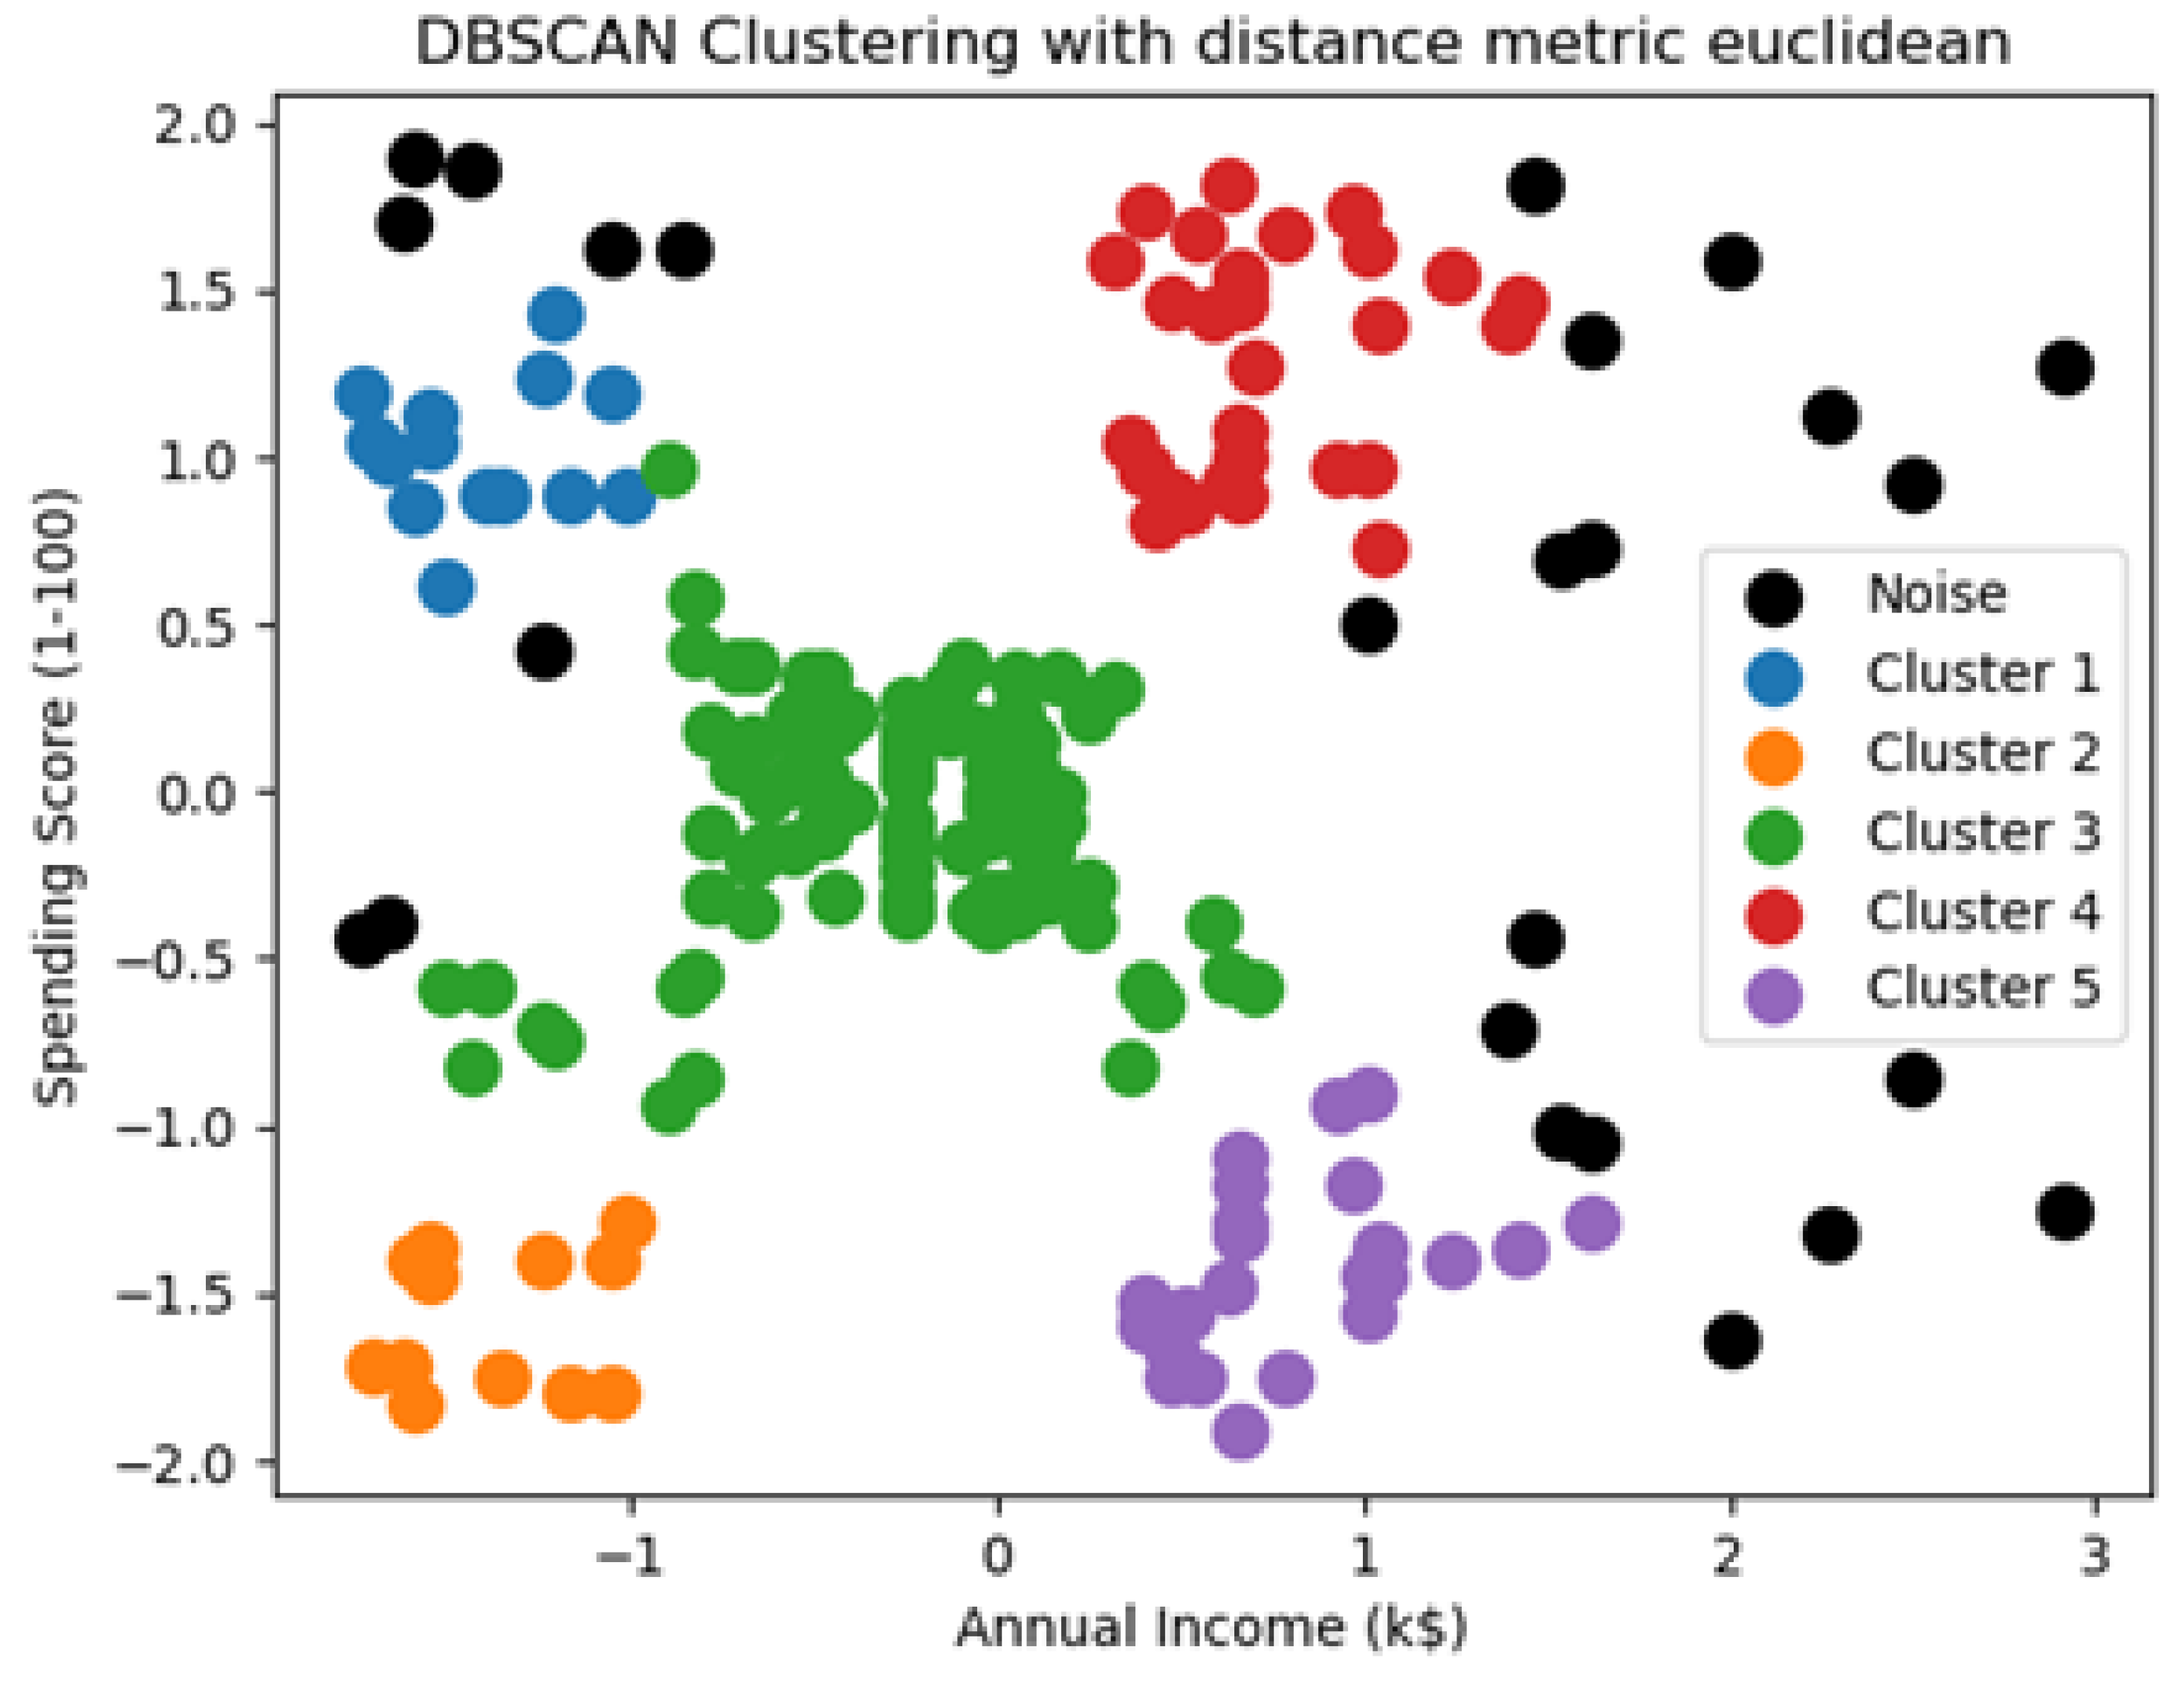
Figure 2 illustrates the visualization of all clusters.
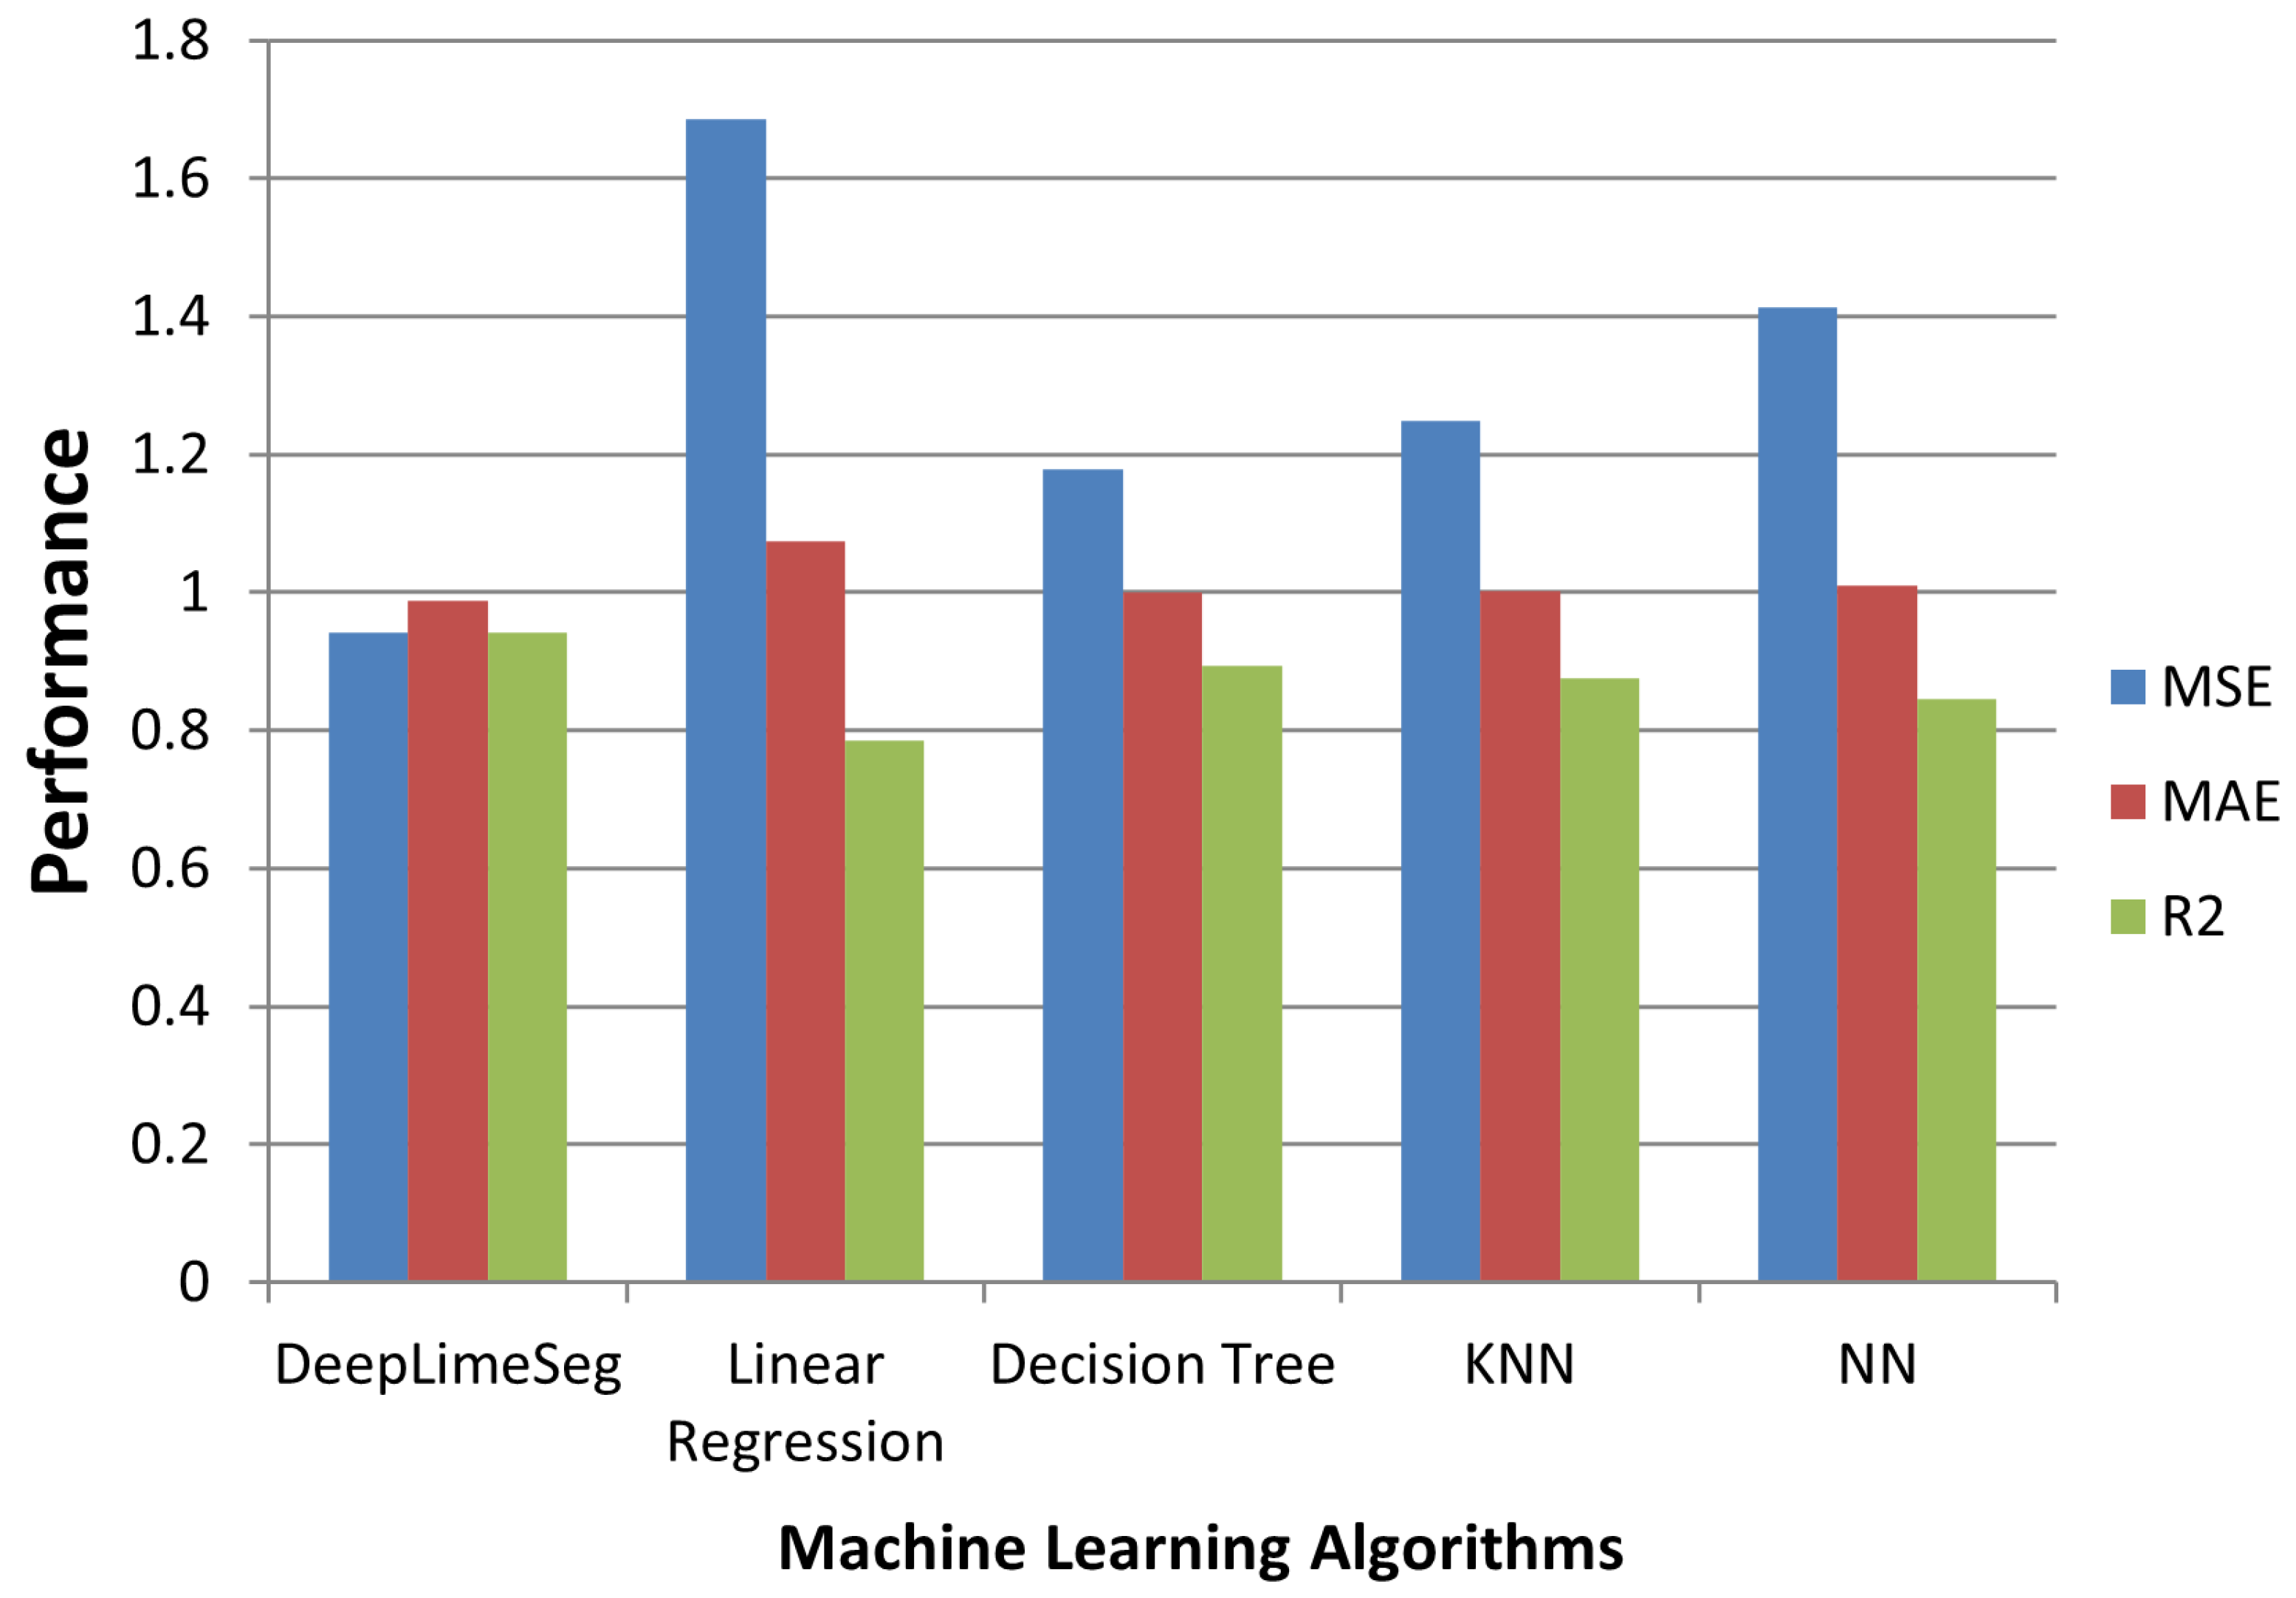
Table 5 and
Figure 3 compare the results of the proposed DeepLimeSeg and the previous models.
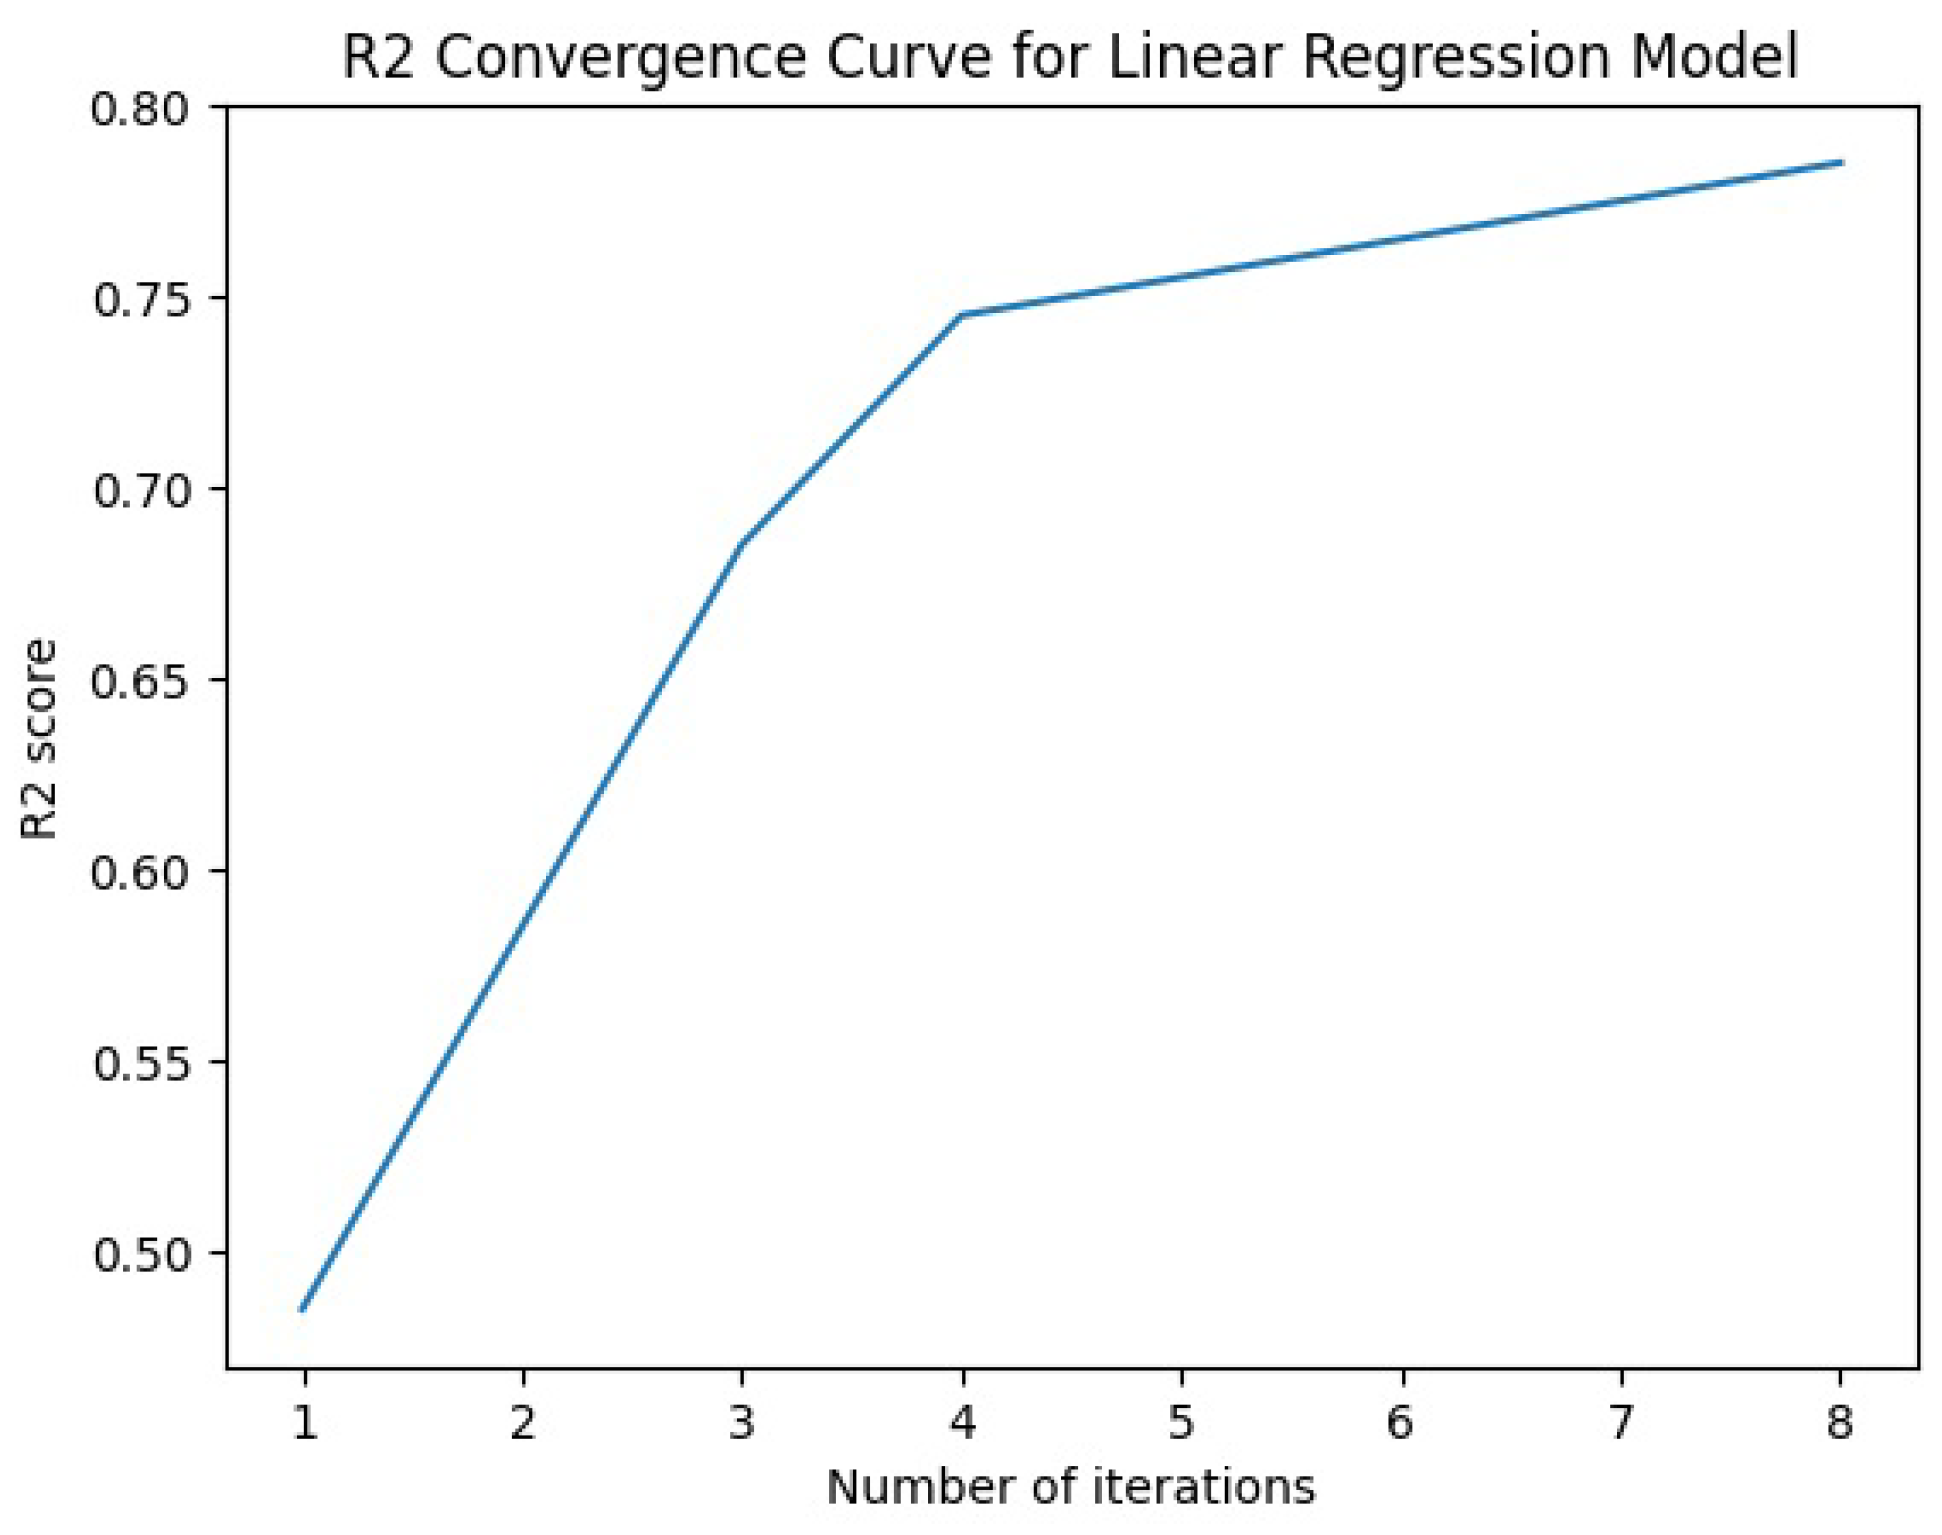
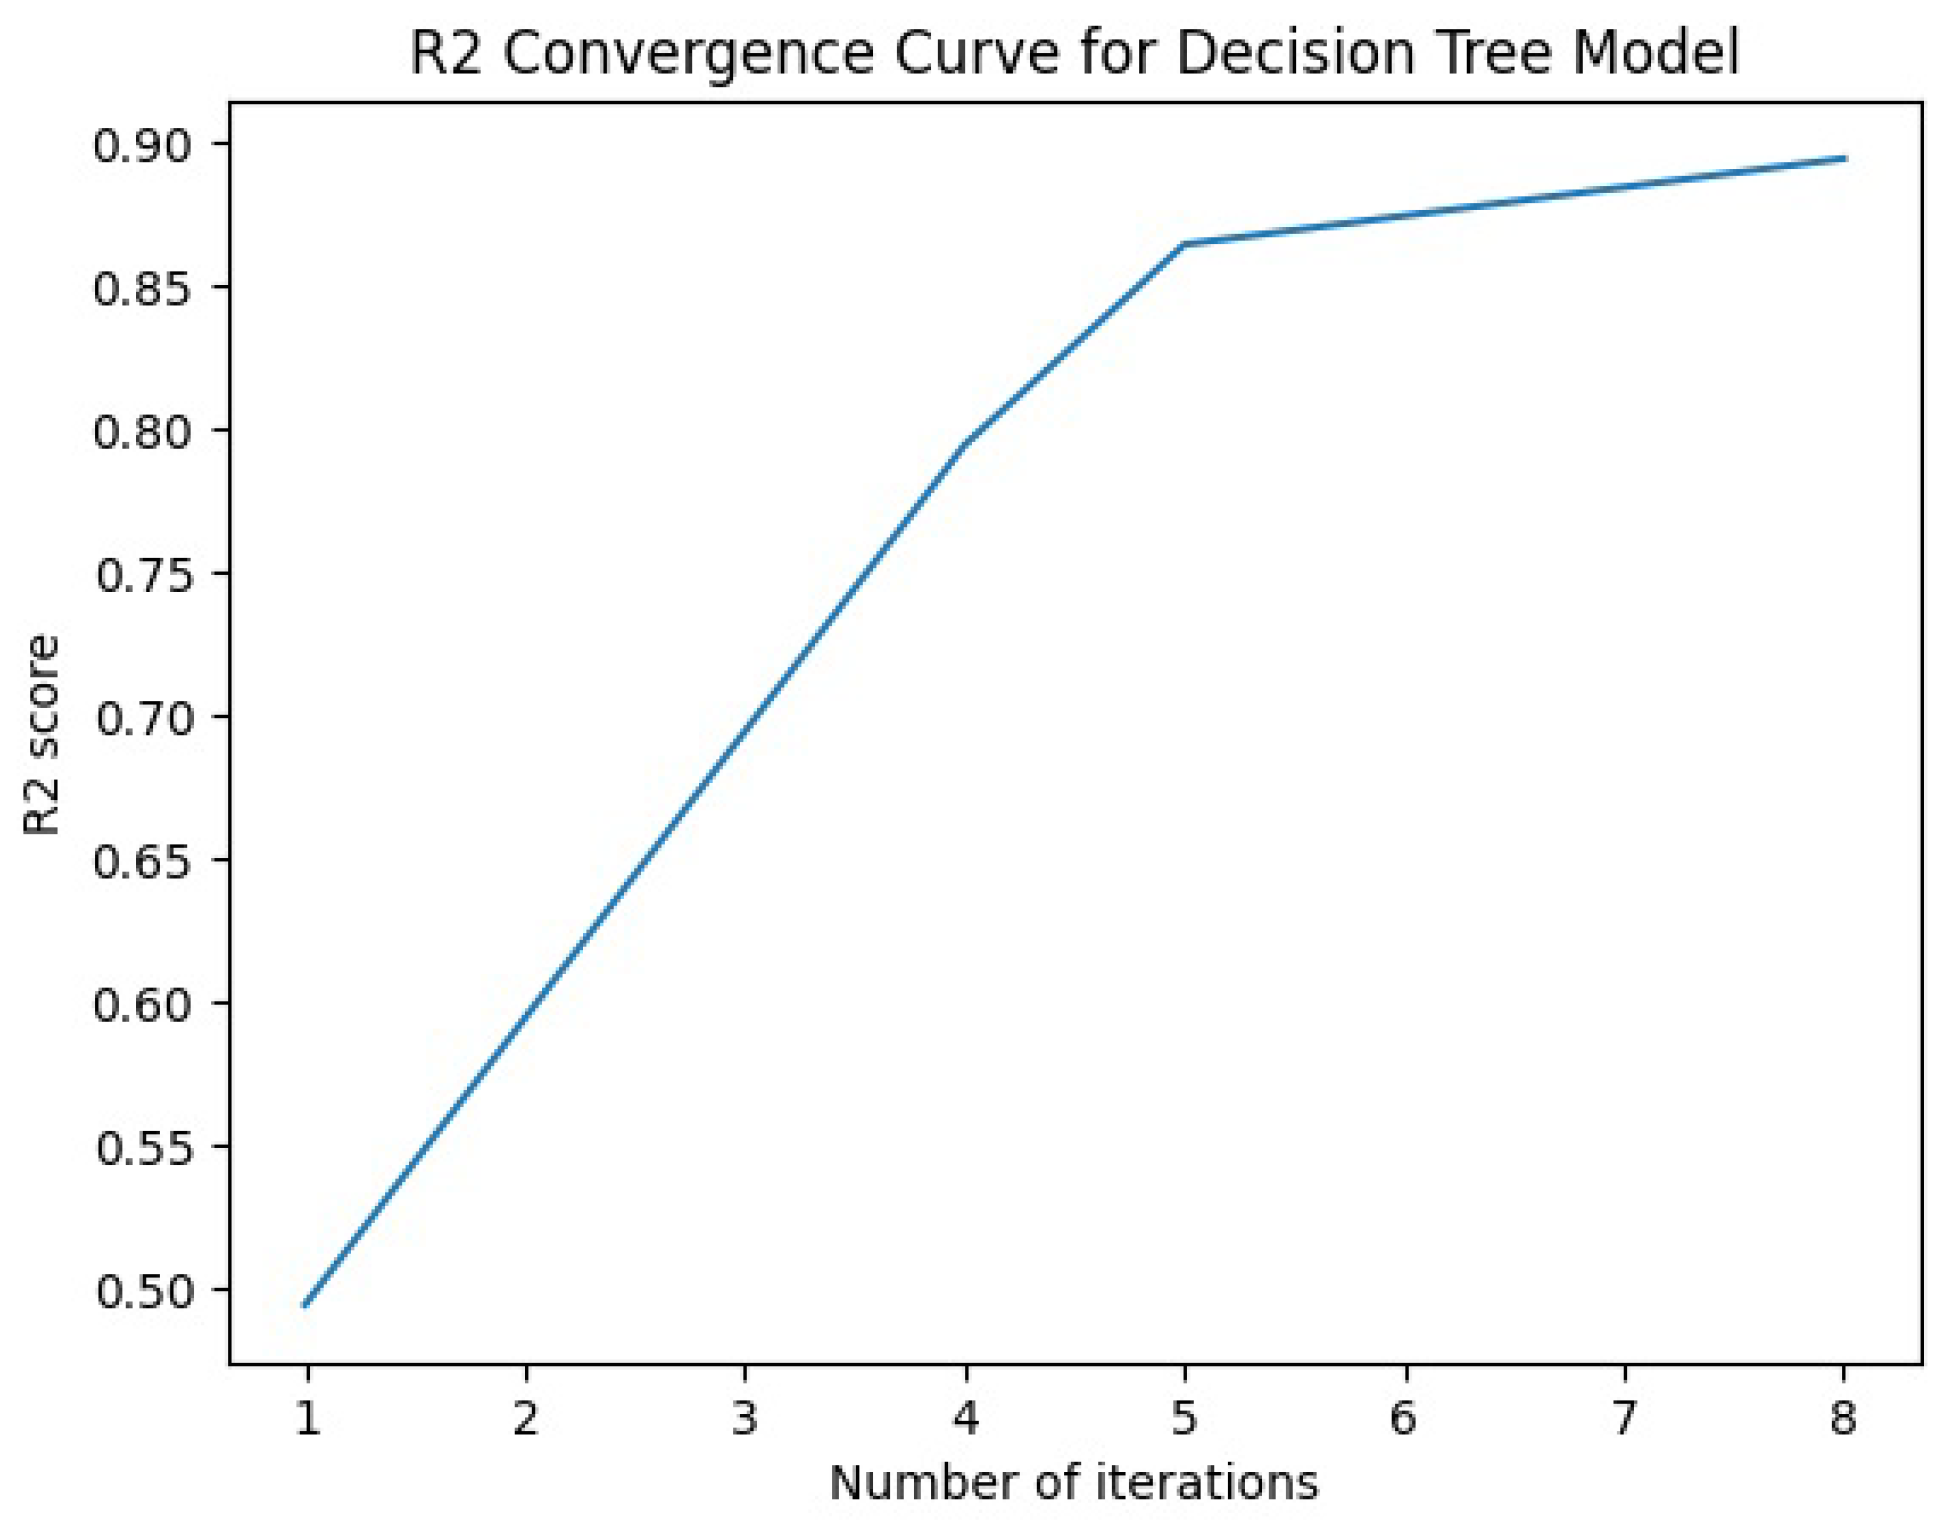
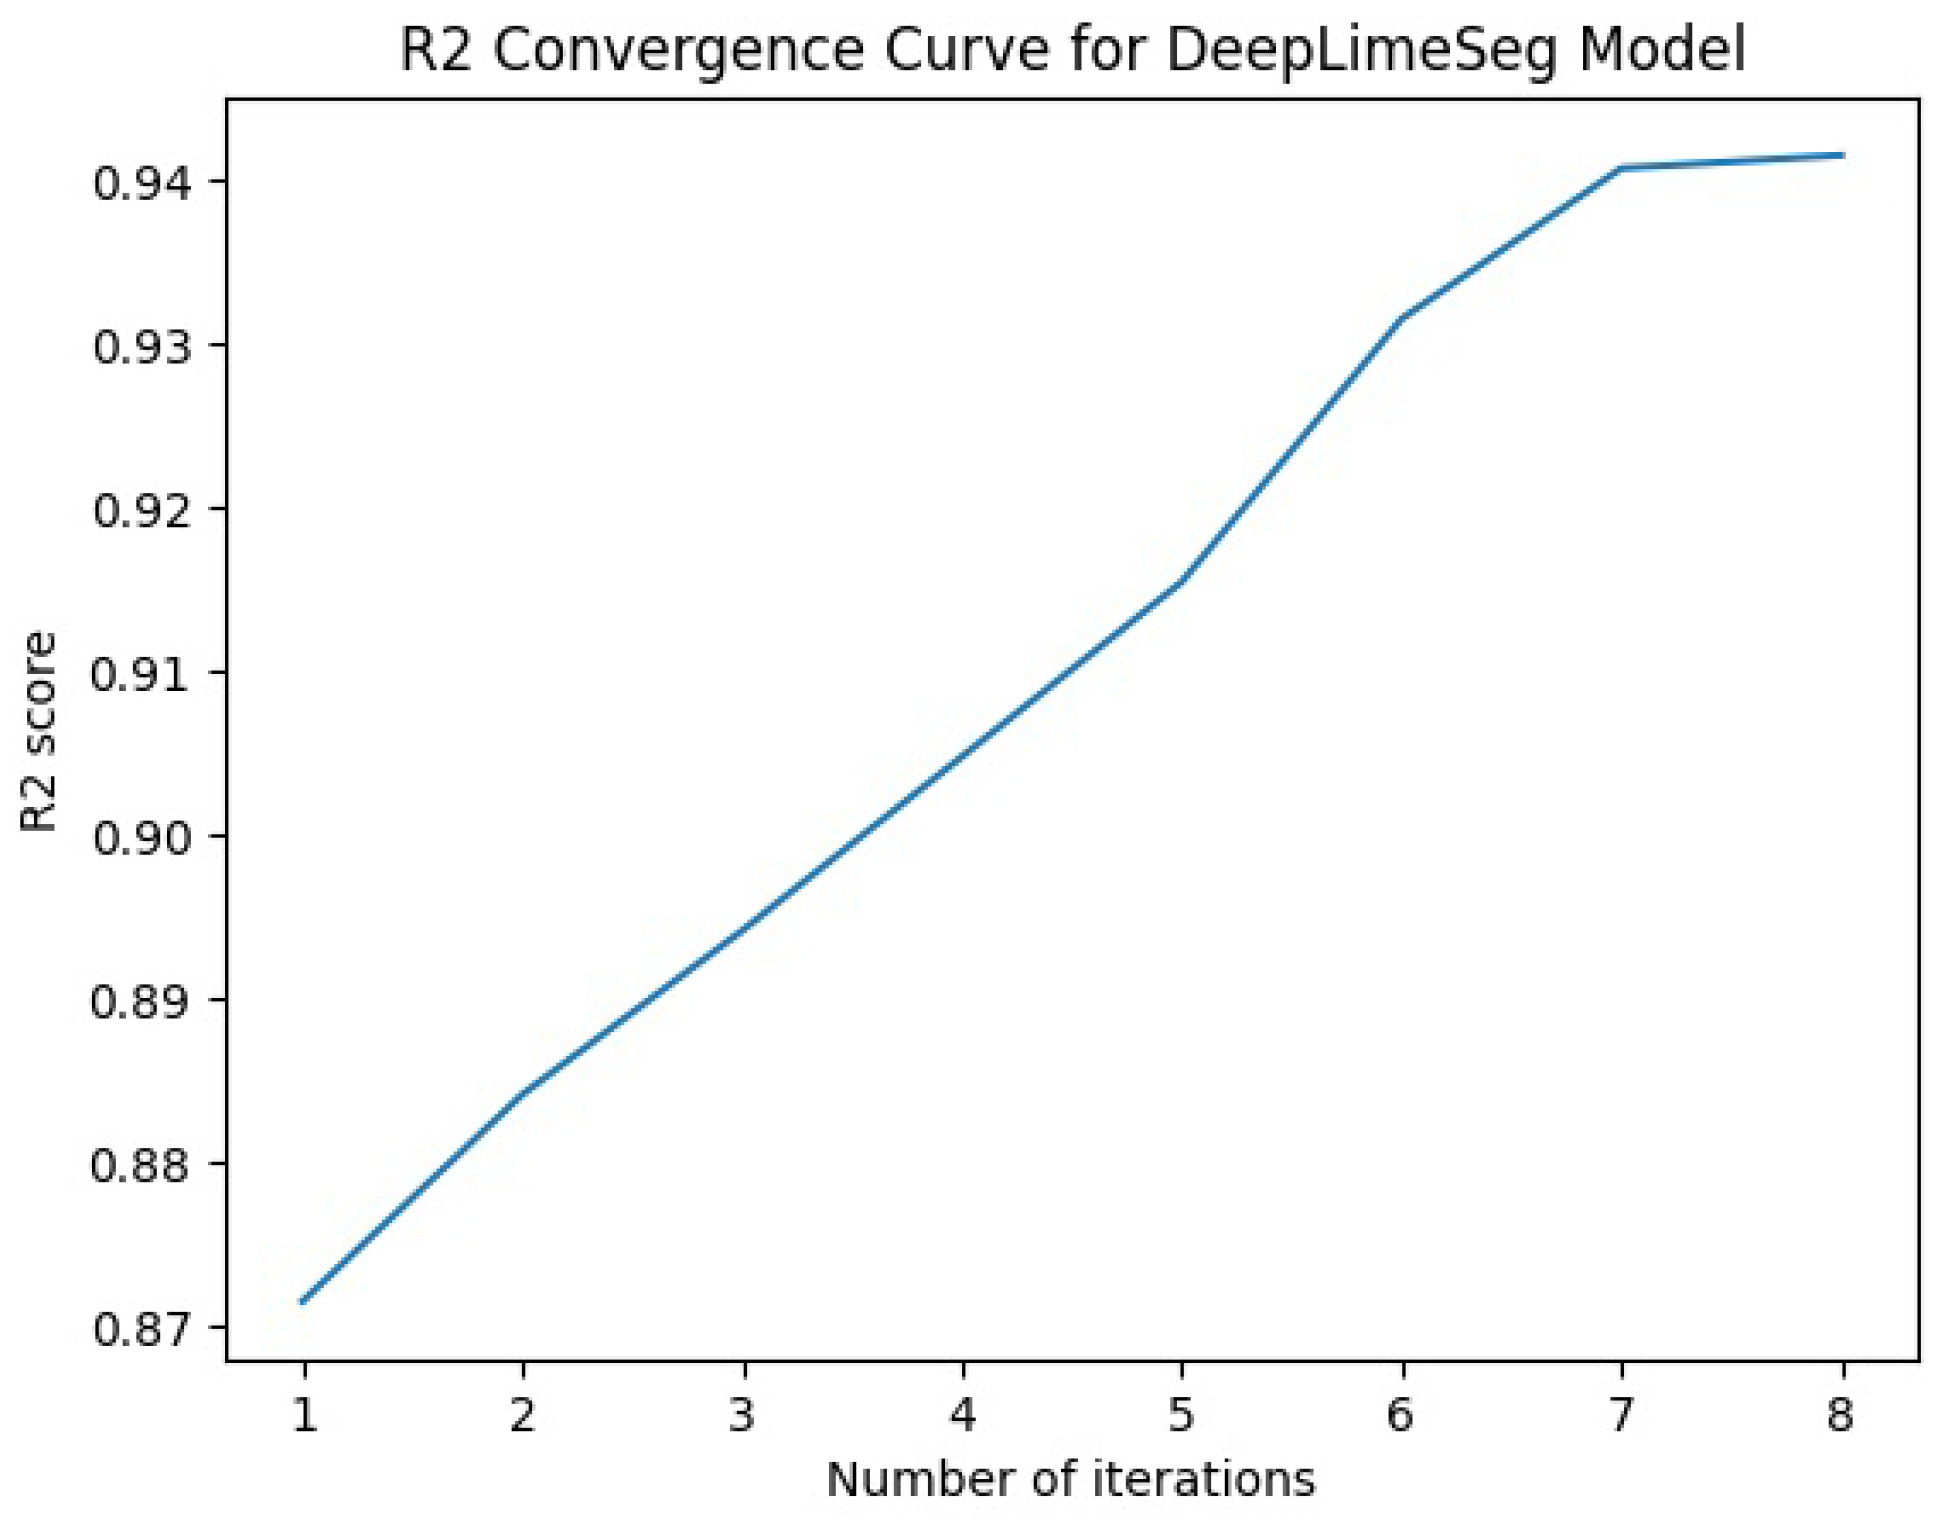
The Lime-based model generates clear and understandable explanations for each customer’s segmentation, as depicted in
Figure 4. The Lime-based model generates an
convergence curve for each model, as depicted in
Figure 5,
Figure 6,
Figure 7,
Figure 8 and
Figure 9.
Figure 4 provides a visual representation of Lime-based model explanations. It showcases how specific features influence the assignment of customers to particular segments. Each bar in the figure represents a feature, and its length indicates the magnitude of influence on the segmentation outcome. The feature that contributes the most to the segmentation process is typically the one with the longest bar in the visualization.
For instance, if we observe that the “Recent Purchase Activity” feature has the longest bar, it suggests that this feature plays a pivotal role in segmenting customers. In this scenario, the model has identified recent purchase activity as the primary driver behind categorizing customers into specific segments. This insight allows businesses to tailor marketing strategies accordingly, focusing on customers with high recent-purchase activity.
By providing this level of detail, the Lime-based module not only explains how the model makes decisions, but also empowers businesses with actionable insights. It ensures that the segmentation results align with human intuition and are rooted in interpretable patterns within the data.
The Lime-based Explainability module, therefore, acts as a bridge between the complexity of deep learning models and human comprehension, enhancing the transparency and practical utility of the segmentation results.
In
Figure 4, the Lime-based model explanations provide insights into which features are most effective in the segmentation process. The “Feature Importance” chart typically ranks the features based on their influence on the model’s predictions. The feature that has the highest positive or negative impact on a particular segment’s assignment is considered the most effective feature for that segment.
To determine the most effective feature in the segmentation process from
Figure 4, you should look at the feature with the highest positive or negative weight for a specific segment. If the feature has a high positive weight, it means that an increase in that feature’s value is positively associated with customers being assigned to that segment. Conversely, if the feature has a high negative weight, it means that a decrease in that feature’s value is positively associated with customers being assigned to that segment.
For example, if you have a segment named “High-Value Shoppers” and the feature “Recent Purchase Activity” has the highest positive weight for this segment, it indicates that customers who have made recent purchases are more likely to be classified as “High-Value Shoppers”. Conversely, if the feature “Frequency of Transactions” has the highest negative weight for the same segment, it suggests that customers who make fewer transactions are less likely to be in the “High-Value Shoppers” segment.
Therefore, the most effective feature in the segmentation process for a specific segment is the one with the highest positive or negative weight associated with that segment, as it has the strongest influence on assigning customers to that segment based on their spending behavior.
The results show that the DeepLimeSeg model outperformed all other models in terms of MSE, MAE, and . The DeepLimeSeg model achieved a low MSE of 0.9412, indicating good predictive accuracy for the spending score. Additionally, the MAE value of 0.9874 suggests that the model’s predictions are, on average, less than one unit away from the true values. The high value of 0.94152 indicates that the DeepLimeSeg model explains a significant proportion of the variance in the spending score, making it a good model for this task.
The other models, including Linear Regression, Decision Tree, KNN, and NN, also achieved reasonably good performance, but all of them were outperformed by the DeepLimeSeg model. The Decision Tree model had the lowest MSE and MAE values, indicating good accuracy for predicting the spending score. However, its value was lower than that of the DeepLimeSeg model, suggesting that it may not be as effective at explaining the variance in the data.
Overall, the results suggest that the DeepLimeSeg model is the most effective for predicting the spending score in the Mall-Customer Segmentation dataset. In addition, the combination of deep learning and explainable AI techniques used in the DeepLimeSeg algorithm appears to be particularly effective for this task, providing accurate and interpretable customer segmentation results that can be used to inform targeted marketing efforts.
5.5. E-Commerce Data
The E-Commerce dataset [
1] is a collection of online retail transactions from a UK-based online retailer. The data include information on more than 500,000 transactions between December 2010 and December 2011. Each transaction record contains details such as the date and time of the transaction, the product description, the number of items purchased, the unit price, and the customer’s unique identifier. The dataset also includes information on the customer’s country of origin. This dataset is commonly used for customer segmentation and market basket analysis in e-commerce. Each row in the dataset represents a transaction, and there are eight columns, as depicted in
Table 6, containing information about the transaction.
This dataset can be used to perform various types of analysis, such as customer segmentation, product recommendations, and sales forecasting. The dataset is publicly available and can be accessed from various online sources. A sample of the E-Commerce dataset is shown in
Table 7.
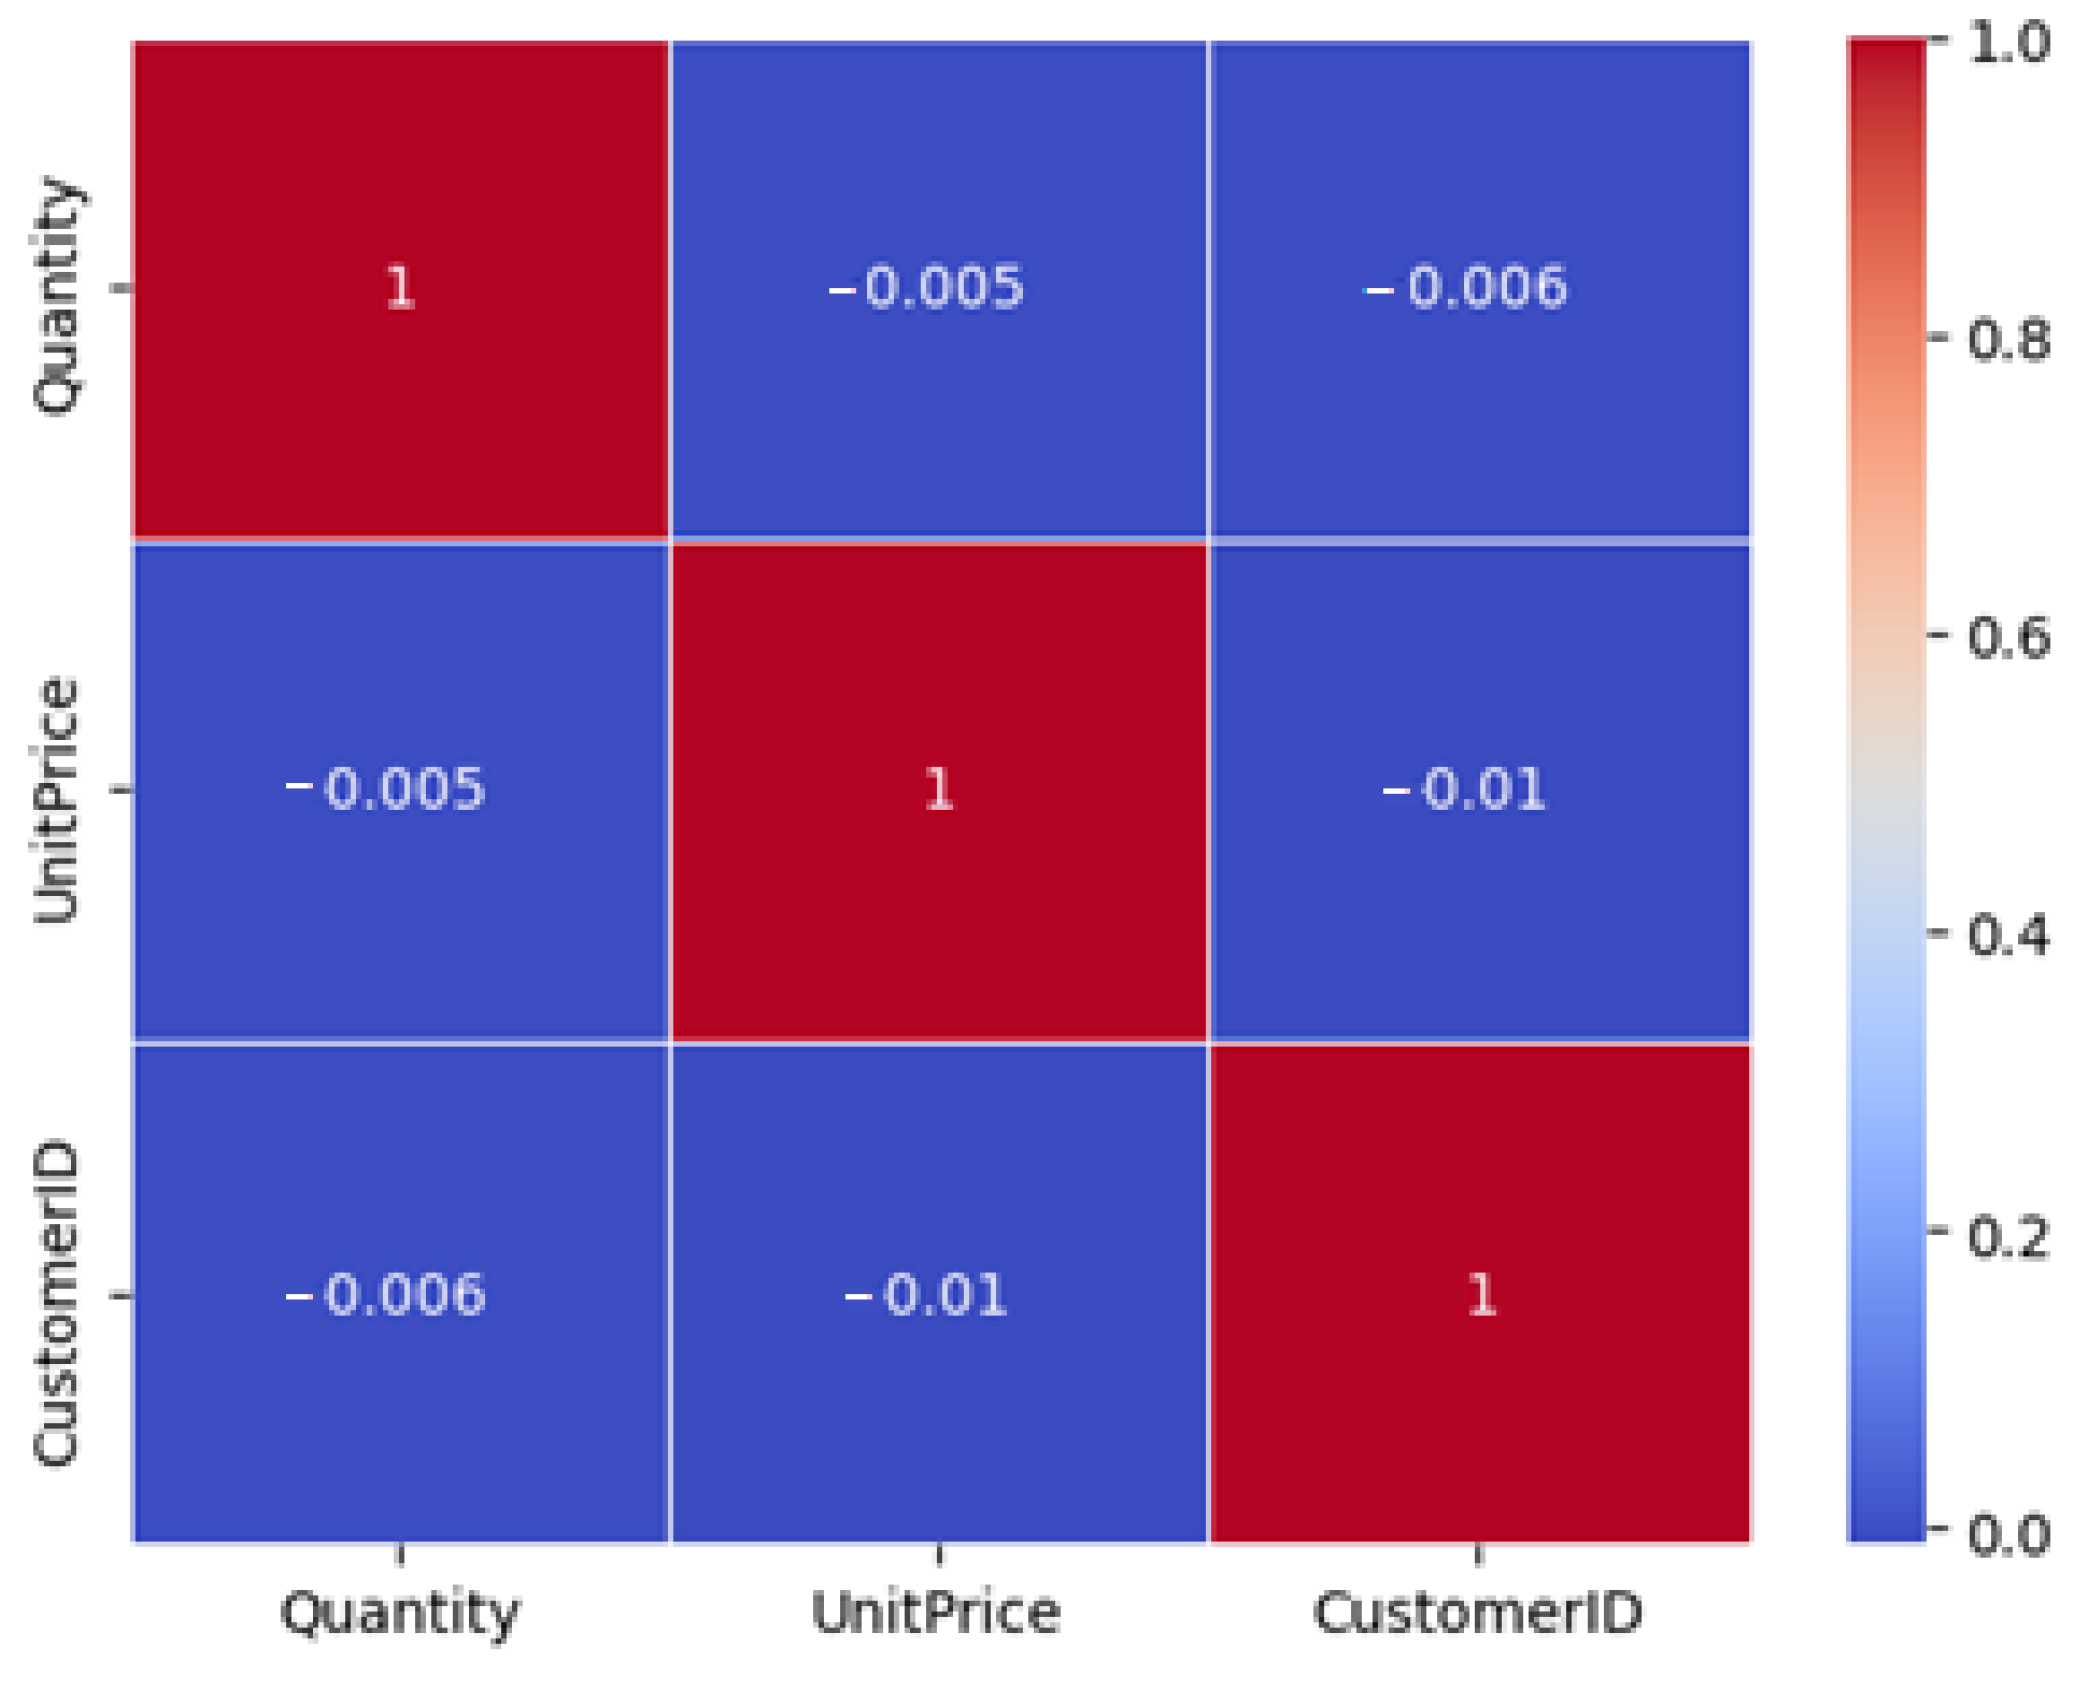
Figure 10 shows the data visualization.
5.6. Customer Segmentation Using RFM Analysis
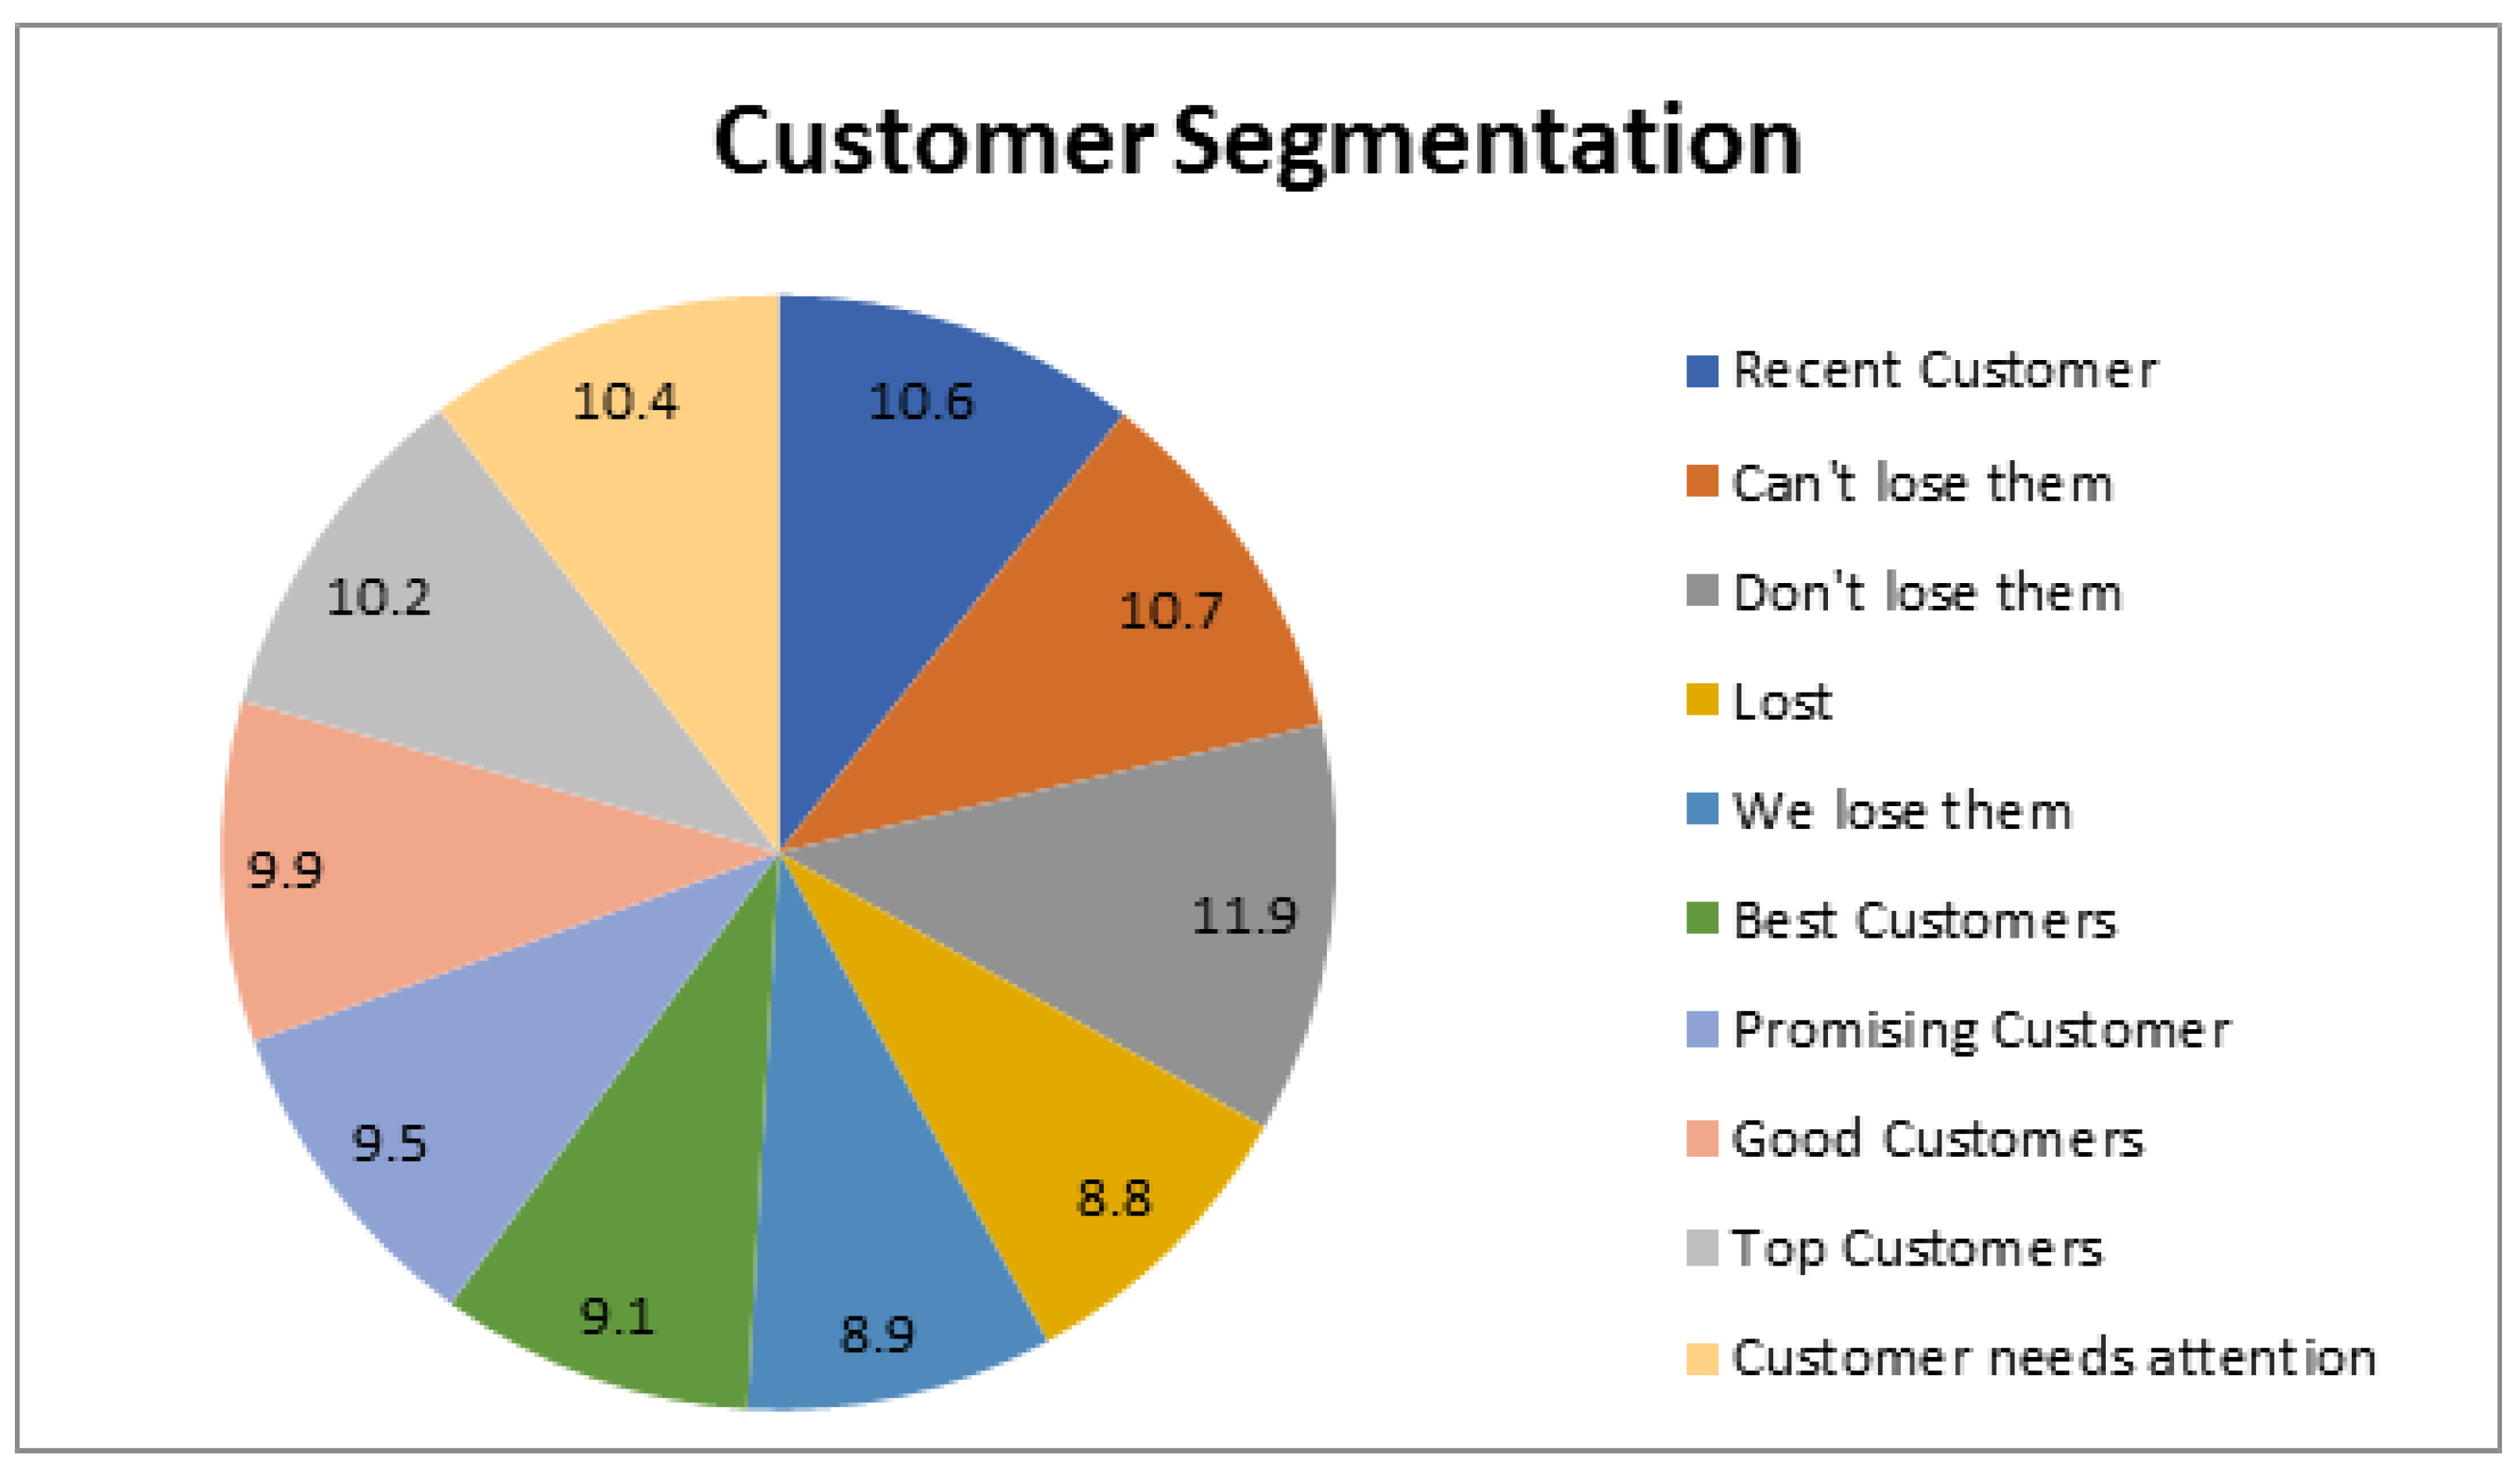
After analyzing the data, we identified ten distinct clusters of customers based on their purchase history, frequency, and spending habits, as depicted in
Table 8 and
Table 9 and
Figure 11. To classify the customers, we assigned a score of one to those who made recent purchases, those who had made multiple purchases, and those who had spent more money. This approach allowed us to segment the customer base effectively and gain insights into their behavior and preferences. This scoring system could effectively classify customers into unique groups with similar behavior patterns. This information can be valuable to businesses looking to tailor their marketing strategies to different customer segments and improve overall customer satisfaction and loyalty.
Problem Limitation: Despite the utilization of two distinct datasets, this study is not without its limitations. Firstly, while the proposed DeepLimeSeg algorithm effectively identifies specific customer segments in the Mall-Customer Segmentation and E-Commerce datasets, the findings may not be generalizable to other datasets or industries. Secondly, the chosen models and performance metrics employed may not be exhaustive, and other models and metrics may offer different insights. Finally, the proposed approach may require significant computational resources and may not be suitable for businesses with limited computing capabilities. These limitations should be considered when interpreting the study’s results and planning future research endeavors. A comparison of DeepLimeSeg and RFM analysis is depicted in
Table 10.
The challenges the DeepLimeSeg presents are depicted in
Figure 12. In addressing the challenges posed by DeepLimeSeg’s limitations, we can explore a range of strategic solutions tailored to each constraint as follows:
- 1.
Resource-Intensive Nature of the Algorithm: The computational demands of DeepLimeSeg can be managed through several effective strategies:
Model Optimization: We can enhance the neural network architecture’s efficiency by implementing advanced optimization techniques. This involves streamlining the network’s structure, reducing the number of parameters, and optimizing hyperparameters. These modifications aim to boost the model’s computational efficiency while keeping its predictive performance intact.
Model Compression: Another avenue is employing model compression methods such as quantization, pruning, or knowledge distillation. These techniques effectively reduce the model’s size and computational requirements. Despite the reduction in complexity, the model’s predictive accuracy remains relatively intact, ensuring efficient utilization of computational resources.
Hardware Acceleration: Leveraging specialized hardware accelerators such as GPUs, TPUs, or AI-specific hardware can expedite model training and inference. By harnessing the parallel processing capabilities of these accelerators, we can markedly decrease the time and resources needed for the algorithm’s execution.
Cloud Computing: Businesses can tap into the potential of cloud-based services to access scalable computational resources. The cloud’s flexibility enables enterprises to allocate computational power as needed, proving particularly beneficial for those with limited local computing resources.
Limited Generalizability: Enhancing the generalizability of DeepLimeSeg involves strategies that prevent overfitting and improve the model’s ability to handle diverse data:
- 2.
Data Augmentation: By applying data augmentation techniques, the variety of training data can be expanded by generating diverse data variations. This expanded dataset facilitates the model’s acquisition of more robust and generalized patterns, contributing to better generalization performance.
Transfer Learning: Transfer learning involves pretraining the model on a larger dataset or a related task before fine-tuning it for the specific target task. This technique leverages information from broader contexts, improving the model’s generalization capacity to new data.
Regularization: Implementing regularization techniques, including dropout, L1/L2 regularization, or early stopping, mitigates overfitting. These methods ensure that the model does not overly specialize in the training data, leading to better generalization on unseen data.
Ensemble Learning: Ensemble learning involves training multiple instances of the model with distinct initializations or architectures and then combining their predictions. This approach reduces the risk of overfitting while boosting the model’s generalization ability by capitalizing on diverse learned patterns.
Cross-Validation: Cross-validation entails assessing the model’s performance on different data subsets. This process offers insights into the algorithm’s generalization capabilities across varying contexts, leading to a deeper understanding of its effectiveness.
By adopting these comprehensive strategies, we can navigate the constraints of DeepLimeSeg, enhancing its performance, efficiency, and ability to generalize across various scenarios.
5.7. Assumptions and Generalization
Like any machine learning algorithm, DeepLimeSeg is built on certain assumptions that might impact its generalization to unseen data. One key assumption is the availability of labeled training data accurately representing the underlying data distribution. Mathematically, this can be expressed as follows: Let D_train = (x_i, y_i) be the training dataset, where x_i represents the input features and y_i represents the corresponding ground truth segmentation labels. The algorithm implicitly assumes that D_train is a representative sample from the true data distribution . Deviations from this assumption might lead to suboptimal model performance.
5.8. Overfitting and Underfitting
Overfitting and underfitting are common challenges in machine learning that have mathematical implications. Overfitting occurs when the model captures noise in the training data and fails to generalize to new data. On the other hand, underfitting results from a model that is too simplistic to capture the underlying patterns. These issues can be mathematically quantified using concepts like bias and variance. Let us consider the mean squared error (MSE) as the evaluation metric, as depicted in (
12).
Overfitting tends to exhibit a low training error but a high validation error, resulting in a large gap between the two. Mathematically, this can be observed as a significant difference between the training MSE and the validation MSE. Conversely, underfitting leads to high training and validation errors due to the model’s inability to capture the underlying patterns. Regularization techniques, such as L2 regularization, can be incorporated into the mathematical model to mitigate overfitting by penalizing large weights and promoting simpler models.
6. Results and Discussion
The selection of Mean Squared Error (MSE), Mean Absolute Error (MAE), and R-squared () as evaluation metrics was driven by their relevance to segmentation tasks and their ability to provide insights into both predictive accuracy and model generalization. These metrics offer a comprehensive view of how well the model captures the underlying patterns in the data.
MSE and MAE quantify the discrepancy between predicted and actual values, with MSE penalizing larger errors more significantly. In customer segmentation, lower MSE and MAE values indicate that DeepLimeSeg’s predictions are closer to the ground truth labels, signifying higher accuracy in segmenting customers based on their spending scores. These metrics directly measure how well the model’s predictions align with the true customer segments.
, on the other hand, gauges the proportion of variance in the target variable (spending scores) that the model captures. A higher value suggests that DeepLimeSeg effectively captures the variability in spending scores, demonstrating its predictive power and ability to explain the data’s underlying patterns.
The reported values of these metrics hold practical implications for both businesses and model development. Lower MSE and MAE values indicate more accurate segmentation, enabling businesses to target customers with tailored marketing strategies, enhancing customer experiences and optimizing resource allocation. Higher values reflect the model’s capacity to predict spending scores with a substantial degree of accuracy, bolstering the credibility of the segments and supporting strategic decision-making.
The comparison between DeepLimeSeg and traditional RFM analysis yields promising results, yet providing further context is essential to understand their performances’ nuances fully. While DeepLimeSeg demonstrates superiority in several aspects, it is valuable to highlight the specific scenarios where traditional RFM analysis might outperform DeepLimeSeg and the unique insights each approach brings.
Potential RFM Advantages: Traditional RFM analysis could outperform DeepLimeSeg in scenarios where the dataset lacks sufficient complexity or when interpretability is the primary concern. If the data distribution is simple and linear relationships dominate, RFM analysis, being a simpler methodology, might lead to equally effective results without the computational burden of deep learning. Additionally, for situations where a straightforward, interpretable solution is prioritized over intricate pattern recognition, RFM might offer a quicker and simpler approach.
Unique Insights from RFM: RFM analysis might offer insights that DeepLimeSeg, due to its complexity, might not readily provide. For instance, RFM’s simplicity might uncover basic customer segments that are inherently straightforward to interpret, such as “High-Frequency Low-Spending” customers. While DeepLimeSeg excels in capturing intricate patterns, RFM might shed light on easily identifiable segments that require immediate attention. Furthermore, RFM’s focus on recency, frequency, and monetary value can offer insights into customer behavior that might not be apparent solely from the complex patterns identified by DeepLimeSeg.
7. Conclusions and Future Research Directions
In this research, we introduced “DeepLimeSeg”, an algorithm that combines deep learning’s predictive power with the clarity of explainable AI (XAI) for customer segmentation. Validated against a real-world dataset, DeepLimeSeg effectively identified distinct customer groups. Its Lime-based component, supported by mathematical principles, provides clear segmentations, aiding businesses in enhancing their marketing tactics and improving sales results. Empirical tests showed DeepLimeSeg’s superiority, with an MSE of 0.9412, highlighting its strong predictive accuracy for spending scores. An R2 value of 0.94152 further confirms its ability to explain a significant portion of the variance in spending scores.
Additionally, this study explored the traditional RFM analysis for customer segmentation in the E-Commerce dataset. Using mathematical principles, customers were categorized based on recency, frequency, and monetary values, identifying ten unique customer groups. The RFM analysis emphasized the importance of recent high-value purchasers for e-commerce businesses. It also identified a segment of regular buyers with historically low-value purchases as a potential growth opportunity.
However, the study’s scope extended beyond DeepLimeSeg, incorporating traditional RFM analysis for customer segmentation within the E-Commerce dataset. This analysis highlighted the continued relevance of recent high-value purchasers in e-commerce. It also revealed a segment of regular buyers with historically lower-value transactions, suggesting a potential growth area. DeepLimeSeg, which integrates deep learning with explainable AI for customer segmentation, has several areas ripe for future exploration. Addressing challenges from noisy data and missing values and ensuring adaptability to changing customer behaviors are pivotal. Scalability, especially with burgeoning datasets, is another focus area. Practical implementation might pose challenges like integration, data privacy, and delivering actionable insights. Additionally, understanding its adaptability across various sectors and balancing its model complexity with performance are essential. In essence, while DeepLimeSeg is promising, it has significant potential for refinement.


 ,
, 


