


Improving Wild Horse Optimizer: Integrating Multistrategy for Robust Performance across Multiple Engineering Problems and Evaluation Benchmarks


Abstract
:1. Introduction
- In this article, the concepts of ‘early warning strategy’ and ‘competition mechanism’ are proposed, and the adaptive parameter TDR of WHO is improved.
- On this basis, an improved wild horse optimizer based on early warning and competition mechanisms (I-WHO) is proposed.
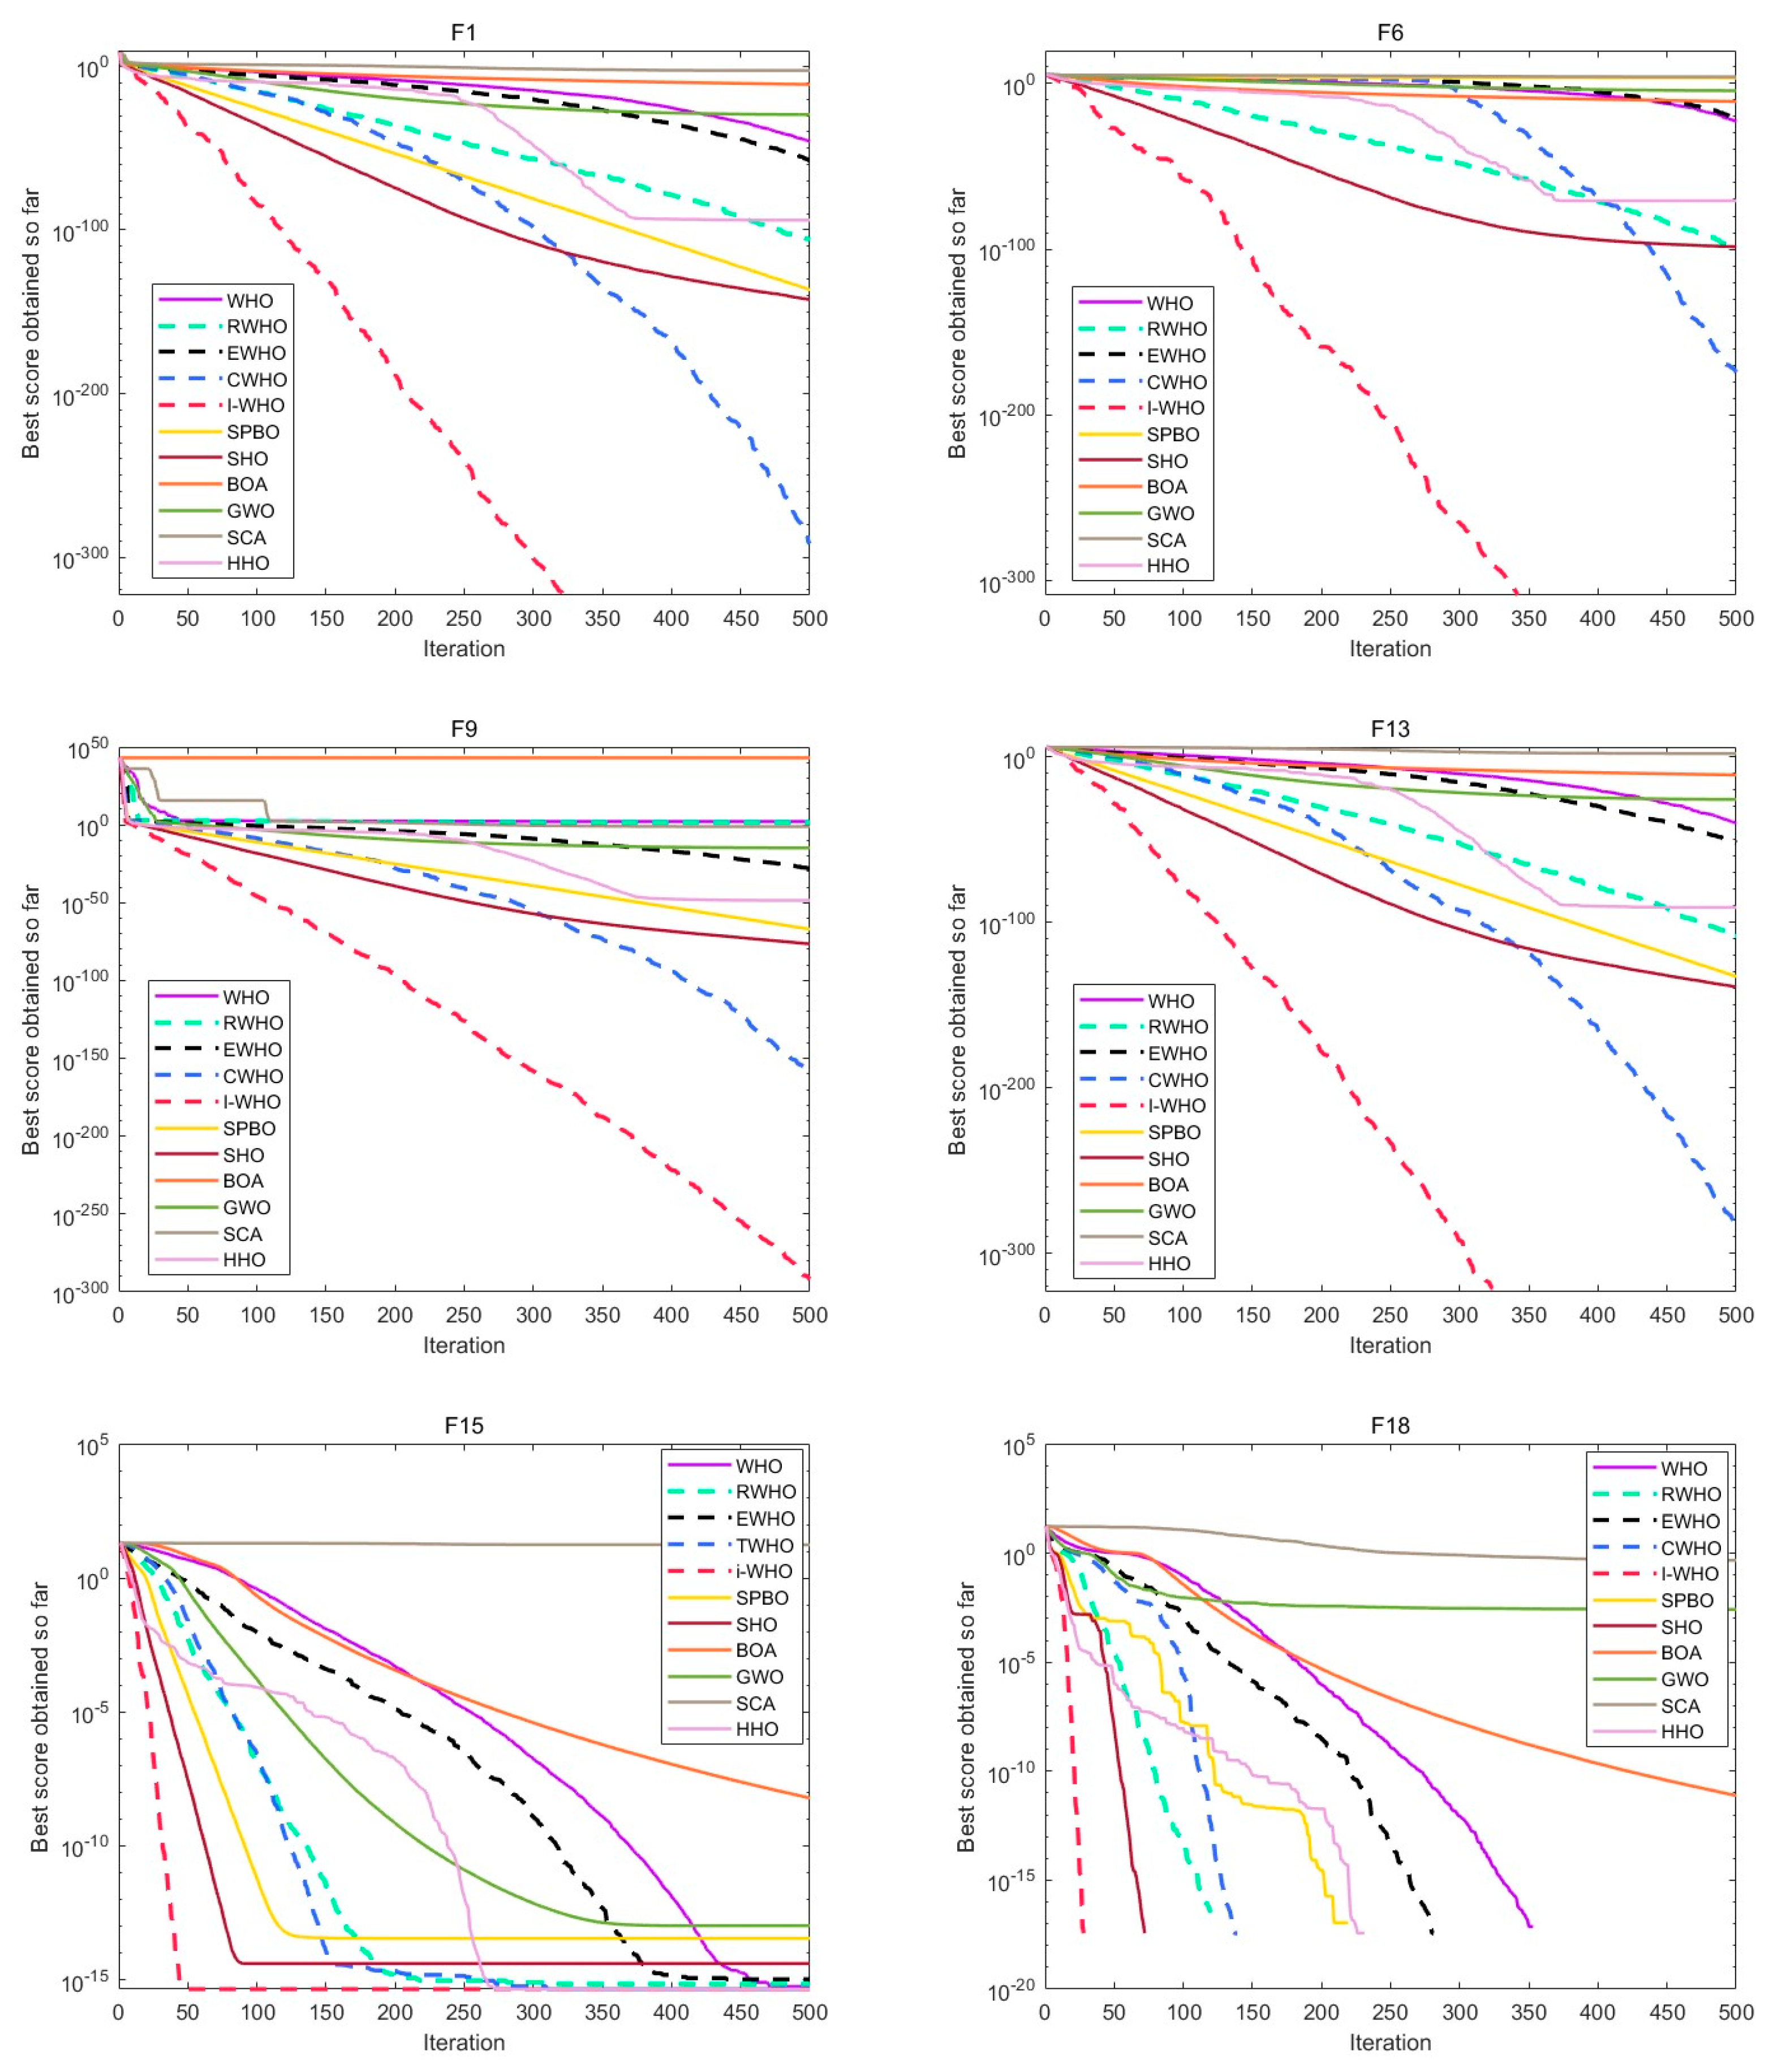
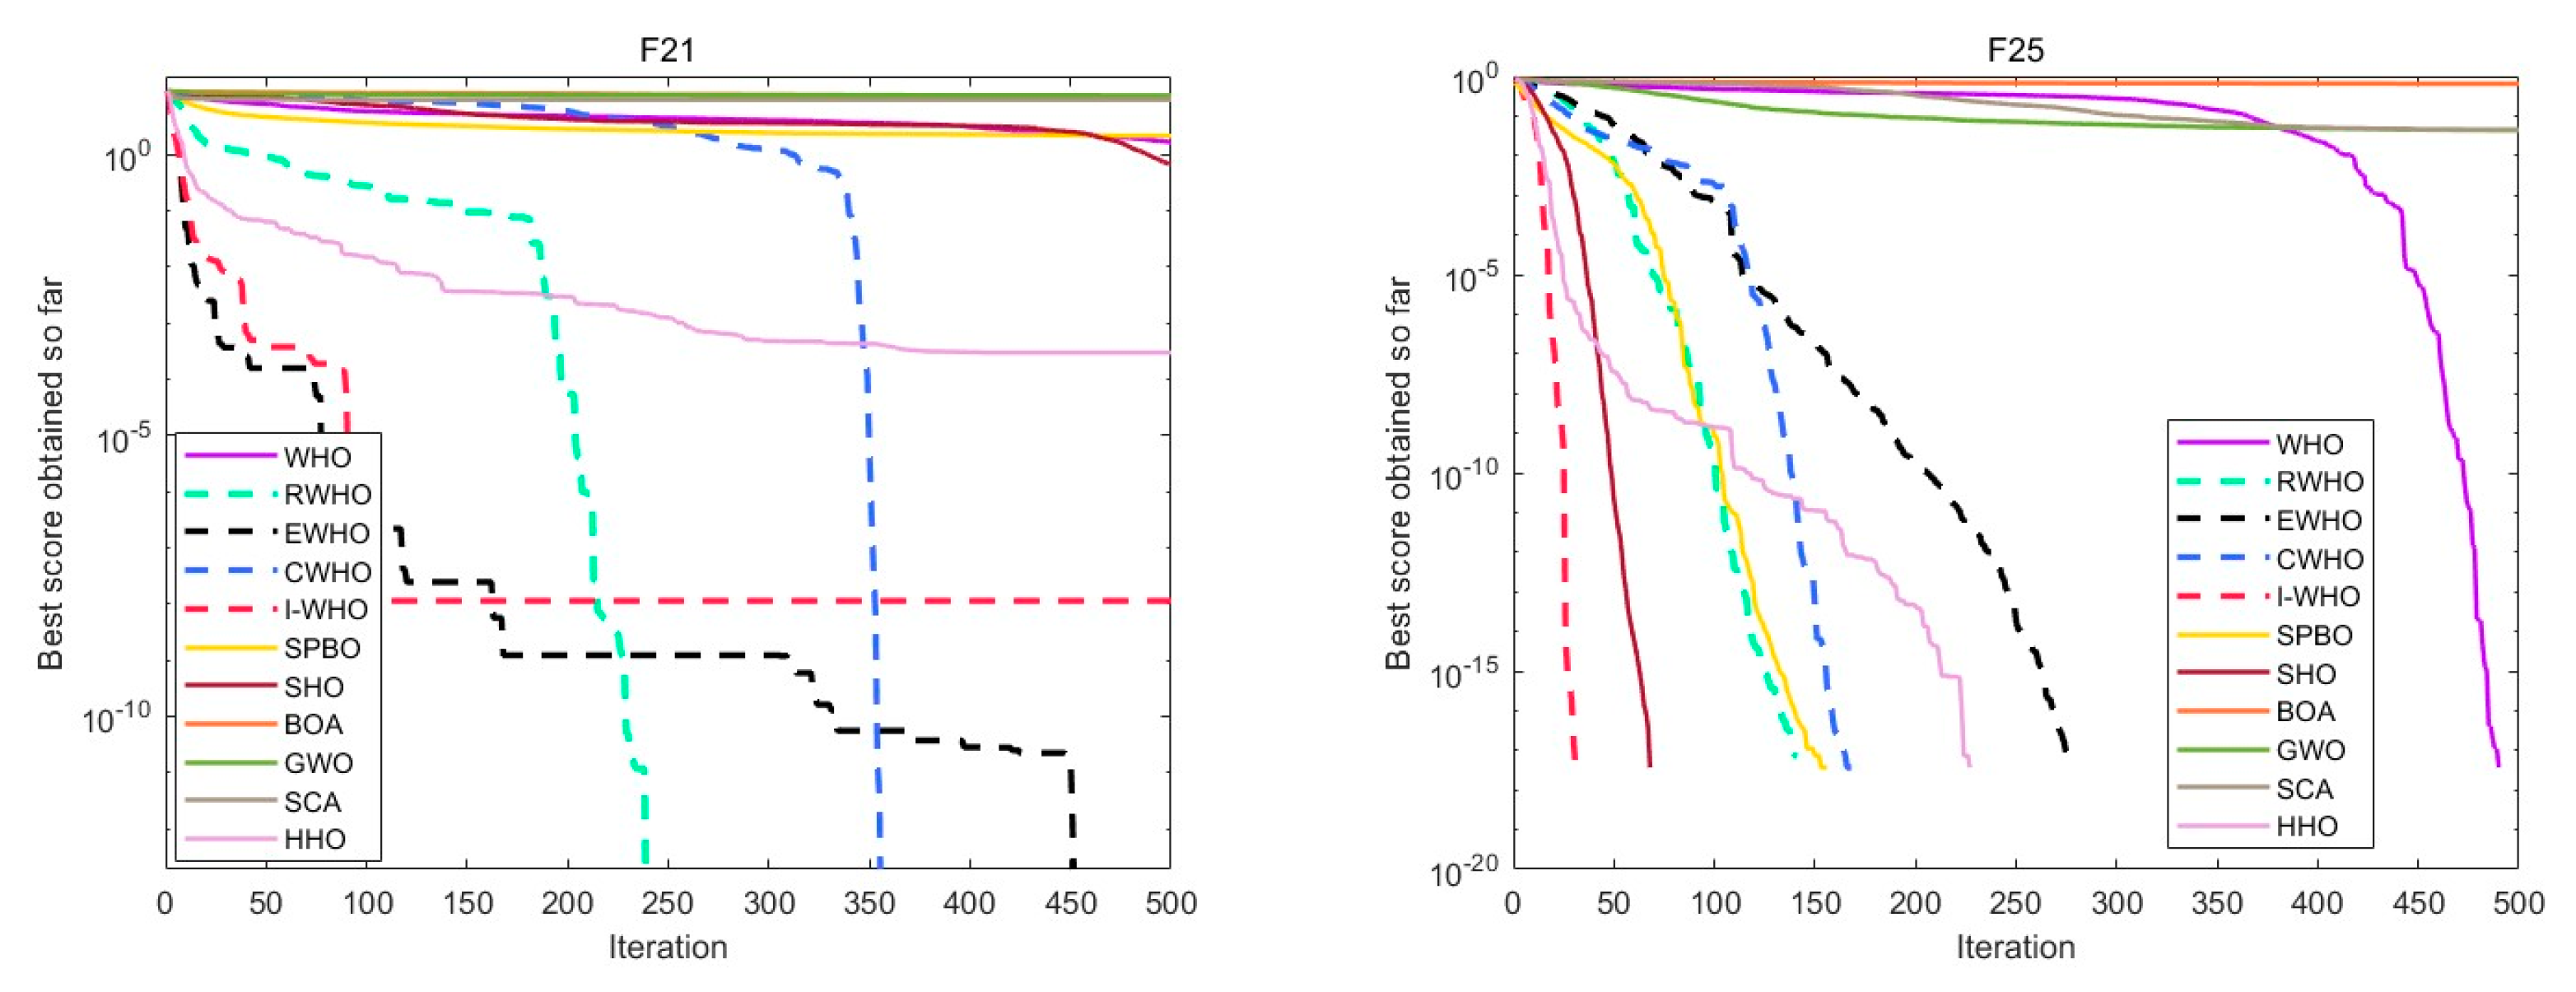
- This paper uses the I-WHO algorithm to conduct experiments and verify the optimal solutions of 25 mainstream test functions. The experimental results obtained are advantageous in the verification work of previous researchers.
- The I-WHO algorithm is evaluated and analyzed on engineering problems in four different engineering fields, and its performance is better than that of WHO, which has better practicability and applicability.
2. Wild Horse Optimizer
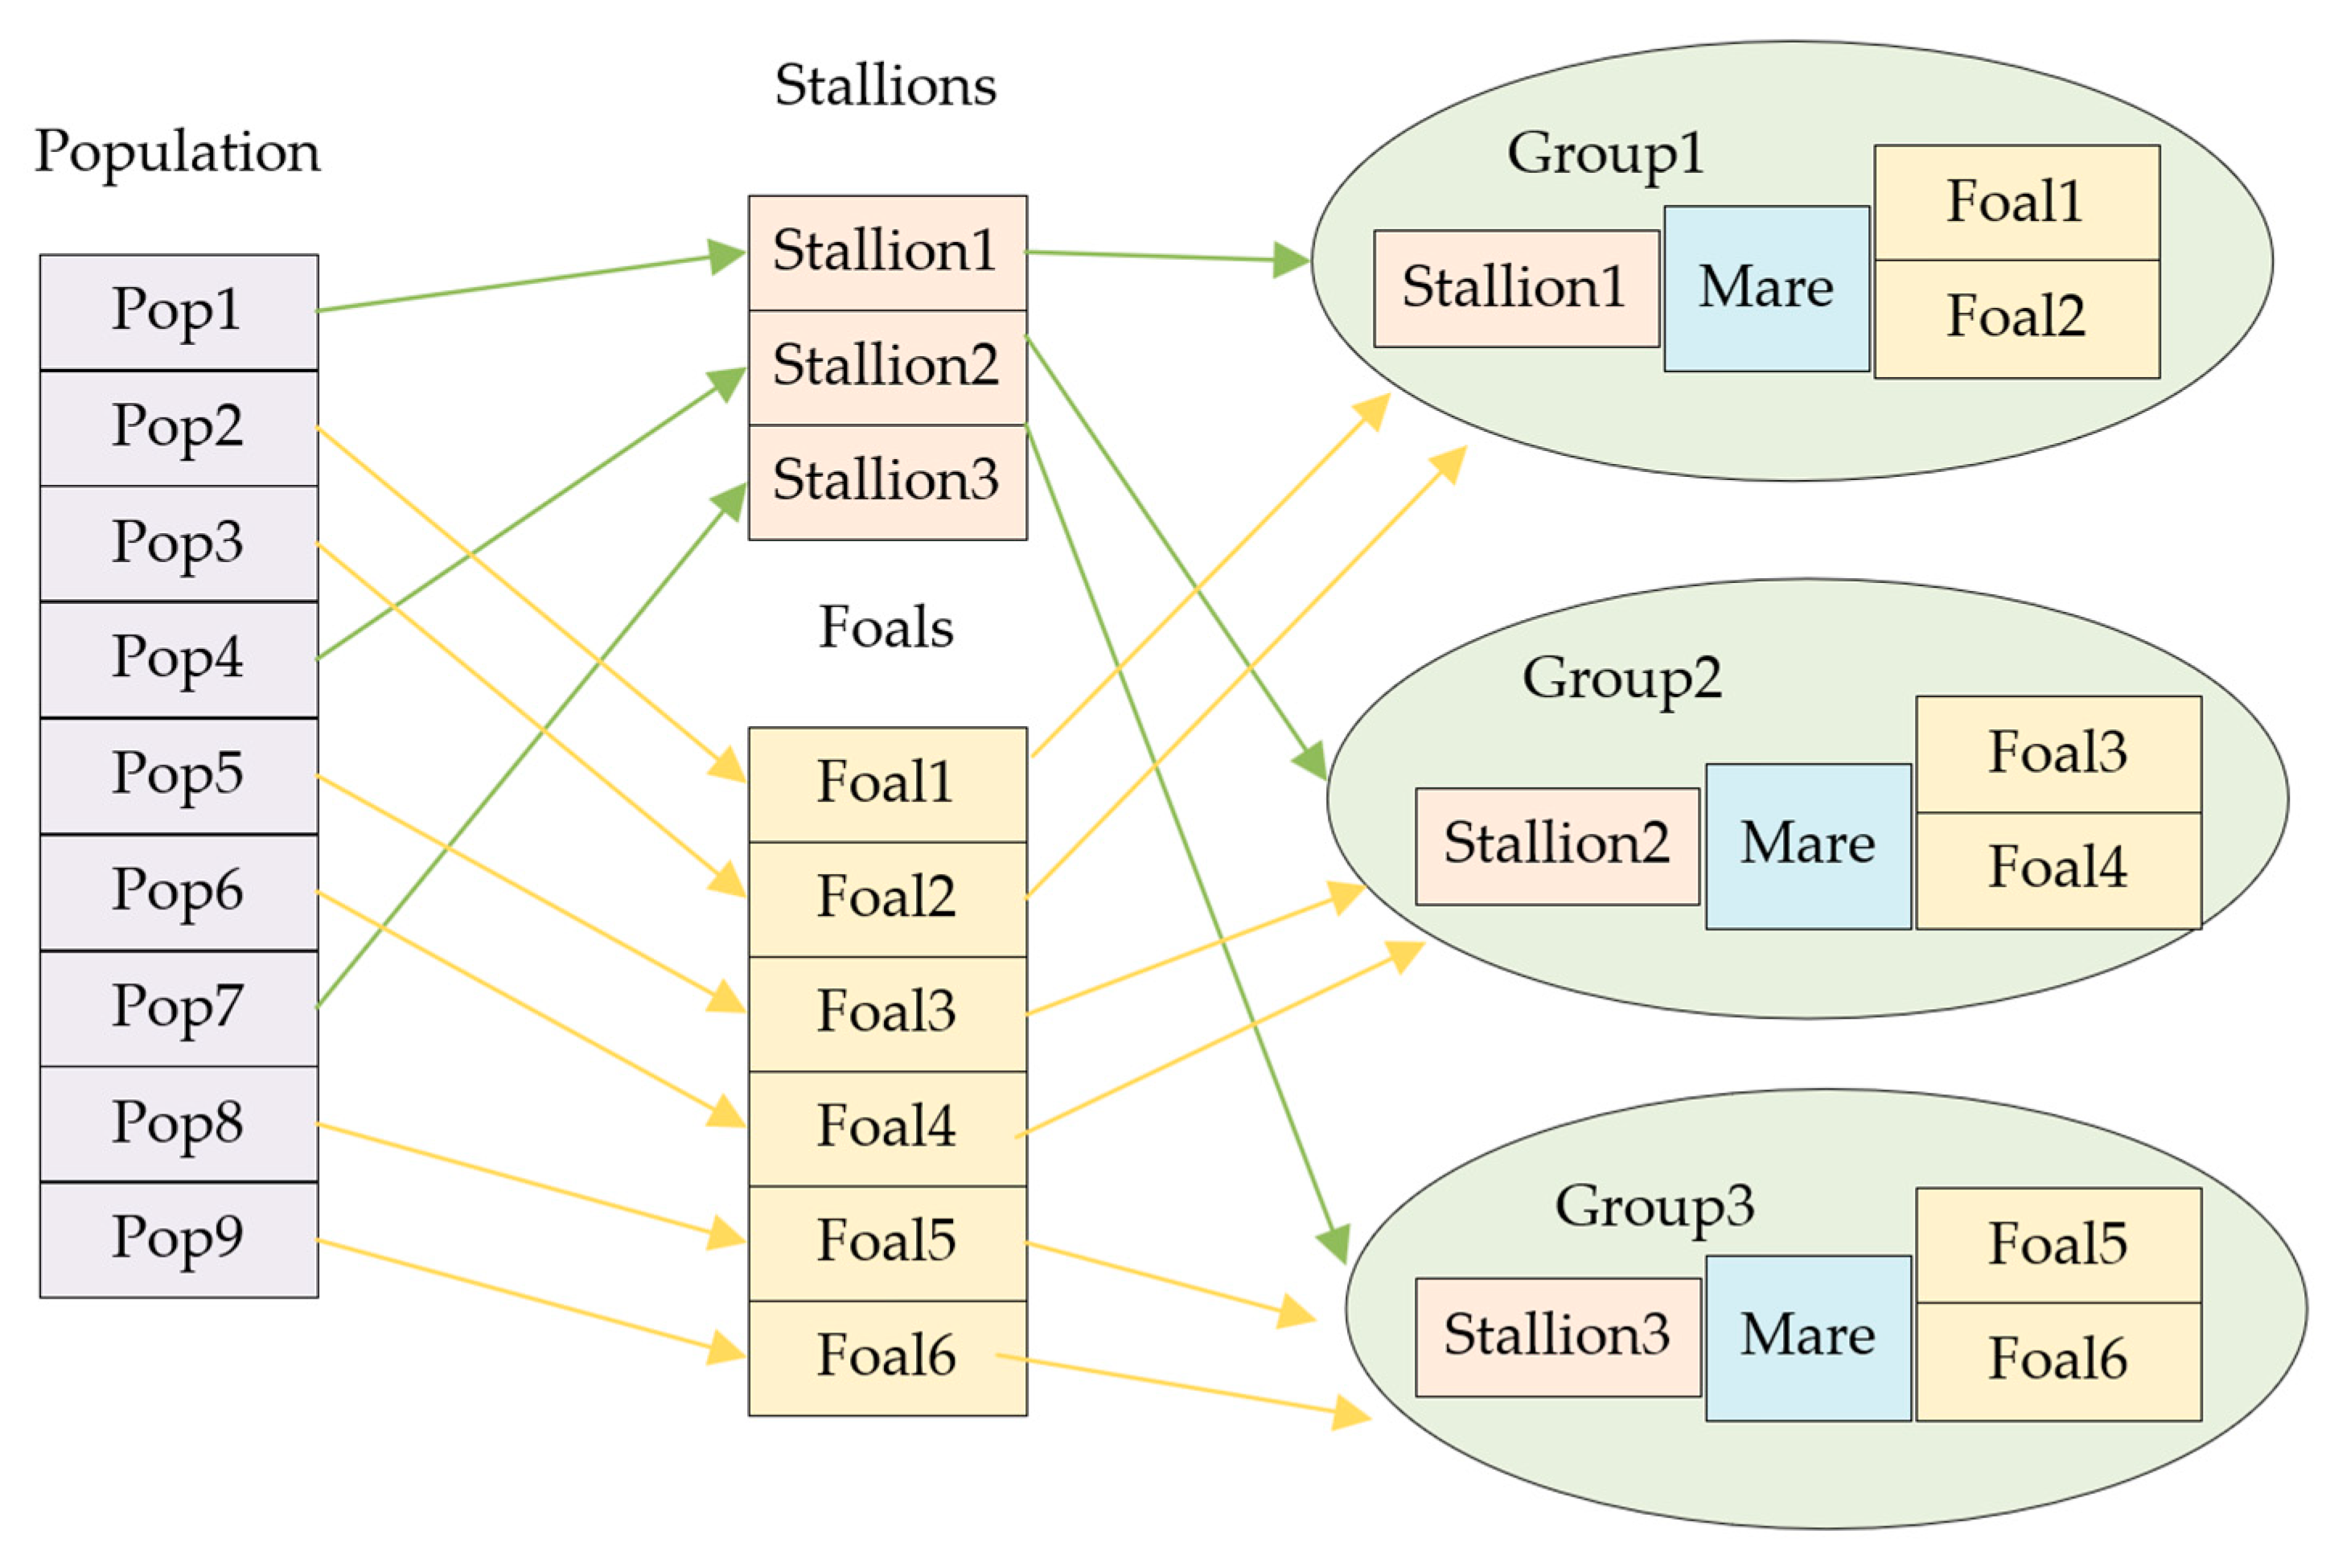
2.1. Creating Initial Populations
2.2. Grazing Behavior
2.3. Horse Mating Behavior
2.4. Group Leadership
2.5. Exchange and Selection of Leaders
3. Hybrid-Based Improvement of the Wild Horse Optimizer
3.1. Improved Adaptive Parameters
3.2. Early Warning Mechanism
3.3. Competitive Selection Mechanism
3.4. Hybrid Improvement Strategy
| Algorithm 1 Pseudocode of the I-WHO algorithm |
| 1: Initialize the population of horses randomly by |
| 2: The target function evaluates this random population, and a target value is determined |
| 3: Input |
| 4: The location of a rabbit and its fitness value |
| 5: Calculate the fitness of horses, create foal groups, and select stallions |
| 6: Find the best horse as the optimum |
| 7: while the end criterion is not satisfied do |
| 8: Calculate and by Equation (7) |
| 9: for number of stallions do |
| 10: Calculate by Equation (2) |
| 11: for number of foals of any group do |
| 12: if then |
| 13: Calculate by Equation (9) |
| 14: Calculate by Equation (10) |
| 15: Update the position of the foal by Equation (8) |
| 16: end if |
| 17: end for |
| 18: Calculate by Equation (12) |
| 19: Update the position of the by Equation (12) |
| 20: if then |
| 21: |
| 22: end if |
| 23: Select the stallion by Equation (6) |
| 24: end for |
| 25: Update optimum |
| 26: end while |
4. Experiment and Analysis
4.1. Experiment 1
4.2. Experiment 2
4.3. Experiment 3
4.4. Complexity Characteristic Analysis
- Initialization phase:Initialize the number of leaders and group members:.Initialize the leader and group members: .Initialize the location and cost of each member: .
- The main loop phase:The main loop total number of iterations: .
- Each iteration consists of two main loops:Leader cycle:
- Each leader ranks his group members: .
- Update the group members for each leader: .
Team members cycle:- Each foal herding behavior: .
- Update the location and cost of leaders: .
- Overall complexity:
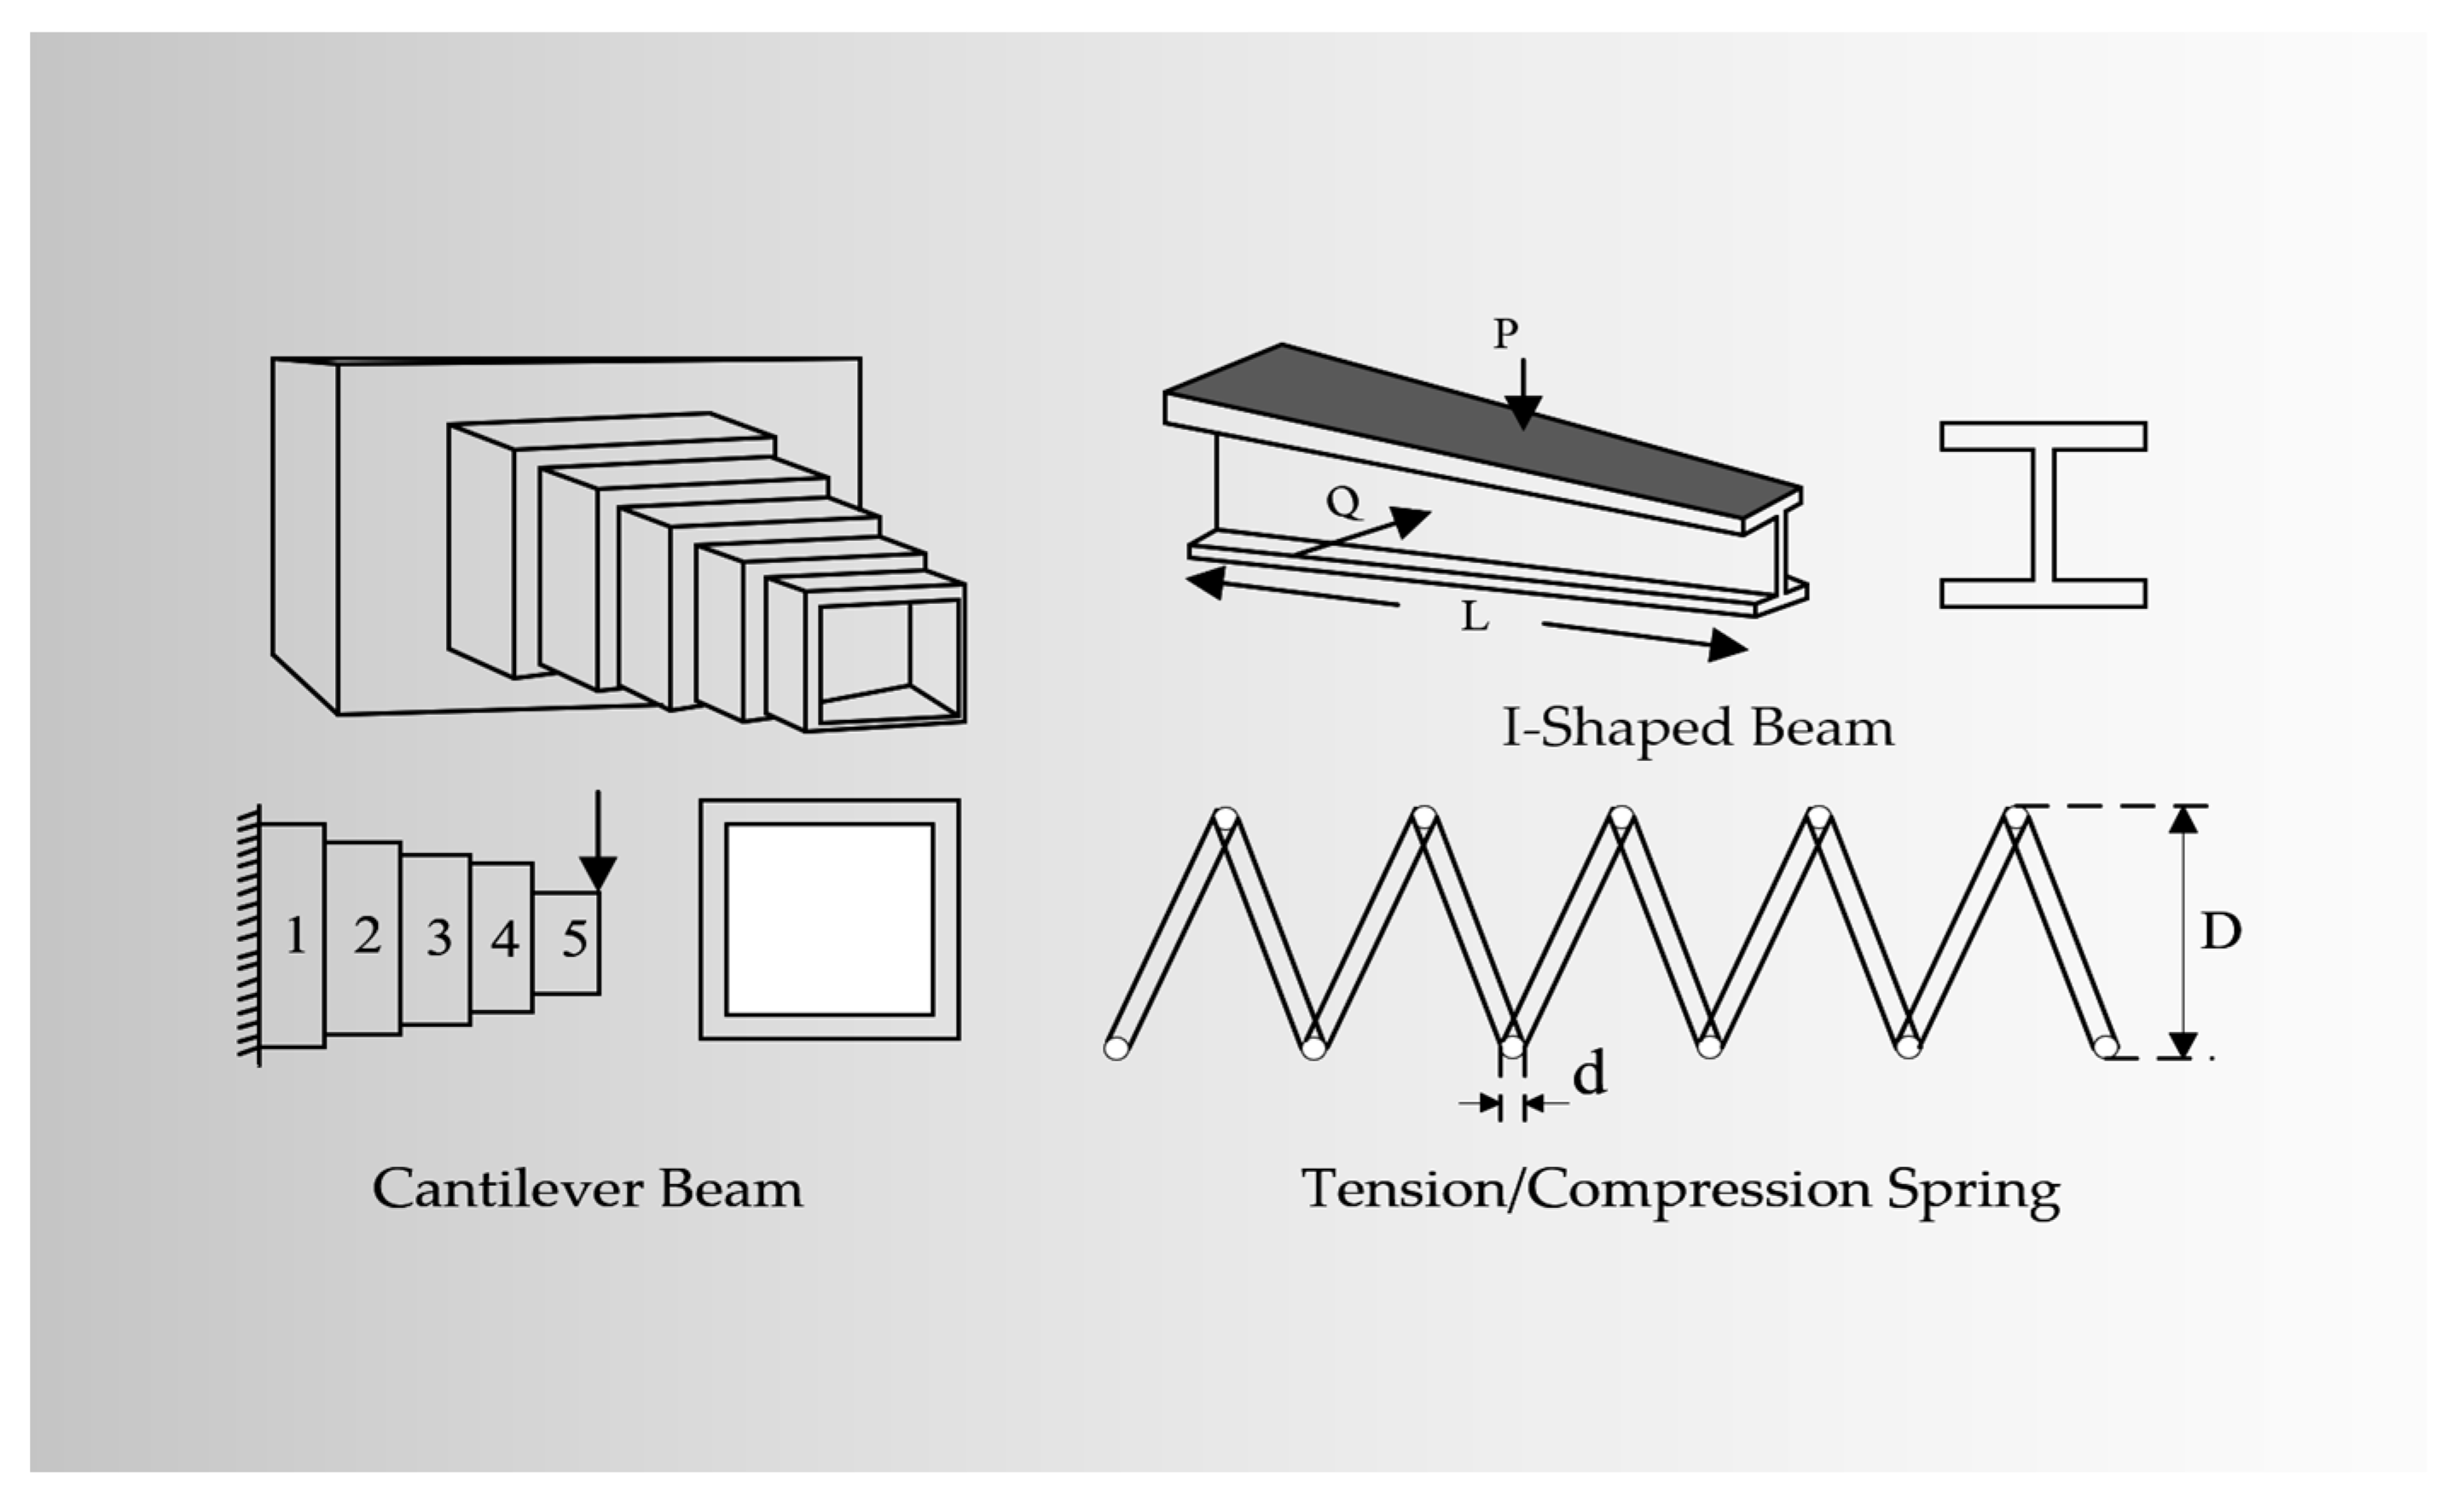
5. Engineering Design Problems
- The best index refers to the optimal solution obtained by multiple runs of the algorithm in the experiment.
- The worst indicators are experimental algorithms run multiple times to get the worst solution. Through the lower limit index, we can clearly understand the performance of the algorithm.
- The average index is the average result obtained by multiple runs of the algorithm in the experiment, which can directly reflect the overall performance of the algorithm and avoid the randomness and contingency of the experiment.
- The standard deviation index refers to access to the solution of the distribution condition. The smaller the value, the higher the results of the algorithm, which is more stable.
- The median index is the median of the results of multiple runs of each algorithm in the experiment, which can intuitively reflect the stability of the algorithm.
5.1. Cantilever Beam
- Minimize:
- Subject to:
- Variable range:
5.2. Optimal Design of I-Shaped Beam
- Minimize:
- Subject to:
- Variable range:
5.3. Design of Tension/Compression Spring
- Minimize:
- Subject to:
- Variable range:
5.4. Car Side Impact Design
- Minimize:
- Subject to:
- Variable range:
6. Conclusions
- The random operator is added to improve the adaptive parameters;
- An early warning strategy is proposed to enhance the position update formula;
- A competitive selection mechanism is proposed to update the search agent position formula.
Author Contributions
Funding
Data Availability Statement
Acknowledgments
Conflicts of Interest
References
- Kang, H.; Liu, R.; Yao, Y.; Yu, F. Improved Harris hawks optimization for non-convex function optimization and design optimization problems. Math. Comput. Simul. 2023, 204, 619–639. [Google Scholar] [CrossRef]
- Agarwal, N.; Shrivastava, N.; Pradhan, M. Ananya Algorithm: A Simple and New Optimization Algorithm for Engineering Optimization. In Proceedings of the 2021 4th Biennial International Conference on Nascent Technologies in Engineering (ICNTE), Navi Mumbai, India, 15–16 January 2021; pp. 1–6. [Google Scholar]
- Kohli, M.; Arora, S. Chaotic grey wolf optimization algorithm for constrained optimization problems. J. Comput. Des. Eng. 2018, 5, 458–472. [Google Scholar] [CrossRef]
- Khalid, O.W.; Isa, N.A.M.; Sakim, H.A.M. Emperor penguin optimizer: A comprehensive review based on state-of-the-art meta-heuristic algorithms. Alex. Eng. J. 2023, 63, 487–526. [Google Scholar] [CrossRef]
- Kaveh, M.; Mesgari, M.S.; Saeidian, B. Orchard Algorithm (OA): A New Meta-Heuristic Algorithm for Solving Discrete and Continuous Optimization Problems. Math. Comput. Simul. 2023, 208, 95–135. [Google Scholar] [CrossRef]
- Eslami, N.; Yazdani, S.; Mirzaei, M.; Hadavandi, E. Aphid–Ant Mutualism: A novel nature-inspired metaheuristic algorithm for solving optimization problems. Math. Comput. Simul. 2022, 201, 362–395. [Google Scholar] [CrossRef]
- Hashim, F.A.; Houssein, E.H.; Hussain, K.; Mabrouk, M.S.; Al-Atabany, W. Honey Badger Algorithm: New metaheuristic algorithm for solving optimization problems. Math. Comput. Simul. 2022, 192, 84–110. [Google Scholar] [CrossRef]
- Abualigah, L.; Diabat, A.; Mirjalili, S.; Abd Elaziz, M.; Gandomi, A.H. The Arithmetic Optimization Algorithm. Comput. Methods Appl. Mech. Eng. 2021, 376, 113609. [Google Scholar] [CrossRef]
- Grefenstette, J.J. Genetic algorithms and machine learning. In Proceedings of the Sixth Annual Conference on Computational Learning Theory, Santa Cruz, CA, USA, 26–28 July 1993; pp. 3–4. [Google Scholar]
- Storn, R.; Price, K. Differential Evolution—A Simple and Efficient Heuristic for Global Optimization Over Continuous Spaces. J. Glob. Optim. 1997, 11, 341–359. [Google Scholar] [CrossRef]
- Eberhart, R.; Kennedy, J. A new optimizer using particle swarm theory. In Proceedings of the 6th International Symposium on Micro Machine and Human Science (MHS’95), Nagoya, Japan, 4–6 October 1995; pp. 39–43. [Google Scholar]
- Blum, C. Ant Colony Optimization: Introduction and Recent Trends. Phys. Life Rev. 2005, 2, 353–373. [Google Scholar] [CrossRef]
- Karaboga, D.; Basturk, B. A Powerful and Efficient Algorithm for Numerical Function Optimization: Artificial Bee Colony (ABC) Algorithm. J. Glob. Optim. 2007, 39, 459–471. [Google Scholar] [CrossRef]
- Mirjalili, S.; Mirjalili, S.M.; Lewis, A. Grey Wolf Optimizer. Adv. Eng. Softw. 2014, 69, 46–61. [Google Scholar] [CrossRef]
- Reddy, K.; Saha, A.K. A Modified Whale Optimization Algorithm for Exploitation Capability and Stability Enhancement. Heliyon 2022, 8, e11027. [Google Scholar] [CrossRef]
- Askari, Q.; Younas, I.; Saeed, M. Political Optimizer: A Novel Socio-Inspired Meta-Heuristic for Global Optimization. Knowledge-Based Syst. 2020, 195, 105709. [Google Scholar] [CrossRef]
- Yang, Y.; Chen, H.; Heidari, A.A.; Gandomi, A.H. Hunger Games Search: Visions, Conception, Implementation, Deep Analysis, Perspectives, and Towards Performance Shifts. Expert Syst. Appl. 2021, 177, 114864. [Google Scholar] [CrossRef]
- Das, B.; Mukherjee, V.; Das, D. Student psychology based optimization algorithm: A new population based optimization algorithm for solving optimization problems. Adv. Eng. Softw. 2020, 146, 102804. [Google Scholar] [CrossRef]
- Qais, M.H.; Hasanien, H.M.; Alghuwainem, S. Transient Search Optimization: A New Meta-Heuristic Optimization Algorithm. Appl. Intell. 2020, 50, 3926–3941. [Google Scholar] [CrossRef]
- Rashedi, E.; Nezamabadi-Pour, H.; Saryazdi, S. BGSA: Binary Gravitational Search Algorithm. Nat. Comput. 2010, 9, 727–745. [Google Scholar] [CrossRef]
- Yuan, X.; Dai, X.; Zhao, J.; He, Q. On a Novel Multi-Swarm Fruit Fly Optimization Algorithm and Its Application. Appl. Math. Comput. 2014, 233, 260–271. [Google Scholar] [CrossRef]
- Tubishat, M.; Idris, N.; Shuib, L.; Abushariah, M.A.; Mirjalili, S. Improved Salp Swarm Algorithm Based on Opposition Based Learning and Novel Local Search Algorithm for Feature Selection. Expert Syst. Appl. 2020, 145, 113122. [Google Scholar] [CrossRef]
- Chakraborty, S.; Saha, A.K.; Sharma, S.; Mirjalili, S.; Chakraborty, R. A Novel Enhanced Whale Optimization Algorithm for Global Optimization. Comput. Ind. Eng. 2021, 153, 107086. [Google Scholar] [CrossRef]
- Nadimi-Shahraki, M.H.; Taghian, S.; Mirjalili, S. An Improved Grey Wolf Optimizer for Solving Engineering Problems. Expert Syst. Appl. 2021, 166, 113917. [Google Scholar] [CrossRef]
- Mirjalili, S. SCA: A sine cosine algorithm for solving optimization problems. Knowl.-Based Syst. 2016, 96, 120–133. [Google Scholar] [CrossRef]
- Naruei, I.; Keynia, F. Wild Horse Optimizer: A New Meta-Heuristic Algorithm for Solving Engineering Optimization Problems. Eng. Comput. 2022, 38, 3025–3056. [Google Scholar] [CrossRef]
- Khudhair, M.; Ragab, M.; AboRas, K.M.; Abbasy, N.H. Robust control of frequency variations for a multi-area power system in smart grid using a newly wild horse optimized combination of PIDD2 and PD controllers. Sustainability 2022, 14, 8223. [Google Scholar] [CrossRef]
- Rao, C.S.P.; Pandian, A.; Reddy, C.R.; Aymen, F.; Alqarni, M.; Alharthi, M.M. Location Determination of Electric Vehicles Parking Lot with Distribution System by Mexican AXOLOTL Optimization and Wild Horse Optimizer. IEEE Access 2022, 10, 55408–55427. [Google Scholar] [CrossRef]
- Ramadan, A.; Kamel, S.; Taha, I.B.; Tostado-Véliz, M. Parameter estimation of modified double-diode and triple-diode photo- voltaic models based on wild horse optimizer. Electronics 2021, 10, 2308. [Google Scholar] [CrossRef]
- Marzouk, R.; Alzahrani, J.S.; Alrowais, F.; Al-Wesabi, F.N.; Hamza, M.A. Quasi-Oppositional Wild Horse Optimization Based Multi-Agent Path Finding Scheme for Real Time IoT Systems. Expert Syst. 2022, 39, e13112. [Google Scholar] [CrossRef]
- Alabdulkreem, E.; Alzahrani, J.S.; Nemri, N.; Alharbi, O.; Mohamed, A.; Marzouk, R.; Hilal, A.M. Computational Intelligence with Wild Horse Optimization Based Object Recognition and Classification Model for Autonomous Driving Systems. Appl. Sci. 2022, 12, 6249. [Google Scholar] [CrossRef]
- Zheng, R.; Hussien, A.G.; Jia, H.M.; Abualigah, L.; Wang, S.; Wu, D. An improved wild horse optimizer for solving optimization problems. Mathematics 2022, 10, 1311. [Google Scholar] [CrossRef]
- Li, Y.; Yuan, Q.; Han, M.; Cui, R. Hybrid Multi-Strategy Improved Wild Horse Optimizer. Adv. Intell. Syst. 2022, 4, 2200097. [Google Scholar] [CrossRef]
- Lan, R.; Zhu, Y.; Lu, H.; Tang, Z.; Liu, Z.; Luo, X. Large-Scale Optimisation via Cooperatively Coevolving Competition Swarm Optimiser. Enterp. Inf. Syst. 2020, 14, 1439–1456. [Google Scholar] [CrossRef]
- Han, F.; Zheng, M.; Ling, Q. An Improved Multiobjective Particle Swarm Optimization Algorithm Based on Tripartite Competition Mechanism. Appl. Intell. 2022, 52, 5784–5816. [Google Scholar] [CrossRef]
- Hosseini, S.; Al Khaled, A. A survey on the imperialist competitive algorithm metaheuristic: Implementation in engineering domain and directions for future research. Appl. Soft Comput. 2014, 24, 1078–1094. [Google Scholar] [CrossRef]
- Seck-Tuoh-Mora, J.C.; Hernandez-Romero, N.; Santander-Baños, F.; Volpi-Leon, V.; Medina-Marin, J.; Lagos-Eulogio, P. A Majority–Minority Cellular Automata Algorithm for Global Optimization. Expert Syst. Appl. 2022, 203, 117379. [Google Scholar] [CrossRef]
- Kiran, M.S.; Hakli, H.; Gunduz, M.; Uguz, H. Artificial bee colony algorithm with variable search strategy for continuous optimization. Inf. Sci. 2015, 300, 140–157. [Google Scholar] [CrossRef]
- Arora, S.; Singh, S. Butterfly Optimization Algorithm: A Novel Approach for Global Optimization. Soft Comput. 2019, 23, 715–734. [Google Scholar] [CrossRef]
- Heidari, A.A.; Mirjalili, S.; Faris, H.; Aljarah, I.; Mafarja, M.; Chen, H. Harris Hawks Optimization: Algorithm and Applications. Futur. Gener. Comput. Syst. 2019, 97, 849–872. [Google Scholar] [CrossRef]
- Zhao, S.; Zhang, T.; Ma, S.; Wang, M. Sea-Horse Optimizer: A Novel Nature-Inspired Meta-Heuristic for Global Optimization Problems. Appl. Intell. 2023, 53, 11833–11860. [Google Scholar] [CrossRef]
- Hussain, K.; Zhu, W.; Salleh, M.N.M. Long-Term Memory Harris’ Hawk Optimization for High Dimensional and Optimal Power Flow Problems. IEEE Access 2019, 7, 147596–147616. [Google Scholar] [CrossRef]
- Derrac, J.; García, S.; Molina, D.; Herrera, F. A Practical Tutorial on the Use of Nonparametric Statistical Tests as a Methodology for Comparing Evolutionary and Swarm Intelligence Algorithms. Swarm Evol. Comput. 2011, 1, 3–18. [Google Scholar] [CrossRef]
- Hao, Y.; Zhang, M.; Cui, Y.; Cheng, G.; Xie, J.; Chen, Y. Dynamic analysis of variable fractional order cantilever beam based on shifted Legendre polynomials algorithm. J. Comput. Appl. Math. 2023, 423, 114952. [Google Scholar] [CrossRef]
- Xiong, X.; He, L.; Bao, L. Experimental Study on Flexural Behavior of Full-Scale Retard-Bonded Prestressed UHPC Variable section Cantilever Beams. Eng. Struct. 2023, 284, 115943. [Google Scholar] [CrossRef]
- Couto, C.; Real, P.V. Numerical investigation on the influence of imperfections in the lateral-torsional buckling of beams with slender I-shaped welded sections. Thin-Walled Struct. 2019, 145, 106429. [Google Scholar] [CrossRef]
- Tzanetos, A.; Blondin, M. A Qualitative Systematic Review of Metaheuristics Applied to Tension/Compression Spring Design Problem: Current Situation, Recommendations, and Research Direction. Eng. Appl. Artif. Intell. 2023, 118, 105521. [Google Scholar] [CrossRef]
- Lim, T.S.; Gil Lee, D. Mechanically fastened composite side-door impact beams for passenger cars designed for shear-out failure modes. Compos. Struct. 2002, 56, 211–221. [Google Scholar] [CrossRef]


| Function Name | Formula | Dim | Range | |
|---|---|---|---|---|
| Brown | 30, 60, 90, 500 | 0 | ||
| Powell 2 | 30, 60, 90, 500 | 0 | ||
| Powell Sum | 30, 60, 90, 500 | 0 | ||
| Quartic | 30, 60, 90, 500 | 0 | ||
| Rosenbrock | 30, 60, 90, 500 | 0 | ||
| Schwefel 1.2 | 30, 60, 90, 500 | 0 | ||
| Schwefel 2.20 | 30, 60, 90, 500 | 0 | ||
| Schwefel 2.21 | 30, 60, 90, 500 | 0 | ||
| Schwefel 2.22 | 30, 60, 90, 500 | 0 | ||
| Schwefel 2.23 | 30, 60, 90, 500 | 0 | ||
| Sphere | 30, 60, 90, 500 | 0 | ||
| Step 2 | 30, 60, 90, 500 | 0 | ||
| Sum Squares | 30, 60, 90, 500 | 0 | ||
| Zakharov | 30, 60, 90, 500 | 0 |
| Function Name | Formula | Dim | Range | |
|---|---|---|---|---|
| Ackley 1 | 30, 60, 90, 500 | 0 | ||
| Alpine 1 | 30, 60, 90, 500 | 0 | ||
| High Conditioned Elliptic | 30, 60, 90, 500 | 0 | ||
| Griewank | 30, 60, 90, 500 | 0 | ||
| Happy Cat | 30, 60, 90, 500 | 0 | ||
| Levy | . | 30, 60, 90, 500 | 0 | |
| Pathological | 30, 60, 90, 500 | 0 | ||
| Rastrigin | 30, 60, 90, 500 | 0 | ||
| Salomon | 30, 60, 90, 500 | 0 | ||
| Schwefel 2.26 | 30, 60, 90, 500 | −418.983 | ||
| Wavy 1 | 30, 60, 90, 500 | 0 |
| Function | WHO | RWHO | EWHO | CWHO | I-WHO | |
|---|---|---|---|---|---|---|
| F1 | Mean | 2.44 × 10−45 | 4.79 × 10−113 | 3.71 × 10−59 | 3.25 × 10−299 | 0 |
| Min | 1.45 × 10−55 | 4.67 × 10−131 | 1.03 × 10−67 | 0 | 0 | |
| Std | 1.21 × 10−44 | 2.60 × 10−112 | 1.40 × 10−58 | 0 | 0 | |
| F2 | Mean | 1.85 × 10⁻¹⁴ | 6.03 × 10−106 | 1.54 × 10−46 | 7.09 × 10−98 | 0 |
| Min | 4.58 × 10−39 | 8.13 × 10−135 | 3.93 × 10−60 | 0 | 0 | |
| Std | 9.47 × 10⁻¹⁴ | 3.03 × 10−105 | 5.97 × 10−46 | 3.88 × 10−97 | 0 | |
| F3 | Mean | 4.52 × 10−116 | 2.35 × 10−188 | 2.86 × 10−97 | 0 | 0 |
| Min | 4.53 × 10−138 | 1.34 × 10−227 | 2.38 × 10−144 | 0 | 0 | |
| Std | 2.47 × 10−115 | 0 | 1.57 × 10−96 | 0 | 0 | |
| F4 | Mean | 1.05 × 10−84 | 1.38 × 10−220 | 7.79 × 10−101 | 0 | 0 |
| Min | 3.47 × 10−102 | 5.59 × 10−265 | 0 | 0 | 0 | |
| Std | 5.61 × 10−84 | 0 | 4.27 × 10−100 | 0 | 0 | |
| F5 | Mean | 3.10 × 101 | 2.74 × 101 | 1.08 × 101 | 2.64 × 101 | 5.12 |
| Min | 2.60 × 101 | 2.65 × 101 | 5.71 × 10⁴ | 2.58 × 101 | 2.48 × 10⁻⁴ | |
| Std | 1.86 × 101 | 6.01 × 10⁻¹ | 1.33 × 101 | 4.08 × 10⁻¹ | 1.01 × 101 | |
| F6 | Mean | 3.88 × 10⁻²⁵ | 9.88 × 10−104 | 2.73 × 10⁻²² | 5.26 × 10−178 | 0 |
| Min | 3.98 × 10⁻³⁴ | 2.88 × 10−125 | 4.17 × 10⁻³⁴ | 1.75 × 10−255 | 0 | |
| Std | 1.09 × 10⁻²⁴ | 5.00 × 10−103 | 1.37 × 10⁻²¹ | 0 | 0 | |
| F7 | Mean | 6.04 × 10⁻²⁴ | 1.06 × 10−56 | 3.42 × 10⁻³⁰ | 5.16 × 10−163 | 7.32 × 10−291 |
| Min | 1.64 × 10⁻²⁸ | 5.63 × 10−65 | 0 | 2.31 × 10−192 | 0 | |
| Std | 2.19 × 10⁻²³ | 3.61 × 10−56 | 1.11 × 10⁻²⁹ | 3.14 × 10−162 | 0 | |
| F8 | Mean | 1.44 × 10⁻¹⁷ | 1.11 × 10−50 | 4.03 × 10⁻²³ | 3.43 × 10−114 | 2.56 × 10−276 |
| Min | 5.43 × 10⁻²⁰ | 1.21 × 10−61 | 0 | 1.46 × 10−143 | 0 | |
| Std | 3.04 × 10⁻¹⁷ | 4.65 × 10−50 | 1.66 × 10⁻²² | 1.88 × 10−113 | 0 | |
| F9 | Mean | 1.13 × 10² | 1.57 × 10² | 3.60 × 10⁻³⁰ | 4.17 × 10−163 | 9.85 × 10−279 |
| Min | 1.08 × 10⁻²⁵ | 3.29 × 10−67 | 0 | 3.54 × 10−186 | 0 | |
| Std | 2.17 × 10² | 2.60 × 10² | 9.56 × 10⁻³⁰ | 2.22 × 10−162 | 0 | |
| F10 | Mean | 2.04 × 10−166 | 0 | 9.33 × 10−218 | 0 | 0 |
| Min | 7.05 × 10−221 | 0 | 0 | 0 | 0 | |
| Std | 0 | 0 | 0 | 0 | 0 | |
| F11 | Mean | 1.23 × 10−43 | 1.14 × 10−111 | 4.11 × 10−55 | 1.65 × 10−287 | 0 |
| Min | 1.56 × 10−52 | 2.01 × 10−127 | 0 | 0 | 0 | |
| Std | 3.93 × 10−43 | 4.45 × 10−111 | 2.22 × 10−54 | 0 | 0 | |
| F12 | Mean | 0 | 0 | 0 | 0 | 0 |
| Min | 0 | 0 | 0 | 0 | 0 | |
| Std | 0 | 0 | 0 | 0 | 0 | |
| F13 | Mean | 6.73 × 10−44 | 1.35 × 10−105 | 7.91 × 10−55 | 1.09 × 10−284 | 0 |
| Min | 4.04 × 10−50 | 7.84 × 10−132 | 0 | 0 | 0 | |
| Std | 2.34 × 10−43 | 7.41 × 10−105 | 3.54 × 10−54 | 0 | 0 | |
| F14 | Mean | 3.77 × 10⁻²¹ | 4.55 × 10−77 | 4.61 × 10⁻¹¹ | 1.21 × 10−144 | 0 |
| Min | 9.34 × 10⁻²⁹ | 3.17 × 10−120 | 1.34 × 10⁻²⁶ | 4.49 × 10−224 | 0 | |
| Std | 1.51 × 10⁻²⁰ | 2.49 × 10−76 | 2.53 × 10⁻¹⁰ | 5.58 × 10−144 | 0 | |
| F15 | Mean | 1.04 × 10⁻¹⁵ | 5.63 × 10⁻¹⁶ | 6.81 × 10⁻¹⁶ | 4.44 × 10⁻¹⁶ | 4.44 × 10⁻¹⁶ |
| Min | 4.44 × 10⁻¹⁶ | 4.44 × 10⁻¹⁶ | 4.44 × 10⁻¹⁶ | 4.44 × 10⁻¹⁶ | 4.44 × 10⁻¹⁶ | |
| Std | 1.35 × 10⁻¹⁵ | 6.49 × 10⁻¹⁶ | 9.01 × 10⁻¹⁶ | 0 | 0 | |
| F16 | Mean | 6.71 × 10⁻² | 2.31 × 10⁻³ | 5.21 × 10⁻⁷ | 1.25 × 10⁻⁶ | 3.90 × 10−291 |
| Min | 5.02 × 10⁻⁵ | 7.69 × 10−71 | 0 | 9.46 × 10−185 | 0 | |
| Std | 2.82 × 10⁻¹ | 3.83 × 10⁻³ | 2.85 × 10⁻⁶ | 6.85 × 10⁻⁶ | 0 | |
| F17 | Mean | 6.19 × 10−39 | 1.65 × 10−107 | 1.95 × 10−49 | 6.43 × 10−293 | 0 |
| Min | 4.21 × 10−47 | 2.54 × 10−122 | 1.65 × 10−59 | 0 | 0 | |
| Std | 3.19 × 10−38 | 8.98 × 10−107 | 1.05 × 10−48 | 0 | 0 | |
| F18 | Mean | 0 | 0 | 0 | 0 | 0 |
| Min | 0 | 0 | 0 | 0 | 0 | |
| Std | 0 | 0 | 0 | 0 | 0 | |
| F19 | Mean | 4.56 × 10⁻¹ | 6.37 × 10⁻¹ | 1.70 × 10⁻¹ | 5.38 × 10⁻¹ | 1.86 × 10⁻¹ |
| Min | 2.69 × 10⁻¹ | 3.82 × 10⁻¹ | 3.88 × 10⁻² | 4.51 × 10⁻¹ | 4.61 × 10⁻² | |
| Std | 1.01 × 10⁻¹ | 1.22 × 10⁻¹ | 5.41 × 10⁻² | 5.79 × 10⁻² | 9.59 × 10⁻² | |
| F20 | Mean | 2.32 | 1.71 | 8.48 × 10⁻³ | 5.02 × 10⁻¹ | 1.09 × 10⁻² |
| Min | 9.21 × 10⁻⁶ | 2.12 × 10⁻¹ | 5.91 × 10⁻⁵ | 8.97 × 10⁻² | 2.37 × 10⁻⁴ | |
| Std | 3.51 | 1.96 | 2.30 × 10⁻² | 2.02 × 10⁻¹ | 1.89 × 10⁻² | |
| F21 | Mean | 9.76 × 10⁻¹ | 2.70 × 10⁻¹ | 1.66 × 10⁻⁷ | 0 | 8.22 × 10⁻⁸ |
| Min | 0 | 0 | 0 | 0 | 0 | |
| Std | 1.63 | 1.48 | 9.07 × 10⁻⁷ | 0 | 3.49 × 10⁻⁷ | |
| F22 | Mean | 4.74 × 10⁻¹⁴ | 0 | 0 | 0 | 0 |
| Min | 0 | 0 | 0 | 0 | 0 | |
| Std | 2.59 × 10⁻¹³ | 0 | 0 | 0 | 0 | |
| F23 | Mean | 1.20 × 10⁻¹ | 2.33 × 10⁻² | 9.99 × 10⁻³ | 6.12 × 10⁻²² | 0 |
| Min | 3.99 × 10⁻¹³ | 4.04 × 10−63 | 0 | 1.40 × 10−127 | 0 | |
| Std | 6.10 × 10⁻² | 4.30 × 10⁻² | 3.05 × 10⁻² | 3.35 × 10⁻²¹ | 0 | |
| F24 | Mean | −2.98 × 10² | −2.47 × 10² | −4.18 × 10² | −2.85 × 10² | −4.17 × 10² |
| Min | −3.31 × 10² | −3.00 × 10² | −4.19 × 10² | −3.23 × 10² | −4.19 × 10² | |
| Std | 1.94 × 101 | 2.40 × 101 | 3.69 | 1.85 | 6.15 | |
| F25 | Mean | 0 | 0 | 0 | 0 | 0 |
| Min | 0 | 0 | 0 | 0 | 0 | |
| Std | 0 | 0 | 0 | 0 | 0 |
| Function | WHO | RWHO | EWHO | CWHO | I-WHO | |
|---|---|---|---|---|---|---|
| F1 | Mean | 1.07 × 10−39 | 1.90 × 10−107 | 3.42 × 10−56 | 1.40 × 10−287 | 0 |
| Min | 9.35 × 10−48 | 4.31 × 10−132 | 3.07 × 10−66 | 0 | 0 | |
| Std | 5.76 × 10−39 | 1.00 × 10−106 | 1.35 × 10−55 | 0 | 0 | |
| F2 | Mean | 5.43 × 10⁻³³ | 3.89 × 10−107 | 2.27 × 10−49 | 1.26 × 10−222 | 0 |
| Min | 1.43 × 10−43 | 3.27 × 10−125 | 1.29 × 10−62 | 0 | 0 | |
| Std | 2.97 × 10⁻³² | 1.69 × 10−106 | 8.64 × 10−49 | 0 | 0 | |
| F3 | Mean | 3.13 × 10−113 | 6.76 × 10−193 | 3.72 × 10−101 | 5.93 × 10−241 | 0 |
| Min | 9.82 × 10−136 | 8.88 × 10−223 | 7.30 × 10−130 | 0 | 0 | |
| Std | 1.69 × 10−112 | 0 | 1.99 × 10−100 | 0 | 0 | |
| F4 | Mean | 4.58 × 10−71 | 1.17 × 10−208 | 1.85 × 10−102 | 0 | 0 |
| Min | 4.23 × 10−90 | 9.65 × 10−256 | 0 | 0 | 0 | |
| Std | 2.48 × 10−70 | 0 | 1.01 × 10−101 | 0 | 0 | |
| F5 | Mean | 8.70 × 101 | 5.80 × 101 | 3.08 × 101 | 5.74 × 101 | 1.21 × 101 |
| Min | 5.65 × 101 | 5.67 × 101 | 1.80 × 10⁻² | 5.60 × 101 | 6.80 × 10⁻⁵ | |
| Std | 8.39 × 101 | 5.79 × 10⁻¹ | 2.87 × 101 | 9.11 × 10⁻¹ | 2.35 × 101 | |
| F6 | Mean | 3.14 × 10⁻²⁰ | 6.60 × 10−96 | 1.55 × 10⁻¹⁴ | 8.80 × 10−69 | 0 |
| Min | 8.35 × 10⁻²⁶ | 6.29 × 10−110 | 1.45 × 10⁻²⁵ | 9.11 × 10−227 | 0 | |
| Std | 6.69 × 10⁻²⁰ | 2.50 × 10−95 | 8.47 × 10⁻¹⁴ | 4.82 × 10−68 | 0 | |
| F7 | Mean | 6.55 × 10⁻²¹ | 1.76 × 10−55 | 1.90 × 10⁻²⁸ | 2.93 × 10−145 | 3.13 × 10−287 |
| Min | 3.02 × 10⁻²⁵ | 3.77 × 10−65 | 0 | 4.54 × 10−176 | 0 | |
| Std | 1.92 × 10⁻²⁰ | 5.68 × 10−55 | 6.37 × 10⁻²⁸ | 1.61 × 10−144 | 0 | |
| F8 | Mean | 2.71 × 10⁻¹⁴ | 3.31 × 10−50 | 2.01 × 10⁻²¹ | 1.01 × 10−70 | 6.03 × 10−273 |
| Min | 2.06 × 10⁻¹⁷ | 4.04 × 10−58 | 0 | 6.17 × 10−138 | 0 | |
| Std | 5.44 × 10⁻¹⁴ | 1.49 × 10−49 | 5.58 × 10⁻²¹ | 5.53 × 10−70 | 0 | |
| F9 | Mean | 3.64 × 10² | 2.67 × 10² | 7.39 × 10⁻²⁸ | 6.05 × 10−155 | 1.31 × 10−271 |
| Min | 3.00 × 10⁻²⁴ | 1.07 × 10−61 | 0 | 4.50 × 10−180 | 0 | |
| Std | 5.85 × 10² | 5.52 × 10² | 2.67 × 10⁻²⁷ | 3.30 × 10−154 | 0 | |
| F10 | Mean | 7.81 × 10−140 | 0 | 1.28 × 10−211 | 0 | 0 |
| Min | 6.68 × 10−178 | 0 | 0 | 0 | 0 | |
| Std | 4.28 × 10−139 | 0 | 0 | 0 | 0 | |
| F11 | Mean | 2.77 × 10−38 | 7.06 × 10−104 | 2.50 × 10−51 | 7.64 × 10−268 | 0 |
| Min | 2.01 × 10−43 | 6.63 × 10−127 | 0 | 0 | 0 | |
| Std | 1.29 × 10−37 | 2.43 × 10−103 | 9.69 × 10−51 | 0 | 0 | |
| F12 | Mean | 0 | 0 | 0 | 0 | 0 |
| Min | 0 | 0 | 0 | 0 | 0 | |
| Std | 0 | 0 | 0 | 0 | 0 | |
| F13 | Mean | 2.78 × 10−36 | 6.20 × 10−105 | 2.44 × 10−51 | 2.73 × 10−275 | 0 |
| Min | 2.65 × 10−44 | 9.18 × 10−126 | 0 | 0 | 0 | |
| Std | 8.82 × 10−36 | 3.38 × 10−104 | 7.29 × 10−51 | 0 | 0 | |
| F14 | Mean | 2.24 × 10⁻¹⁰ | 8.89 × 101 | 2.17 × 101 | 7.27 × 10−74 | 0 |
| Min | 2.14 × 10⁻¹⁸ | 1.56 × 10−112 | 6.94 × 10⁻¹¹ | 4.73 × 10−159 | 0 | |
| Std | 1.04 × 10⁻⁹ | 2.22 × 10² | 1.18 × 10² | 3.98 × 10−73 | 0 | |
| F15 | Mean | 7.99 × 10⁻¹⁶ | 6.81 × 10⁻¹⁶ | 6.81 × 10⁻¹⁶ | 4.44 × 10⁻¹⁶ | 4.44 × 10⁻¹⁶ |
| Min | 4.44 × 10⁻¹⁶ | 4.44 × 10⁻¹⁶ | 4.44 × 10⁻¹⁶ | 4.44 × 10⁻¹⁶ | 4.44 × 10⁻¹⁶ | |
| Std | 1.08 × 10⁻¹⁵ | 9.01 × 10⁻¹⁶ | 9.01 × 10⁻¹⁶ | 0 | 0 | |
| F16 | Mean | 2.12 × 10⁻² | 3.78 × 10⁻³ | 1.67 × 10⁻³⁰ | 4.66 × 10−75 | 1.11 × 10−294 |
| Min | 4.00 × 10⁻²⁴ | 2.34 × 10−65 | 0 | 7.72 × 10−185 | 0 | |
| Std | 2.76 × 10⁻² | 8.52 × 10⁻³ | 5.50 × 10⁻³⁰ | 2.55 × 10−74 | 0 | |
| F17 | Mean | 6.30 × 10⁻³³ | 1.09 × 10−98 | 3.20 × 10−48 | 1.50 × 10−268 | 0 |
| Min | 1.53 × 10−39 | 7.47 × 10−119 | 2.00 × 10−59 | 0 | 0 | |
| Std | 2.93 × 10⁻³² | 4.35 × 10−98 | 1.31 × 10−47 | 0 | 0 | |
| F18 | Mean | 0 | 0 | 0 | 0 | 0 |
| Min | 0 | 0 | 0 | 0 | 0 | |
| Std | 0 | 0 | 0 | 0 | 0 | |
| F19 | Mean | 7.36 × 10⁻¹ | 8.03 × 10⁻¹ | 2.38 × 10⁻¹ | 7.45 × 10⁻¹ | 2.41 × 10⁻¹ |
| Min | 5.72 × 10⁻¹ | 7.10 × 10⁻¹ | 8.34 × 10⁻² | 5.82 × 10⁻¹ | 1.11 × 10⁻² | |
| Std | 8.53 × 10⁻² | 6.38 × 10⁻² | 9.93 × 10⁻² | 8.00 × 10⁻² | 1.60 × 10⁻¹ | |
| F20 | Mean | 5.77 | 4.22 | 4.59 × 10⁻² | 1.96 | 2.77 × 10⁻² |
| Min | 1.11 | 2.13 | 5.49 × 10⁻⁴ | 1.10 | 4.91 × 10⁻⁵ | |
| Std | 5.91 | 5.57 | 6.52 × 10⁻² | 6.95 × 10⁻¹ | 2.99 × 10⁻² | |
| F21 | Mean | 1.89 | 0 | 3.53 × 10⁻¹⁶ | 0 | 4.37 × 10⁻⁷ |
| Min | 0 | 0 | 0 | 0 | 0 | |
| Std | 3.84 | 0 | 1.94 × 10⁻¹⁵ | 0 | 2.39 × 10⁻⁶ | |
| F22 | Mean | 5.79 × 10⁻⁷ | 0 | 0 | 0 | 0 |
| Min | 0 | 0 | 0 | 0 | 0 | |
| Std | 3.17 × 10⁻⁶ | 0 | 0 | 0 | 0 | |
| F23 | Mean | 1.43 × 10⁻¹ | 2.00 × 10⁻² | 9.99 × 10⁻³ | 9.55 × 10⁻⁹ | 0 |
| Min | 9.99 × 10⁻² | 1.08 × 10−60 | 0 | 3.28 × 10−73 | 0 | |
| Std | 1.04 × 10⁻¹ | 4.06 × 10⁻² | 3.05 × 10⁻² | 4.12 × 10⁻⁸ | 0 | |
| F24 | Mean | −2.56 × 10² | −2.23 × 10² | −4.19 × 10² | −2.38 × 10² | −4.18 × 10² |
| Min | −2.92 × 10² | −2.96 × 10² | −4.19 × 10² | −2.61 × 10² | −4.19 × 10² | |
| Std | 1.61 × 101 | 2.91 × 101 | 2.62 × 10⁻³ | 1.13 × 101 | 3.52 | |
| F25 | Mean | 0 | 0 | 0 | 0 | 0 |
| Min | 0 | 0 | 0 | 0 | 0 | |
| Std | 0 | 0 | 0 | 0 | 0 |
| Function | WHO | NWHO | YWHO | TWHO | NYTWHO | |
|---|---|---|---|---|---|---|
| F1 | Mean | 4.94 × 10−40 | 1.03 × 10−107 | 3.38 × 10−55 | 2.46 × 10−267 | 0 |
| Min | 2.45 × 10−46 | 1.00 × 10−129 | 1.27 × 10−62 | 0 | 0 | |
| Std | 1.48 × 10−39 | 5.61 × 10−107 | 9.03 × 10−55 | 0 | 0 | |
| F2 | Mean | 9.62 × 10⁻³⁵ | 8.26 × 10−107 | 1.26 × 10−48 | 2.61 × 10−221 | 0 |
| Min | 4.90 × 10−44 | 3.02 × 10−125 | 5.71 × 10−59 | 0 | 0 | |
| Std | 3.06 × 10⁻³⁴ | 3.33 × 10−106 | 6.80 × 10−48 | 0 | 0 | |
| F3 | Mean | 1.33 × 10−107 | 9.20 × 10−194 | 3.91 × 10−99 | 8.01 × 10−155 | 0 |
| Min | 8.20 × 10−138 | 6.19 × 10−223 | 5.27 × 10−125 | 0 | 0 | |
| Std | 7.29 × 10−107 | 0 | 2.14 × 10−98 | 4.39 × 10−154 | 0 | |
| F4 | Mean | 7.37 × 10−66 | 7.03 × 10−210 | 1.44 × 10−99 | 0 | 0 |
| Min | 3.22 × 10−79 | 4.71 × 10−239 | 0 | 0 | 0 | |
| Std | 2.80 × 10−65 | 0 | 6.77 × 10−99 | 0 | 0 | |
| F5 | Mean | 2.44 × 10² | 8.80 × 101 | 3.91 × 101 | 8.76 × 101 | 2.55 × 101 |
| Min | 8.66 × 101 | 8.68 × 101 | 2.00 × 10⁻³ | 8.62 × 101 | 1.57 × 10⁻² | |
| Std | 8.48 × 10² | 4.63 × 10⁻¹ | 4.32 × 101 | 8.13 × 10⁻¹ | 3.90 × 101 | |
| F6 | Mean | 2.96 × 10⁻¹⁵ | 6.93 × 10−95 | 6.93 × 10⁻¹² | 3.52 × 10−87 | 0 |
| Min | 2.74 × 10⁻²² | 1.07 × 10−115 | 8.94 × 10⁻²⁶ | 8.47 × 10−228 | 0 | |
| Std | 1.60 × 10⁻¹⁴ | 2.69 × 10−94 | 3.70 × 10⁻¹¹ | 1.93 × 10−86 | 0 | |
| F7 | Mean | 2.05 × 10⁻²⁰ | 1.92 × 10−55 | 9.33 × 10⁻²⁸ | 3.74 × 10−154 | 5.62 × 10−283 |
| Min | 5.90 × 10⁻²⁴ | 1.60 × 10−63 | 0 | 2.66 × 10−180 | 0 | |
| Std | 4.38 × 10⁻²⁰ | 7.46 × 10−55 | 4.83 × 10⁻²⁷ | 1.60 × 10−153 | 0 | |
| F8 | Mean | 4.60 × 10⁻¹³ | 1.65 × 10−50 | 1.40 × 10⁻²⁰ | 4.00 × 10−38 | 8.76 × 10−265 |
| Min | 3.59 × 10⁻¹⁶ | 9.35 × 10−60 | 1.22 × 10⁻²³ | 2.40 × 10−99 | 0 | |
| Std | 1.19 × 10⁻¹² | 4.26 × 10−50 | 4.22 × 10⁻²⁰ | 2.19 × 10−37 | 0 | |
| F9 | Mean | 7.23 × 10² | 4.02 × 10² | 5.84 × 10⁻²⁸ | 5.54 × 10−150 | 1.19 × 10−284 |
| Min | 4.95 × 10⁻²⁰ | 1.09 × 10−60 | 0 | 1.19 × 10−175 | 0 | |
| Std | 8.81 × 10² | 8.20 × 10² | 2.04 × 10⁻²⁷ | 3.02 × 10−149 | 0 | |
| F10 | Mean | 1.09 × 10−128 | 0 | 1.27 × 10−212 | 0 | 0 |
| Min | 2.74 × 10−181 | 0 | 0 | 0 | 0 | |
| Std | 5.99 × 10−128 | 0 | 0 | 0 | 0 | |
| F11 | Mean | 8.99 × 10−36 | 3.47 × 10−104 | 3.38 × 10−50 | 5.11 × 10−265 | 0 |
| Min | 2.77 × 10−42 | 2.71 × 10−126 | 0 | 0 | 0 | |
| Std | 2.12 × 10⁻³⁵ | 1.89 × 10−103 | 1.81 × 10−49 | 0 | 0 | |
| F12 | Mean | 0 | 0 | 0 | 0 | 0 |
| Min | 0 | 0 | 0 | 0 | 0 | |
| Std | 0 | 0 | 0 | 0 | 0 | |
| F13 | Mean | 7.91 × 10⁻³⁵ | 1.95 × 10−101 | 3.44 × 10−51 | 2.73 × 10−263 | 0 |
| Min | 6.70 × 10−43 | 2.16 × 10−120 | 0 | 0 | 0 | |
| Std | 2.05 × 10⁻³⁴ | 1.07 × 10−100 | 1.28 × 10−50 | 0 | 0 | |
| F14 | Mean | 9.14 × 101 | 3.23 × 10² | 4.42 × 10² | 6.36 × 10−39 | 0 |
| Min | 1.21 × 10⁻⁸ | 6.59 × 10−101 | 1.46 × 10⁻⁵ | 1.20 × 10−146 | 0 | |
| Std | 2.80 × 10² | 4.48 × 10² | 7.10 × 10² | 3.48 × 10−38 | 0 | |
| F15 | Mean | 1.04 × 10⁻¹⁵ | 6.81 × 10⁻¹⁶ | 9.18 × 10⁻¹⁶ | 4.44 × 10⁻¹⁶ | 4.44 × 10⁻¹⁶ |
| Min | 4.44 × 10⁻¹⁶ | 4.44 × 10⁻¹⁶ | 4.44 × 10⁻¹⁶ | 4.44 × 10⁻¹⁶ | 4.44 × 10⁻¹⁶ | |
| Std | 1.35 × 10⁻¹⁵ | 9.01 × 10⁻¹⁶ | 1.23 × 10⁻¹⁵ | 0 | 0 | |
| F16 | Mean | 7.47 × 10⁻¹ | 3.24 × 10⁻³ | 3.17 × 10⁻²⁹ | 7.91 × 10−135 | 8.16 × 10−285 |
| Min | 5.09 × 10⁻³ | 2.96 × 10−70 | 0 | 5.46 × 10−183 | 0 | |
| Std | 3.84 | 1.30 × 10⁻² | 1.40 × 10⁻²⁸ | 4.33 × 10−134 | 0 | |
| F17 | Mean | 7.96 × 10⁻³³ | 1.38 × 10−101 | 3.48 × 10−48 | 2.07 × 10−274 | 0 |
| Min | 4.93 × 10−42 | 4.65 × 10−118 | 0 | 0 | 0 | |
| Std | 2.38 × 10⁻³² | 7.52 × 10−101 | 1.26 × 10−47 | 0 | 0 | |
| F18 | Mean | 0 | 0 | 0 | 0 | 0 |
| Min | 0 | 0 | 0 | 0 | 0 | |
| Std | 0 | 0 | 0 | 0 | 0 | |
| F19 | Mean | 8.22 × 10⁻¹ | 8.62 × 10⁻¹ | 2.23 × 10⁻¹ | 8.05 × 10⁻¹ | 2.81 × 10⁻¹ |
| Min | 6.59 × 10⁻¹ | 7.17 × 10⁻¹ | 3.62 × 10⁻² | 6.92 × 10⁻¹ | 3.22 × 10⁻² | |
| Std | 7.31 × 10⁻² | 5.65 × 10⁻² | 9.35 × 10⁻² | 6.41 × 10⁻² | 1.20 × 10⁻¹ | |
| F20 | Mean | 1.59 × 101 | 5.32 | 8.30 × 10⁻² | 4.18 | 5.65 × 10⁻² |
| Min | 2.60 | 4.51 | 3.91 × 10⁻³ | 2.92 | 2.15 × 10⁻⁵ | |
| Std | 1.56 × 101 | 3.70 × 10⁻¹ | 1.06 × 10⁻¹ | 1.18 | 5.31 × 10⁻² | |
| F21 | Mean | 2.35 | 0 | 1.41 × 10⁻⁵ | 0 | 7.23 × 10⁻⁶ |
| Min | 0 | 0 | 0 | 0 | 0 | |
| Std | 3.96 | 0 | 7.48 × 10⁻⁵ | 0 | 1.79 × 10⁻⁵ | |
| F22 | Mean | 3.76 × 10⁻¹² | 0 | 0 | 0 | 0 |
| Min | 0 | 0 | 0 | 0 | 0 | |
| Std | 2.03 × 10⁻¹¹ | 0 | 0 | 0 | 0 | |
| F23 | Mean | 1.43 × 10⁻¹ | 1.33 × 10⁻² | 3.33 × 10⁻³ | 1.76 × 10⁻¹⁵ | 0 |
| Min | 9.99 × 10⁻² | 4.35 × 10−62 | 0 | 7.72 × 10−82 | 0 | |
| Std | 7.28 × 10⁻² | 3.45 × 10⁻² | 1.82 × 10⁻² | 7.79 × 10⁻¹⁴ | 0 | |
| F24 | Mean | −2.30 × 10² | −1.92 × 10² | −4.19 × 10² | −2.07 × 10² | −4.19 × 10² |
| Min | −2.61 × 10² | −2.38 × 10² | −4.19 × 10² | −2.24 × 10² | −4.19 × 10² | |
| Std | 1.79 × 101 | 2.00 × 101 | 2.31 × 10⁻³ | 9.33 | 8.40 × 10⁻¹ | |
| F25 | Mean | 1.04 × 10⁻¹⁶ | 0 | 0 | 0 | 0 |
| Min | 0 | 0 | 0 | 0 | 0 | |
| Std | 5.68 × 10⁻¹⁶ | 0 | 0 | 0 | 0 |
| Function | BOA | GWO | SCA | HHO | SHO | SPBO | WHO | RWHO | EWHO | CWHO | I-WHO | |
|---|---|---|---|---|---|---|---|---|---|---|---|---|
| F1 | Mean | 9.82 × 10⁻¹² | 3.91 × 10⁻³⁰ | 3.18 × 10⁻³ | 9.62 × 10−95 | 2.78 × 10−143 | 2.50 × 10−137 | 9.73 × 10−47 | 1.31 × 10−106 | 3.73 × 10−58 | 1.49 × 10−292 | 0 |
| Min | 7.28 × 10⁻¹² | 6.62 × 10⁻³² | 3.06 × 10⁻⁵ | 3.09 × 10−117 | 1.54 × 10−149 | 3.45 × 10−139 | 3.75 × 10−54 | 1.29 × 10−134 | 2.17 × 10−70 | 0 | 0 | |
| Std | 1.11 × 10⁻¹² | 4.17 × 10⁻³⁰ | 5.55 × 10⁻³ | 5.14 × 10−94 | 1.39 × 10−142 | 5.02 × 10−137 | 4.58 × 10−46 | 7.17 × 10−106 | 1.84 × 10−57 | 0 | 0 | |
| F2 | Mean | 9.80 × 10⁻¹² | 1.28 × 10⁻⁵ | 2.22 × 101 | 1.12 × 10−98 | 1.51 × 10−65 | 1.09 × 10⁻³ | 5.99 × 10⁻¹⁵ | 7.75 × 10−109 | 6.86 × 10−43 | 3.16 × 10−58 | 0 |
| Min | 7.54 × 10⁻¹² | 3.76 × 10⁻⁷ | 2.62 × 10⁻² | 1.12 × 10−129 | 8.50 × 10−107 | 6.68 × 10⁻⁴ | 6.03 × 10−39 | 2.28 × 10−134 | 3.65 × 10−61 | 0 | 0 | |
| Std | 9.94 × 10⁻¹³ | 1.27 × 10⁻⁵ | 2.65 × 101 | 4.09 × 10−98 | 8.26 × 10−65 | 2.31 × 10⁻⁴ | 3.28 × 10⁻¹⁴ | 3.48 × 10−108 | 3.76 × 10−42 | 1.73 × 10−57 | 0 | |
| F3 | Mean | 7.47 × 10⁻¹⁴ | 1.35 × 10−94 | 1.92 × 10⁻⁴ | 6.49 × 10−123 | 0 | 1.99 × 10−162 | 1.19 × 10−120 | 8.27 × 10−195 | 4.75 × 10−100 | 0 | 0 |
| Min | 2.52 × 10⁻¹⁴ | 4.50 × 10−110 | 1.84 × 10⁻¹⁰ | 2.28 × 10−151 | 0 | 4.14 × 10−182 | 2.85 × 10−142 | 7.60 × 10−223 | 2.49 × 10−122 | 0 | 0 | |
| Std | 8.69 × 10⁻¹⁴ | 7.33 × 10−94 | 7.87 × 10⁻⁴ | 3.54 × 10−122 | 0 | 8.01 × 10−162 | 5.22 × 10−120 | 0 | 2.55 × 10−99 | 0 | 0 | |
| F4 | Mean | 1.15 × 10⁻¹⁴ | 4.88 × 10−50 | 8.22 × 10⁻³ | 2.00 × 10−183 | 3.15 × 10−262 | 2.59 × 10−272 | 3.18 × 10−84 | 3.43 × 10−209 | 3.14 × 10−106 | 0 | 0 |
| Min | 9.39 × 10⁻¹⁵ | 1.29 × 10−55 | 4.23 × 10⁻⁷ | 1.92 × 10−232 | 2.88 × 10−277 | 3.54 × 10−277 | 1.09 × 10−100 | 7.57 × 10−263 | 0 | 0 | 0 | |
| Std | 1.07 × 10⁻¹⁵ | 1.48 × 10−49 | 2.68 × 10⁻² | 0 | 0 | 0 | 1.66 × 10−83 | 0 | 1.21 × 10−105 | 0 | 0 | |
| F5 | Mean | 2.89 × 101 | 2.70 × 101 | 1.52 × 10⁴ | 1.68 × 10⁻² | 2.82 × 101 | 2.41 | 3.10 × 101 | 2.72 × 101 | 1.17 × 101 | 2.64 × 101 | 4.33 |
| Min | 2.89 × 101 | 2.61 × 101 | 1.23 × 10² | 2.11 × 10⁻⁴ | 2.72 × 101 | 3.04 × 10⁻⁴ | 2.58 × 101 | 2.65 × 101 | 1.66 × 10⁻² | 2.57 × 101 | 8.64 × 10⁻⁶ | |
| Std | 2.34 × 10⁻² | 7.45 × 10⁻¹ | 2.15 × 10⁴ | 2.06 × 10⁻² | 4.90 × 10⁻¹ | 3.92 | 2.01 × 101 | 4.80 × 10⁻¹ | 1.35 × 101 | 5.19 × 10⁻¹ | 9.57 | |
| F6 | Mean | 1.26 × 10⁻¹¹ | 4.75 × 10⁻⁵ | 9.50 × 10³ | 1.61 × 10−71 | 2.20 × 10−99 | 2.25 × 10³ | 1.05 × 10⁻²³ | 1.63 × 10−99 | 2.44 × 10⁻²² | 5.73 × 10−175 | 0 |
| Min | 1.08 × 10⁻¹¹ | 6.99 × 10⁻⁸ | 1.40 × 10³ | 3.63 × 10−101 | 2.20 × 10−106 | 1.03 × 10³ | 9.25 × 10⁻³³ | 8.55 × 10−124 | 5.83 × 10⁻³³ | 1.51 × 10−259 | 0 | |
| Std | 1.03 × 10⁻¹² | 1.39 × 10⁻⁴ | 6.09 × 10³ | 8.66 × 10−71 | 5.74 × 10−99 | 6.62 × 10² | 3.24 × 10⁻²³ | 6.98 × 10−99 | 9.53 × 10⁻²² | 0 | 0 | |
| F7 | Mean | 7.00 × 10⁻⁹ | 8.76 × 10⁻¹⁶ | 2.28 × 10⁻¹ | 1.07 × 10−48 | 9.62 × 10−77 | 7.93 × 10−68 | 4.25 × 10⁻²⁴ | 1.83 × 10−57 | 6.72 × 10⁻³⁰ | 5.70 × 10−165 | 4.60 × 10−288 |
| Min | 6.31 × 10⁻⁹ | 1.88 × 10⁻¹⁶ | 4.80 × 10⁻³ | 1.51 × 10−59 | 3.39 × 10−80 | 2.02 × 10−68 | 6.08 × 10⁻²⁹ | 4.37 × 10−68 | 0 | 2.32 × 10−187 | 0 | |
| Std | 3.82 × 10⁻¹⁰ | 5.74 × 10⁻¹⁶ | 2.34 × 10⁻¹ | 4.08 × 10−48 | 4.05 × 10−76 | 7.77 × 10−68 | 1.38 × 10⁻²³ | 6.46 × 10−57 | 2.96 × 10⁻²⁹ | 0 | 0 | |
| F8 | Mean | 6.04 × 10⁻⁹ | 7.47 × 10⁻⁷ | 3.85 × 101 | 1.03 × 10−48 | 8.24 × 10−57 | 1.97 × 10⁻⁴ | 6.13 × 10⁻¹⁷ | 1.88 × 10−50 | 1.81 × 10⁻²³ | 7.58 × 10−110 | 7.80 × 10−265 |
| Min | 5.12 × 10⁻⁹ | 4.59 × 10⁻⁸ | 1.10 × 101 | 1.70 × 10−56 | 7.97 × 10−60 | 1.25 × 10⁻⁴ | 3.13 × 10⁻²¹ | 9.41 × 10−62 | 0 | 6.36 × 10−148 | 0 | |
| Std | 3.64 × 10⁻¹⁰ | 8.15 × 10⁻⁷ | 1.17 × 101 | 5.45 × 10−48 | 1.69 × 10−56 | 4.40 × 10⁻⁵ | 2.46 × 10⁻¹⁶ | 1.02 × 10−49 | 4.80 × 10⁻²³ | 2.97 × 10−109 | 0 | |
| F9 | Mean | 1.13 × 1043 | 1.58 × 10⁻¹⁵ | 6.93 × 10⁻² | 2.88 × 10−49 | 3.37 × 10−77 | 8.64 × 10−68 | 1.31 × 10² | 3.85 × 101 | 1.17 × 10⁻²⁸ | 1.17 × 10−157 | 1.39 × 10−292 |
| Min | 4.41 × 1037 | 3.67 × 10⁻¹⁶ | 5.78 × 10⁻⁴ | 1.91 × 10−57 | 4.65 × 10−81 | 5.92 × 10−69 | 4.14 × 10⁻²⁶ | 1.10 × 10−66 | 0 | 1.01 × 10−189 | 0 | |
| Std | 3.14 × 1043 | 1.10 × 10⁻¹⁵ | 9.91 × 10⁻² | 1.03 × 10−48 | 7.65 × 10−77 | 5.96 × 10−68 | 2.32 × 10² | 1.62 × 10² | 6.36 × 10⁻²⁸ | 6.43 × 10−157 | 0 | |
| F10 | Mean | 1.44 × 10⁻¹⁹ | 6.89 × 10−81 | 2.18 × 10¹⁵ | 0 | 0 | 0 | 1.39 × 10−159 | 0 | 4.45 × 10−239 | 0 | 0 |
| Min | 6.57 × 10−40 | 2.18 × 10−92 | 3.69 × 10⁹ | 0 | 0 | 0 | 1.75 × 10−225 | 0 | 0 | 0 | 0 | |
| Std | 4.21 × 10⁻¹⁹ | 3.70 × 10−80 | 6.54 × 10¹⁵ | 0 | 0 | 0 | 7.64 × 10−159 | 0 | 0 | 0 | 0 | |
| F11 | Mean | 1.30 × 10⁻¹¹ | 1.47 × 10⁻²⁷ | 2.29 × 101 | 6.56 × 10−99 | 5.49 × 10−141 | 4.15 × 10−134 | 8.74 × 10−43 | 2.98 × 10−113 | 8.38 × 10−56 | 4.87 × 10−292 | 0 |
| Min | 1.12 × 10⁻¹¹ | 3.62 × 10⁻²⁹ | 1.81 × 10⁻¹ | 8.19 × 10−116 | 4.42 × 10−148 | 9.54 × 10−137 | 3.11 × 10−50 | 1.94 × 10−129 | 0 | 0 | 0 | |
| Std | 8.07 × 10⁻¹³ | 2.73 × 10⁻²⁷ | 6.25 × 101 | 2.61 × 10−98 | 1.46 × 10−140 | 1.59 × 10−133 | 3.34 × 10−42 | 1.48 × 10−112 | 3.75 × 10−55 | 0 | 0 | |
| F12 | Mean | 0 | 0 | 1.05 × 101 | 0 | 0 | 0 | 0 | 0 | 0 | 0 | 0 |
| Min | 0 | 0 | 0 | 0 | 0 | 0 | 0 | 0 | 0 | 0 | 0 | |
| Std | 0 | 0 | 1.42 × 101 | 0 | 0 | 0 | 0 | 0 | 0 | 0 | 0 | |
| F13 | Mean | 1.37 × 10⁻¹¹ | 2.34 × 10⁻²⁶ | 1.26 × 10² | 1.09 × 10−91 | 1.15 × 10−139 | 2.47 × 10−133 | 8.23 × 10−41 | 6.11 × 10−109 | 1.29 × 10−52 | 1.25 × 10−282 | 0 |
| Min | 1.18 × 10⁻¹¹ | 1.40 × 10⁻²⁷ | 6.85 × 10⁻² | 2.71 × 10−114 | 1.15 × 10−146 | 3.48 × 10−135 | 1.94 × 10−50 | 9.03 × 10−124 | 0 | 0 | 0 | |
| Std | 8.40 × 10⁻¹³ | 3.52 × 10⁻²⁶ | 2.52 × 10² | 5.87 × 10−91 | 3.26 × 10−139 | 4.73 × 10−133 | 4.17 × 10−40 | 3.23 × 10−108 | 5.44 × 10−52 | 0 | 0 | |
| F14 | Mean | 1.07 × 10⁻¹¹ | 1.12 × 10⁻⁶ | 3.67 × 101 | 3.68 × 10−51 | 1.29 × 10−94 | 1.41 × 10² | 3.96 × 10⁻²¹ | 1.10 × 10−94 | 2.68 × 10⁻¹⁴ | 3.47 × 10−146 | 0 |
| Min | 9.04 × 10⁻¹² | 2.10 × 10⁻⁹ | 8.22 | 2.61 × 10−98 | 2.04 × 10−105 | 1.08 × 10² | 5.11 × 10⁻³⁰ | 2.39 × 10−122 | 3.81 × 10⁻²⁶ | 1.80 × 10−219 | 0 | |
| Std | 8.33 × 10⁻¹³ | 4.11 × 10⁻⁶ | 2.09 × 101 | 2.02 × 10−50 | 6.91 × 10−94 | 2.08 × 101 | 1.61 × 10⁻²⁰ | 6.00 × 10−94 | 1.26 × 10⁻¹² | 1.90 × 10−145 | 0 | |
| F15 | Mean | 6.10 × 10⁻⁹ | 1.04 × 10⁻¹³ | 1.75 × 101 | 4.44 × 10⁻¹⁶ | 4.00 × 10⁻¹⁵ | 3.48 × 10⁻¹⁴ | 5.63 × 10⁻¹⁶ | 6.81 × 10⁻¹⁶ | 1.04 × 10⁻¹⁵ | 4.44 × 10⁻¹⁶ | 4.44 × 10⁻¹⁶ |
| Min | 5.53 × 10⁻⁹ | 7.51 × 10⁻¹⁴ | 1.53 × 10⁻¹ | 4.44 × 10⁻¹⁶ | 4.00 × 10⁻¹⁵ | 2.18 × 10⁻¹⁴ | 4.44 × 10⁻¹⁶ | 4.44 × 10⁻¹⁶ | 4.44 × 10⁻¹⁶ | 4.44 × 10⁻¹⁶ | 4.44 × 10⁻¹⁶ | |
| Std | 3.90 × 10⁻¹⁰ | 1.37 × 10⁻¹⁴ | 6.86 | 0 | 0 | 4.70 × 10⁻¹⁵ | 6.49 × 10⁻¹⁶ | 9.01 × 10⁻¹⁶ | 1.35 × 10⁻¹⁵ | 0 | 0 | |
| F16 | Mean | 4.25 × 10⁻⁹ | 4.89 × 10⁻⁴ | 1.41 | 4.92 × 10−53 | 2.42 × 10−79 | 2.23 × 10⁻⁷ | 5.86 × 10⁻³ | 2.33 × 10⁻³ | 2.68 × 10⁻³² | 7.19 × 10⁻⁷ | 1.07 × 10−295 |
| Min | 2.11 × 10⁻⁹ | 1.53 × 10⁻¹⁷ | 9.63 × 10⁻³ | 8.02 × 10−64 | 3.33 × 10−82 | 3.28 × 10⁻²³ | 3.04 × 10⁻⁵ | 7.97 × 10−69 | 0 | 1.30 × 10−197 | 0 | |
| Std | 1.16 × 10⁻⁹ | 6.40 × 10⁻⁴ | 2.95 | 1.63 × 10−52 | 4.42 × 10−79 | 5.37 × 10⁻⁷ | 1.36 × 10⁻² | 2.91 × 10⁻³ | 8.52 × 10⁻³² | 3.94 × 10⁻⁶ | 0 | |
| F17 | Mean | 1.42 × 10⁻¹¹ | 2.15 × 10⁻²⁴ | 6.22 × 10² | 5.93 × 10−84 | 1.98 × 10−138 | 7.33 × 10−131 | 3.62 × 10−40 | 7.83 × 10−107 | 2.81 × 10−51 | 7.68 × 10−289 | 0 |
| Min | 1.20 × 10⁻¹¹ | 5.21 × 10⁻²⁶ | 2.79 × 10⁻¹ | 7.92 × 10−103 | 7.35 × 10−145 | 4.30 × 10−133 | 1.73 × 10−48 | 2.40 × 10−125 | 0 | 0 | 0 | |
| Std | 9.69 × 10⁻¹³ | 2.19 × 10⁻²⁴ | 1.09 × 10³ | 3.25 × 10−83 | 5.00 × 10−138 | 1.42 × 10−130 | 1.33 × 10−39 | 3.26 × 10−106 | 9.34 × 10−51 | 0 | 0 | |
| F18 | Mean | 7.59 × 10⁻¹² | 2.62 × 10⁻³ | 4.72 × 10⁻¹ | 0 | 0 | 0 | 0 | 0 | 0 | 0 | 0 |
| Min | 3.78 × 10⁻¹² | 0 | 6.42 × 10⁴ | 0 | 0 | 0 | 0 | 0 | 0 | 0 | 0 | |
| Std | 2.56 × 10⁻¹² | 6.17 × 10⁻³ | 2.90 × 10⁻¹ | 0 | 0 | 0 | 0 | 0 | 0 | 0 | 0 | |
| F19 | Mean | 8.91 × 10⁻¹ | 5.85 × 10⁻¹ | 2.07 | 7.47 × 10⁻² | 5.50 × 10⁻¹ | 2.54 × 10⁻¹ | 4.52 × 10⁻¹ | 5.96 × 10⁻¹ | 1.65 × 10⁻¹ | 5.50 × 10⁻¹ | 2.45 × 10⁻¹ |
| Min | 5.88 × 10⁻¹ | 4.38 × 10⁻¹ | 6.01 × 10⁻¹ | 2.16 × 10⁻³ | 4.30 × 10⁻¹ | 1.83 × 10⁻¹ | 2.67 × 10⁻¹ | 4.45 × 10⁻¹ | 6.18 × 10⁻² | 4.14 × 10⁻¹ | 6.00 × 10⁻² | |
| Std | 1.26 × 10⁻¹ | 1.08 × 10⁻¹ | 4.77 | 9.82 × 10⁻² | 6.49 × 10⁻² | 3.25 × 10⁻² | 7.64 × 10⁻² | 9.17 × 10⁻² | 7.81 × 10⁻² | 9.64 × 10⁻² | 1.24 × 10⁻¹ | |
| F20 | Mean | 2.29 | 1.07 | 4.90 | 4.61 × 10⁻⁵ | 1.87 | 1.50 × 10⁻³² | 2.53 | 1.43 | 1.14 × 10⁻² | 4.15 × 10⁻¹ | 1.75 × 10⁻² |
| Min | 1.70 | 7.25 × 10⁻¹ | 2.09 | 3.77 × 10⁻⁷ | 1.56 | 1.50 × 10⁻³² | 8.97 × 10⁻² | 4.54 × 10⁻¹ | 1.88 × 10⁻⁴ | 1.79 × 10⁻¹ | 9.13 × 10⁻⁵ | |
| Std | 2.33 × 10⁻¹ | 2.02 × 10⁻¹ | 6.70 | 5.37 × 10⁻⁵ | 1.93 × 10⁻¹ | 1.11 × 10−47 | 2.78 | 1.70 | 3.67 × 10⁻² | 1.77 × 10⁻¹ | 2.78 × 10⁻² | |
| F21 | Mean | 1.05 × 101 | 1.11 × 101 | 9.37 | 2.98 × 10⁻⁴ | 6.73 × 10⁻¹ | 2.13 | 1.63 | 0 | 3.34 × 10⁻¹⁴ | 0 | 1.14 × 10⁻⁸ |
| Min | 9.47 | 1.02 × 101 | 8.41 | 0 | 0 | 1.21 | 0 | 0 | 0 | 0 | 0 | |
| Std | 5.30 × 10⁻¹ | 4.57 × 10⁻¹ | 5.30 × 10⁻¹ | 1.29 × 10⁻³ | 1.13 | 3.38 × 10⁻¹ | 1.98 | 0 | 1.83 × 10⁻¹³ | 0 | 6.22 × 10⁻⁸ | |
| F22 | Mean | 3.26 × 10⁻¹³ | 2.13 | 2.08 × 101 | 0 | 0 | 0 | 9.16 × 10⁻⁹ | 0 | 0 | 0 | 0 |
| Min | 0 | 5.68 × 10⁻¹⁴ | 6.41 × 10⁻³ | 0 | 0 | 0 | 0 | 0 | 0 | 0 | 0 | |
| Std | 9.42 × 10⁻¹³ | 3.13 | 2.21 × 101 | 0 | 0 | 0 | 5.02 × 10⁻⁸ | 0 | 0 | 0 | 0 | |
| F23 | Mean | 1.82 × 10⁻¹ | 1.80 × 10⁻¹ | 9.04 × 10⁻¹ | 5.00 × 10−51 | 9.99 × 10⁻² | 8.30 × 10⁻¹ | 1.27 × 10⁻¹ | 2.00 × 10⁻² | 2.00 × 10⁻² | 3.65 × 10⁻⁶ | 0 |
| Min | 9.99 × 10⁻² | 9.99 × 10⁻² | 3.00 × 10⁻¹ | 4.10 × 10−56 | 9.99 × 10⁻² | 5.00 × 10⁻¹ | 2.56 × 10⁻¹¹ | 7.81 × 10−63 | 0 | 8.72 × 10−103 | 0 | |
| Std | 3.64 × 10⁻² | 4.07 × 10⁻² | 5.19 × 10⁻¹ | 1.44 × 10−50 | 1.90 × 10⁻¹⁰ | 1.49 × 10⁻¹ | 8.28 × 10⁻² | 4.06 × 10⁻² | 4.06 × 10⁻² | 2.00 × 10⁻⁵ | 0 | |
| F24 | Mean | −9.84 × 101 | −2.07 × 10² | −1.23 × 10² | −4.19 × 10² | −2.08 × 10² | −4.19 × 10² | −2.98 × 10² | −2.47 × 10² | −4.18 × 10² | −2.85 × 10² | −4.17 × 10² |
| Min | −7.54 × 101 | −2.62 × 10² | −1.40 × 10² | −4.19 × 10² | −2.42 × 10² | −4.19 × 10² | −3.31 × 10² | −3.00 × 10² | −4.19 × 10² | −3.23 × 10² | −4.19 × 10² | |
| Std | 1.63 × 101 | 2.54 × 101 | 7.96 | 1.32 | 1.56 × 101 | 1.49 × 10⁻¹⁴ | 1.94 × 101 | 2.40 × 101 | 3.69 | 1.85 × 101 | 6.15 | |
| F25 | Mean | 6.50 × 10⁻¹ | 4.35 × 10⁻² | 4.53 × 10⁻² | 0 | 0 | 0 | 0 | 0 | 0 | 0 | 0 |
| Min | 5.70 × 10⁻¹ | 1.11 × 10⁻¹⁶ | 2.76 × 10⁻⁶ | 0 | 0 | 0 | 0 | 0 | 0 | 0 | 0 | |
| Std | 4.03 × 10⁻² | 4.04 × 10⁻² | 5.45 × 10⁻² | 0 | 0 | 0 | 0 | 0 | 0 | 0 | 0 |
| Function | BOA | GWO | SCA | HHO | SHO | SPBO | WHO | RWHO | EWHO | CWHO | I-WHO | |
|---|---|---|---|---|---|---|---|---|---|---|---|---|
| F1 | Mean | 9.95 × 10⁻¹² | 4.05 × 10⁻²⁰ | 9.96 × 10⁻¹ | 9.56 × 10−95 | 3.98 × 10−129 | 1.55 × 10−132 | 1.07 × 10−39 | 1.90 × 10−107 | 3.42 × 10−56 | 1.40 × 10−287 | 0 |
| Min | 8.55 × 10⁻¹² | 6.56 × 10⁻²¹ | 2.14 × 10⁻² | 5.22 × 10−118 | 6.29 × 10−134 | 3.77 × 10−134 | 9.35 × 10−48 | 4.31 × 10−132 | 3.07 × 10−66 | 0 | 0 | |
| Std | 9.76 × 10⁻¹³ | 4.09 × 10⁻²⁰ | 8.27 × 10⁻¹ | 5.22 × 10−94 | 1.57 × 10−128 | 4.40 × 10−132 | 5.76 × 10−39 | 1.00 × 10−106 | 1.35 × 10−55 | 0 | 0 | |
| F2 | Mean | 1.18 × 10⁻¹¹ | 4.25 × 10⁻⁵ | 8.93 × 10² | 2.61 × 10−97 | 3.66 × 10−82 | 2.87 × 10⁻³ | 5.43 × 10⁻³³ | 3.89 × 10−107 | 2.27 × 10−49 | 1.26 × 10−222 | 0 |
| Min | 1.02 × 10⁻¹¹ | 2.99 × 10⁻⁶ | 3.78 × 101 | 2.57 × 10−116 | 1.03 × 10−104 | 2.11 × 10⁻³ | 1.43 × 10−43 | 3.27 × 10−125 | 1.29 × 10−62 | 0 | 0 | |
| Std | 7.08 × 10⁻¹³ | 3.98 × 10⁻⁵ | 9.66 × 10² | 1.40 × 10−96 | 2.01 × 10−81 | 4.85 × 10⁻⁴ | 2.97 × 10⁻³² | 1.69 × 10−106 | 8.64 × 10−49 | 0 | 0 | |
| F3 | Mean | 1.48 × 10⁻¹³ | 6.32 × 10−83 | 3.70 × 10⁻² | 2.45 × 10−120 | 0 | 2.14 × 10−161 | 3.13 × 10−113 | 6.76 × 10−193 | 3.72 × 10−101 | 5.93 × 10−241 | 0 |
| Min | 1.30 × 10⁻¹⁴ | 1.40 × 10−99 | 5.52 × 10⁻⁴ | 2.45 × 10−148 | 0 | 2.30 × 10−182 | 9.82 × 10−136 | 8.88 × 10−223 | 7.30 × 10−130 | 0 | 0 | |
| Std | 1.58 × 10⁻¹³ | 3.46 × 10−82 | 3.88 × 10⁻² | 1.34 × 10−119 | 0 | 1.17 × 10−160 | 1.69 × 10−112 | 0 | 1.99 × 10−100 | 0 | 0 | |
| F4 | Mean | 1.27 × 10⁻¹⁴ | 3.33 × 10⁻³⁴ | 9.05 | 1.22 × 10−194 | 1.16 × 10−238 | 2.38 × 10−265 | 4.58 × 10−71 | 1.17 × 10−208 | 1.85 × 10−102 | 0 | 0 |
| Min | 9.94 × 10⁻¹⁵ | 3.11 × 10−36 | 1.02 | 1.27 × 10−227 | 2.82 × 10−251 | 1.50 × 10−269 | 4.23 × 10−90 | 9.65 × 10−256 | 0 | 0 | 0 | |
| Std | 1.28 × 10⁻¹⁵ | 4.81 × 10⁻³⁴ | 6.11 | 0 | 0 | 0 | 2.48 × 10−70 | 0 | 1.01 × 10−101 | 0 | 0 | |
| F5 | Mean | 5.89 × 101 | 5.79 × 101 | 1.53 × 10⁷ | 2.66 × 10⁻² | 5.85 × 101 | 7.60 | 8.70 × 101 | 5.80 × 101 | 3.08 × 101 | 5.74 × 101 | 1.21 × 101 |
| Min | 5.89 × 101 | 5.61 × 101 | 5.94 × 10⁵ | 1.69 × 10⁻⁴ | 5.73 × 101 | 2.51 × 10⁻³ | 5.65 × 101 | 5.67 × 101 | 1.80 × 10⁻² | 5.60 × 101 | 6.80 × 10⁻⁵ | |
| Std | 2.37 × 10⁻² | 7.79 × 10⁻¹ | 1.22 × 10⁷ | 3.93 × 10⁻² | 3.79 × 10⁻¹ | 1.90 × 101 | 8.39 × 101 | 5.79 × 10⁻¹ | 2.87 × 101 | 9.11 × 10⁻¹ | 2.35 × 101 | |
| F6 | Mean | 1.32 × 10⁻¹¹ | 3.25 | 8.27 × 10⁴ | 3.71 × 10−64 | 3.57 × 10−88 | 1.63 × 10⁴ | 3.14 × 10⁻²⁰ | 6.60 × 10−96 | 1.55 × 10⁻¹⁴ | 8.80 × 10−69 | 0 |
| Min | 1.16 × 10⁻¹¹ | 3.58 × 10⁻² | 4.44 × 10⁴ | 1.28 × 10−102 | 3.08 × 10−95 | 1.10 × 10⁴ | 8.35 × 10⁻²⁶ | 6.29 × 10−110 | 1.45 × 10⁻²⁵ | 9.11 × 10−227 | 0 | |
| Std | 1.09 × 10⁻¹² | 6.78 | 2.61 × 10⁴ | 1.91 × 10−63 | 1.38 × 10−87 | 2.12 × 10³ | 6.69 × 10⁻²⁰ | 2.50 × 10−95 | 8.47 × 10⁻¹⁴ | 4.82 × 10−68 | 0 | |
| F7 | Mean | 7.49 × 10⁻⁹ | 5.22 × 10⁻¹⁰ | 1.34 × 101 | 4.50 × 10−48 | 2.85 × 10−69 | 1.54 × 10−65 | 6.55 × 10⁻²¹ | 1.76 × 10−55 | 1.90 × 10⁻²⁸ | 2.93 × 10−145 | 3.13 × 10−287 |
| Min | 6.77 × 10⁻⁹ | 1.68 × 10⁻¹⁰ | 3.86 × 10⁻¹ | 2.96 × 10−55 | 1.03 × 10−72 | 4.39 × 10−66 | 3.02 × 10⁻²⁵ | 3.77 × 10−65 | 0 | 4.54 × 10−176 | 0 | |
| Std | 3.79 × 10⁻¹⁰ | 2.92 × 10⁻¹⁰ | 1.65 × 101 | 2.44 × 10−47 | 5.60 × 10−69 | 1.03 × 10−65 | 1.92 × 10⁻²⁰ | 5.68 × 10−55 | 6.37 × 10⁻²⁸ | 1.61 × 10−144 | 0 | |
| F8 | Mean | 6.31 × 10⁻⁹ | 3.13 × 10⁻³ | 7.74 × 101 | 4.06 × 10−49 | 2.33 × 10−52 | 1.34 × 10⁻¹ | 2.71 × 10⁻¹⁴ | 3.31 × 10−50 | 2.01 × 10⁻²¹ | 1.01 × 10−70 | 6.03 × 10−273 |
| Min | 5.59 × 10⁻⁹ | 3.47 × 10⁻⁴ | 6.06 × 101 | 1.26 × 10−56 | 2.98 × 10−55 | 1.02 × 10⁻¹ | 2.06 × 10⁻¹⁷ | 4.04 × 10−58 | 0 | 6.17 × 10−138 | 0 | |
| Std | 4.47 × 10⁻¹⁰ | 3.37 × 10⁻³ | 6.03 | 1.58 × 10−48 | 3.01 × 10−52 | 1.57 × 10⁻² | 5.44 × 10⁻¹⁴ | 1.49 × 10−49 | 5.58 × 10⁻²¹ | 5.53 × 10−70 | 0 | |
| F9 | Mean | 7.65 × 1088 | 5.77 × 10⁻¹⁰ | 1.39 × 101 | 1.16 × 10−48 | 1.31 × 10−68 | 1.75 × 10−65 | 3.64 × 10² | 2.67 × 10² | 7.39 × 10⁻²⁸ | 6.05 × 10−155 | 1.31 × 10−271 |
| Min | 3.11 × 1081 | 1.71 × 10⁻¹⁰ | 2.03 × 10⁻¹ | 6.18 × 10−58 | 1.51 × 10−72 | 4.67 × 10−66 | 3.00 × 10⁻²⁴ | 1.07 × 10−61 | 0 | 4.50 × 10−180 | 0 | |
| Std | 1.86 × 1089 | 2.50 × 10⁻¹⁰ | 1.57 × 101 | 5.57 × 10−48 | 5.57 × 10−68 | 1.71 × 10−65 | 5.85 × 10² | 5.52 × 10² | 2.67 × 10⁻²⁷ | 3.30 × 10−154 | 0 | |
| F10 | Mean | 1.09 × 10⁻²¹ | 4.56 × 10−46 | 5.59 × 10¹⁸ | 0 | 0 | 0 | 7.81 × 10−140 | 0 | 1.28 × 10−211 | 0 | 0 |
| Min | 5.53 × 10−46 | 9.60 × 10−54 | 3.88 × 10¹⁷ | 0 | 0 | 0 | 6.68 × 10−178 | 0 | 0 | 0 | 0 | |
| Std | 5.88 × 10⁻²¹ | 2.29 × 10−45 | 7.48 × 10⁻¹⁸ | 0 | 0 | 0 | 4.28 × 10−139 | 0 | 0 | 0 | 0 | |
| F11 | Mean | 1.32 × 10⁻¹¹ | 1.33 × 10⁻¹⁷ | 3.18 × 10³ | 6.58 × 10−96 | 5.12 × 10−126 | 1.16 × 10−130 | 2.77 × 10−38 | 7.06 × 10−104 | 2.50 × 10−51 | 7.64 × 10−268 | 0 |
| Min | 1.16 × 10⁻¹¹ | 4.44 × 10⁻¹⁹ | 2.91 × 10² | 3.58 × 10−113 | 3.42 × 10−132 | 2.14 × 10−132 | 2.01 × 10−43 | 6.63 × 10−127 | 0 | 0 | 0 | |
| Std | 8.86 × 10⁻¹³ | 9.37 × 10⁻¹⁸ | 3.96 × 10³ | 2.83 × 10−95 | 2.11 × 10−125 | 1.35 × 10−130 | 1.29 × 10−37 | 2.43 × 10−103 | 9.69 × 10−51 | 0 | 0 | |
| F12 | Mean | 0 | 0 | 2.42 × 10³ | 0 | 0 | 0 | 0 | 0 | 0 | 0 | 0 |
| Min | 0 | 0 | 2.30 × 101 | 0 | 0 | 0 | 0 | 0 | 0 | 0 | 0 | |
| Std | 0 | 0 | 3.23 × 10³ | 0 | 0 | 0 | 0 | 0 | 0 | 0 | 0 | |
| F13 | Mean | 1.43 × 10⁻¹¹ | 2.85 × 10⁻¹⁶ | 2.93 × 10⁴ | 1.57 × 10−93 | 3.36 × 10−125 | 2.12 × 10−128 | 2.78 × 10−36 | 6.20 × 10−105 | 2.44 × 10−51 | 2.73 × 10−275 | 0 |
| Min | 1.28 × 10⁻¹¹ | 3.50 × 10⁻¹⁷ | 5.36 × 10³ | 2.59 × 10−107 | 1.34 × 10−129 | 2.78 × 10−130 | 2.65 × 10−44 | 9.18 × 10−126 | 0 | 0 | 0 | |
| Std | 8.93 × 10⁻¹³ | 3.08 × 10⁻¹⁶ | 2.13 × 10⁴ | 7.94 × 10−93 | 8.91 × 10−125 | 8.54 × 10−128 | 8.82 × 10−36 | 3.38 × 10−104 | 7.29 × 10−51 | 0 | 0 | |
| F14 | Mean | 1.09 × 10⁻¹¹ | 8.34 × 10⁻¹ | 2.34 × 10² | 6.16 × 10⁻¹⁹ | 5.86 × 10−78 | 4.91 × 10² | 2.24 × 10⁻¹⁰ | 8.89 × 101 | 2.17 × 101 | 7.27 × 10−74 | 0 |
| Min | 8.67 × 10⁻¹² | 6.45 × 10⁻² | 1.11 × 10² | 5.83 × 10−62 | 5.08 × 10−86 | 3.90 × 10² | 2.14 × 10⁻¹⁸ | 1.56 × 10−112 | 6.94 × 10⁻¹¹ | 4.73 × 10−159 | 0 | |
| Std | 9.31 × 10⁻¹³ | 7.15 × 10⁻¹ | 6.46 × 101 | 3.38 × 10⁻¹⁸ | 2.16 × 10−77 | 5.07 × 101 | 1.04 × 10⁻⁹ | 2.22 × 10² | 1.18 × 10² | 3.98 × 10−73 | 0 | |
| F15 | Mean | 5.93 × 10⁻⁹ | 4.97 × 10⁻¹⁰ | 2.05 × 101 | 4.44 × 10⁻¹⁶ | 4.00 × 10⁻¹⁵ | 7.84 × 10⁻¹⁴ | 7.99 × 10⁻¹⁶ | 6.81 × 10⁻¹⁶ | 6.81 × 10⁻¹⁶ | 4.44 × 10⁻¹⁶ | 4.44 × 10⁻¹⁶ |
| Min | 5.33 × 10⁻⁹ | 2.21 × 10⁻¹⁰ | 2.04 × 101 | 4.44 × 10⁻¹⁶ | 4.00 × 10⁻¹⁵ | 6.79 × 10⁻¹⁴ | 4.44 × 10⁻¹⁶ | 4.44 × 10⁻¹⁶ | 4.44 × 10⁻¹⁶ | 4.44 × 10⁻¹⁶ | 4.44 × 10⁻¹⁶ | |
| Std | 3.31 × 10⁻¹⁰ | 2.12 × 10⁻¹⁰ | 5.51 × 10⁻² | 0 | 0 | 4.47 × 10⁻¹⁵ | 1.08 × 10⁻¹⁵ | 9.01 × 10⁻¹⁶ | 9.01 × 10⁻¹⁶ | 0 | 0 | |
| F16 | Mean | 4.68 × 10⁻⁹ | 1.66 × 10⁻³ | 1.08 × 101 | 1.59 × 10⁻⁵ | 2.13 × 10−70 | 4.22 × 10⁻⁶ | 2.12 × 10⁻² | 3.78 × 10⁻³ | 1.67 × 10⁻³⁰ | 4.66 × 10−75 | 1.11 × 10−294 |
| Min | 2.60 × 10⁻⁹ | 2.07 × 10⁻¹¹ | 6.76 × 10⁻¹ | 7.79 × 10−63 | 6.97 × 10−73 | 3.80 × 10⁻²² | 4.00 × 10⁻²⁴ | 2.34 × 10−65 | 0 | 7.72 × 10−185 | 0 | |
| Std | 1.19 × 10⁻⁹ | 1.54 × 10⁻³ | 8.39 | 8.69 × 10⁻⁵ | 4.56 × 10−70 | 1.90 × 10⁻⁵ | 2.76 × 10⁻² | 8.52 × 10⁻³ | 5.50 × 10⁻³⁰ | 2.55 × 10−74 | 0 | |
| F17 | Mean | 1.49 × 10⁻¹¹ | 1.95 × 10⁻¹⁴ | 6.26 × 10⁵ | 5.77 × 10−90 | 4.80 × 10−121 | 1.15 × 10−126 | 6.30 × 10⁻³³ | 1.09 × 10−98 | 3.20 × 10−48 | 1.50 × 10−268 | 0 |
| Min | 1.25 × 10⁻¹¹ | 2.26 × 10⁻¹⁵ | 6.66 × 10³ | 2.70 × 10−105 | 5.67 × 10−127 | 1.22 × 10−128 | 1.53 × 10−39 | 7.47 × 10−119 | 2.00 × 10−59 | 0 | 0 | |
| Std | 1.04 × 10⁻¹² | 1.43 × 10⁻¹⁴ | 6.83 × 10⁵ | 3.13 × 10−89 | 1.83 × 10−120 | 2.12 × 10−126 | 2.93 × 10⁻³² | 4.35 × 10−98 | 1.31 × 10−47 | 0 | 0 | |
| F18 | Mean | 9.66 × 10⁻¹² | 1.45 × 10⁻³ | 1.57 | 0 | 0 | 0 | 0 | 0 | 0 | 0 | 0 |
| Min | 5.12 × 10⁻¹² | 0 | 1.05 | 0 | 0 | 0 | 0 | 0 | 0 | 0 | 0 | |
| Std | 2.51 × 10⁻¹² | 5.53 × 10⁻³ | 4.14 × 10⁻¹ | 0 | 0 | 0 | 0 | 0 | 0 | 0 | 0 | |
| F19 | Mean | 1.07 | 7.33 × 10⁻¹ | 3.04 × 10³ | 1.72 × 10⁻¹ | 7.16 × 10⁻¹ | 4.00 × 10⁻¹ | 7.36 × 10⁻¹ | 8.03 × 10⁻¹ | 2.38 × 10⁻¹ | 7.45 × 10⁻¹ | 2.41 × 10⁻¹ |
| Min | 8.27 × 10⁻¹ | 5.68 × 10⁻¹ | 1.26 | 2.07 × 10⁻⁴ | 6.00 × 10⁻¹ | 3.18 × 10⁻¹ | 5.72 × 10⁻¹ | 7.10 × 10⁻¹ | 8.34 × 10⁻² | 5.82 × 10⁻¹ | 1.11 × 10⁻² | |
| Std | 1.51 × 10⁻¹ | 8.63 × 10⁻² | 3.03 × 10³ | 1.35 × 10⁻¹ | 6.66 × 10⁻² | 4.09 × 10⁻² | 8.53 × 10⁻² | 6.38 × 10⁻² | 9.93 × 10⁻² | 8.00 × 10⁻² | 1.60 × 10⁻¹ | |
| F20 | Mean | 5.53 | 3.33 | 5.92 × 101 | 1.23 × 10⁻⁴ | 4.51 | 1.50 × 10⁻³² | 5.77 | 4.22 | 4.59 × 10⁻² | 1.96 | 2.77 × 10⁻² |
| Min | 4.93 | 2.72 | 8.48 | 3.69 × 10⁻⁶ | 4.21 | 1.50 × 10⁻³² | 1.11 | 2.13 | 5.49 × 10⁻⁴ | 1.10 | 4.91 × 10⁻⁵ | |
| Std | 1.67 × 10⁻¹ | 3.69 × 10⁻¹ | 3.13 × 101 | 1.85 × 10⁻⁴ | 1.82 × 10⁻¹ | 1.11 × 10−47 | 5.91 | 5.57 | 6.52 × 10⁻² | 6.95 × 10⁻¹ | 2.99 × 10⁻² | |
| F21 | Mean | 2.40 × 101 | 2.53 × 101 | 2.18 × 101 | 1.22 × 10⁻⁴ | 2.11 | 5.49 | 1.89 | 0 | 3.53 × 10⁻¹⁶ | 0 | 4.37 × 10⁻⁷ |
| Min | 2.16 × 101 | 2.39 × 101 | 2.03 × 101 | 0 | 0 | 4.91 | 0 | 0 | 0 | 0 | 0 | |
| Std | 7.17 × 10⁻¹ | 6.45 × 10⁻¹ | 7.82 × 10⁻¹ | 2.19 × 10⁻⁴ | 5.74 | 3.14 × 10⁻¹ | 3.84 | 0 | 1.94 × 10⁻¹⁵ | 0 | 2.39 × 10⁻⁶ | |
| F22 | Mean | 3.79 × 10⁻¹⁵ | 5.23 | 1.45 × 10² | 0 | 0 | 1.59 × 10⁻¹³ | 5.79 × 10⁻⁷ | 0 | 0 | 0 | 0 |
| Min | 0 | 1.14 × 10⁻¹² | 3.36 × 101 | 0 | 0 | 0 | 0 | 0 | 0 | 0 | 0 | |
| Std | 2.08 × 10⁻¹⁴ | 6.78 | 6.89 × 101 | 0 | 0 | 6.40 × 10⁻¹⁴ | 3.17 × 10⁻⁶ | 0 | 0 | 0 | 0 | |
| F23 | Mean | 1.98 × 10⁻¹ | 2.67 × 10⁻¹ | 5.57 | 8.53 × 10−50 | 9.99 × 10⁻² | 1.84 | 1.43 × 10⁻¹ | 2.00 × 10⁻² | 9.99 × 10⁻³ | 9.55 × 10⁻⁹ | 0 |
| Min | 1.05 × 10⁻¹ | 2.00 × 10⁻¹ | 1.72 | 3.74 × 10−59 | 9.99 × 10⁻² | 1.50 | 9.99 × 10⁻² | 1.08 × 10−60 | 0 | 3.28 × 10−73 | 0 | |
| Std | 1.78 × 10⁻² | 5.39 × 10⁻² | 2.20 | 3.37 × 10−49 | 6.80 × 10⁻¹⁰ | 1.61 × 10⁻¹ | 1.04 × 10⁻¹ | 4.06 × 10⁻² | 3.05 × 10⁻² | 4.12 × 10⁻⁸ | 0 | |
| F24 | Mean | −4.49 × 101 | −1.16 × 10² | −6.00 × 101 | −2.79 × 10² | −9.12 × 101 | −2.79 × 10² | −2.56 × 10² | −2.23 × 10² | −4.19 × 10² | −2.38 × 10² | −4.18 × 10² |
| Min | −3.67 × 101 | −1.50 × 10² | −7.20 × 101 | −2.79 × 10² | −1.07 × 10² | −2.79 × 10² | −2.92 × 10² | −2.96 × 10² | −4.19 × 10² | −2.61 × 10² | −4.19 × 10² | |
| Std | 6.23 | 1.64 × 101 | 4.47 | 1.02 | 8.64 | 7.46 × 10⁻¹⁴ | 1.61 × 101 | 2.91 × 101 | 2.62 × 10⁻³ | 1.13 × 101 | 3.52 | |
| F25 | Mean | 7.45 × 10⁻¹ | 5.49 × 10⁻² | 2.17 × 10⁻¹ | 0 | 0 | 1.81 × 10⁻¹⁶ | 0 | 0 | 0 | 0 | 0 |
| Min | 6.95 × 10⁻¹ | 2.63 × 10⁻¹² | 7.08 × 10⁻² | 0 | 0 | 1.11 × 10⁻¹⁶ | 0 | 0 | 0 | 0 | 0 | |
| Std | 2.12 × 10⁻² | 4.78 × 10⁻² | 1.20 × 10⁻¹ | 0 | 0 | 5.44 × 10⁻¹⁷ | 0 | 0 | 0 | 0 | 0 |
| Function | BOA | GWO | SCA | HHO | SHO | SPBO | WHO | RWHO | EWHO | CWHO | I-WHO | |
|---|---|---|---|---|---|---|---|---|---|---|---|---|
| F1 | Mean | 9.78 × 10⁻¹² | 5.04 × 10⁻¹⁶ | 5.83 | 3.25 × 10−97 | 1.94 × 10−123 | 9.14 × 10−131 | 4.94 × 10−40 | 1.03 × 10−107 | 3.38 × 10−55 | 2.46 × 10−267 | 0 |
| Min | 8.02 × 10⁻¹² | 4.98 × 10⁻¹⁷ | 1.02 | 5.16 × 10−118 | 5.16 × 10−129 | 1.93 × 10−132 | 2.45 × 10−46 | 1.00 × 10−129 | 1.27 × 10−62 | 0 | 0 | |
| Std | 9.59 × 10⁻¹³ | 4.53 × 10⁻¹⁶ | 3.22 | 1.72 × 10−96 | 8.64 × 10−123 | 1.40 × 10−130 | 1.48 × 10−39 | 5.61 × 10−107 | 9.03 × 10−55 | 0 | 0 | |
| F2 | Mean | 1.21 × 10⁻¹¹ | 5.36 × 10⁻⁵ | 2.85 × 10³ | 1.87 × 10−94 | 2.04 × 10−90 | 4.48 × 10⁻³ | 9.62 × 10⁻³⁵ | 8.26 × 10−107 | 1.26 × 10−48 | 2.61 × 10−221 | 0 |
| Min | 1.03 × 10⁻¹¹ | 1.08 × 10⁻⁵ | 5.70 × 10² | 4.91 × 10−113 | 3.50 × 10−109 | 3.32 × 10⁻³ | 4.90 × 10−44 | 3.02 × 10−125 | 5.71 × 10−59 | 0 | 0 | |
| Std | 9.47 × 10⁻¹³ | 3.88 × 10⁻⁵ | 1.74 × 10³ | 1.02 × 10−93 | 1.12 × 10−89 | 6.65 × 10⁻⁴ | 3.06 × 10⁻³⁴ | 3.33 × 10−106 | 6.80 × 10−48 | 0 | 0 | |
| F3 | Mean | 9.16 × 10⁻¹⁴ | 1.50 × 10−59 | 1.85 × 10⁻¹ | 4.87 × 10−125 | 0 | 1.05 × 10−164 | 1.33 × 10−107 | 9.20 × 10−194 | 3.91 × 10−99 | 8.01 × 10−155 | 0 |
| Min | 1.93 × 10⁻¹⁵ | 5.03 × 10−88 | 3.27 × 10⁻² | 1.54 × 10−145 | 0 | 3.97 × 10−183 | 8.20 × 10−138 | 6.19 × 10−223 | 5.27 × 10−125 | 0 | 0 | |
| Std | 1.09 × 10⁻¹³ | 8.21 × 10−59 | 1.68 × 10⁻¹ | 1.55 × 10−124 | 0 | 0 | 7.29 × 10−107 | 0 | 2.14 × 10−98 | 4.39 × 10−154 | 0 | |
| F4 | Mean | 1.40 × 10⁻¹⁴ | 9.51 × 10⁻²⁷ | 1.06 × 10² | 7.94 × 10−192 | 5.27 × 10−229 | 4.39 × 10−260 | 7.37 × 10−66 | 7.03 × 10−210 | 1.44 × 10−99 | 0 | 0 |
| Min | 1.18 × 10⁻¹⁴ | 7.30 × 10⁻²⁹ | 1.83 × 101 | 1.98 × 10−225 | 2.93 × 10−242 | 7.11 × 10−264 | 3.22 × 10−79 | 4.71 × 10−239 | 0 | 0 | 0 | |
| Std | 1.06 × 10⁻¹⁵ | 2.22 × 10⁻²⁶ | 6.24 × 101 | 0 | 0 | 0 | 2.80 × 10−65 | 0 | 6.77 × 10−99 | 0 | 0 | |
| F5 | Mean | 8.89 × 101 | 8.76 × 101 | 6.54 × 10⁷ | 5.02 × 10⁻² | 8.86 × 101 | 2.22 × 101 | 2.44 × 10² | 8.80 × 101 | 3.91 × 101 | 8.76 × 101 | 2.55 × 101 |
| Min | 8.89 × 101 | 8.60 × 101 | 1.01 × 10⁷ | 4.33 × 10⁻⁵ | 8.80 × 101 | 7.50 × 10⁻³ | 8.66 × 101 | 8.68 × 101 | 2.00 × 10⁻³ | 8.62 × 101 | 1.57 × 10⁻² | |
| Std | 2.99 × 10⁻² | 7.71 × 10⁻¹ | 3.79 × 10⁷ | 6.15 × 10⁻² | 3.04 × 10⁻¹ | 3.72 × 101 | 8.48 × 10² | 4.63 × 10⁻¹ | 4.32 × 101 | 8.13 × 10⁻¹ | 3.90 × 101 | |
| F6 | Mean | 1.36 × 10⁻¹¹ | 3.03 × 10² | 1.83 × 10⁵ | 1.25 × 10−49 | 3.24 × 10−86 | 3.88 × 10⁴ | 2.96 × 10⁻¹⁵ | 6.93 × 10−95 | 6.93 × 10⁻¹² | 3.52 × 10−87 | 0 |
| Min | 1.19 × 10⁻¹¹ | 1.90 × 101 | 9.78 × 10⁴ | 1.15 × 10−91 | 4.09 × 10−92 | 3.01 × 10⁴ | 2.74 × 10⁻²² | 1.07 × 10−115 | 8.94 × 10⁻²⁶ | 8.47 × 10−228 | 0 | |
| Std | 1.00 × 10⁻¹² | 2.66 × 10² | 4.14 × 10⁴ | 6.86 × 10−49 | 9.65 × 10−86 | 4.23 × 10³ | 1.60 × 10⁻¹⁴ | 2.69 × 10−94 | 3.70 × 10⁻¹¹ | 1.93 × 10−86 | 0 | |
| F7 | Mean | 7.44 × 10⁻⁹ | 1.22 × 10⁻⁷ | 7.67 × 101 | 1.04 × 10−49 | 5.74 × 10−66 | 1.41 × 10−64 | 2.05 × 10⁻²⁰ | 1.92 × 10−55 | 9.33 × 10⁻²⁸ | 3.74 × 10−154 | 5.62 × 10−283 |
| Min | 6.50 × 10⁻⁹ | 4.46 × 10⁻⁸ | 1.23 × 101 | 1.02 × 10−56 | 9.04 × 10−69 | 4.43 × 10−65 | 5.90 × 10⁻²⁴ | 1.60 × 10−63 | 0 | 2.66 × 10−180 | 0 | |
| Std | 4.26 × 10⁻¹⁰ | 5.27 × 10⁻⁸ | 5.73 × 101 | 2.12 × 10−49 | 1.11 × 10−65 | 9.29 × 10−65 | 4.38 × 10⁻²⁰ | 7.46 × 10−55 | 4.83 × 10⁻²⁷ | 1.60 × 10−153 | 0 | |
| F8 | Mean | 6.39 × 10⁻⁹ | 4.69 × 10⁻¹ | 8.82 × 101 | 3.28 × 10−48 | 4.51 × 10−50 | 1.02 | 4.60 × 10⁻¹³ | 1.65 × 10−50 | 1.40 × 10⁻²⁰ | 4.00 × 10−38 | 8.76 × 10−265 |
| Min | 5.78 × 10⁻⁹ | 2.96 × 10⁻² | 7.90 × 101 | 1.79 × 10−58 | 1.70 × 10−52 | 9.05 × 10⁻¹ | 3.59 × 10⁻¹⁶ | 9.35 × 10−60 | 1.22 × 10⁻²³ | 2.40 × 10−99 | 0 | |
| Std | 3.15 × 10⁻¹⁰ | 6.99 × 10⁻¹ | 3.22 | 1.37 × 10−47 | 8.56 × 10−50 | 6.34 × 10⁻² | 1.19 × 10⁻¹² | 4.26 × 10−50 | 4.22 × 10⁻²⁰ | 2.19 × 10−37 | 0 | |
| F9 | Mean | 3.13 × 10135 | 1.47 × 10⁻⁷ | 4.58 × 101 | 4.04 × 10−47 | 8.63 × 10−66 | 1.92 × 10−64 | 7.23 × 10² | 4.02 × 10² | 5.84 × 10⁻²⁸ | 5.54 × 10−150 | 1.19 × 10−284 |
| Min | 9.55 × 10126 | 6.53 × 10⁻⁸ | 4.64 | 3.79 × 10−62 | 3.72 × 10−68 | 6.62 × 10−65 | 4.95 × 10⁻²⁰ | 1.09 × 10−60 | 0 | 1.19 × 10−175 | 0 | |
| Std | 1.69 × 10136 | 5.27 × 10⁻⁸ | 4.00 × 101 | 1.80 × 10−46 | 1.92 × 10−65 | 1.24 × 10−64 | 8.81 × 10² | 8.20 × 10² | 2.04 × 10⁻²⁷ | 3.02 × 10−149 | 0 | |
| F10 | Mean | 2.32 × 10⁻²⁵ | 6.28 × 10⁻³¹ | 5.37 × 10¹⁹ | 0 | 0 | 0 | 1.09 × 10−128 | 0 | 1.27 × 10−212 | 0 | 0 |
| Min | 8.75 × 10−46 | 3.20 × 10−41 | 5.27 × 10¹⁷ | 0 | 0 | 0 | 2.74 × 10−181 | 0 | 0 | 0 | 0 | |
| Std | 1.19 × 10⁻²⁴ | 2.91 × 10⁻³⁰ | 2.93 × 10¹⁹ | 0 | 0 | 0 | 5.99 × 10−128 | 0 | 0 | 0 | 0 | |
| F11 | Mean | 1.37 × 10⁻¹¹ | 2.01 × 10⁻¹³ | 1.03 × 10⁴ | 1.29 × 10−95 | 1.44 × 10−120 | 5.23 × 10−128 | 8.99 × 10−36 | 3.47 × 10−104 | 3.38 × 10−50 | 5.11 × 10−265 | 0 |
| Min | 1.20 × 10⁻¹¹ | 4.26 × 10⁻¹⁴ | 2.19 × 10³ | 5.49 × 10−111 | 1.62 × 10−126 | 6.81 × 10−130 | 2.77 × 10−42 | 2.71 × 10−126 | 0 | 0 | 0 | |
| Std | 7.39 × 10⁻¹³ | 1.32 × 10⁻¹³ | 6.05 × 10³ | 4.33 × 10−95 | 7.66 × 10−120 | 1.63 × 10−127 | 2.12 × 10⁻³⁵ | 1.89 × 10−103 | 1.81 × 10−49 | 0 | 0 | |
| F12 | Mean | 0 | 0 | 7.71 × 10³ | 0 | 0 | 0 | 0 | 0 | 0 | 0 | 0 |
| Min | 0 | 0 | 8.76 × 10² | 0 | 0 | 0 | 0 | 0 | 0 | 0 | 0 | |
| Std | 0 | 0 | 6.77 × 10³ | 0 | 0 | 0 | 0 | 0 | 0 | 0 | 0 | |
| F13 | Mean | 1.48 × 10⁻¹¹ | 6.97 × 10⁻¹² | 2.60 × 10⁵ | 2.58 × 10−93 | 1.47 × 10−120 | 8.47 × 10−127 | 7.91 × 10⁻³⁵ | 1.95 × 10−101 | 3.44 × 10−51 | 2.73 × 10−263 | 0 |
| Min | 1.33 × 10⁻¹¹ | 1.60 × 10⁻¹² | 2.61 × 10⁴ | 7.37 × 10−110 | 4.62 × 10−127 | 2.17 × 10−128 | 6.70 × 10−43 | 2.16 × 10−120 | 0 | 0 | 0 | |
| Std | 8.07 × 10⁻¹³ | 9.39 × 10⁻¹² | 2.00 × 10⁵ | 1.41 × 10−92 | 2.60 × 10−120 | 1.48 × 10−126 | 2.05 × 10⁻³⁴ | 1.07 × 10−100 | 1.28 × 10−50 | 0 | 0 | |
| F14 | Mean | 1.07 × 10⁻¹¹ | 4.49 × 101 | 5.34 × 10² | 9.12 × 10⁻¹³ | 8.47 × 10−66 | 8.34 × 10² | 9.14 × 101 | 3.23 × 10² | 4.42 × 10² | 6.36 × 10−39 | 0 |
| Min | 8.88 × 10⁻¹² | 7.80 | 2.91 × 10² | 2.72 × 10−59 | 2.08 × 10−73 | 7.50 × 10² | 1.21 × 10⁻⁸ | 6.59 × 10−101 | 1.46 × 10⁻⁵ | 1.20 × 10−146 | 0 | |
| Std | 1.00 × 10⁻¹² | 2.98 × 101 | 1.03 × 10² | 4.98 × 10⁻¹² | 4.40 × 10−65 | 4.96 × 101 | 2.80 × 10² | 4.48 × 10² | 7.10 × 10² | 3.48 × 10−38 | 0 | |
| F15 | Mean | 5.88 × 10⁻⁹ | 5.72 × 10⁻⁸ | 2.06 × 101 | 4.44 × 10⁻¹⁶ | 4.00 × 10⁻¹⁵ | 1.28 × 10⁻¹³ | 1.04 × 10⁻¹⁵ | 6.81 × 10⁻¹⁶ | 9.18 × 10⁻¹⁶ | 4.44 × 10⁻¹⁶ | 4.44 × 10⁻¹⁶ |
| Min | 5.36 × 10⁻⁹ | 3.48 × 10⁻⁸ | 2.05 × 101 | 4.44 × 10⁻¹⁶ | 4.00 × 10⁻¹⁵ | 1.03 × 10⁻¹³ | 4.44 × 10⁻¹⁶ | 4.44 × 10⁻¹⁶ | 4.44 × 10⁻¹⁶ | 4.44 × 10⁻¹⁶ | 4.44 × 10⁻¹⁶ | |
| Std | 3.08 × 10⁻¹⁰ | 1.97 × 10⁻⁸ | 4.92 × 10⁻² | 0 | 0 | 9.68 × 10⁻¹⁵ | 1.35 × 10⁻¹⁵ | 9.01 × 10⁻¹⁶ | 1.23 × 10⁻¹⁵ | 0 | 0 | |
| F16 | Mean | 5.62 × 10⁻⁹ | 2.75 × 10⁻³ | 2.00 × 101 | 2.13 × 10⁻³⁴ | 2.93 × 10−67 | 4.15 × 10⁻⁶ | 7.47 × 10⁻¹ | 3.24 × 10⁻³ | 3.17 × 10⁻²⁹ | 7.91 × 10−135 | 8.16 × 10−285 |
| Min | 2.27 × 10⁻⁹ | 4.24 × 10⁻⁴ | 3.46 | 7.22 × 10−60 | 1.90 × 10−69 | 6.08 × 10⁻¹⁹ | 5.09 × 10⁻³ | 2.96 × 10−70 | 0 | 5.46 × 10−183 | 0 | |
| Std | 1.46 × 10⁻⁹ | 2.30 × 10⁻³ | 1.15 × 101 | 1.17 × 10⁻³³ | 7.64 × 10−67 | 1.39 × 10⁻⁵ | 3.84 | 1.30 × 10⁻² | 1.40 × 10⁻²⁸ | 4.33 × 10−134 | 0 | |
| F17 | Mean | 1.56 × 10⁻¹¹ | 3.30 × 10⁻¹⁰ | 8.81 × 10⁶ | 2.98 × 10−92 | 5.55 × 10−118 | 6.94 × 10−125 | 7.96 × 10⁻³³ | 1.38 × 10−101 | 3.48 × 10−48 | 2.07 × 10−274 | 0 |
| Min | 1.36 × 10⁻¹¹ | 5.76 × 10⁻¹¹ | 3.13 × 10⁵ | 5.97 × 10−104 | 3.83 × 10−123 | 2.29 × 10−126 | 4.93 × 10−42 | 4.65 × 10−118 | 0 | 0 | 0 | |
| Std | 1.07 × 10⁻¹² | 2.65 × 10⁻¹⁰ | 8.96 × 10⁶ | 8.84 × 10−92 | 1.69 × 10−117 | 7.77 × 10−125 | 2.38 × 10⁻³² | 7.52 × 10−101 | 1.26 × 10−47 | 0 | 0 | |
| F18 | Mean | 1.20 × 10⁻¹¹ | 2.59 × 10⁻³ | 3.62 | 0 | 0 | 0 | 0 | 0 | 0 | 0 | 0 |
| Min | 3.15 × 10⁻¹² | 3.89 × 10⁻¹⁵ | 1.19 | 0 | 0 | 0 | 0 | 0 | 0 | 0 | 0 | |
| Std | 2.97 × 10⁻¹² | 6.77 × 10⁻³ | 1.57 | 0 | 0 | 0 | 0 | 0 | 0 | 0 | 0 | |
| F19 | Mean | 1.16 | 8.29 × 10⁻¹ | 1.15 × 10⁴ | 1.59 × 10⁻¹ | 7.70 × 10⁻¹ | 5.28 × 10⁻¹ | 8.22 × 10⁻¹ | 8.62 × 10⁻¹ | 2.23 × 10⁻¹ | 8.05 × 10⁻¹ | 2.81 × 10⁻¹ |
| Min | 8.86 × 10⁻¹ | 6.44 × 10⁻¹ | 9.94 × 10² | 4.21 × 10⁻⁴ | 6.36 × 10⁻¹ | 4.62 × 10⁻¹ | 6.59 × 10⁻¹ | 7.17 × 10⁻¹ | 3.62 × 10⁻² | 6.92 × 10⁻¹ | 3.22 × 10⁻² | |
| Std | 2.37 × 10⁻¹ | 1.12 × 10⁻¹ | 7.03 × 10³ | 1.16 × 10⁻¹ | 5.19 × 10⁻² | 3.11 × 10⁻² | 7.31 × 10⁻² | 5.65 × 10⁻² | 9.35 × 10⁻² | 6.41 × 10⁻² | 1.20 × 10⁻¹ | |
| F20 | Mean | 8.44 | 5.59 | 1.99 × 10² | 2.25 × 10⁻⁴ | 7.14 | 1.50 × 10⁻³² | 1.59 × 101 | 5.32 | 8.30 × 10⁻² | 4.18 | 5.65 × 10⁻² |
| Min | 7.94 | 4.81 | 6.45 × 101 | 2.67 × 10⁻⁷ | 6.26 | 1.50 × 10⁻³² | 2.60 | 4.51 | 3.91 × 10⁻³ | 2.92 | 2.15 × 10⁻⁵ | |
| Std | 1.45 × 10⁻¹ | 4.07 × 10⁻¹ | 7.03 × 101 | 3.99 × 10⁻⁴ | 3.39 × 10⁻¹ | 1.11 × 10−47 | 1.56 × 101 | 3.70 × 10⁻¹ | 1.06 × 10⁻¹ | 1.18 | 5.31 × 10⁻² | |
| F21 | Mean | 3.76 × 101 | 3.99 × 101 | 3.46 × 101 | 1.99 × 10⁻³ | 1.66 | 8.82 | 2.35 | 0 | 1.41 × 10⁻⁵ | 0 | 7.23 × 10⁻⁶ |
| Min | 3.60 × 101 | 3.77 × 101 | 3.28 × 101 | 0 | 0 | 7.33 | 0 | 0 | 0 | 0 | 0 | |
| Std | 6.20 × 10⁻¹ | 8.50 × 10⁻¹ | 7.99 × 10⁻¹ | 8.61 × 10⁻³ | 6.30 | 6.35 × 10⁻¹ | 3.96 | 0 | 7.48 × 10⁻⁵ | 0 | 1.79 × 10⁻⁵ | |
| F22 | Mean | 0 | 8.34 | 2.61 × 10² | 0 | 0 | 2.39 × 10⁻¹³ | 3.76 × 10⁻¹² | 0 | 0 | 0 | 0 |
| Min | 0 | 3.05 × 10⁻¹¹ | 1.29 × 10² | 0 | 0 | 1.14 × 10⁻¹³ | 0 | 0 | 0 | 0 | 0 | |
| Std | 0 | 6.91 | 1.07 × 10² | 0 | 0 | 4.58 × 10⁻¹⁴ | 2.03 × 10⁻¹¹ | 0 | 0 | 0 | 0 | |
| F23 | Mean | 2.05 × 10⁻¹ | 3.43 × 10⁻¹ | 1.02 × 101 | 5.54 × 10−49 | 9.99 × 10⁻² | 2.79 | 1.43 × 10⁻¹ | 1.33 × 10⁻² | 3.33 × 10⁻³ | 1.76 × 10⁻¹⁵ | 0 |
| Min | 1.71 × 10⁻¹ | 3.00 × 10⁻¹ | 6.00 | 1.03 × 10−57 | 9.99 × 10⁻² | 2.30 | 9.99 × 10⁻² | 4.35 × 10−62 | 0 | 7.72 × 10−82 | 0 | |
| Std | 1.98 × 10⁻² | 5.04 × 10⁻² | 2.89 | 1.60 × 10−48 | 2.19 × 10⁻⁹ | 2.98 × 10⁻¹ | 7.28 × 10⁻² | 3.45 × 10⁻² | 1.82 × 10⁻² | 7.79 × 10⁻¹⁴ | 0 | |
| F24 | Mean | −5.60 × 101 | −1.68 × 10² | −7.28 × 101 | −4.19 × 10² | −1.11 × 10² | −4.19 × 10² | −2.30 × 10² | −1.92 × 10² | −4.19 × 10² | −2.07 × 10² | −4.19 × 10² |
| Min | −3.96 × 101 | −2.15 × 10² | −8.50 × 101 | −4.19 × 10² | −1.40 × 10² | −4.19 × 10² | −2.61 × 10² | −2.38 × 10² | −4.19 × 10² | −2.24 × 10² | −4.19 × 10² | |
| Std | 7.90 | 2.40 × 101 | 4.51 | 1.28 × 10⁻¹ | 1.04 × 101 | 1.95 × 10⁻¹³ | 1.79 × 101 | 2.00 × 101 | 2.31 × 10⁻³ | 9.33 | 8.40 × 10⁻¹ | |
| F25 | Mean | 7.94 × 10⁻¹ | 4.93 × 10⁻² | 2.51 × 10⁻¹ | 0 | 0 | 4.51 × 10⁻¹⁶ | 1.04 × 10⁻¹⁶ | 0 | 0 | 0 | 0 |
| Min | 7.53 × 10⁻¹ | 1.27 × 10⁻² | 9.06 × 10⁻² | 0 | 0 | 3.33 × 10⁻¹⁶ | 0 | 0 | 0 | 0 | 0 | |
| Std | 1.71 × 10⁻² | 2.42 × 10⁻² | 1.05 × 10⁻¹ | 0 | 0 | 7.10 × 10⁻¹⁷ | 5.68 × 10⁻¹⁶ | 0 | 0 | 0 | 0 |
| Function | BOA | GWO | SCA | HHO | SHO | SPBO | WHO | RWHO | EWHO | CWHO | I-WHO | |
|---|---|---|---|---|---|---|---|---|---|---|---|---|
| F1 | Mean | 9.23 × 10⁻¹² | 7.25 × 10⁻⁴ | 3.46 × 10¹⁴ | 2.05 × 10−87 | 2.15 × 10−112 | 6.76 × 10−125 | 6.70 × 10⁻³⁵ | 1.12 × 10−100 | 1.04 × 10−50 | 8.58 × 10−242 | 0 |
| Min | 7.52 × 10⁻¹² | 4.71 × 10⁻⁶ | 4.08 × 10⁷ | 6.8 × 10−112 | 4.12 × 10−117 | 4.27 × 10−126 | 1.22 × 10−38 | 2.81 × 10−123 | 7.79 × 10−63 | 0 | 0 | |
| Std | 7.20 × 10⁻¹³ | 1.46 × 10⁻³ | 1.81 × 10¹⁵ | 1.12 × 10−86 | 4.87 × 10−112 | 9.12 × 10−125 | 2.08 × 10⁻³⁴ | 6.11 × 10−100 | 4.70 × 10−50 | 0 | 0 | |
| F2 | Mean | 1.33 × 10⁻¹¹ | 1.75 × 10⁻³ | 8.95 × 10⁴ | 5.61 × 10−94 | 9.66 × 10−97 | 3.06 × 10⁻² | 8.61 × 10⁻³³ | 1.77 × 10−97 | 1.23 × 10−50 | 5.29 × 10−186 | 0 |
| Min | 1.16 × 10⁻¹¹ | 6.90 × 10⁻⁴ | 5.65 × 10⁴ | 6.60 × 10−115 | 2.08 × 10−109 | 2.59 × 10⁻² | 5.24 × 10−39 | 3.93 × 10−122 | 1.09 × 10−61 | 3.80 × 10−289 | 0 | |
| Std | 7.33 × 10⁻¹³ | 7.79 × 10⁻⁴ | 2.42 × 10⁴ | 2.42 × 10−93 | 3.03 × 10−96 | 2.56 × 10⁻³ | 2.40 × 10⁻³² | 9.70 × 10−97 | 2.37 × 10−50 | 0 | 0 | |
| F3 | Mean | 1.10 × 10⁻¹³ | 1.92 × 10⁻⁴ | 1.74 | 9.30 × 10−125 | 0 | 2.26 × 10−164 | 3.86 × 10−107 | 1.27 × 10−188 | 1.22 × 10−105 | 1.77 × 10−42 | 0 |
| Min | 2.41 × 10⁻¹⁴ | 3.00 × 10⁻¹¹ | 5.95 × 10⁻¹ | 7.20 × 10−150 | 0 | 1.22 × 10−182 | 3.42 × 10−135 | 9.18 × 10−227 | 1.45 × 10−128 | 8.81 × 10−129 | 0 | |
| Std | 1.06 × 10⁻¹³ | 9.06 × 10⁻⁴ | 5.76 × 10⁻¹ | 4.50 × 10−124 | 0 | 0 | 1.85 × 10−106 | 0 | 6.65 × 10−105 | 7.56 × 10−42 | 0 | |
| F4 | Mean | 1.54 × 10⁻¹⁴ | 8.85 × 10⁻¹⁰ | 1.58 × 10⁴ | 3.60 × 10−189 | 1.03 × 10−205 | 1.93 × 10−246 | 6.07 × 10−55 | 2.31 × 10−196 | 5.27 × 10−89 | 0 | 0 |
| Min | 1.31 × 10⁻¹⁴ | 6.85 × 10⁻¹¹ | 8.31 × 10³ | 2.10 × 10−230 | 6.07 × 10−217 | 2.11 × 10−249 | 1.64 × 10−68 | 4.39 × 10−232 | 0 | 0 | 0 | |
| Std | 1.20 × 10⁻¹⁵ | 9.28 × 10⁻¹⁰ | 3.49 × 10³ | 0 | 0 | 0 | 2.53 × 1054 | 0 | 2.89 × 10−88 | 0 | 0 | |
| F5 | Mean | 4.99 × 10² | 4.98 × 10² | 2.01 × 10⁹ | 1.57 × 10⁻¹ | 4.99 × 10² | 3.61 × 10² | 4.98 × 10² | 4.98 × 10² | 3.19 × 10² | 4.98 × 10² | 1.66 × 10² |
| Min | 4.99 × 10² | 4.98 × 10² | 1.06 × 10⁹ | 1.89 × 10⁻⁴ | 4.98 × 10² | 1.62 × 10² | 4.98 × 10² | 4.97 × 10² | 2.32 | 4.98 × 10² | 4.36 × 10⁻² | |
| Std | 3.18 × 10⁻² | 2.46 × 10⁻¹ | 4.30 × 10⁸ | 3.38 × 10⁻¹ | 7.65 × 10⁻² | 1.01 × 10² | 3.39 × 10⁻¹ | 1.87 × 10⁻¹ | 2.20 × 10⁻² | 1.01 × 10⁻¹ | 2.29 × 10² | |
| F6 | Mean | 1.44 × 10⁻¹¹ | 3.42 × 10⁵ | 6.91 × 10⁶ | 3.70 × 10−54 | 1.38 × 10−78 | 8.40 × 10⁵ | 8.89 × 10⁻¹¹ | 8.25 × 10−95 | 2.57 × 10⁻⁴ | 2.34 × 10⁻¹⁹ | 0 |
| Min | 1.39 × 10⁻¹¹ | 3.26 × 10⁵ | 6.68 × 10⁶ | 4.38 × 10−65 | 5.37 × 10−82 | 7.74 × 10⁵ | 4.28 × 10⁻¹⁷ | 2.02 × 10−101 | 8.66 × 10⁻⁸ | 3.88 × 10−76 | 0 | |
| Std | 4.14 × 10⁻¹³ | 1.65 × 10⁻⁴ | 3.91 × 10⁵ | 6.41 × 10−54 | 2.27 × 10−78 | 6.04 × 10⁴ | 1.54 × 10⁻¹⁰ | 1.38 × 10−94 | 4.45 × 10⁻⁴ | 4.06 × 10⁻¹⁹ | 0 | |
| F7 | Mean | 8.46 × 10⁻⁹ | 1.15 × 10⁻¹ | 1.02 × 10³ | 1.29 × 10−48 | 3.80 × 10−58 | 2.11 × 10−61 | 8.28 × 10⁻¹⁷ | 2.59 × 10−52 | 2.46 × 10⁻²⁶ | 2.55 × 10−139 | 3.41 × 10−284 |
| Min | 7.53 × 10⁻⁹ | 7.84 × 10⁻² | 5.22 × 10² | 5.42 × 10−56 | 2.03 × 10−61 | 8.41 × 10−62 | 7.69 × 10⁻²² | 3.32 × 10−61 | 0 | 1.01 × 10−168 | 0 | |
| Std | 3.73 × 10⁻¹⁰ | 2.14 × 10⁻² | 3.38 × 10² | 3.31 × 10−48 | 1.38 × 10−57 | 9.12 × 10−62 | 4.18 × 10⁻¹⁶ | 9.64 × 10−52 | 5.87 × 10⁻²⁶ | 1.40 × 10−138 | 0 | |
| F8 | Mean | 6.60 × 10⁻⁹ | 6.62 × 101 | 9.91 × 101 | 1.38 × 10−48 | 7.05 × 10−46 | 3.45 × 101 | 3.16 × 10⁻¹⁰ | 3.84 × 10−48 | 1.27 × 10⁻¹⁷ | 2.49 × 10⁻⁸ | 2.33 × 10−245 |
| Min | 5.86 × 10⁻⁹ | 5.86 × 101 | 9.82 × 101 | 1.77 × 10−57 | 1.96 × 10−48 | 3.26 × 101 | 6.38 × 10⁻¹³ | 9.04 × 10−56 | 1.61 × 10⁻²⁰ | 2.98 × 10−46 | 0 | |
| Std | 4.43 × 10⁻¹⁰ | 3.78 | 2.78 × 10⁻¹ | 6.10 × 10−48 | 2.60 × 1045 | 6.62 × 10⁻¹ | 4.15 × 10⁻¹⁰ | 1.70 × 10−47 | 4.12 × 10⁻¹⁷ | 1.36 × 10−07 | 0 | |
| F9 | Mean | 6.55 × 10⁴ | 1.18 × 10101 | 6.55 × 10⁴ | 9.48 × 10−49 | 6.55 × 10⁴ | 6.55 × 10⁴ | 8.71 × 10³ | 3.76 × 10³ | 4.93 × 10⁻²⁵ | 5.37 × 10−144 | 1.66 × 10−283 |
| Min | 6.55 × 10⁴ | 9.35 × 10⁻³ | 6.55 × 10⁴ | 1.69 × 10−55 | 6.55 × 10⁴ | 6.55 × 10⁴ | 3.60 × 10⁻¹⁹ | 3.96 × 10−61 | 8.37 × 10⁻³⁰ | 1.06 × 10−166 | 0 | |
| Std | 6.55 × 10⁴ | 6.46 × 10101 | 6.55 × 10⁴ | 4.03 × 10−48 | 6.55 × 10⁴ | 6.55 × 10⁴ | 6.90 × 10³ | 5.73 × 10³ | 1.59 × 10⁻²⁴ | 2.78 × 10−143 | 0 | |
| F10 | Mean | 7.46 × 10⁻³⁴ | 2.80 × 10⁵ | 1.79 × 10²¹ | 0 | 0 | 0 | 2.10 × 10−92 | 0 | 5.55 × 10−179 | 7.45 × 10−195 | 0 |
| Min | 1.61 × 10−48 | 2.88 × 10⁻¹ | 1.28 × 10²¹ | 0 | 0 | 0 | 3.87 × 10−132 | 0 | 0 | 0 | 0 | |
| Std | 3.16 × 10⁻³³ | 1.49 × 10⁶ | 2.39 × 10²⁰ | 0 | 0 | 0 | 1.15 × 10−91 | 0 | 0 | 0 | 0 | |
| F11 | Mean | 1.44 × 10⁻¹¹ | 1.75 × 10⁻³ | 2.01 × 10⁵ | 8.74 × 10−94 | 3.10 × 10−108 | 1.49 × 10−122 | 9.71 × 10⁻³⁰ | 1.87 × 10−102 | 1.76 × 10−49 | 5.27 × 10−237 | 0 |
| Min | 1.29 × 10⁻¹¹ | 8.83 × 10⁻⁴ | 6.28 × 10⁴ | 4.54 × 10−110 | 9.30 × 10−117 | 3.36 × 10−123 | 2.21 × 10−37 | 2.75 × 10−120 | 0 | 5.11 × 10−297 | 0 | |
| Std | 9.41 × 10⁻¹³ | 5.72 × 10⁻⁴ | 5.79 × 10⁴ | 4.77 × 10−93 | 1.60 × 10−107 | 1.34 × 10−122 | 2.79 × 10⁻²⁹ | 9.41 × 10−102 | 7.14 × 10−49 | 0 | 0 | |
| F12 | Mean | 0 | 1.00 | 1.87 × 10⁵ | 0 | 0 | 0 | 3.33 × 10⁻² | 0 | 0 | 0 | 0 |
| Min | 0 | 0 | 7.24 × 10⁴ | 0 | 0 | 0 | 0 | 0 | 0 | 0 | 0 | |
| Std | 0 | 8.71 × 10⁻¹ | 5.79 × 10⁴ | 0 | 0 | 0 | 1.83 × 10⁻¹ | 0 | 0 | 0 | 0 | |
| F13 | Mean | 1.54 × 10⁻¹¹ | 3.46 × 10⁻¹ | 4.89 × 10⁷ | 1.51 × 10−91 | 5.80 × 10−107 | 3.28 × 10−120 | 1.24 × 10⁻²⁷ | 1.45 × 10−94 | 3.66 × 10−46 | 2.76 × 10−225 | 0 |
| Min | 1.36 × 10⁻¹¹ | 9.84 × 10⁻² | 2.95 × 10⁷ | 1.57 × 10−104 | 1.40 × 10−113 | 2.14 × 10−121 | 9.99 × 10−36 | 3.22 × 10−114 | 0 | 2.78 × 10−307 | 0 | |
| Std | 9.58 × 10⁻¹³ | 1.40 × 10⁻¹ | 1.31 × 10⁷ | 7.26 × 10−91 | 1.40 × 10−106 | 4.32 × 10−120 | 4.56 × 10⁻²⁷ | 7.91 × 10−94 | 1.37 × 10−45 | 0 | 0 | |
| F14 | Mean | 6.43 × 10⁻¹³ | 3.97 × 10³ | 1.14 × 10⁸ | 2.36 × 10³ | 1.07 × 10⁻¹³ | 6.11 × 10³ | 6.59 × 10³ | 4.10 × 10³ | 9.15 × 10⁻³ | 6.63 × 101 | 0 |
| Min | 9.85 × 10−39 | 3.29 × 10³ | 8.83 × 10³ | 1.28 × 10⁻⁵ | 1.33 × 10⁻²⁶ | 5.67 × 10³ | 5.02 × 10³ | 2.60 × 10−96 | 2.45 × 10⁻³ | 6.04 × 10⁻¹⁸ | 0 | |
| Std | 1.99 × 10⁻¹² | 4.63 × 10² | 5.49 × 10⁸ | 2.74 × 10³ | 5.14 × 10⁻¹³ | 1.90 × 10² | 1.20 × 10³ | 3.48 × 10³ | 5.94 × 10³ | 1.87 × 10² | 0 | |
| F15 | Mean | 5.76 × 10⁻⁹ | 2.13 × 10⁻³ | 2.08 × 101 | 8.88 × 10⁻¹⁶ | 4.68 × 10⁻¹⁵ | 8.30 × 10⁻¹³ | 1.72 × 10⁻¹⁵ | 1.36 × 10⁻¹⁵ | 1.72 × 10⁻¹⁵ | 8.88 × 10⁻¹⁶ | 8.88 × 10⁻¹⁶ |
| Min | 5.18 × 10⁻⁹ | 1.47 × 10⁻³ | 2.07 × 101 | 8.88 × 10⁻¹⁶ | 4.44 × 10⁻¹⁵ | 7.86 × 10⁻¹³ | 8.88 × 10⁻¹⁶ | 8.88 × 10⁻¹⁶ | 8.88 × 10⁻¹⁶ | 8.88 × 10⁻¹⁶ | 8.88 × 10⁻¹⁶ | |
| Std | 2.73 × 10⁻¹⁰ | 3.81 × 10⁻⁴ | 2.71 × 10⁻² | 0 | 9.01 × 10⁻¹⁶ | 2.14 × 10⁻¹⁴ | 1.53 × 10⁻¹⁵ | 1.23 × 10⁻¹⁵ | 1.53 × 10⁻¹⁵ | 0 | 0 | |
| F16 | Mean | 7.15 × 10⁻⁹ | 6.55 × 10⁻² | 1.38 × 10² | 3.98 × 10⁻⁵ | 6.81 × 10−60 | 1.79 × 10⁻⁴ | 3.76 | 2.08 × 10−55 | 7.29 × 10⁻²⁹ | 3.52 × 10−141 | 1.96 × 10−279 |
| Min | 4.32 × 10⁻⁹ | 4.70 × 10⁻² | 5.52 × 101 | 4.63 × 10−59 | 3.57 × 10−63 | 1.35 × 10⁻⁵ | 4.50 × 10⁻² | 1.04 × 10−61 | 1.92 × 10⁻³² | 9.83 × 10−171 | 0 | |
| Std | 1.15 × 10⁻⁹ | 9.53 × 10⁻³ | 3.85 × 101 | 2.18 × 10⁻⁴ | 1.51 × 10−59 | 1.84 × 10⁻⁴ | 1.67 × 101 | 8.04 × 10−55 | 1.83 × 10⁻²⁸ | 1.93 × 10−140 | 0 | |
| F17 | Mean | 1.56 × 10⁻¹¹ | 3.21 | 4.03 × 10⁹ | 2.86 × 10−89 | 3.39 × 10−106 | 6.50 × 10−119 | 1.98 × 10⁻²⁶ | 3.52 × 10−97 | 5.69 × 10−42 | 3.40 × 10−248 | 0 |
| Min | 1.38 × 10⁻¹¹ | 8.92 × 10⁻¹ | 8.41 × 10⁸ | 1.24 × 10−108 | 1.96 × 10−110 | 8.09 × 10−120 | 1.23 × 10⁻³³ | 1.68 × 10−117 | 0 | 1.96 × 10−299 | 0 | |
| Std | 8.40 × 10⁻¹³ | 1.67 | 2.07 × 10⁹ | 1.00 × 10−88 | 8.22 × 10−106 | 8.26 × 10−119 | 6.81 × 10⁻²⁶ | 1.23 × 10−96 | 3.12 × 10−41 | 0 | 0 | |
| F18 | Mean | 1.42 × 10⁻¹¹ | 1.19 × 10⁻² | 5.16 × 101 | 0 | 0 | 9.99 × 10⁻¹⁶ | 0 | 0 | 0 | 0 | 0 |
| Min | 1.30 × 10⁻¹¹ | 3.47 × 10⁻⁶ | 1.89 × 101 | 0 | 0 | 9.99 × 10⁻¹⁶ | 0 | 0 | 0 | 0 | 0 | |
| Std | 7.68 × 10⁻¹³ | 2.44 × 10⁻² | 1.54 × 101 | 0 | 0 | 0 | 0 | 0 | 0 | 0 | 0 | |
| F19 | Mean | 2.20 | 1.01 | 2.09 × 10⁵ | 3.43 × 10⁻¹ | 9.82 × 10⁻¹ | 8.33 × 10⁻¹ | 9.35 × 10⁻¹ | 9.61 × 10⁻¹ | 3.85 × 10⁻¹ | 9.47 × 10⁻¹ | 5.09 × 10⁻¹ |
| Min | 9.37 × 10⁻¹ | 8.71 × 10⁻¹ | 3.20 × 10⁴ | 1.02 × 10⁻² | 9.29 × 10⁻¹ | 8.07 × 10⁻¹ | 8.77 × 10⁻¹ | 9.07 × 10⁻¹ | 1.17 × 10⁻¹ | 8.80 × 10⁻¹ | 1.52 × 10⁻¹ | |
| Std | 1.41 | 4.75 × 10⁻² | 9.14 × 10⁴ | 4.65 × 10⁻¹ | 2.94 × 10⁻² | 1.74 × 10⁻² | 2.96 × 10⁻² | 2.36 × 10⁻² | 1.67 × 10⁻¹ | 2.79 × 10⁻² | 1.73 × 10⁻¹ | |
| F20 | Mean | 4.59 × 101 | 4.03 × 101 | 2.42 × 10³ | 5.39 × 10⁻⁴ | 4.44 × 101 | 1.50 × 10⁻³² | 1.42 × 10² | 4.14 × 101 | 6.92 × 10⁻¹ | 4.16 × 101 | 3.40 × 10⁻¹ |
| Min | 4.59 × 101 | 4.01 × 101 | 2.10 × 10³ | 2.46 × 10⁻⁶ | 4.43 × 101 | 1.50 × 10⁻³² | 3.87 × 101 | 4.08 × 101 | 5.08 × 10⁻¹ | 4.11 × 101 | 9.53 × 10⁻² | |
| Std | 1.59 × 10⁻² | 4.60 × 10⁻¹ | 2.86 × 10² | 5.79 × 10⁻⁴ | 1.14 × 10⁻¹ | 0 | 8.97 × 101 | 6.54 × 10⁻¹ | 1.61 × 10⁻¹ | 7.99 × 10⁻¹ | 3.09 × 10⁻¹ | |
| F21 | Mean | 2.31 × 10² | 2.41 × 10² | 2.10 × 10² | 2.62 × 10⁻³ | 2.78 × 101 | 5.87 × 101 | 1.21 × 101 | 0 | 5.51 × 10⁻⁶ | 0 | 1.20 × 10⁻⁵ |
| Min | 2.26 × 10² | 2.38 × 10² | 2.04 × 10² | 0 | 0 | 5.56 × 101 | 0 | 0 | 0 | 0 | 0 | |
| Std | 2.08 | 8.50 × 10⁻¹ | 2.56 | 5.13 × 10⁻³ | 7.30 × 101 | 1.45 | 2.99 × 101 | 0 | 3.02 × 10⁻⁵ | 0 | 6.55 × 10⁻⁵ | |
| F22 | Mean | 0 | 8.06 × 101 | 1.12 × 10³ | 0 | 0 | 1.49 × 10⁻¹¹ | 0 | 0 | 0 | 0 | 0 |
| Min | 0 | 3.57 × 101 | 4.49 × 10² | 0 | 0 | 1.09 × 10⁻¹¹ | 0 | 0 | 0 | 0 | 0 | |
| Std | 0 | 3.06 × 101 | 4.12 × 10² | 0 | 0 | 1.80 × 10⁻¹² | 0 | 0 | 0 | 0 | 0. | |
| F23 | Mean | 2.04 × 10⁻¹ | 1.06 | 4.67 × 101 | 3.47 × 10−50 | 1.10 × 10⁻¹ | 1.77 × 101 | 1.50 × 10⁻¹ | 2.33 × 10⁻² | 3.33 × 10⁻³ | 3.34 × 10⁻³ | 0 |
| Min | 1.01 × 10⁻¹ | 9.00 × 10⁻¹ | 2.49 × 101 | 1.13 × 10−55 | 9.99 × 10⁻² | 1.58 × 101 | 4.02 × 10⁻⁶ | 6.74 × 10−57 | 5.05 × 10⁻²⁸ | 1.31 × 10−41 | 0 | |
| Std | 2.76 × 10⁻² | 8.98 × 10⁻² | 8.96 | 7.73 × 10−50 | 3.05 × 10⁻² | 9.07 × 10⁻¹ | 1.38 × 10⁻¹ | 4.30 × 10⁻² | 1.82 × 10⁻² | 1.82 × 10⁻² | 0 | |
| F24 | Mean | −1.34 × 10² | −6.19 × 10² | −1.72 × 10² | −2.33 × 10³ | −2.43 × 10⁻² | −2.33 × 10³ | −6.34 × 10² | −5.28 × 10⁻² | −2.33 × 10³ | −5.69 × 10² | −2.32 × 10³ |
| Min | −1.03 × 10² | −7.12 × 10² | −2.00 × 10² | −2.33 × 10³ | −2.94 × 10⁻² | −2.33 × 10³ | −7.77 × 10² | −6.27 × 10⁻² | −2.33 × 10³ | −6.53 × 10² | −2.33 × 10³ | |
| Std | 2.19 × 101 | 9.87 × 101 | 1.24 × 101 | 3.90 × 10⁻¹ | 2.47 × 101 | 6.49 × 10⁻¹³ | 5.60 × 101 | 4.80 × 101 | 3.14 | 3.28 × 101 | 1.41 × 101 | |
| F25 | Mean | 9.10 × 10⁻¹ | 4.35 × 10⁻² | 1.93 × 10⁻¹ | 0 | 0 | 2.08 × 10⁻¹⁵ | 1.48 × 10⁻¹⁷ | 0 | 0 | 0 | 0 |
| Min | 8.84 × 10⁻¹ | 2.58 × 10⁻² | 3.77 × 10⁻² | 0 | 0 | 1.78 × 10⁻¹⁵ | 0 | 0 | 0 | 0 | 0 | |
| Std | 1.05 × 10⁻² | 1.09 × 10⁻² | 9.85 × 10⁻² | 0 | 0 | 1.77 × 10⁻¹⁶ | 8.11 × 10⁻¹⁷ | 0 | 0 | 0 | 0 |
| Function | RWHO | EWHO | CWHO | I-WHO |
|---|---|---|---|---|
| F1 | 3.02 × 10⁻¹¹ | 3.02 × 10⁻¹¹ | 2.92 × 10⁻¹¹ | 1.21 × 10⁻¹² |
| F2 | 3.02 × 10⁻¹¹ | 3.02 × 10⁻¹¹ | 3.02 × 10⁻¹¹ | 1.21 × 10⁻¹² |
| F3 | 3.02 × 10⁻¹¹ | 7.12 × 10⁻⁹ | 1.21 × 10⁻¹² | 1.21 × 10⁻¹² |
| F4 | 3.02 × 10⁻¹¹ | 3.01 × 10⁻¹¹ | 1.21 × 10⁻¹² | 1.21 × 10⁻¹² |
| F5 | 7.62 × 10⁻³ | 6.10 × 10⁻³ | 9.33 × 10⁻² | 2.67 × 10⁻⁹ |
| F6 | 3.02 × 10⁻¹¹ | 7.62 × 10⁻¹ | 3.02 × 10⁻¹¹ | 1.21 × 10⁻¹² |
| F7 | 3.02 × 10⁻¹¹ | 3.22 × 10⁻¹² | 3.02 × 10⁻¹¹ | 2.26 × 10⁻¹¹ |
| F8 | 3.02 × 10⁻¹¹ | 3.33 × 10⁻¹¹ | 3.02 × 10⁻¹¹ | 2.86 × 10⁻¹¹ |
| F9 | 3.96 × 10⁻⁸ | 2.98 × 10⁻¹¹ | 3.02 × 10⁻¹¹ | 2.26 × 10⁻¹¹ |
| F10 | 1.21 × 10⁻¹² | 3.01 × 10⁻¹¹ | 1.21 × 10⁻¹² | 1.21 × 10⁻¹² |
| F11 | 3.02 × 10⁻¹¹ | 3.64 × 10⁻¹¹ | 2.86 × 10⁻¹¹ | 1.21 × 10⁻¹² |
| F12 | 3.34 × 10⁻¹ | 3.34 × 10⁻¹ | 3.34 × 10⁻¹ | 3.34 × 10⁻¹ |
| F13 | 3.02 × 10⁻¹¹ | 3.00 × 10⁻¹¹ | 3.00 × 10⁻¹¹ | 1.21 × 10⁻¹² |
| F14 | 5.57 × 10⁻¹⁰ | 4.44 × 10⁻⁷ | 3.02 × 10⁻¹¹ | 1.21 × 10⁻¹² |
| F15 | 4.76 × 10⁻² | 1.35 × 10⁻¹ | 1.09 × 10⁻² | 1.09 × 10⁻² |
| F16 | 7.29 × 10⁻³ | 2.98 × 10⁻¹¹ | 3.69 × 10⁻¹¹ | 2.40 × 10⁻¹¹ |
| F17 | 3.02 × 10⁻¹¹ | 3.01 × 10⁻¹¹ | 2.95 × 10⁻¹¹ | 1.21 × 10⁻¹² |
| F18 | NaN | NaN | NaN | NaN |
| F19 | 4.74 × 10⁻⁶ | 6.70 × 10⁻¹¹ | 6.10 × 10⁻³ | 2.92 × 10⁻⁹ |
| F20 | 7.84 × 10⁻¹ | 5.57 × 10⁻¹⁰ | 6.97 × 10⁻³ | 4.62 × 10⁻¹⁰ |
| F21 | 1.66 × 10⁻¹¹ | 1.66 × 10⁻¹¹ | 1.66 × 10⁻¹¹ | 3.98 × 10⁻¹⁰ |
| F22 | 3.34 × 10⁻¹ | 3.34 × 10⁻¹ | 3.34 × 10⁻¹ | 3.34 × 10⁻¹ |
| F23 | 8.89 × 10⁻¹¹ | 1.71 × 10⁻⁹ | 1.25 × 10⁻¹¹ | 3.80 × 10⁻¹³ |
| F24 | 9.76 × 10⁻¹⁰ | 3.02 × 10⁻¹¹ | 1.27 × 10⁻² | 3.02 × 10⁻¹¹ |
| F25 | 3.34 × 10⁻¹ | 3.34 × 10⁻¹ | 3.34 × 10⁻¹ | 3.34 × 10⁻¹ |
| Function | BOA | GWO | SCA | HHO | SHO | SPBO |
|---|---|---|---|---|---|---|
| F1 | 1.21 × 10⁻¹² | 1.21 × 10⁻¹² | 1.21 × 10⁻¹² | 1.21 × 10⁻¹² | 1.21 × 10⁻¹² | 1.21 × 10⁻¹² |
| F2 | 1.21 × 10⁻¹² | 1.21 × 10⁻¹² | 1.21 × 10⁻¹² | 1.21 × 10⁻¹² | 1.21 × 10⁻¹² | 1.21 × 10⁻¹² |
| F3 | 1.21 × 10⁻¹² | 1.21 × 10⁻¹² | 1.21 × 10⁻¹² | 1.21 × 10⁻¹² | NaN | 1.21 × 10⁻¹² |
| F4 | 1.21 × 10⁻¹² | 1.21 × 10⁻¹² | 1.21 × 10⁻¹² | 1.21 × 10⁻¹² | 1.21 × 10⁻¹² | 1.21 × 10⁻¹² |
| F5 | 3.02 × 10⁻¹¹ | 2.03 × 10⁻⁹ | 3.02 × 10⁻¹¹ | 5.00 × 10⁻⁹ | 2.61 × 10⁻¹⁰ | 9.23 × 10⁻¹ |
| F6 | 1.21 × 10⁻¹² | 1.21 × 10⁻¹² | 1.21 × 10⁻¹² | 1.21 × 10⁻¹² | 1.21 × 10⁻¹² | 1.21 × 10⁻¹² |
| F7 | 2.26 × 10⁻¹¹ | 2.26 × 10⁻¹¹ | 2.26 × 10⁻¹¹ | 2.26 × 10⁻¹¹ | 2.26 × 10⁻¹¹ | 2.26 × 10⁻¹¹ |
| F8 | 2.86 × 10⁻¹¹ | 2.86 × 10⁻¹¹ | 2.86 × 10⁻¹¹ | 2.86 × 10⁻¹¹ | 2.86 × 10⁻¹¹ | 2.86 × 10⁻¹¹ |
| F9 | 2.26 × 10⁻¹¹ | 2.26 × 10⁻¹¹ | 2.26 × 10⁻¹¹ | 2.26 × 10⁻¹¹ | 2.26 × 10⁻¹¹ | 2.26 × 10⁻¹¹ |
| F10 | 1.21 × 10⁻¹² | 1.21 × 10⁻¹² | 1.21 × 10⁻¹² | NaN | NaN | NaN |
| F11 | 1.21 × 10⁻¹² | 1.21 × 10⁻¹² | 1.21 × 10⁻¹² | 1.21 × 10⁻¹² | 1.21 × 10⁻¹² | 1.21 × 10⁻¹² |
| F12 | NaN | NaN | 1.91 × 10⁻¹⁰ | NaN | NaN | NaN |
| F13 | 1.21 × 10⁻¹² | 1.21 × 10⁻¹² | 1.21 × 10⁻¹² | 1.21 × 10⁻¹² | 1.21 × 10⁻¹² | 1.21 × 10⁻¹² |
| F14 | 1.21 × 10⁻¹² | 1.21 × 10⁻¹² | 1.21 × 10⁻¹² | 1.21 × 10⁻¹² | 1.21 × 10⁻¹² | 1.21 × 10⁻¹² |
| F15 | 1.21 × 10⁻¹² | 9.95 × 10⁻¹³ | 1.21 × 10⁻¹² | NaN | 3.94 × 10⁻¹² | 6.75 × 10⁻¹³ |
| F16 | 2.40 × 10⁻¹¹ | 2.40 × 10⁻¹¹ | 2.40 × 10⁻¹¹ | 2.40 × 10⁻¹¹ | 2.40 × 10⁻¹¹ | 2.40 × 10⁻¹¹ |
| F17 | 1.21 × 10⁻¹² | 1.21 × 10⁻¹² | 1.21 × 10⁻¹² | 1.21 × 10⁻¹² | 1.21 × 10⁻¹² | 1.21 × 10⁻¹² |
| F18 | 1.21 × 10⁻¹² | 5.58 × 10⁻³ | 1.21 × 10⁻¹² | NaN | NaN | NaN |
| F19 | 3.02 × 10⁻¹¹ | 1.61 × 10⁻¹⁰ | 3.02 × 10⁻¹¹ | 8.88 × 10⁻⁶ | 8.99 × 10⁻¹¹ | 1.49 × 10⁻¹ |
| F20 | 3.02 × 10⁻¹¹ | 3.02 × 10⁻¹¹ | 3.02 × 10⁻¹¹ | 6.72 × 10⁻¹⁰ | 3.02 × 10⁻¹¹ | 1.21 × 10⁻¹² |
| F21 | 3.16 × 10⁻¹² | 3.16 × 10⁻¹² | 3.16 × 10⁻¹² | 1.18 × 10⁻⁵ | 7.98 × 10⁻³ | 3.16 × 10⁻¹² |
| F22 | 6.60 × 10⁻⁴ | 1.12 × 10⁻¹² | 1.21 × 10⁻¹² | NaN | NaN | NaN |
| F23 | 1.21 × 10⁻¹² | 1.21 × 10⁻¹² | 1.21 × 10⁻¹² | 1.21 × 10⁻¹² | 1.21 × 10⁻¹² | 1.21 × 10⁻¹² |
| F24 | NaN | 3.02 × 10⁻¹¹ | 3.02 × 10⁻¹¹ | 1.27 × 10⁻² | 3.02 × 10⁻¹¹ | 2.36 × 10⁻¹² |
| F25 | 1.21 × 10⁻¹² | 1.21 × 10⁻¹² | 1.21 × 10⁻¹² | NaN | NaN | NaN |
| WHO | RWHO | EWHO | CWHO | I-WHO | |
|---|---|---|---|---|---|
| Best | 2.4548 | 7.3475 | 5.543 | 2.4829 | 5.251 |
| Worst | 6841.6376 | 7.3475 | 7.3484 | 7.3475 | 7.1452 |
| Average | 693.4014 | 7.3475 | 6.5006 | 3.5107 | 6.4765 |
| Standard Deviation | 2160.3651 | 0.1258 | 0.67933 | 1.6787 | 0.61321 |
| Median | 3.3378 | 7.3475 | 6.4631 | 2.4864 | 6.6396 |
| WHO | RWHO | EWHO | CWHO | I-WHO | |
|---|---|---|---|---|---|
| Best | 3.6621 | 3.708 | 3.6619 | 3.6619 | 3.6621 |
| Worst | 26.4566 | 99.9542 | 3.7351 | 3.6833 | 11.7234 |
| Average | 12.6181 | 42.2065 | 3.6883 | 3.6642 | 4.4825 |
| Standard Deviation | 9.1158 | 49.7013 | 0.028239 | 0.0067342 | 2.5443 |
| Median | 9.1629 | 3.708 | 3.6804 | 3.6619 | 3.6779 |
| WHO | RWHO | EWHO | CWHO | I-WHO | |
|---|---|---|---|---|---|
| Best | 26.6331 | 27.9616 | 26.4996 | 26.4864 | 26.5531 |
| Worst | 32.5343 | 27.9616 | 28.1667 | 27.9616 | 27.5218 |
| Average | 28.6879 | 27.9616 | 26.9643 | 26.7888 | 26.7327 |
| Standard Deviation | 2.1643 | 4.8827 × 10⁻¹⁵ | 0.64603 | 0.61852 | 0.28626 |
| Median | 27.8953 | 27.9616 | 26.5949 | 26.4865 | 26.6325 |
| WHO | RWHO | EWHO | CWHO | I-WHO | |
|---|---|---|---|---|---|
| Best | 359.208 | 376.675 | 363.4909 | 363.4909 | 363.491 |
| Worst | 376.6136 | 376.675 | 369.15 | 376.675 | 369.1631 |
| Average | 365.5948 | 376.675 | 364.0685 | 366.6936 | 364.7194 |
| Standard Deviation | 5.4068 | 5.2768 × 10⁻⁶ | 1.7857 | 5.5487 | 2.3404 |
| Median | 365.067 | 376.675 | 363.4909 | 363.4909 | 363.6643 |
Disclaimer/Publisher’s Note: The statements, opinions and data contained in all publications are solely those of the individual author(s) and contributor(s) and not of MDPI and/or the editor(s). MDPI and/or the editor(s) disclaim responsibility for any injury to people or property resulting from any ideas, methods, instructions or products referred to in the content. |
© 2023 by the authors. Licensee MDPI, Basel, Switzerland. This article is an open access article distributed under the terms and conditions of the Creative Commons Attribution (CC BY) license (https://creativecommons.org/licenses/by/4.0/).
Share and Cite
Chen, L.; Zhao, Y.; Ma, Y.; Zhao, B.; Feng, C. Improving Wild Horse Optimizer: Integrating Multistrategy for Robust Performance across Multiple Engineering Problems and Evaluation Benchmarks. Mathematics 2023, 11, 3861. https://doi.org/10.3390/math11183861
Chen L, Zhao Y, Ma Y, Zhao B, Feng C. Improving Wild Horse Optimizer: Integrating Multistrategy for Robust Performance across Multiple Engineering Problems and Evaluation Benchmarks. Mathematics. 2023; 11(18):3861. https://doi.org/10.3390/math11183861
Chicago/Turabian StyleChen, Lei, Yikai Zhao, Yunpeng Ma, Bingjie Zhao, and Changzhou Feng. 2023. "Improving Wild Horse Optimizer: Integrating Multistrategy for Robust Performance across Multiple Engineering Problems and Evaluation Benchmarks" Mathematics 11, no. 18: 3861. https://doi.org/10.3390/math11183861
APA StyleChen, L., Zhao, Y., Ma, Y., Zhao, B., & Feng, C. (2023). Improving Wild Horse Optimizer: Integrating Multistrategy for Robust Performance across Multiple Engineering Problems and Evaluation Benchmarks. Mathematics, 11(18), 3861. https://doi.org/10.3390/math11183861