Article

Application of SVM and Chi-Square Feature Selection for Sentiment Analysis of Indonesia’s National Health Insurance Mobile Application

Department of Mathematics, Faculty of Mathematics and Natural Sciences, Universitas Padjadjaran, Bandung 45363, Indonesia
*
Author to whom correspondence should be addressed.
Mathematics 2023, 11(17), 3765; https://doi.org/10.3390/math11173765
Submission received: 18 July 2023 / Revised: 28 August 2023 / Accepted: 30 August 2023 / Published: 1 September 2023

Abstract

:
(1) Background: sentiment analysis is a computational technique employed to discern individuals opinions, attitudes, emotions, and intentions concerning a subject by analyzing reviews. Machine learning-based sentiment analysis methods, such as Support Vector Machine (SVM) classification, have proven effective in opinion classification. Feature selection methods have been employed to enhance model performance and efficiency, with the Chi-Square method being a commonly used technique; (2) Methods: this study analyzes user reviews of Indonesia’s National Health Insurance (Mobile JKN) application, evaluating model performance and identifying optimal hyperparameters using the F1-Score metric. Sentiment analysis is conducted using a combined approach of SVM classification and Chi-Square feature selection; (3) Results: the sentiment analysis of user reviews for the Mobile JKN application reveals a predominant tendency towards positive reviews. The best model performance is achieved with an F1-Score of 96.82%, employing hyperparameters where C is set to 10 and a “linear” kernel; (4) Conclusions: this study highlights the effectiveness of SVM classification and the significance of Chi-Square feature selection in sentiment analysis. The findings offer valuable insights into users’ sentiments regarding the Mobile JKN application, contributing to the improvement of user experience and advancing the field of sentiment analysis.

1. Introduction

Indonesia is one of the most densely populated countries and thus faces various challenges in addressing health issues. According to the Ministry of Health of the Republic of Indonesia, as of 30 December 2021, Indonesia had a population of 273,879,750 people spread across 16,722 islands, with 26.5 million people categorized as poor in September 2021 [1]. The level of poverty in Indonesia is closely related to public health problems. People living in poverty tend to lack adequate access to healthcare services. Furthermore, Indonesia still has a high incidence of infectious diseases, especially tuberculosis (TB), pneumonia, hepatitis, diarrhea, COVID-19, measles, polio, dengue fever, and others. The national prevalence of non-communicable diseases has also shown an increasing trend in recent years [1].
Agustina et al. (2019) [2] stated that the Universal Health Coverage (UHC) program can be implemented to ensure safe, affordable, and effective access to healthcare services without facing financial difficulties, in line with the Sustainable Development Goals (SDGs) set by the World Health Organization (WHO). The Indonesian government has established the Law of the Republic of Indonesia No. 24 of 2011, pertaining to Indonesia’s National Health Insurance (BPJS), as the implementing body for the social health insurance program, to support the achievement of UHC. BPJS officially started its operation in 2014 and became a significant step in improving public access to affordable healthcare.
The President Director of BPJS for Health, Ali Ghufron Mukti, stated that the COVID-19 pandemic prompted BPJS for Health to develop the Mobile JKN application to transition from traditional face-to-face services to digital services [3]. Mobile JKN is an application developed by BPJS that provides features to view information and membership status, register, and make claims for healthcare treatment reimbursement for participants of the National Health Insurance—Healthy Indonesian Card (JKN-KIS) program. Mobile JKN was introduced in 2017 as a form of technological development that encourages the use of digital services [4]. The COVID-19 pandemic has driven the increased use and development of the Mobile JKN application. During the COVID-19 pandemic, BPJS provided online queue systems using the Mobile JKN application, remote consultations (teleconsultations), online prescriptions, and online referral services. From 20 March to 21 July 2021, the teleconsultation service of the Mobile JKN application was used by 9656 doctors in Primary Healthcare Facilities (FKTP) [3].
Since 15 February 2023, the Mobile JKN application has been downloaded by more than 10 million users with 470,000 user reviews on the Google Play platform. Google Play is an online store visited by users to find applications, games, movies, TV shows, books, and other content on smartphones that use the Android operating system (Source: play.google.com, accessed on 20 February 2023). Every application has its strengths and weaknesses, which are conveyed through user reviews in the review section. User reviews aim to provide evaluations for the government to improve the quality of public health insurance services in the future. Therefore, sentiment analysis of user reviews becomes crucial in evaluating user satisfaction with the services and determining areas that need improvement.
Sentiment analysis is a technique to detect favorable and unfavorable opinions about a specific subject (such as organizations and their products) that can be used for various purposes [5]. According to Medhat et al. (2014) [6], sentiment analysis, or opinion mining, is the computational study of people’s opinions, attitudes, and emotions toward an entity. Shaik et al. (2022) [7] state that sentiment analysis is one of the most widely used applications of Natural Language Processing (NLP) to identify the intentions of individuals from their reviews. Sentiment analysis is performed using machine learning to classify text reviews as positive, neutral, or negative.
The field of sentiment analysis has witnessed significant advancements, with recent studies delving into various methodologies to enhance accuracy and applicability. Noteworthy contributions include the work of Wu et al. (2021), who integrated rich syntactic knowledge to improve aspect and opinion terms extraction through syntax fusion encoding and high-order scoring mechanisms [8]. In a different vein, Tian et al. (2023) proposed an end-to-end aspect-based sentiment analysis (EASA) approach utilizing combinatory categorial grammar (CCG) to capture both syntactic and semantic information, yielding state-of-the-art results [9].
Li et al. (2021) introduced supervised contrastive pre-training to recognize implicit sentiment orientation, enriching aspect-based sentiment analysis by capturing both explicit and implicit sentiments [10]. Shi et al. (2022) addressed limitations in structured sentiment analysis by proposing a novel labeling strategy and a graph attention network-based model, significantly surpassing previous state-of-the-art models [11]. Fei et al. (2022) focused on enhancing the robustness of ABSA models through multi-faceted improvements, spanning model design, data augmentation, and advanced training strategies [12].
Moreover, Huang et al. (2020) introduced a weakly supervised approach for aspect-based sentiment analysis, utilizing sentiment aspect joint topic embeddings and neural classifiers to overcome the absence of labeled examples [13]. Li et al. (2022) bridged the gap between sentiment analysis and dialogue contexts by introducing the conversational aspect-based sentiment quadruple analysis task, and providing a benchmark dataset and model for cross-utterance quadruple extraction [14]. Another contribution by Fei (2020) involved the development of a Latent Emotion Memory network for multi-label emotion classification, integrating latent emotion distribution and context information to achieve state-of-the-art results [15].
These prominent studies collectively shape the landscape of sentiment analysis, harnessing innovative techniques to enhance accuracy, adaptability, and robustness. By drawing insights from these methodologies, this study endeavors to bring a novel perspective to sentiment analysis within the context of user reviews for the Mobile JKN application.
According to Uysal and Gunal (2014) [16], the framework stages for text classification consist of preprocessing, word representation, feature selection, classification, and model performance evaluation. Furthermore, model performance can be enhanced through hyperparameter tuning. Hyperparameter tuning is the process of finding more optimal hyperparameter values for the model. Each stage of the framework affects the performance of the classification model created.
This structured approach consists of five fundamental stages, each playing a crucial role in shaping the process and outcomes of our analysis. The initial phase involves preprocessing, wherein the raw text data are refined and prepared for subsequent analysis. The subsequent stage encompasses word representation, wherein the text is transformed into a numerical format suitable for machine learning algorithms. Feature selection follows, where pertinent features are carefully chosen to enhance model efficacy. Classification, the subsequent stage, entails the application of machine learning techniques to categorize the text. Finally, the framework concludes with model performance evaluation, whereby the effectiveness of the classification model is rigorously assessed using established metrics such as Accuracy, Precision, Recall, and F1-Score. The choice of evaluation metric depends on the complexity and distribution of the data.
Şahin and Klç (2019) [17] used the F1-Score metric to evaluate a classification model for an imbalanced dataset in the Reuters-21578 dataset. Padurariu and Breaban (2019) [18] also used the F1-Score metric in their study to evaluate a classification model on a dataset containing work experience. In the case of an imbalanced dataset, F1-Score is commonly used because it combines precision and recall equally for majority and minority classes. This performance metric serves as a reference for hyperparameter tuning.
In the classification stage with machine learning, Mantovani et al. (2019) [19] state that most machine learning algorithms are sensitive to the values of hyperparameters, which directly affect the performance of the model. One of the commonly used machine learning algorithms for various problems is the Support Vector Machine (SVM). The performance of an SVM model is highly influenced by the values of hyperparameters such as the kernel function ( k ), gamma (γ), polynomial degree ( d ), and regularized constant ( C ). Hyperparameter tuning by changing these hyperparameter values can improve the performance of the SVM model.
Previous research on sentiment analysis has been conducted in the banking services domain by Sari and Irhamah (2020) [20]. Their study classified Twitter data into positive and negative sentiments using the Term Frequency Inverse Document Frequency (TF-IDF) word representation as the input for the Naïve Bayes Classifier (NBC) and SVM algorithms with SMOTE. In their research, Mahendrajaya (2019) [21] conducted sentiment analysis on user opinion tweets about Gopay services. The study used a lexicon-based method to label the sentiment as positive or negative. The word representation used was TF-IDF as the input for SVM algorithms with linear and polynomial kernels for classification.
The application of feature selection methods can be performed in classification methods to improve model performance by reducing the number of features used. Cahyono (2017) [22] states that feature selection is used to reduce a large feature set into a smaller subset of relevant features. Feature selection reduces computational time and improves model efficiency by using only the features considered relevant or most impactful on the model. Sentiment analysis research on COVID-19 vaccination using Naïve Bayes Classifier with Chi-Square feature selection and Particle Swarm Optimization has been conducted by Septiana et al. (2021) [23] with the Chi-Square feature selection yielding the best performance by improving the model’s accuracy from 63.69% to 69.13%. Furthermore, Luthfiana et al. (2020) [24] conducted sentiment analysis on user reviews of an application dataset consisting of 553 reviews for three classes: positive, neutral, and negative sentiments, using the SVM method and Chi-Square feature selection. The research obtained the performance results without feature selection with an accuracy of 69%, precision of 48%, recall of 53%, and F1-Score of 50%. After applying feature selection, the model’s performance improved, with an accuracy of 77%, precision of 50%, recall of 55%, and F1-Score of 73%. The research also performed hyperparameter tuning on the regularized constant and gamma.
In this study, the domain of sentiment analysis is explored, building upon the SVM approach in conjunction with Chi-Square feature selection, as presented in the framework proposed by Luthfiana et al. (2020). The distinctiveness of our study lies in the utilization of advanced technical strategies to address specific challenges. The TF-IDF (Term Frequency-Inverse Document Frequency) methodology is harnessed for word representation, a robust technique that gauges word importance by considering their prevalence across the entire text corpus. Additionally, hyperparameter tuning is undertaken by optimizing the regularized constant, rooted in the F1-Score metric. This methodical calibration of parameters is a strategic effort aimed at enhancing model performance, thereby refining sentiment classification outcomes.
A noteworthy departure from the methodology of Luthfiana et al. (2020) pertains to the expansion of the dataset, which encompasses a larger volume of user reviews obtained from the Google Play platform. This augmentation facilitates a more comprehensive grasp of user sentiments, contributing to a more nuanced and insightful analysis. The dataset adheres to a binary classification scheme, categorizing sentiments as either positive or negative. This two-class classification framework forms the fundamental basis of the sentiment analysis endeavor.
Through these methodological enhancements, the goal is not only to replicate but to elevate the effectiveness of the SVM-based sentiment analysis paradigm. By embracing advanced techniques and broadening the scope of data utilization, this study introduces an evolved methodology that transcends prior limitations, deriving strength from its advanced technical underpinnings.

1.1. Problem Statement

  • How does sentiment analysis of user reviews for the Mobile JKN application using SVM classification and Chi-Square feature selection method work?
  • How well does the model’s performance using SVM classification and the Chi-Square feature selection method fare in conducting sentiment analysis of user reviews for the Mobile JKN application?
  • What is the optimal value of the regularized constant hyperparameter for the SVM method in sentiment analysis of user reviews for the Mobile JKN application, as determined by the F1-Score metric?

1.2. Model Limitation

The model in this study is limited by the following conditions:
  • The method employed includes Chi-Square feature selection and the SVM classification method;
  • The data used comprise reviews of the Mobile JKN application from the Indonesian Google Play Store, with a total of 7020 reviews collected through scraping between 1 February 2023, and 20 March 2023;
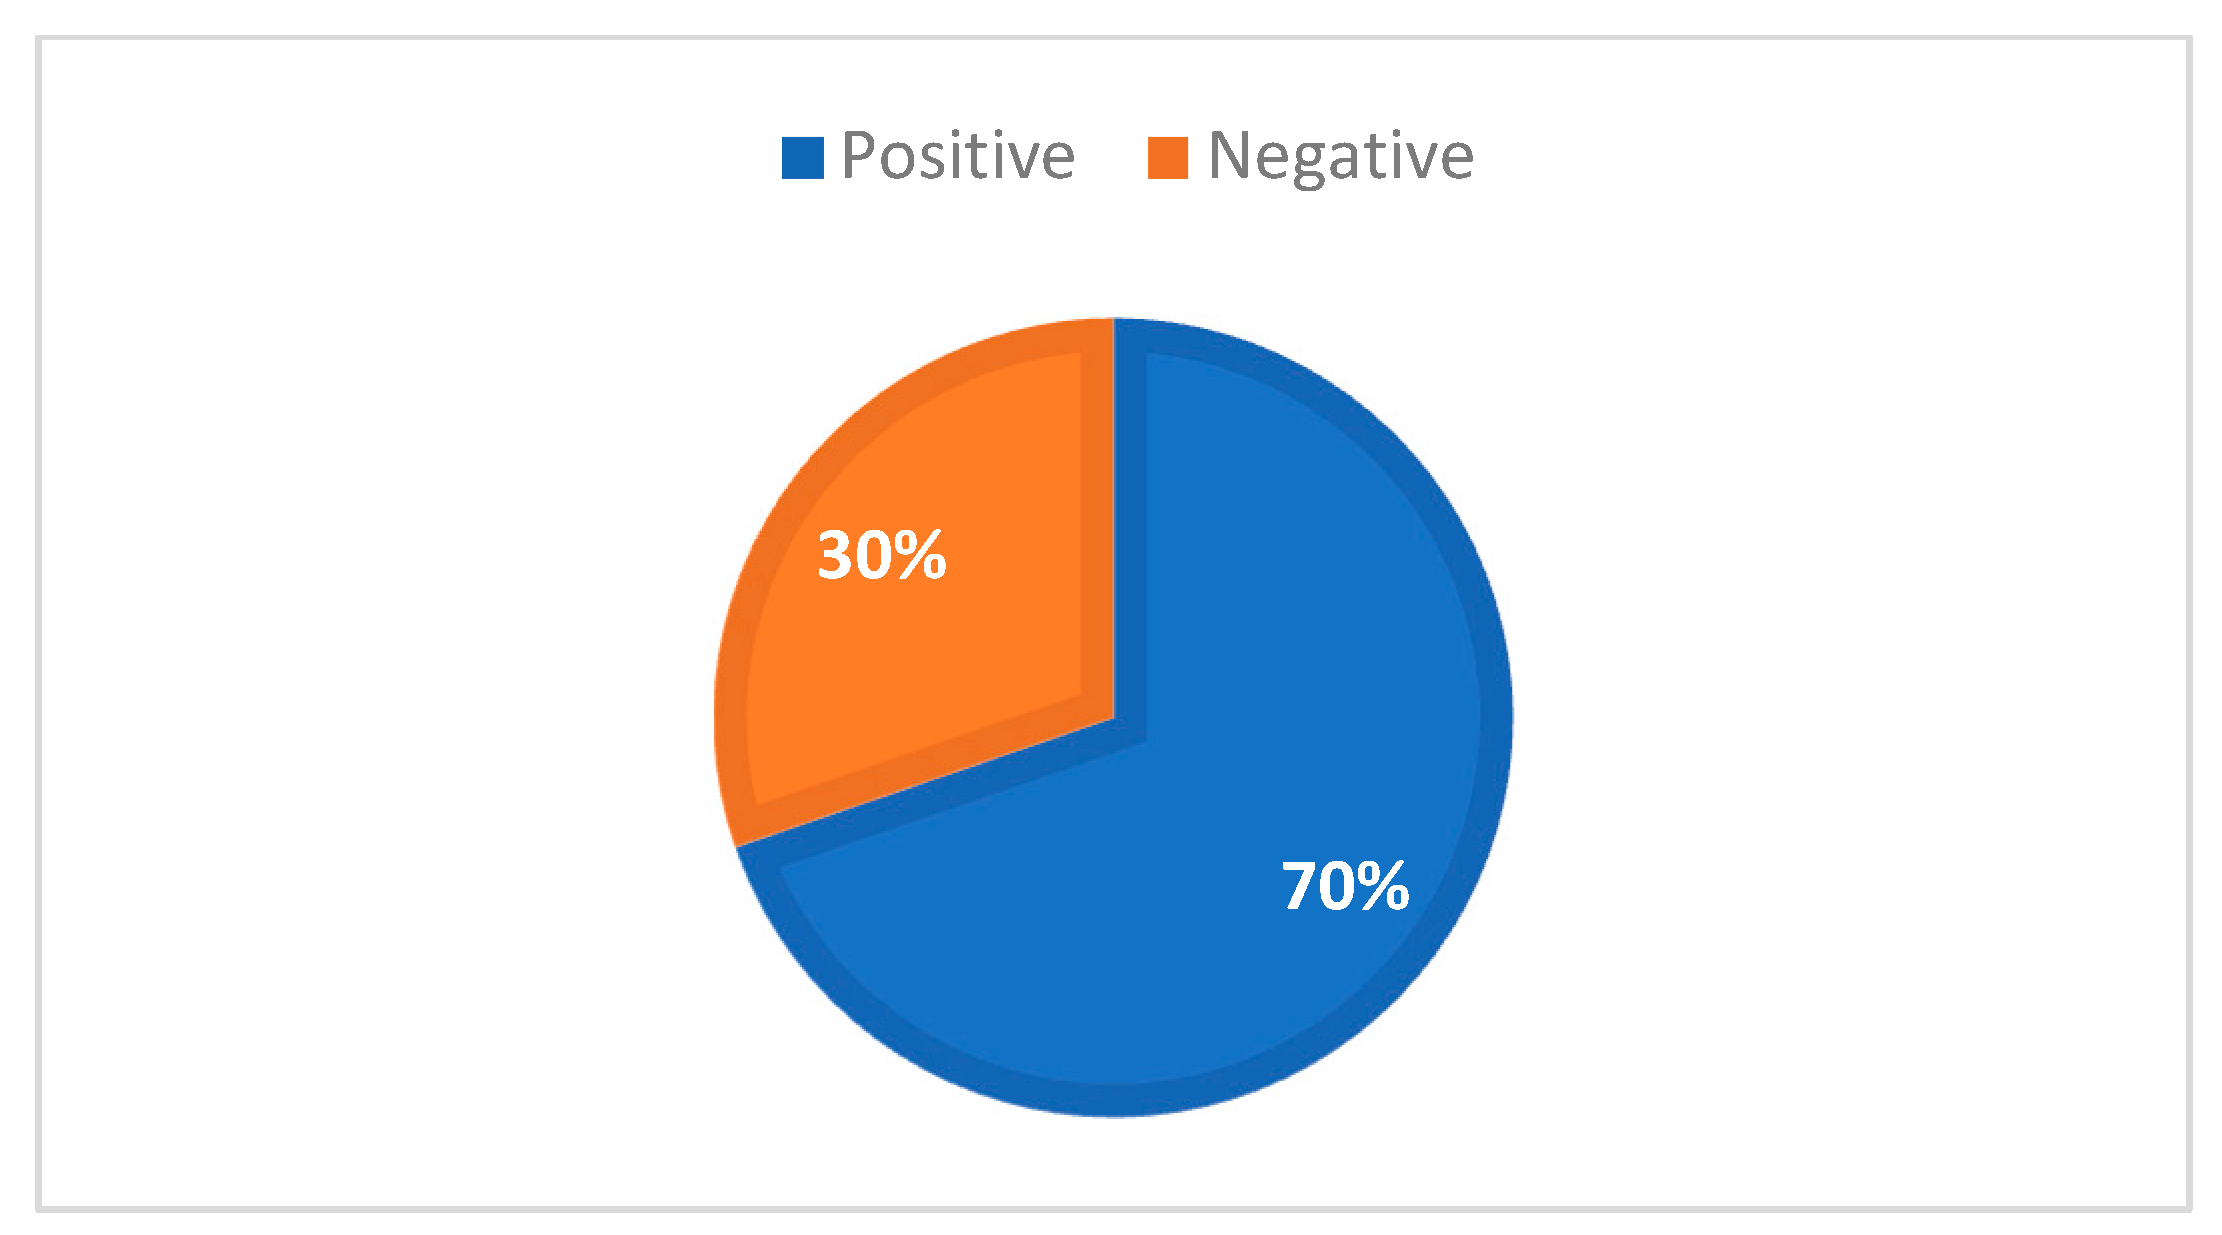
  • Sentiment analysis is performed by categorizing review data into two classes: positive sentiment and negative sentiment;
  • Sentiment analysis and computations are conducted using the Python programming language with an interpreter in the DataSpell IDE;
  • Model performance improvement is based on the F1-Score metric with hyperparameter tuning for the regularized constant and the “linear” kernel.

1.3. Broad Objectives

  • Obtain sentiment analysis results of user reviews for the Mobile JKN application;
  • Attain model performance for sentiment analysis of user reviews for the Mobile JKN application;
  • Determine the optimal value of the regularized constant hyperparameter for sentiment analysis of user reviews for the Mobile JKN application.

1.4. Contributions of This Work

  • Advanced Framework Integration: This study pioneers the integration of Support Vector Machine (SVM) classification and Chi-Square feature selection within a unified framework. This innovative amalgamation aims to harness the strengths of both techniques, leading to improved sentiment analysis accuracy and robustness;
  • Hyperparameter-Tuned Model: A significant contribution lies in the introduction of hyperparameter tuning, specifically optimizing the regularized constant, to tailor the SVM model’s performance for sentiment analysis. This strategic optimization, based on the F1-Score metric, showcases a commitment to refining model predictions for imbalanced datasets;
  • Focused Domain Application: The applicability of this approach extends to user-generated content by employing a dataset of Mobile JKN application reviews. This application-focused approach addresses the nuances and challenges unique to sentiment analysis in the context of real-world user reviews;
  • Clear Experimental Insights: This study provides a clear and detailed overview of the experimental methodology, encompassing text preprocessing, feature selection, model training, and performance evaluation. By elucidating each step, it offers insights into the mechanics and effectiveness of the approach;
  • Model Limitations and Significance: Recognizing the boundaries of this work, a dedicated section on model limitations is presented. This candid exploration of potential constraints contributes to a well-rounded understanding of the scope and implications of the research.

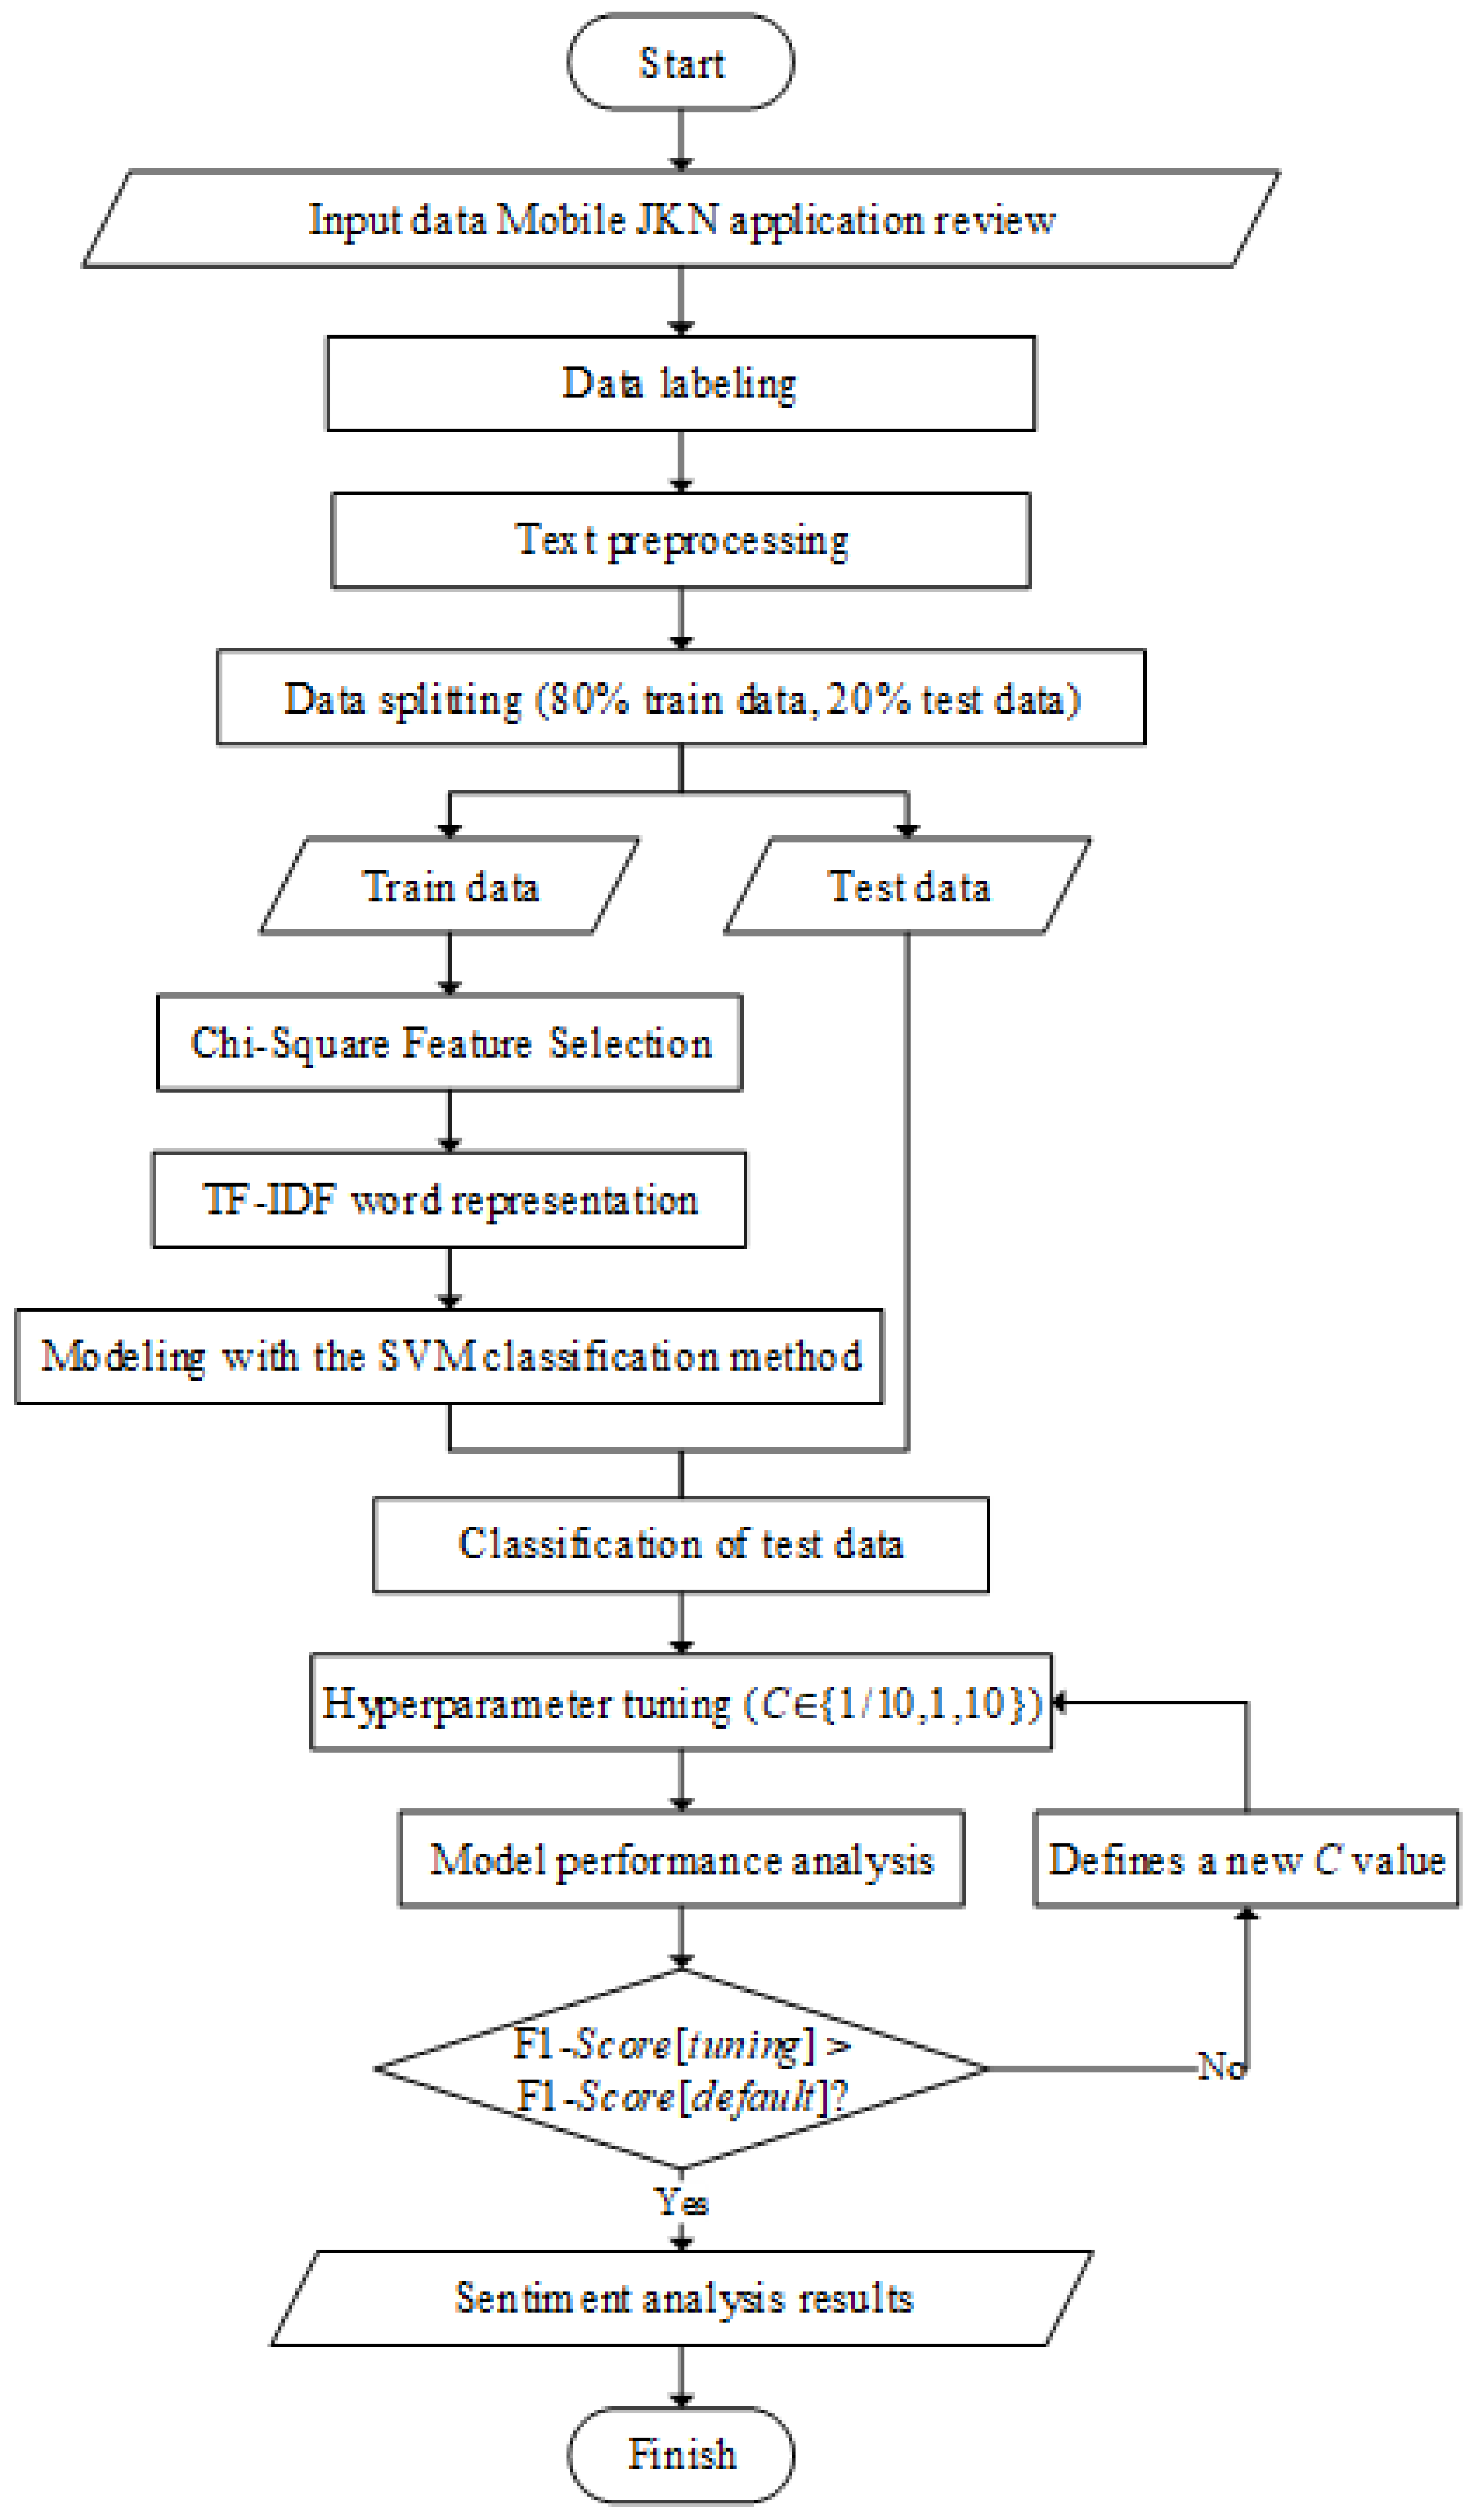
2. Materials and Methods

The method used in this study is the SVM algorithm and Chi-Square feature selection for classifying textual data of user reviews of the Mobile JKN application on the Google Play Store. The programming language used for this research is Python. In this study, the user review data of the Mobile JKN application on the Google Play Store was divided into two classes: positive sentiment and negative sentiment. The framework employed in this study includes text preprocessing, word representation, feature selection, classification, model performance evaluation, and hyperparameter tuning. The detailed process can be seen in the flowchart in Figure 1.

2.1. Data Collection

The data used in this study are user review data of the Mobile JKN application. The Mobile JKN application is an application developed by BPJS Kesehatan (Indonesia’s National Health Insurance) to provide public health services to prospective participants or participants of the JKN-KIS program [25]. The services provided by the Mobile JKN application include participant registration, displaying participant information, updating participant data, availability of hospital beds according to class, covered medicines, billing information, operation schedules, service registration, health screening, and others. Bahri et al. (2022) [26] stated that in 2022, the number of BPJS Kesehatan participants reached 237,923,846 people, which is equivalent to 86.87% of the total population of Indonesia, which is 278,752,361, and the number of Mobile JKN application users as of 27 May 2022, was 16,346,826 people.
The reviews were obtained by scraping data from the Google Play Store through the link https://play.google.com/store/apps/details?id=app.bpjs.Mobile&hl=id&gl=US (accessed on 7 March 2023). Data collection was conducted using the google-play-scraper library with the Python programming language from 1 February 2023 to 20 March 2023, resulting in 7020 reviews. The user review data used in this study are in the Indonesian language. The data were manually labeled as positive or negative by reading each review individually. The reviews were only given positive or negative labels because it was difficult to determine the polarity of neutral sentiment sentences. Positive sentiment is defined as user reviews that contain praise and satisfaction with the provided application services. Negative sentiment is defined as user reviews that mention difficulties or sentences that express dissatisfaction with the Mobile JKN application.

2.2. Text Preprocessing

Text preprocessing is performed to remove noise from the text to improve the accuracy of the machine learning model [27]. The implementation of good text preprocessing can enhance the model’s performance. Putra et al. (2020) [28] stated that text preprocessing generally consists of the following four stages:
  • Case folding is the process of converting all letters to lowercase;
  • Stopword filtering is the process of removing meaningless words. For example, words like “malah,” “adalah,” “di,” “ke,” and “yang” will be eliminated in this stage.
  • Tokenizing is the process of splitting sentences into several words. Typically, each word is separated by a space delimiter, so in this case, a space delimiter will be used;
  • Stemming is the process of extracting or reducing affixes to obtain the base form of words.
HaCohen-Kerner et al. (2020) [29] stated that more advanced text preprocessing can be achieved by converting abbreviations or slang words into standardized words with the same meaning. The transformation of abbreviations into relevant full words is achieved using the NLP_bahasa_resources dataset obtained from the link https://github.com/louisowen6/NLP_bahasa_resources (accessed on 18 March 2023). The text preprocessing stage is closely related to feature selection. This stage ensures that the training data of the reviews only contain relevant features or words before proceeding to the feature selection stage.

2.3. Chi-Square Feature Selection

Feature selection is used to improve model performance by reducing the number of features used, making the computations more efficient. One commonly used feature selection method is the Chi-Square method. Chi-Square feature selection is a technique that uses statistical theory to test the independence of a term with its class [30]. The Chi-Square values for each term are sorted in descending order to determine the terms or words that will be used as features. The Chi-Square function of a word against a category is obtained from Equation (1) [31].
χ 2 t , c = N A c D c C c B c 2 A c + C c B c + D c A c + B c C c + D c
Here, t = term, c = class/category, χ 2 t , c = Chi-Square value of a term t against the category c , N = number of training documents, A c = number of documents in category c that contain term t , B c = number of documents not in category c that contain term t , C c = number of documents in category c that do not contain term t , and D c = number of documents not in category c that do not contain term t .
Feature selection was performed with the single Chi-Square value of a term by summing the Chi-Square value of a term for each category with k categories using Equation (2).
χ 2 t = c = 1 k χ 2 t , c
The higher the value of the χ 2 t statistic, the higher the dependency between the term t and its class. The value of χ 2 t ,   p o s i t i v e in binary classification cases (involving two classes) will be equal to the value of χ 2 t ,   n e g a t i v e . Chi-Square feature selection will determine the most significant features or words before the word representation stage.

2.4. TF-IDF Word Representation

Word representation is one of the most important factors in text classification. This process is performed by transforming text data into vectors that can be processed by a machine. There are several techniques that can be used for word representation, such as Bag-of-Words (BoW), Term Frequency Inverse Document Frequency (TF-IDF), and N-Grams [28]. In this study, TF-IDF is used for word representation. Arifin et al. state that TF-IDF is a commonly used method to determine the relationship between words and documents or sentences by assigning weights or values to each word. TF-IDF is obtained from Equations (3)–(5).
TF t , d = n d , t N d
IDF t = log N d f t + 1
TF - IDF t , d = TF t , d × IDF t
with n d , t being the number of occurrences of word t in document d , N d being the total number of words in document d , N being the total number of training documents, and d f t being the number of documents in which term t appears. The resulting TF-IDF vectors are then normalized using Euclidean norm in Equation (6).
v n o r m = v v 1 2 + v 2 2 + + v n 2
The TF-IDF vectors obtained are used as input for the SVM classification method.

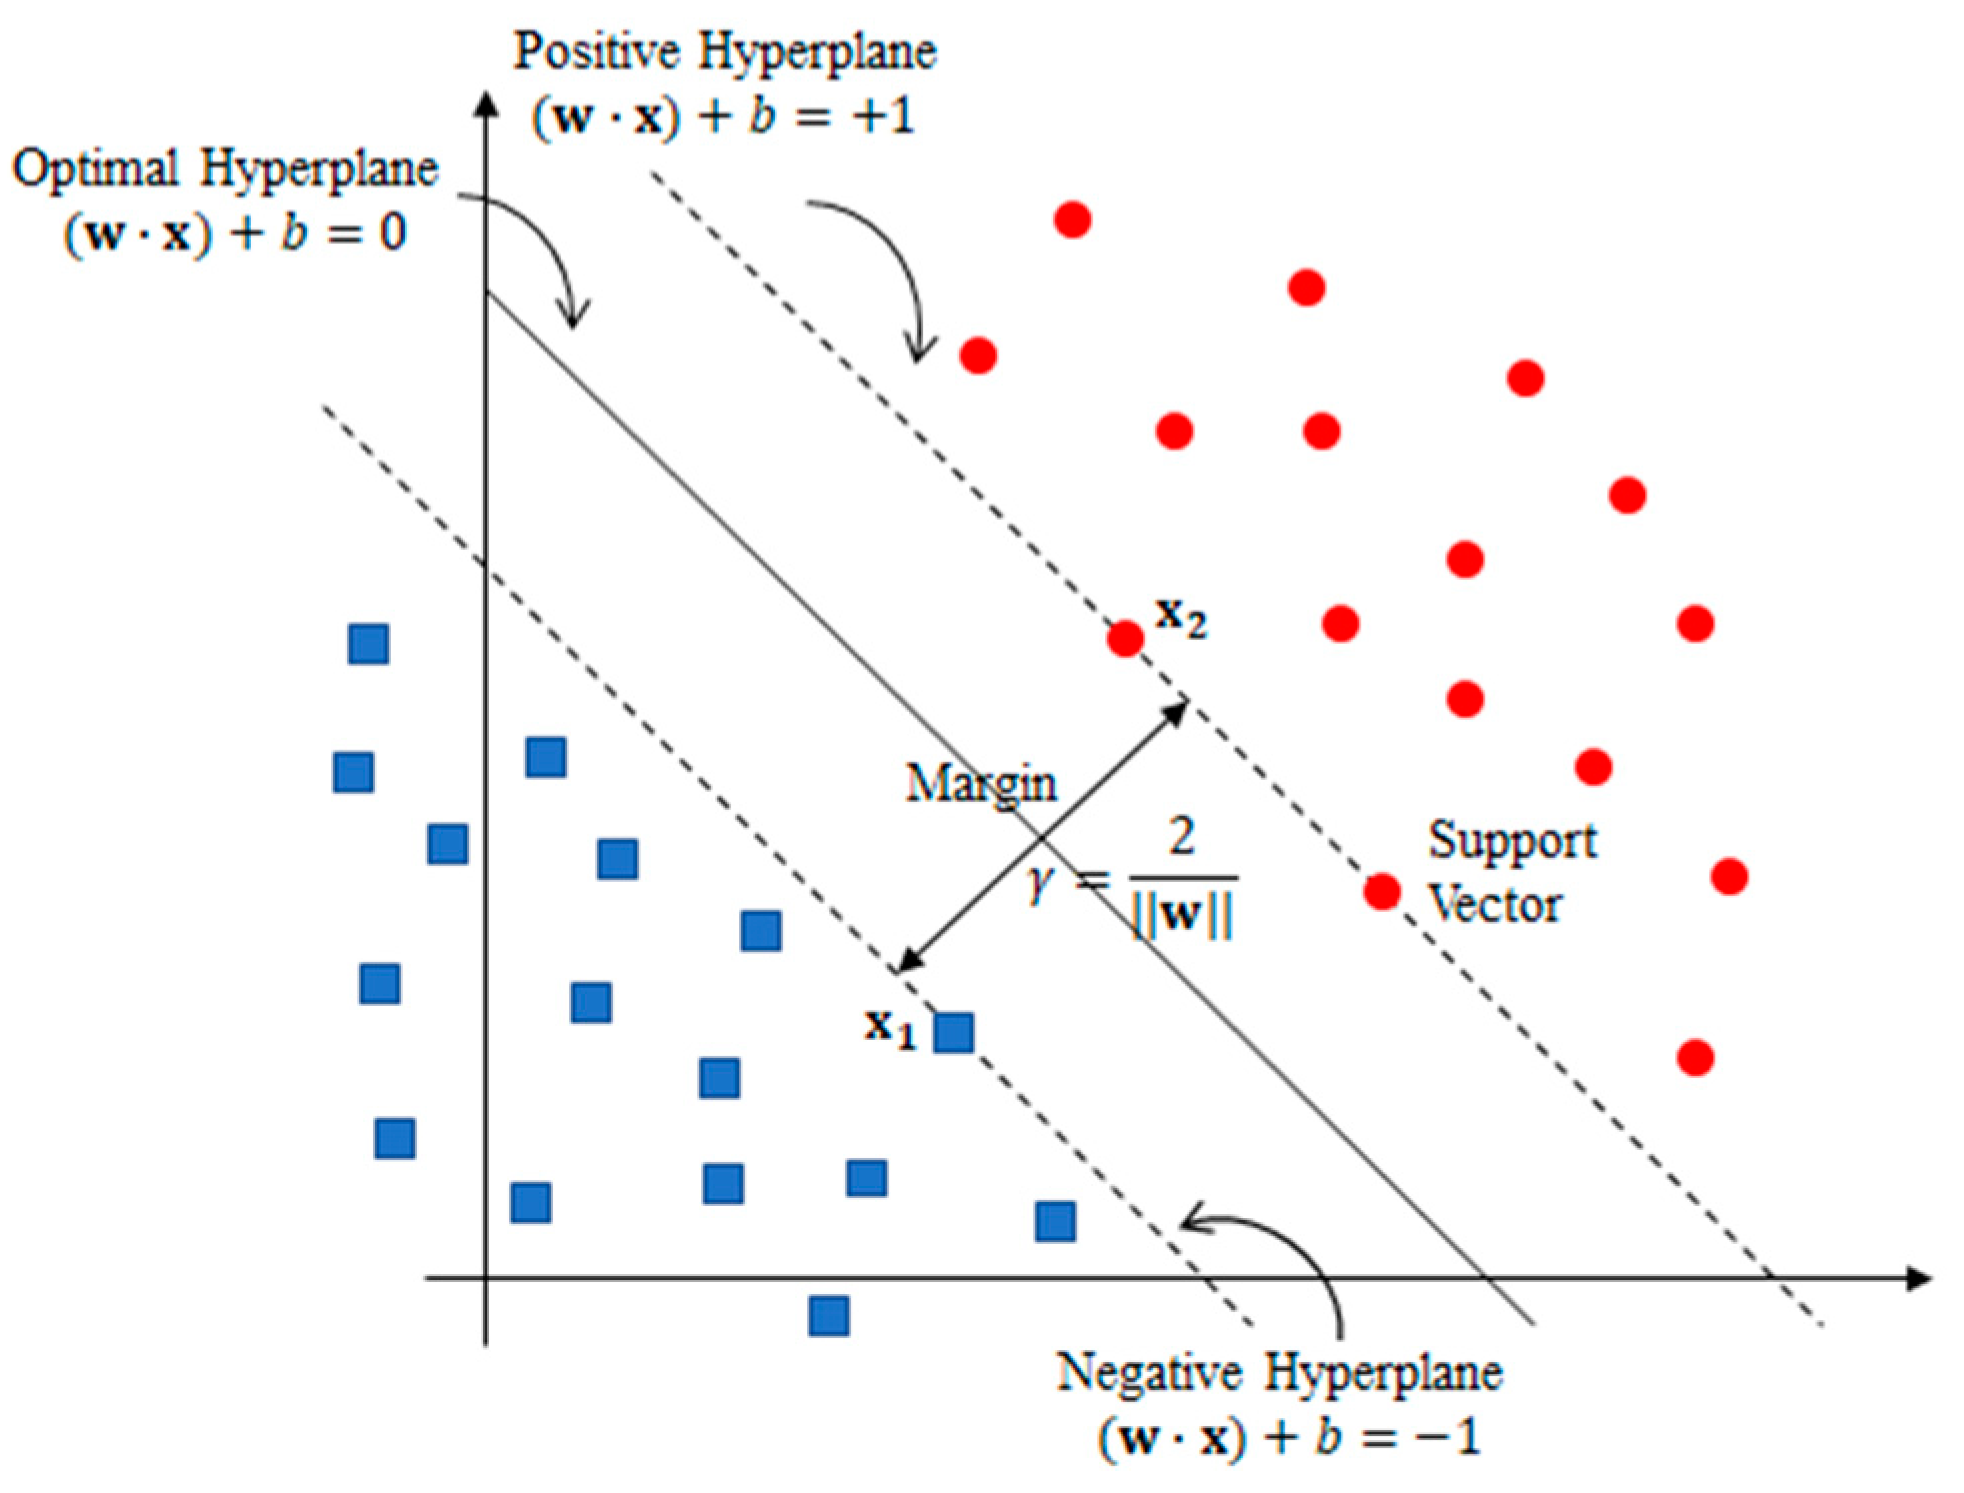
2.5. SVM Classification Model

Support Vector Machine (SVM) is an algorithm-supervised learning method that analyzes data and recognizes patterns, used for classification and regression analysis [32]. The purpose of SVM is to find the function that is an exact prediction of the output value from a given input [33]. SVM classification is performed by finding a hyperplane or decision boundary that separates one class from another. The best hyperplane can be determined by measuring the margin of the hyperplane and finding the maximum point [34]. The margin is the distance between the hyperplane and the closest patterns (support vectors) from each class. The components of SVM consist of the optimal hyperplane, positive hyperplane, negative hyperplane, and margin.
The notation for SVM calculations consists of the variables x i for input data, y i for labels, w for the weight vector, and b for the bias scalar with x i R n ,   y i 1 , + 1 for i = 1 , 2 , ,   N where N is the number of training documents. The optimal hyperplane is defined by Equation (7).
w · x + b = 0
Let x 2 be the support vector in the positive class and x 1 be the support vector in the negative class. The positive hyperplane is obtained from Equation (8), and the negative hyperplane is obtained from Equation (9).
w · x 2 + b = 1
w · x 1 + b = 1
Support Vector Machine can be formulated as Equation (10) for y i = + 1 and Equation (11) for y i = 1 [35].
w · x i + b 1
w · x i + b 1
The margin γ can be obtained by calculating the length of the projection of the difference between the support vectors and the w vector in Equation (12).
γ = w w · x 2 x 1
Eliminating the variable b from Equations (8) and (9) results in Equation (13).
w · x 2 w · x 1 = 1 1 w x 2 x 1 = 2
By substituting Equation (13) into Equation (12), the margin γ can be obtained as given in Equation (14).
γ = 2 w
The components of SVM in Equations (7)–(10) are illustrated in Figure 2.
The largest margin can be obtained by maximizing the distance between the hyperplane and its closest point, which is 1 w . Maximizing 1 w is equivalent to minimizing w 2 . The problem of finding the hyperplane with the largest margin can be formulated as a quadratic programming problem in Equations (15) and (16).
m i n i m i z e                         1 2 w 2
s u b j e c t   t o                                   y i w · x i + b 1 0 ,   i
The problem in Equations (15) and (16) can be solved using the Lagrange Multiplier method in Equation (17) [36]
L w , b , α = 1 2 w 2 i = 1 N α i y i w · x i + b 1
with α i 0 being the Lagrange Multiplier. The search for the optimum value of L is conducted by taking partial derivatives of L with respect to w and b and setting them equal to zero to obtain Equations (18) and (19).
L w , b , α w = w i = 1 N y i α i x i = 0 w = i = 1 N y i α i x i
L w , b , α b = i = 1 N y i α i = 0 i = 1 N y i α i = 0
By substituting Equations (18) and (19) into Equation (17), Equation (20) is obtained.
L α = i = 1 N α i 1 2 i = j = 1 N α i α j y i y j x i · x j
The problem of finding the best hyperplane can be reformulated as the following maximization problem to determine α i .
m a x i m i z e                   i = 1 N α i 1 2 i = j = 1 N α i α j y i y j x i · x j
s u b j e c t   t o                   i = 1 N y i α i = 0                             α i 0
After obtaining the values of α i , next substitute α i into Equation (18) to obtain the value of w , and the value of b can be obtained from Equation (23).
b = y i w T x i
After obtaining the values of w and b , the input data vector x can be classified using the sign value in Equation (24).
f x = s i g n w · x + b = + 1 ,             w · x + b 0 1 ,             w · x + b < 0
The performance of the model can be evaluated by creating a Confusion Matrix.

2.6. Confusion Matrix

The evaluation of a classification model is obtained from its accuracy by calculating statistical measures such as true positives (TPs), true negatives (TNs), false positives (FPs), and false negatives (FNs). These components form a Confusion Matrix in Table 1 [20]. A Confusion Matrix can be constructed for binary classification models to depict their performance.
The four terms in Table 1 are explained as follows:
  • True Positives (TPs) are the number of positive class data correctly predicted as positive;
  • True Negatives (TNs) are the number of negative class data correctly predicted as negative;
  • False Positives (FPs) are the number of negative class data wrongly predicted as positive;s
  • False Negatives (FNs) are the number of positive class data wrongly predicted as negative.
Based on the values in Table 1, various performance metrics can be determined.

2.7. Performance Metrics

After completing a classification model, it is necessary to conduct testing and evaluation to determine the performance of the classification model. The evaluation results will determine further model development to improve model performance. The most commonly used data mining testing method is to find the values of precision, recall, F1-Score, and accuracy [37]. The explanations of each metric are as follows:
  • Precision
Precision is the ratio of the number of true positive predictions to the total number of positive predictions, or it can be written in Equation (25).
Precision = TP TP + FP
2.
Recall
Recall is the ratio of the number of true positive predictions to the sum of true positive predictions and false negative predictions, or it can be written in Equation (26).
Recall = TP TP + FN
3.
F1-Score
F1-Score is a metric that combines precision and recall, measuring the retrieval success. The calculation of the F1-Score involves the information of false positives and false negatives, making it suitable for imbalanced data cases. The value of the F1-Score is obtained from Equation (27).
F 1 - Score = 2 × Precision × Recall Precision + Recall
4.
Accuracy
Accuracy is the ratio of correct predictions to the total number of data. The calculation of accuracy is obtained from Equation (28).
Accuracy = TP + TN TP + TN + FP + FN
There is no universally fixed value for metrics to determine whether a model is “good” because it all depends on the data used. The calculation of precision, recall, F1-Score, and accuracy yields values ranging from 0 to 1. A good result is one that approaches 1 [38]. The use of accuracy metric is less appropriate for imbalanced datasets where the number of minority class samples is much smaller than the majority class. The model tends to predict the majority class and achieve high accuracy. Precision, recall, and F1-Score metrics provide solutions to address the evaluation problem in imbalanced datasets as they can provide a more comprehensive assessment of the model’s performance on both the majority and minority classes. These metrics serve as a reference for finding models with better performance through hyperparameter tuning.

2.8. Hyperparameter Tuning

A machine learning model will automatically learn and adjust its internal parameters based on the training data [39]. These parameters are referred to as “model parameters” or simply “parameters” for short. However, there are other parameters that need to be configured before the model learning process begins and remain unchanged during the learning process. These parameters are referred to as “hyperparameters”. Model parameters indicate how the input data are transformed into the desired output, while hyperparameters determine how the model is structured. All classification model hyperparameters will affect the model’s performance outcomes.
Hyperparameter tuning is the process of adjusting the hyperparameters of a machine learning model to produce a better-performing model. This process involves taking the current model’s performance with the modified hyperparameter values and comparing them to the previous model’s performance. The determination of the best hyperparameter is achieved by comparing the classification results based on accuracy, precision, recall, and F1-Score metrics [40]. The hyperparameters of the SVM method include C , kernel, degree, and gamma.
In the context of this study, the focus lies on tuning the hyperparameter C of the Support Vector Machine (SVM) method through the use of grid search. This approach involves systematically assessing a range of hyperparameter C values to pinpoint the configuration that leads to the most favorable model performance. The objective is to attain a refined model that adeptly captures the underlying data patterns while accounting for the complexities of the classification task.

3. Results

3.1. Data

The dataset utilized for this research comprises reviews of the Mobile JKN application, sourced from the Google Play Store’s digital distribution platform. Spanning from 1 February 2023 to 20 March 2023, the dataset encompasses a total of 7020 data points. Among these, 4777 instances manifest positive sentiment, while 2243 instances convey negative sentiment. This distribution illustrates an inherent class imbalance within the dataset, classifying it as an imbalanced dataset. Consequently, for the optimization of hyperparameters, the F1-Score emerges as the most pertinent metric, effectively addressing the intricacies of imbalanced classes.
The chosen dataset resonates with significance on several fronts. Its origin from a popular digital platform mirrors real-world user sentiments, rendering it authentic and indicative of user experiences. The imbalanced nature of the dataset parallels real-world scenarios where positive sentiments tend to outweigh negative sentiments, underscoring the relevance of handling imbalanced datasets within the domain of sentiment analysis. The dataset’s temporal scope encapsulates recent user feedback, aligning with contemporary user perceptions of the Mobile JKN application.
Furthermore, this dataset selection affords the opportunity to explore the challenges and strategies associated with class imbalance mitigation and hyperparameter optimization. The distinct characteristics of the dataset, including its volume, sentiment distribution, and relevance, converge to form a valuable foundation for investigating the efficacy of the proposed SVM and Chi-Square feature selection methodology. Through its intrinsic representation of real-world user sentiments, the dataset contributes both contextual authenticity and analytical depth to the research, ultimately enriching the study’s validity and applicability.
In essence, the dataset serves as a pivotal component of this research, epitomizing the interplay between authentic sentiment data, imbalanced class representation, and the proposed methodology’s effectiveness. The sample data can be seen in Table 2.

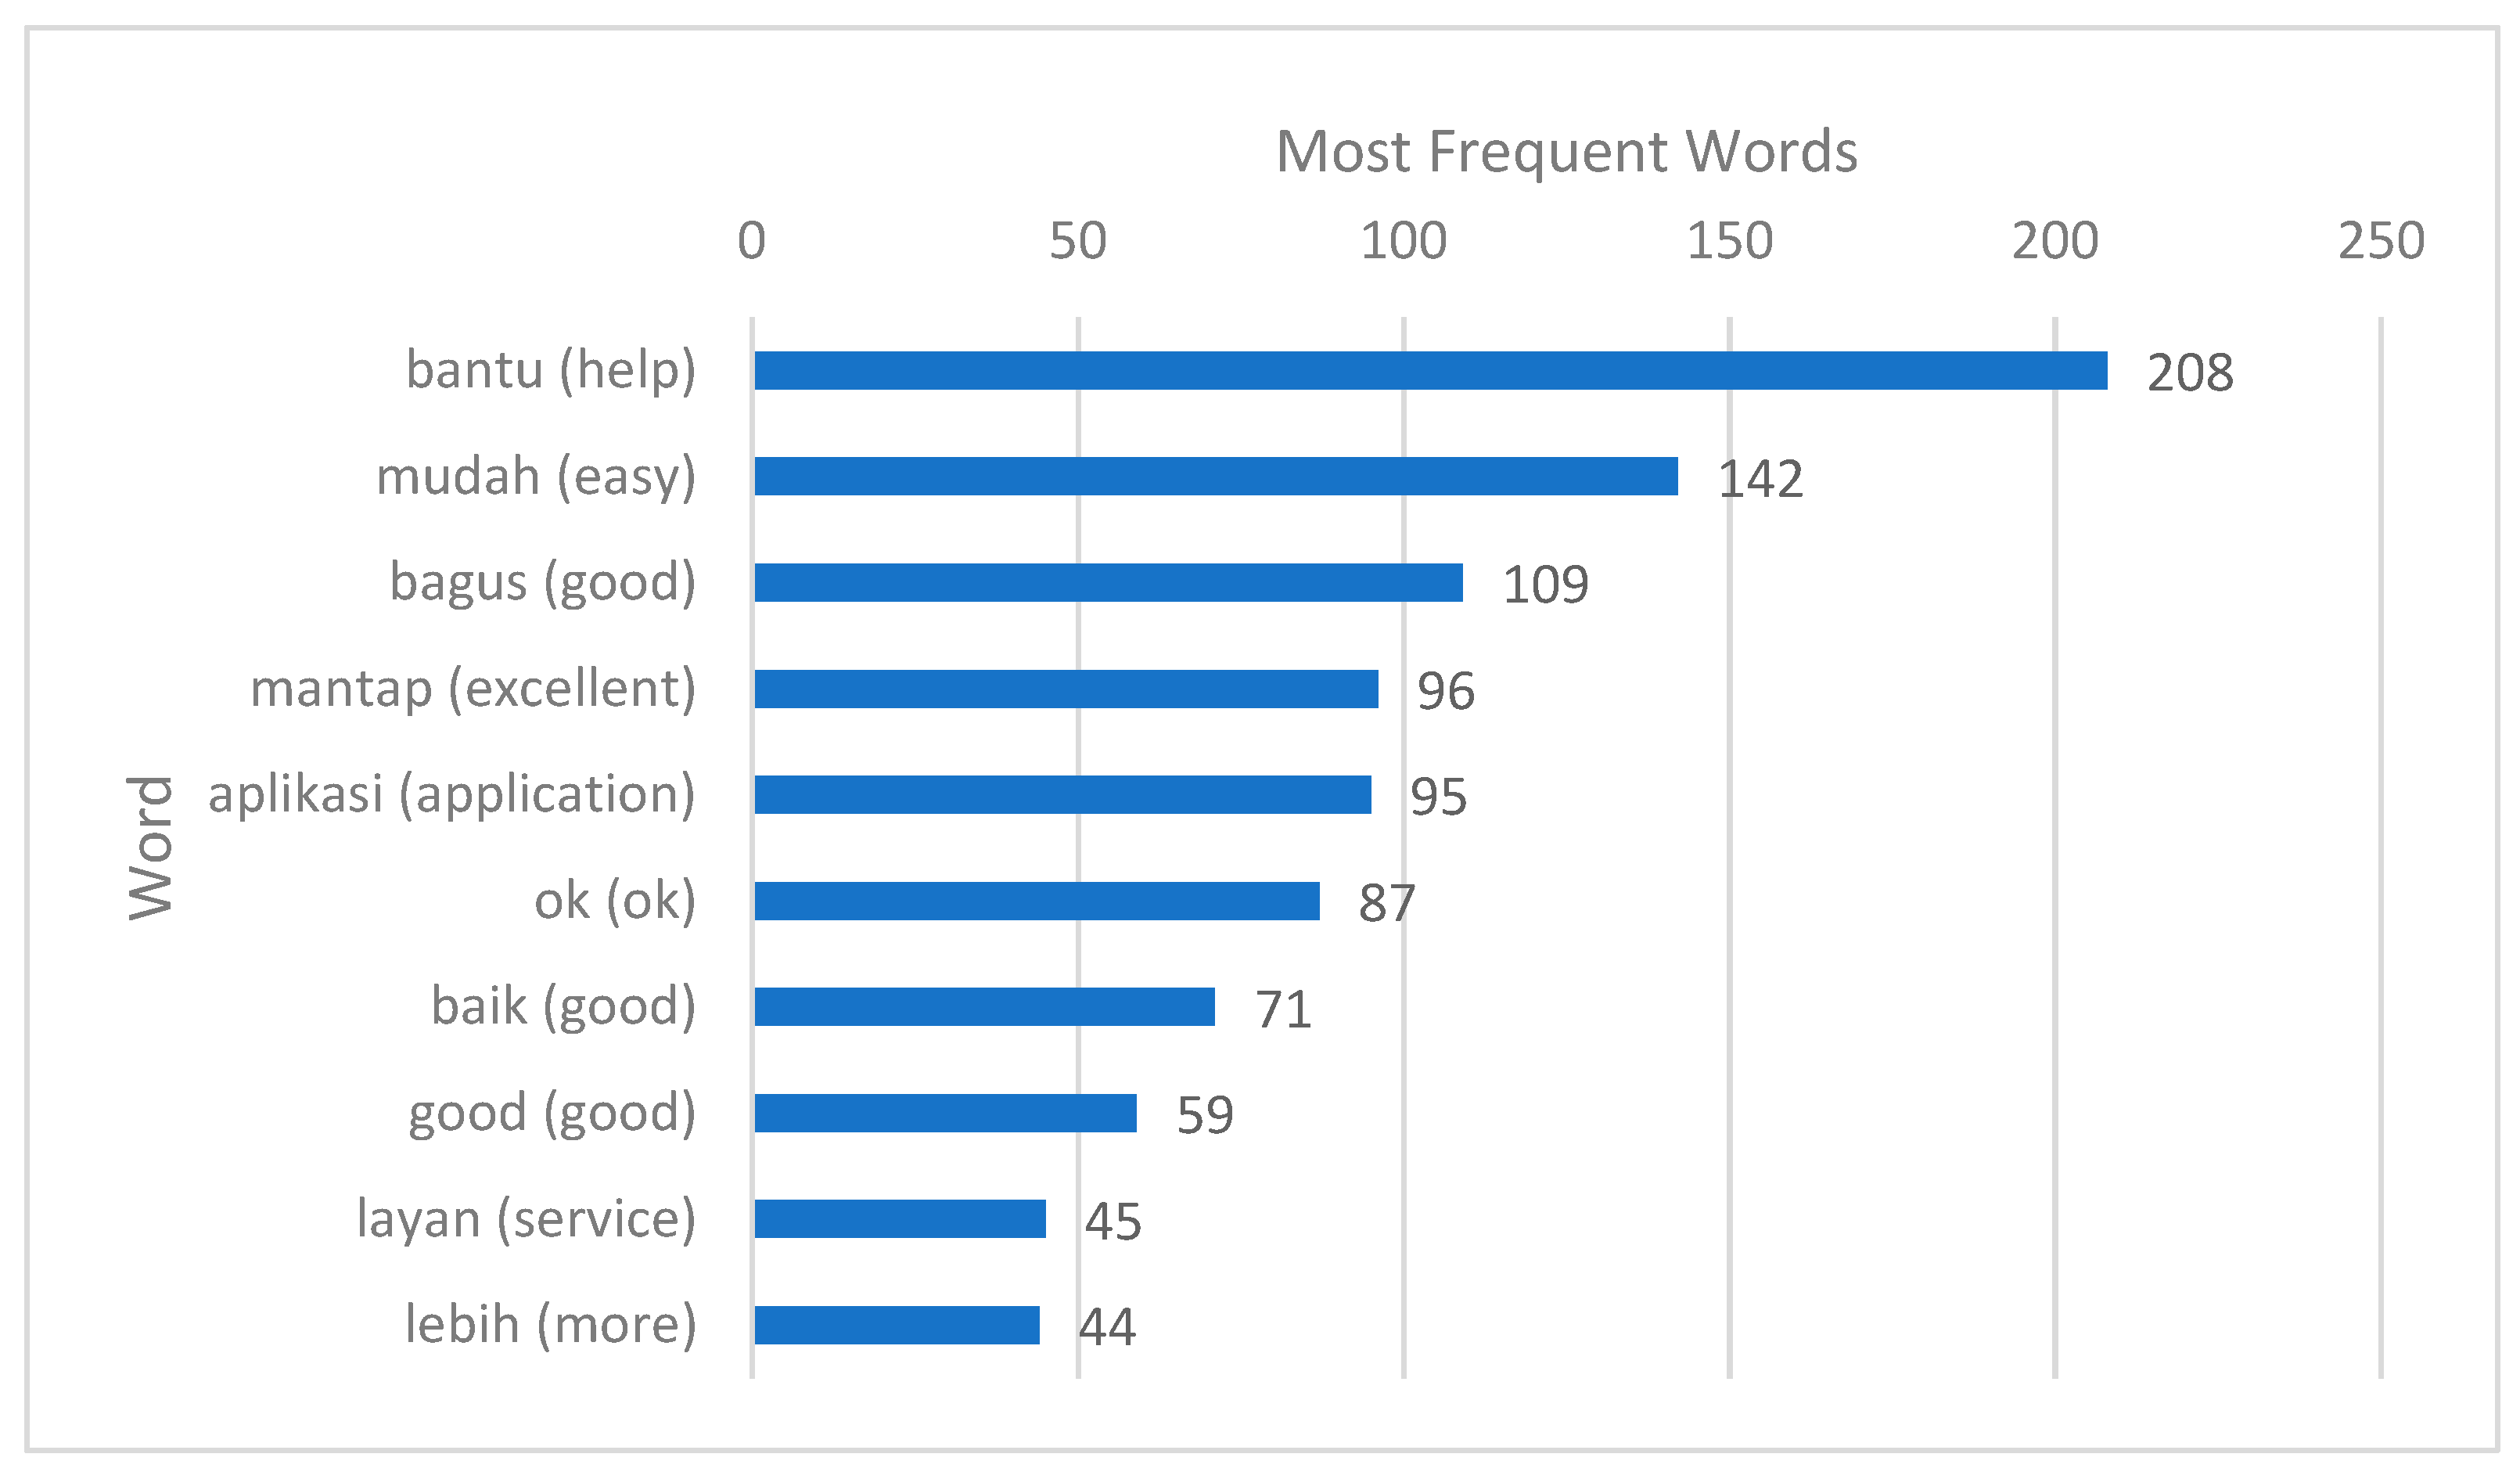
3.2. Preprocessed Data

Text preprocessing is performed on labeled data. This process involves several steps, including case folding to convert all letters to lowercase, stopword filtering to remove meaningless words, tokenizing to separate sentences into individual words, and stemming to derive the base form of words with affixes. Additionally, abbreviations are replaced with relevant full-length words, and special characters such as punctuation marks or emojis are removed. This stage also includes removing numbers that appear at the end of words, for example, transforming the word “masing2” to “masing”.
Empty (null) review data are removed after this stage. Out of the total 7020 data points, there are 148 empty data points, resulting in 6872 data points after undergoing text preprocessing. Sample data that have undergone text preprocessing can be seen in Table 3.

3.3. Chi-Square Feature Selection

The preprocessed data are divided into a training dataset of 80% and a test dataset of 20%. The training dataset consists of 5497 review data, while the test dataset contains 1375 review data. The training dataset consists of 1800 reviews with positive sentiment and 3697 reviews with negative sentiment, based on their classes.
Feature selection using Chi-Square is performed by calculating the χ 2 t value for each term t using Equations (1) and (2). There are 2996 unique words in the training data that will be potential features in the SVM classification model. The selection of features or words used in creating the classification model is achieved by taking the top 1000 words with the highest Chi-Square values. Sample results of the Chi-Square calculations can be seen in Table 4.
Based on Table 4, the words “tidak”, “bisa”, “daftar”, and “aplikasi” have the highest Chi-Square values. This indicates that these words are the most relevant in determining the classification class. On the other hand, the words “putar” and “aktip” have the lowest Chi-Square values, suggesting that these words are less relevant in determining the classification class.

3.4. SVM Classification Model and Hyperparameter Tuning

The test data obtained from the previous data splitting consist of 1375 reviews. The test data, which have undergone text preprocessing, feature selection and TF-IDF word representation, produce input vectors x for the SVM classification method. Hyperparameter tuning is performed on the regularized constant C , and the results are obtained in Table 5.
Based on the F1-Score metric, the best performing model achieved an accuracy of 96.82% with a hyperparameter C of 10. The model has an accuracy rate of 95.56% in correctly classifying the test data. Additionally, the model has a precision of 96.98%, indicating that the majority of data classified as positive by the model are truly positive out of the entire test data. The recall obtained by this model is 96.67%, demonstrating the extent to which the model can accurately find and classify positive data overall.
In this study, the hyperparameter C was set to 100 to establish a foundational model for benchmarking the performance of various hyperparameter values. This choice provided a consistent reference point for evaluating alternative parameter configurations.
As part of the ablation study, the model’s performance was systematically assessed using different feature subsets. Notably, when employing the entire feature set consisting of 2996 words, the model achieved an F1-Score of 95,09%, highlighting its proficiency in capturing sentiment variations across a wide range of linguistic features.
Of particular interest, the model’s performance further improved when feature selection reduced the feature set to 1000 words, resulting in an impressive 96,43% F1-Score. This 1.34% increase in F1-Score underscores the impact of feature selection on enhancing the model’s discriminative capability. These findings suggest that the strategic curation of a more compact feature set, achieved through Chi-Square feature selection, can enhance sentiment analysis accuracy.

3.5. Label Prediction

The test data are classified using the tuned SVM model. Sample classification of the test data with the tuned classification model can be seen in Table 6.
The prediction results using the model can be visualized in Figure 3.
Figure 3 shows that out of 1375 reviews in the test data, 69.74% (959 reviews) are of positive sentiment and 30.25% (416 reviews) are of negative sentiment. Furthermore, the calculation of the most frequently occurring words in each sentiment class is conducted to understand the message conveyed by the users.

3.5.1. Positive Reviews Data

The analysis of the sentiment distribution within user reviews of the Mobile JKN application reveals noteworthy insights. As depicted in Figure 4, the visualization of the most frequently occurring words in positive reviews highlights prominent terms such as “bantu” (help), “mudah” (easy), “bagus” (good), “mantap” (excellent), and “aplikasi” (application). These recurring words signify the positive sentiment conveyed by users, indicating a favorable experience with the Mobile JKN application. Notably, the use of terms like “bantu” (help) and “mudah” (easy) suggests that users find the application helpful and user-friendly, enhancing their perception of the overall service quality. The appearance of words like “bagus” (good) and “mantap” (excellent) further corroborates the positive sentiment, indicating users’ satisfaction with the application’s performance. This linguistic analysis underscores the alignment between user expectations and the application’s actual utility. Such an interpretation emphasizes the successful implementation of the Mobile JKN application, as affirmed by users’ positive expressions.

3.5.2. Negative Reviews Data

The examination and interpretation of results pertaining to user reviews of the Mobile JKN application warrant a more comprehensive analysis. As illustrated in Figure 5, a closer examination of the most frequently encountered terms within negative reviews brings to light prominent words such as “tidak” (not), “bisa” (can), “aplikasi” (application), “daftar” (register), and “nomor” (number). These prevalent terms signify recurring themes in negative sentiment reviews, which often encompass specific grievances voiced by users. An overarching concern shared by users is the perceived difficulty in the registration process within the application and challenges associated with registered phone numbers. Such insights underscore the practical challenges users encounter during their interaction with the application. Furthermore, the appearance of terms like “masuk” (login), “susah” (difficult), “error” (error), and “harus” (must) highlights additional areas of frustration and discontent experienced by users. The lack of ease during the login process and the presence of errors contribute to user dissatisfaction, leading to the expression of negative sentiments in their reviews. This analysis elucidates the nuances of negative feedback, emphasizing the specific pain points faced by users while navigating the application. A more profound exploration of these findings enhances our understanding of user experience and provides valuable insights for potential enhancements to address the identified challenges.

4. Computation Complexity Analysis

Gaining insights into the computational demands intrinsic to the adopted sentiment analysis methodology is pivotal for assessing its feasibility and efficiency in practical applications. This section presents a comprehensive analysis of the computational complexity linked with key stages of the approach. The complexity is measured in terms of time taken and memory usage.

4.1. Data Preprocessing

  • Time: 236.8210 s
  • Memory: 119,472 bytes
The data preprocessing stage involves tokenization, stemming, and stopword removal. The substantial time required for preprocessing is attributed to the comprehensive textual manipulation and transformation processes. The memory usage is influenced by the size of the processed text data.

4.2. Feature Selection

  • Time: 68.3171 s
  • Memory: 26,088 bytes
Feature selection involves identifying the most relevant features using Chi-Square. While the time duration is relatively significant, the memory usage is reasonable due to the compact representation of feature selection results.

4.3. Word Representation

  • All 2996 features:
    Time: 0.0346 s
    Memory: 48 bytes
  • Selected 1000 Features:
    Time: 0.0317 s
    Memory: 48 bytes
The word representation phase, encompassing the conversion of text into TF-IDF vectors, demonstrates minimal time consumption and memory utilization. Even with a substantial number of features, the memory footprint remains low.

4.4. Model Training

  • All 2996 features:
    Time: 0.6502 s
    Memory: 48 bytes
  • Selected 1000 Features:
    Time: 0.5037 s
    Memory: 48 bytes
The model training stage affirms our methodology’s efficiency, showcasing rapid execution times and negligible memory consumption for both the complete feature set and the feature-selected subset. This streamlined training process is the result of judicious utilization of optimized hyperparameters and the application of the agile SVM algorithm.
In the context of feature selection, these observations concretely illustrate its role in improving performance, as highlighted by the reduction in time and the preservation of memory resources. The judicious curation of features not only enhances computational efficiency but also facilitates expedited training, ultimately contributing to a more robust and efficient sentiment analysis framework.

5. Discussion

The amalgamation of Chi-Square feature selection and the SVM classification technique establishes a compelling innovation in the realm of sentiment analysis for Indonesia’s National Health Insurance mobile application reviews. The method’s effectiveness is underpinned by distinct factors.
Primarily, the incorporation of Chi-Square feature selection augments the model’s potency. The strategic curation of relevant features bolsters the classifier’s discriminatory prowess. By spotlighting salient linguistic indicators, the model becomes adept at unraveling intricate nuances of sentiment embedded in the dataset.
Furthermore, the adoption of the SVM classification algorithm aligns seamlessly with the intricate fabric of textual data prevalent in reviews. The algorithm’s aptitude for deciphering non-linear relationships within features and sentiments aligns harmoniously with the task at hand. The pragmatic selection of the “linear” kernel underscores both the model’s computational efficiency and efficacy in capturing the essence of sentiment.
The efficacy of hyperparameter tuning, specifically the calibration of the regularized constant and kernel parameters, stands as a significant contributor to the enhanced performance. The meticulous optimization of these parameters harmonizes the model’s behavior with the unique attributes of the dataset, facilitating robust generalization and heightened classification accuracy.
Lastly, the extensive evaluation process and meticulous data collection, encompassing a substantial corpus of Indonesian reviews from the Google Play Store, enrich the model with a comprehensive and diverse dataset. This resourcefulness empowers the model to extrapolate adeptly, accommodating the spectrum of sentiment expressions intrinsic to user reviews.
Reviewing the results obtained from this research, the novelty of this papers can be highlighted in detail as follows. The novelty of this work resides in the innovative application of a comprehensive framework for sentiment analysis. Our study brings together a combination of methods and processes, including Support Vector Machine (SVM) classification and Chi-Square feature selection, integrated within the context of user reviews. Additionally, we incorporate techniques such as TF-IDF representation and meticulous text preprocessing to enhance the effectiveness of our approach.

6. Conclusions

The sentiment analysis results for user reviews of the Mobile JKN application were obtained through the SVM classification method along with Chi-Square feature selection. The findings reveal a notable trend towards positive reviews, encompassing 69.74% of the total feedback. The most successful sentiment analysis model applied to reviews of the Mobile JKN application employed the SVM classification technique combined with Chi-Square feature selection, showcasing an impressive F1-Score performance of 96.82%. In terms of refining the sentiment analysis process, it was determined that the optimal value for the regularized constant hyperparameter within the SVM method, evaluated using the F1-Score metric, is 10.
In light of these outcomes, Indonesia’s National Health Insurance (BPJS Kesehatan) can leverage the insights derived from this sentiment analysis to enhance user satisfaction. This involves the preservation of features that garner favorable user opinions and the implementation of improvements across various service aspects. These improvements encompass streamlining the technical registration process, rectifying bug errors, and addressing issues such as complaints related to non-functional numbers. Through the strategic utilization of these findings, Indonesia’s National Health Insurance can elevate the Mobile JKN application’s overall user experience.

Author Contributions

Conceptualization, E.H., H.N. and F.; methodology, E.H.; software, E.H.; validation, E.H., H.N. and F.; formal analysis, E.H.; investigation, E.H.; resources, E.H.; data curation, E.H.; writing—original draft preparation, E.H.; writing—review and editing, E.H., H.N. and F.; visualization, E.H.; supervision, H.N. and F.; project administration, E.H.; funding acquisition, H.N. All authors have read and agreed to the published version of the manuscript.

Funding

This research was funded by Universitas Padjadjaran through Riset Percepatan Lektor Kepala (RPLK), contract number 1549/UN6.3.1/PT.00/2023.

Data Availability Statement

The data in this paper are accessible via the following link: https://github.com/ewenhokijuliandy/JKN-Research-Data.

Conflicts of Interest

The authors declare no conflict of interest.

References

  1. Kementrian Kesehatan Republik Indonesia. Profil Kesehatan Indonesia Tahun 2021; Sibuea, F., Hardhana, B., Widiantini, W., Eds.; Kementerian Kesehatan Republik Indonesia: Jakarta, Indonesia, 2022. [Google Scholar]
  2. Agustina, R.; Dartanto, T.; Sitompul, R.; Susiloretni, K.A.; Achadi, E.L.; Taher, A.; Wirawan, F.; Sungkar, S.; Sudarmono, P.; Shankar, A.H.; et al. Universal Health Coverage in Indonesia: Concept, Progress, and Challenges. Lancet 2019, 393, 75–102. [Google Scholar] [CrossRef] [PubMed]
  3. Anam, K. Pandemi Dorong Inovasi Layanan Digital BPJS Kesehatan. Available online: https://news.detik.com/berita/d-5758142/pandemi-dorong-inovasi-layanan-digital-bpjs-kesehatan (accessed on 15 February 2023).
  4. Humas BPJS Kesehatan Ikuti Perkembangan Zaman, Mobile JKN Satu Genggaman Untuk Berbagai Kemudahan. Available online: https://www.bpjs-kesehatan.go.id/bpjs/post/read/2020/1671/Ikuti-Perkembangan-Zaman-Mobile-JKN-Satu-Genggaman-Untuk-Berbagai-Kemudahan (accessed on 3 March 2023).
  5. Nasukawa, T.; Yi, J. Sentiment Analysis: Capturing Favorability Using Natural Language Processing. In Proceedings of the 2nd International Conference on Knowledge Capture, Sanibel Island, FL, USA, 23–25 October 2003; pp. 70–77. [Google Scholar]
  6. Medhat, W.; Hassan, A.; Korashy, H. Sentiment Analysis Algorithms and Applications: A Survey. Ain Shams Eng. J. 2014, 5, 1093–1113. [Google Scholar] [CrossRef]
  7. Shaik, T.; Tao, X.; Dann, C.; Xie, H.; Li, Y.; Galligan, L. Sentiment Analysis and Opinion Mining on Educational Data: A Survey. Nat. Lang. Process. J. 2022, 2, 100003. [Google Scholar] [CrossRef]
  8. Wu, S.; Fei, H.; Ren, Y.; Ji, D.; Li, J. Learn from Syntax: Improving Pair-Wise Aspect and Opinion Terms Extractionwith Rich Syntactic Knowledge. arXiv 2021, arXiv:210502520. [Google Scholar]
  9. Tian, Y.; Chen, W.; Hu, B.; Song, Y.; Xia, F. End-to-End Aspect-Based Sentiment Analysis with Combinatory Categorial Grammar. In Proceedings of the Findings of the Association for Computational Linguistics: ACL 2023, Toronto, ON, Canada, 9–14 July 2023; pp. 13597–13609. [Google Scholar]
  10. Li, Z.; Zou, Y.; Zhang, C.; Zhang, Q.; Wei, Z. Learning Implicit Sentiment in Aspect-Based Sentiment Analysis with Supervised Contrastive Pre-Training. arXiv 2021, arXiv:211102194. [Google Scholar]
  11. Shi, W.; Li, F.; Li, J.; Fei, H.; Ji, D. Effective Token Graph Modeling Using a Novel Labeling Strategy for Structured Sentiment Analysis. arXiv 2022, arXiv:220310796. [Google Scholar]
  12. Fei, H.; Chua, T.-S.; Li, C.; Ji, D.; Zhang, M.; Ren, Y. On the Robustness of Aspect-Based Sentiment Analysis: Rethinking Model, Data, and Training. ACM Trans. Inf. Syst. 2022, 41, 1–32. [Google Scholar] [CrossRef]
  13. Huang, J.; Meng, Y.; Guo, F.; Ji, H.; Han, J. Weakly-Supervised Aspect-Based Sentiment Analysis via Joint Aspect-Sentiment Topic Embedding. arXiv 2020, arXiv:201006705. [Google Scholar]
  14. Li, B.; Fei, H.; Wu, Y.; Zhang, J.; Wu, S.; Li, J.; Liu, Y.; Liao, L.; Chua, T.-S.; Li, F.; et al. Diaasq: A Benchmark of Conversational Aspect-Based Sentiment Quadruple Analysis. arXiv 2022, arXiv:221105705. [Google Scholar]
  15. Fei, H.; Zhang, Y.; Ren, Y.; Ji, D. Latent Emotion Memory for Multi-Label Emotion Classification. In Proceedings of the AAAI Conference on Artificial Intelligence, Washington, DC, USA, 7–14 February 2023; 2020; Volume 34, pp. 7692–7699. [Google Scholar]
  16. Uysal, A.K.; Gunal, S. The Impact of Preprocessing on Text Classification. Inf. Process. Manag. 2014, 50, 104–112. [Google Scholar] [CrossRef]
  17. Şahin, D.Ö.; Klç, E. Two New Feature Selection Metrics for Text Classification. Autom. Časopis Za Autom. Mjer. Elektron. Račun. Komun. 2019, 60, 162–171. [Google Scholar] [CrossRef]
  18. Padurariu, C.; Breaban, M.E. Dealing with Data Imbalance in Text Classification. Procedia Comput. Sci. 2019, 159, 736–745. [Google Scholar] [CrossRef]
  19. Mantovani, R.G.; Rossi, A.L.D.; Alcobaça, E.; Vanschoren, J.; de Carvalho, A.C. A Meta-Learning Recommender System for Hyperparameter Tuning: Predicting When Tuning Improves SVM Classifiers. Inf. Sci. 2019, 501, 193–221. [Google Scholar] [CrossRef]
  20. Sari, E.D.N.; Irhamah, I. Analisis Sentimen Nasabah Pada Layanan Perbankan Menggunakan Metode Regresi Logistik Biner, Naïve Bayes Classifier (NBC), Dan Support Vector Machine (SVM). J. Sains Dan Seni ITS 2020, 8, D177–D184. [Google Scholar] [CrossRef]
  21. Mahendrajaya, R.; Buntoro, G.A.; Setyawan, M.B. Analisis Sentimen Pengguna Gopay Menggunakan Metode Lexicon Based Dan Support Vector Machine. KOMPUTEK 2019, 3, 52–63. [Google Scholar] [CrossRef]
  22. Cahyono, Y.; Unpam, T.I. Analisis Sentiment Pada Sosial Media Twitter Menggunakan Naïve Bayes Classifier Dengan Feature Selection Particle Swarm Optimization Dan Term Frequency. METODE 2017, 81, 67. [Google Scholar] [CrossRef]
  23. Septiana, R.D.; Susanto, A.B.; Tukiyat, T. Analisis Sentimen Vaksinasi Covid-19 Pada Twitter Menggunakan Naive Bayes Classifier Dengan Feature Selection Chi-Squared Statistic Dan Particle Swarm Optimization. J. SISKOM-KB Sist. Komput. Dan Kecerdasan Buatan 2021, 5, 49–56. [Google Scholar] [CrossRef]
  24. Luthfiana, L.; Young, J.C.; Rusli, A. Implementasi Algoritma Support Vector Machine Dan Chi Square Untuk Analisis Sentimen User Feedback Aplikasi. Ultim. J. Tek. Inform. 2020, 12, 125–126. [Google Scholar] [CrossRef]
  25. Pelayanan Peserta BPJS Kesehatan. Panduan Layanan Bagi Peserta JKN-KIS Tahun 2022; Humas BPJS Kesehatan: Jakarta, Indonesia, 2022. [Google Scholar]
  26. Bahri, S.; Amri, A.; Siregar, A.A. Analisis Kualitas Pelayanan Aplikasi Mobile JKN BPJS Kesehatan Menggunakan Metode Service Quality (SERVQUAL). Ind. Eng. J. 2022, 11, 12–18. [Google Scholar] [CrossRef]
  27. Alam, S.; Yao, N. The Impact of Preprocessing Steps on the Accuracy of Machine Learning Algorithms in Sentiment Analysis. Comput. Math. Organ. Theory 2019, 25, 319–335. [Google Scholar] [CrossRef]
  28. Putra, O.V.; Wasmanson, F.M.; Harmini, T.; Utama, S.N. Sundanese Twitter Dataset for Emotion Classification. In Proceedings of the 2020 International Conference on Computer Engineering, Network, and Intelligent Multimedia (CENIM), Surabaya, Indonesia, 17–18 November 2020; pp. 391–395. [Google Scholar]
  29. HaCohen-Kerner, Y.; Miller, D.; Yigal, Y. The Influence of Preprocessing on Text Classification Using a Bag-of-Words Representation. PLoS ONE 2020, 15, e0232525. [Google Scholar] [CrossRef] [PubMed]
  30. Amrullah, A.Z.; Anas, A.S.; Hidayat, M.A.J. Analisis Sentimen Movie Review Menggunakan Naive Bayes Classifier Dengan Seleksi Fitur Chi Square. J. Bumigora Inf. Technol. BITe 2020, 2, 40–44. [Google Scholar]
  31. Suharno, C.F.; Fauzi, M.A.; Perdana, R.S. Klasifikasi Teks Bahasa Indonesia Pada Dokumen Pengaduan Sambat Online Menggunakan Metode K-Nearest Neighbors Dan Chi-Square. J. Pengemb. Teknol. Inf. Dan Ilmu Komput. E-ISSN 2017, 2548, 964X. [Google Scholar] [CrossRef]
  32. Saraswati, N.W.S. Text Mining Dengan Metode Naïve Bayes Classifier Dan Support Vector Machines Untuk Sentiment Analysis. Univ. Udayana Tek. Elektro Denpasar Univ. Udayana 2011, 1, 45–48. [Google Scholar]
  33. Kraiklang, R.; Chueadee, C.; Jirasirilerd, G.; Sirirak, W.; Gonwirat, S. A Multiple Response Prediction Model for Dissimilar AA-5083 and AA-6061 Friction Stir Welding Using a Combination of AMIS and Machine Learning. Computation 2023, 11, 100. [Google Scholar] [CrossRef]
  34. Ariyanto, R.A.; Chamidah, N. Sentiment Analysis for Zoning System Admission Policy Using Support Vector Machine and Naive Bayes Methods. J. Phys. Conf. Ser. 2021, 1776, 12058. [Google Scholar] [CrossRef]
  35. Hadna, N.M.S.; Santosa, P.I.; Winarno, W.W. Studi Literatur Tentang Perbandingan Metode Untuk Proses Analisis Sentimen Di Twitter. In Proceedings of the Seminar Nasional Teknologi Informasi dan Komunikasi 2016, Yogyakarta, Indonesia, 18–19 March 2016; Volume 2016, pp. 57–64. [Google Scholar]
  36. Cristianini, N.; Shawe-Taylor, J. An Introduction to Support Vector Machines and Other Kernel-Based Learning Methods; Cambridge University Press: Cambridge, UK, 2000. [Google Scholar]
  37. Arifin, N.; Enri, U.; Sulistiyowati, N. Penerapan Algoritma Support Vector Machine (SVM) Dengan TF-IDF N-Gram Untuk Text Classification. STRING Satuan Tulisan Ris. Dan Inov. Teknol. 2021, 6, 129–136. [Google Scholar] [CrossRef]
  38. Gifari, O.I.; Adha, M.; Hendrawan, I.R.; Durrand, F.F.S. Analisis Sentimen Review Film Menggunakan TF-IDF Dan Support Vector Machine. J. Inf. Technol. 2022, 2, 36–40. [Google Scholar] [CrossRef]
  39. Elgeldawi, E.; Sayed, A.; Galal, A.R.; Zaki, A.M. Hyperparameter Tuning for Machine Learning Algorithms Used for Arabic Sentiment Analysis. Informatics 2021, 8, 79. [Google Scholar] [CrossRef]
  40. Phongying, M.; Hiriote, S. Diabetes Classification Using Machine Learning Techniques. Computation 2023, 11, 96. [Google Scholar] [CrossRef]
Figure 1. Research flowchart.
Mathematics 11 03765 g001
Figure 2. SVM components.
Mathematics 11 03765 g002
Figure 3. Distribution of sentiment classes in the classification result.
Mathematics 11 03765 g003
Figure 4. The word that appears the most in the positive class.
Mathematics 11 03765 g004
Figure 5. The word that appears the most in the negative class.
Mathematics 11 03765 g005
Table 1. Confusion Matrix.
Predict: PositivePredict: Negative
Actual: PositiveTPFN
Actual: NegativeFPTN
Table 2. Sample of raw data and labels.
Sample ReviewsEnglish TranslationLabel
aplikasi nya susah, captcha untuk login ngk keluar2The application is hard to use and the captcha for login doesn’t appear.Negative
G bisa update ...lelet tiap mlmCannot update… very slow every night.Negative
Mempermudah masyaraktFacilitate societyPositive
Bagus ada peningkatanIt’s good to see improvement.Positive
Table 3. Sample of preprocessed data.
Raw ReviewsPreprocessed Reviews
aplikasi nya susah, captcha untuk login ngk keluar2“aplikasi”, “susah”, “captcha”, “login”, “ngk”, “keluar”
G bisa update ...lelet tiap mlm“tidak”, “bisa”, “update”, “lambat”, “mlm’
Mempermudah masyarakt“mudah”, “masyarakat”
Bagus ada peningkatan“bagus”, “ada”, “tingkat”
Table 4. Sample of Chi-Square values.
No. Term t χ 2 t
1tidak3944.972542
2bisa2575.768594
3daftar2391.238341
4aplikasi1227.094684
2995putar0.000943121
2996aktip0.000943121
Table 5. Model performance for each regularized constant value.
CTPTNFPFNAccuracyPrecisionRecallF1-Score
0.1927384293595.35%96.97%96.36%96.66%
1932380333095.42%96.58%96.88%96.73%
10930384293295.56%96.98%96.67%96.82%
100931375383194.98%96.08%96.78%96.43%
Table 6. Classification results of test data with a tuned model.
Sample ReviewsEnglish TranslationActualLabelPredicted Label
mantap,,semakin mudah….Great, it’s becoming easier…positivepositive
Mantabbb, TPI sayang untuk perubahan faskesnya lama bgt harus nunggu 3 bulan 🤦Great, but it’s unfortunate that it takes a long time to wait for the change of healthcare facility, have to wait for 3 months 🤦.positivepositive
Paket lengkap, segala nya jadi mudah tinggal klik klik klik, terima kasih BPJSComplete package, everything becomes easy, just a few clicks, thank you BPJS.positivepositive
Semoga lebih baek aja kedapnnyaHopefully, the quality of their services improves.positivepositive
BagusGoodpositivepositive
Saya ngak bisa menambah kan anak saya lewat mobile JKN BG mana cara nya mohon informasiI’m unable to add my child through Mobile JKN. Can you please provide me with information on how to do it?negativenegative
Simple no ribetSimple, not complicated.positivepositive
kenapa sehabis di-update tidak bisa daftar antrian onlain di faskes pertama...??Why can’t I register for an online queue at the first healthcare facility after updating it?negativenegative
Disclaimer/Publisher’s Note: The statements, opinions and data contained in all publications are solely those of the individual author(s) and contributor(s) and not of MDPI and/or the editor(s). MDPI and/or the editor(s) disclaim responsibility for any injury to people or property resulting from any ideas, methods, instructions or products referred to in the content.

