Article

Enhanced Internet of Things Security Situation Assessment Model with Feature Optimization and Improved SSA-LightGBM

1
Hebei Engineering Research Center for the Intelligentization of Iron Ore Optimization and Ironmaking Raw Materials Preparation Processes, North China University of Science and Technology, Tangshan 063210, China
2
Hebei Key Laboratory of Data Science and Application, North China University of Science and Technology, Tangshan 063210, China
3
The Key Laboratory of Engineering Computing in Tangshan City, North China University of Science and Technology, Tangshan 063210, China
4
College of Science, North China University of Science and Technology, Tangshan 063210, China
5
Shanxi Jianlong Industrial Co., Ltd., Yuncheng 044000, China
6
Tangshan Intelligent Industry and Image Processing Technology Innovation Center, North China University of Science and Technology, Tangshan 063210, China
*
Author to whom correspondence should be addressed.
Mathematics 2023, 11(16), 3617; https://doi.org/10.3390/math11163617
Submission received: 5 August 2023 / Revised: 17 August 2023 / Accepted: 19 August 2023 / Published: 21 August 2023
(This article belongs to the Special Issue Analytical Frameworks and Methods for Cybersecurity)

Abstract

:
In this paper, an improved Internet of Things (IoT) network security situation assessment model is designed to solve the problems arising from the existing IoT network security situation assessment approach regarding feature extraction, validity, and accuracy. Firstly, raw data are dimensionally reduced using independent component analysis (ICA), and the weights of all features are calculated and fused using the maximum relevance minimum redundancy (mRMR) algorithm, Spearman’s rank correlation coefficient, and extreme gradient boosting (XGBoost) feature importance method to filter out the optimal subset of features. Piecewise chaotic mapping and firefly perturbation strategies are then used to optimize the sparrow search algorithm (SSA) to achieve fast convergence and prevent getting trapped in local optima, and then the optimized algorithm is used to improve the light gradient boosting machine (LightGBM) algorithm. Finally, the improved LightGBM method is used for training to calculate situation values based on a threat impact to assess the IoT network security situation. The research findings reveal that the model attained an evaluation accuracy of 99.34%, sustained a mean square error at the 0.00001 level, and reached its optimum convergence value by the 45th iteration with the fastest convergence speed. This enables the model to more effectively evaluate the IoT network security status.

1. Introduction

In today’s digital era, due to the fast growth and broad adoption of IoT technology [1,2,3], IoT devices have penetrated into various industries and fields such as cyber-physical systems [4], urban intelligence [5], and industrial IoT [6], bringing great convenience and opportunities for human beings, but also bringing unprecedented challenges to IoT network security issues [7]. IoT devices and sensors are often connected in a distributed manner and exchange and communicate data via the Internet, forming a large and complex network. However, this highly interconnected network architecture also provides more opportunities for malicious attackers to invade. The frequency of IoT network attacks, including DDoS [8], malware [9], and zero-day attacks [10], poses a huge threat to national security and IoT security. To effectively prevent the occurrence of attack events, IoT security researchers have devised a series of innovative solutions, such as exploring the application of blockchain technology to improve IoT device security [11] and using quantum encryption to ensure the secure and reliable transmission of data [12]. However, traditional IoT security techniques typically focus on only one aspect of a network attack and do not provide a comprehensive picture of the overall IoT security. Therefore, more advanced technology is needed to prevent security incidents from occurring.
In order to effectively prevent and detect potential IoT security threats in a timely manner, IoT network security situation assessment is a priority and has gained significant research attention [13]. The objective of an IoT network security situation assessment is to identify, analyze, and evaluate IoT network traffic and behavior to capture the security status and risk level of the entire network. Using a situational assessment, IoT administrators can better understand the network security situation and identify potential security risks.
However, IoT network security situation assessments face a number of challenges, such as the large size of the network and the diversity of device types and network architectures involved. Assessment data exhibits high-dimensional and large-scale characteristics. The accuracy and efficiency of the assessment methodology are also issues that require attention. While existing approaches to IoT network security situation assessment have mitigated these issues to some extent and have made great progress, they are also limited in addressing the challenges due to the diversity of network data. Designing an efficient and accurate model for network security situation assessment has become a critical research focus in IoT security.
LightGBM [14], an efficient algorithm for handling large-scale data and high-dimensional features, uses a histogram-based decision tree approach to accelerate the training process and prediction of models with good scalability. In the IoT network security situation assessment field, LightGBM demonstrates efficiency, scalability, and robustness, which can significantly improve the accuracy of IoT network security situation assessments. Therefore, to enhance the situation assessment accuracy, this study introduces a new scheme based on feature optimization and improved SSA-LightGBM. The key contributions of this paper are summarized as follows:
1.
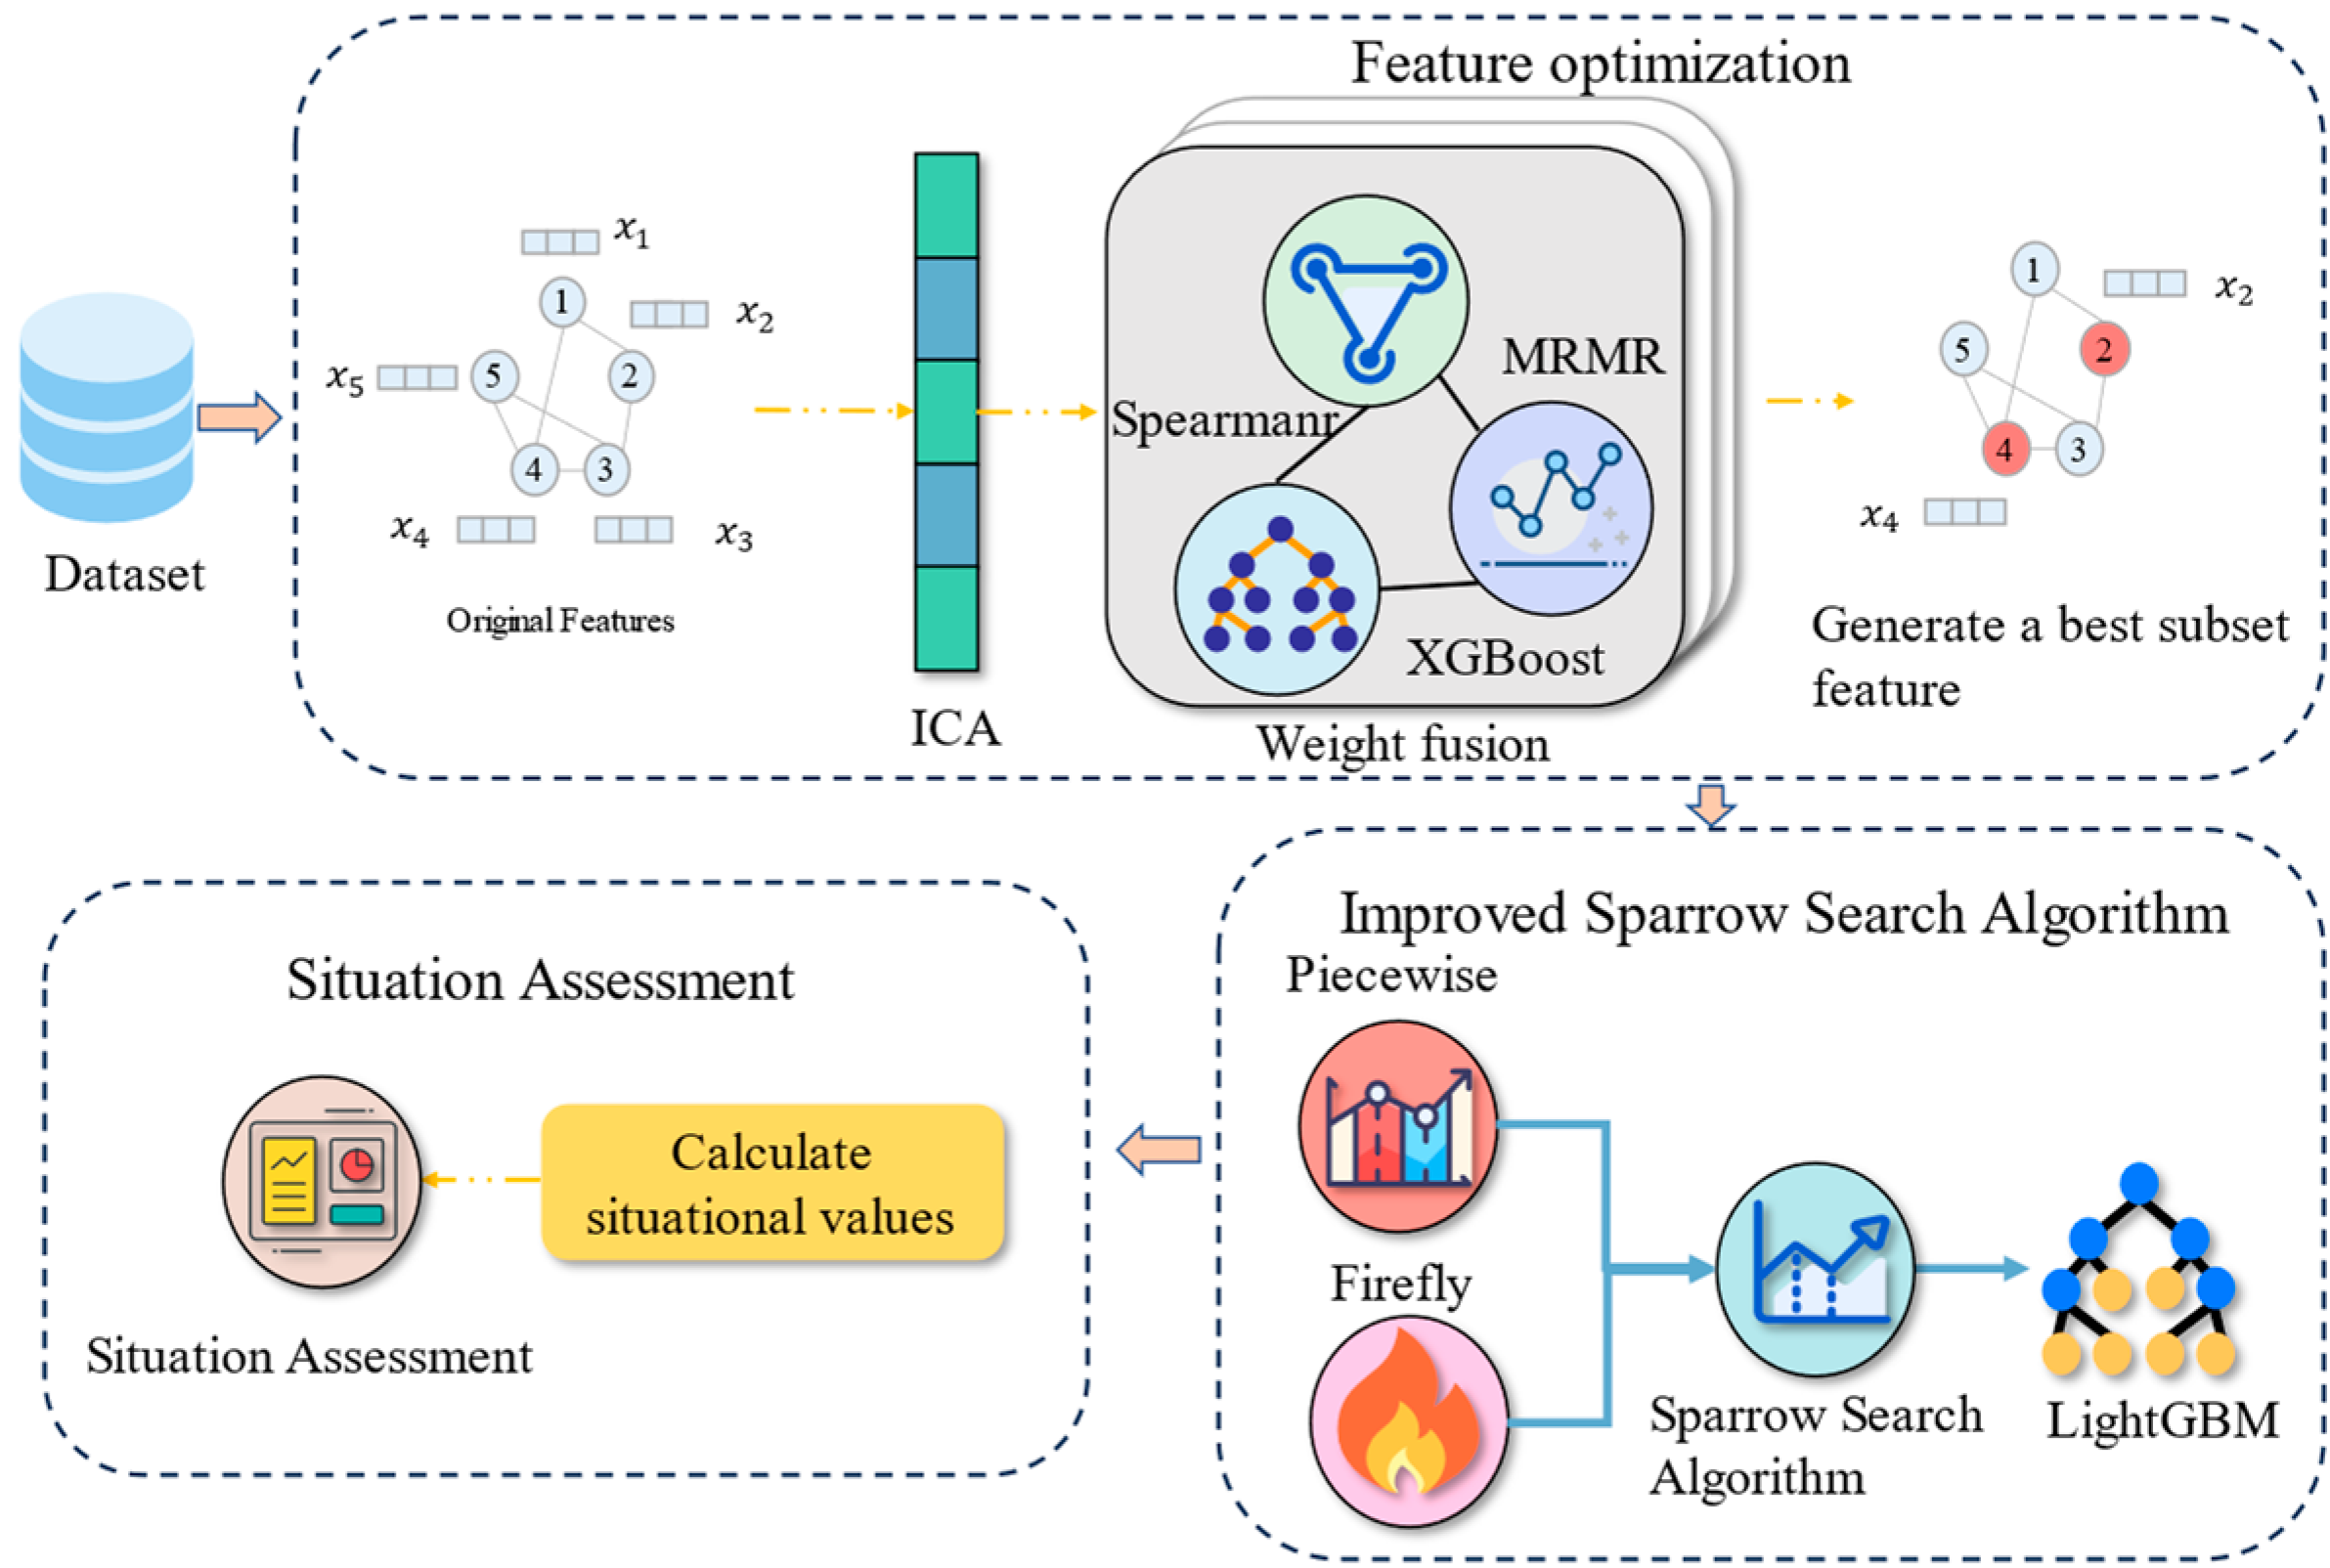
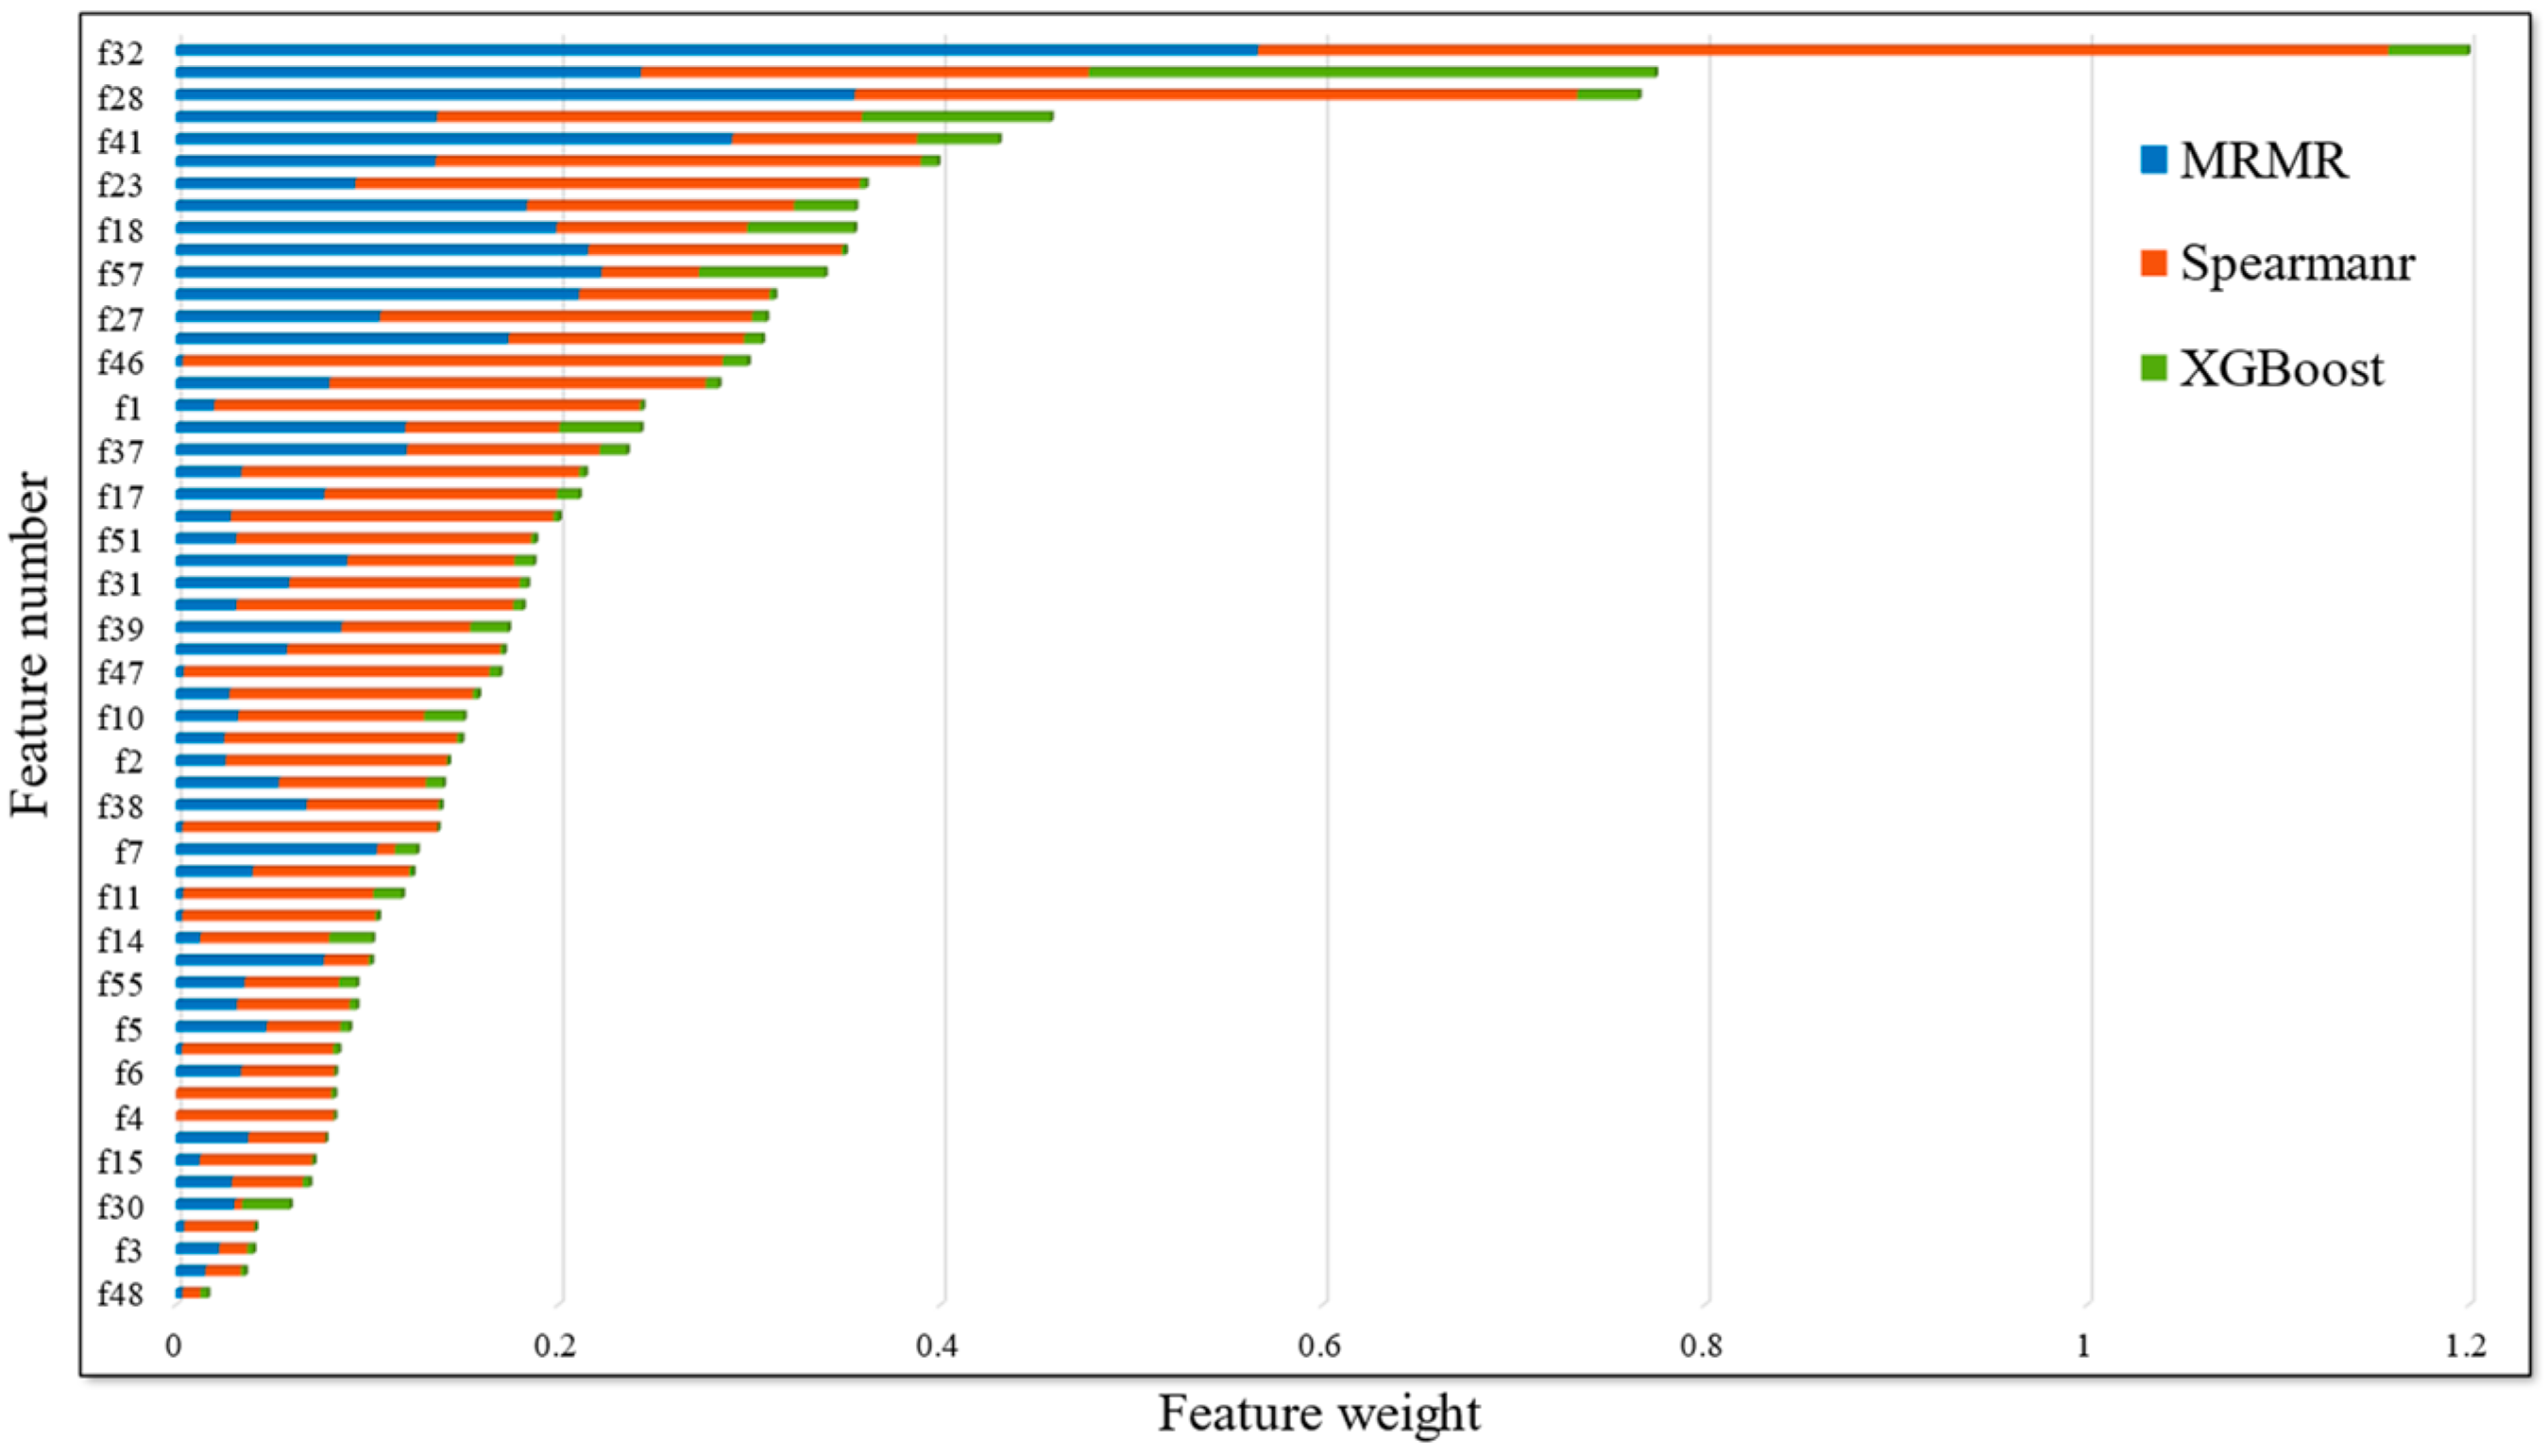
In order to cope with the fact that the original data have multiple features, high dimensionality, and non-linearity, a feature optimization algorithm is proposed in this paper. The data were first dimensionally reduced using the ICA method and then combined with mRMR, Spearman’s rank correlation coefficient, and XGBoost feature importance to optimize and combine the weights of the features and filter out the subset of features that impact the classification results. This improves the relevance and predictive accuracy of the features.
2.
To suit the vast and intricate IoT landscape, this paper proposes a novel IoT network security situation assessment model that improves LightGBM. To address the challenge of parameter configuration complexity, SSA was improved using piecewise chaotic mapping and the firefly perturbation strategy. This was then applied to the optimization process of LightGBM, which further optimized the model performance. The threat impact is utilized to calculate the situation value for assessing IoT network security.
3.
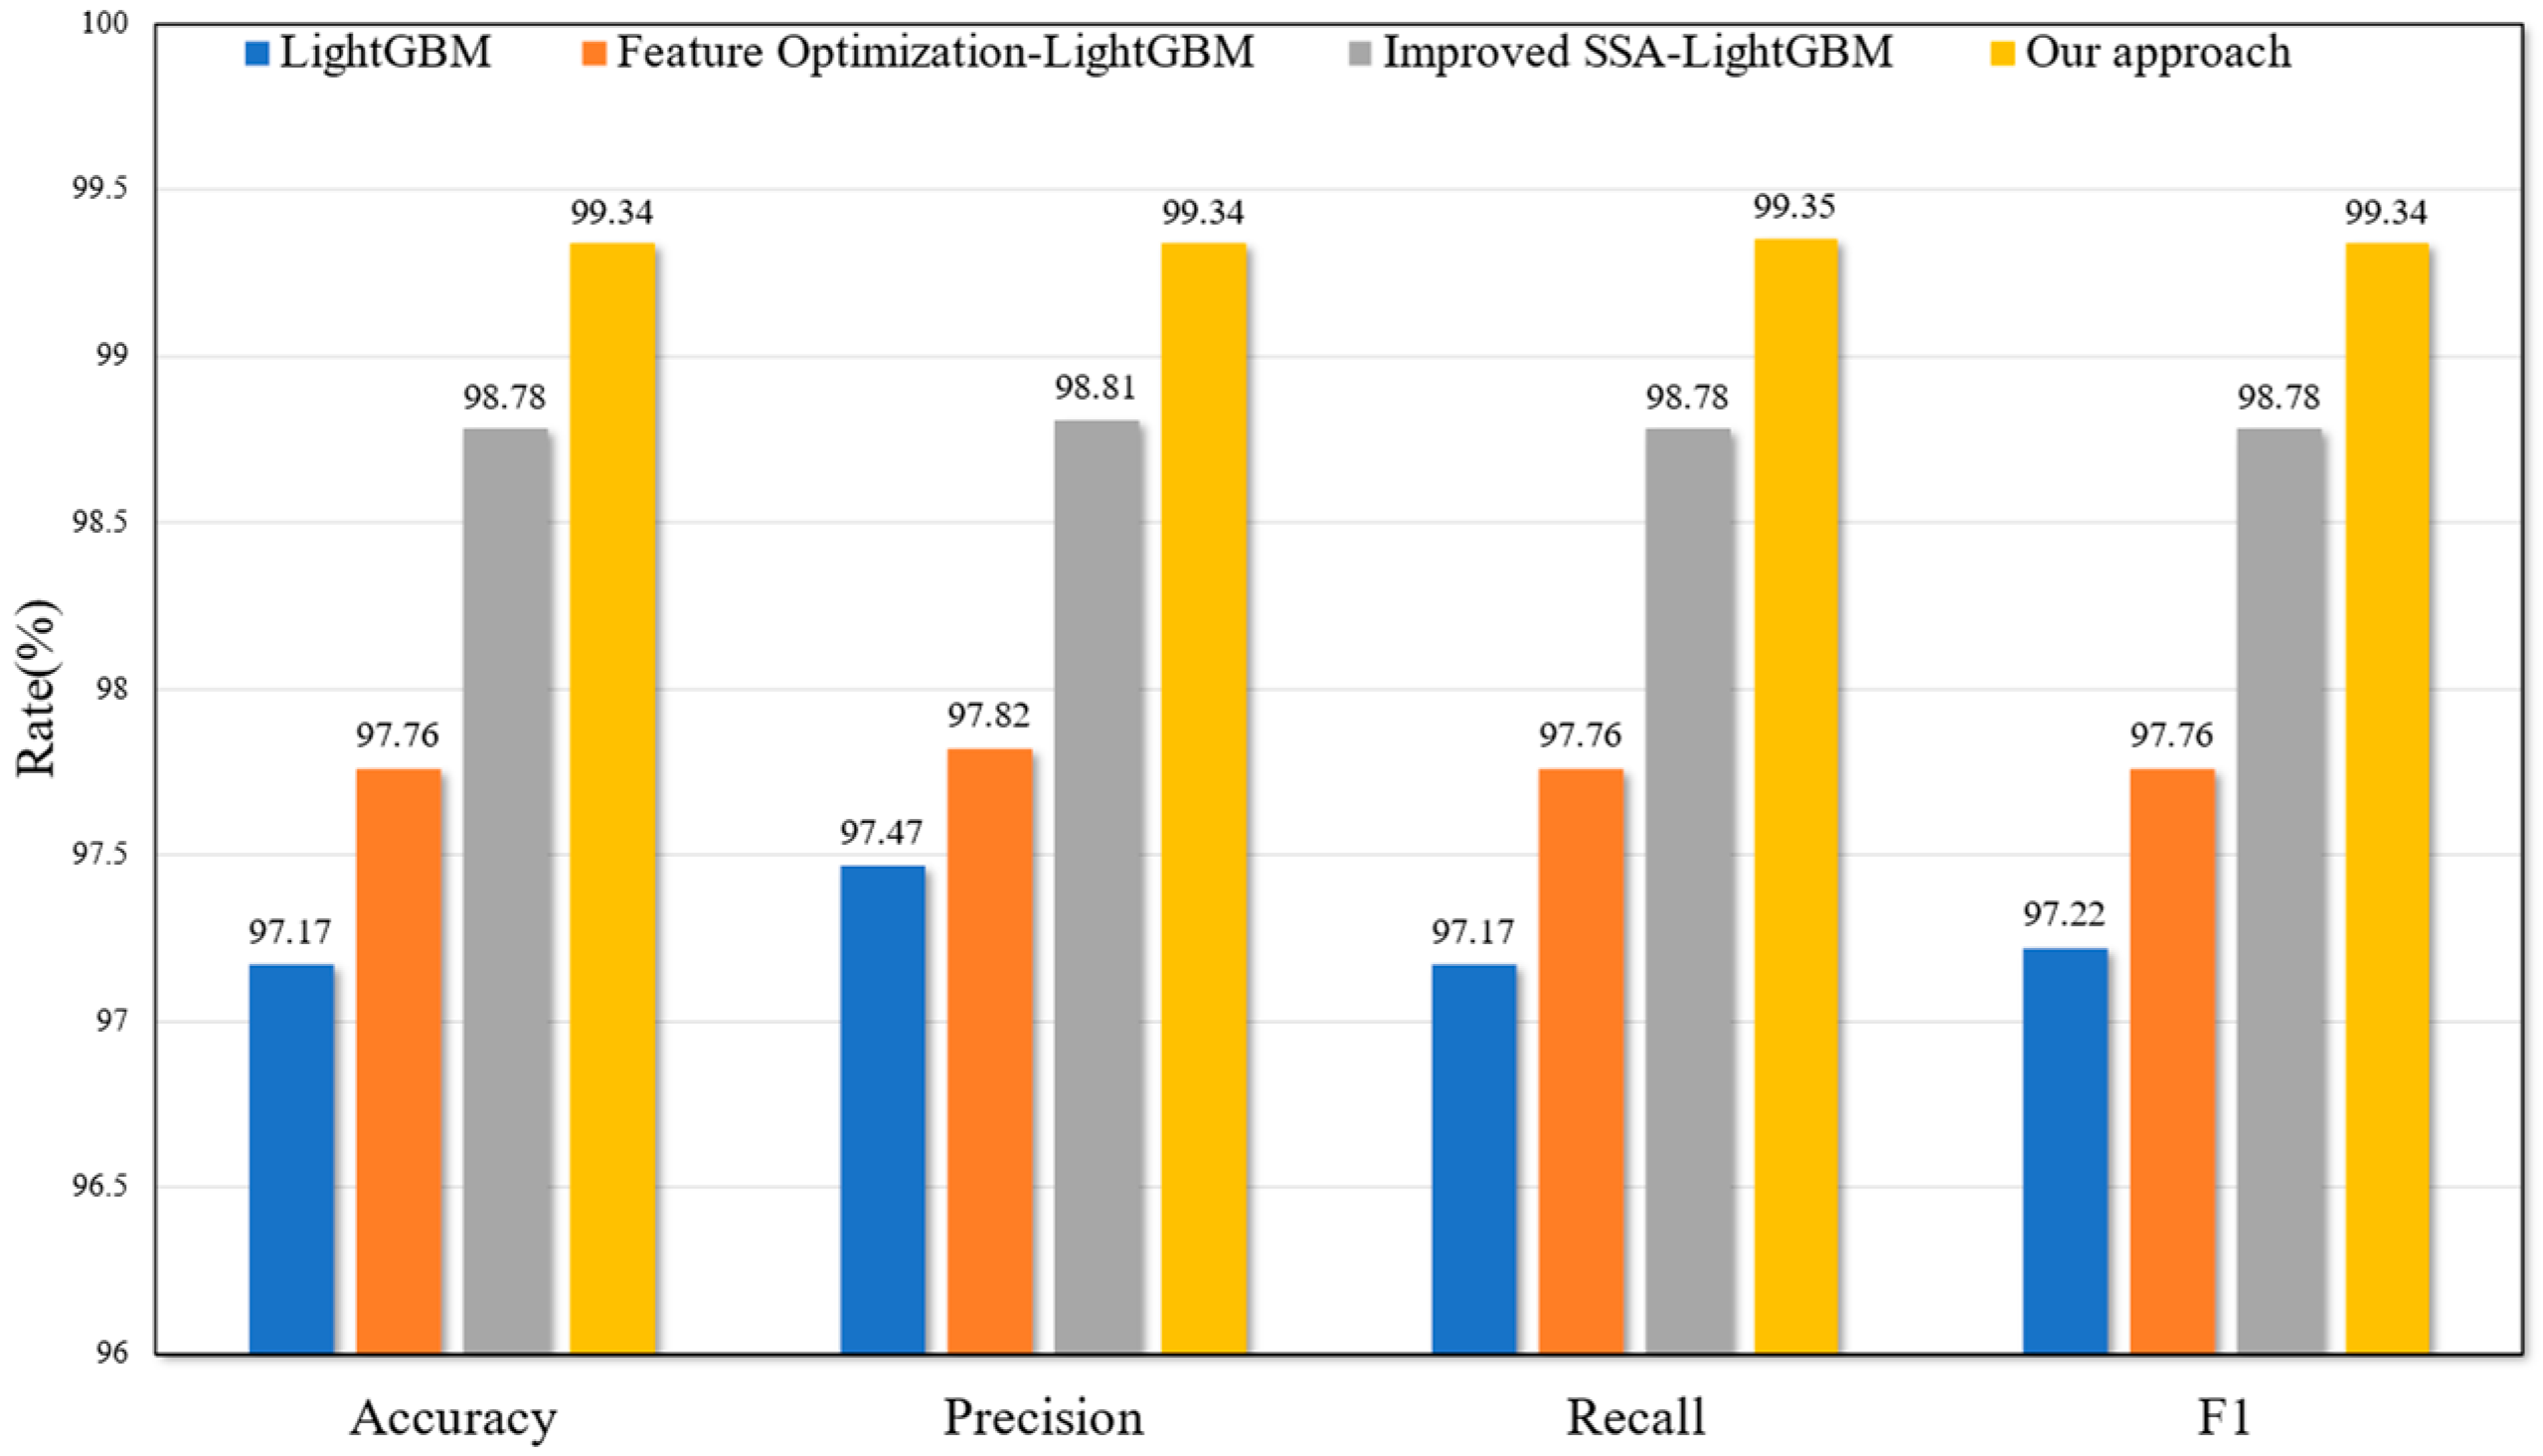
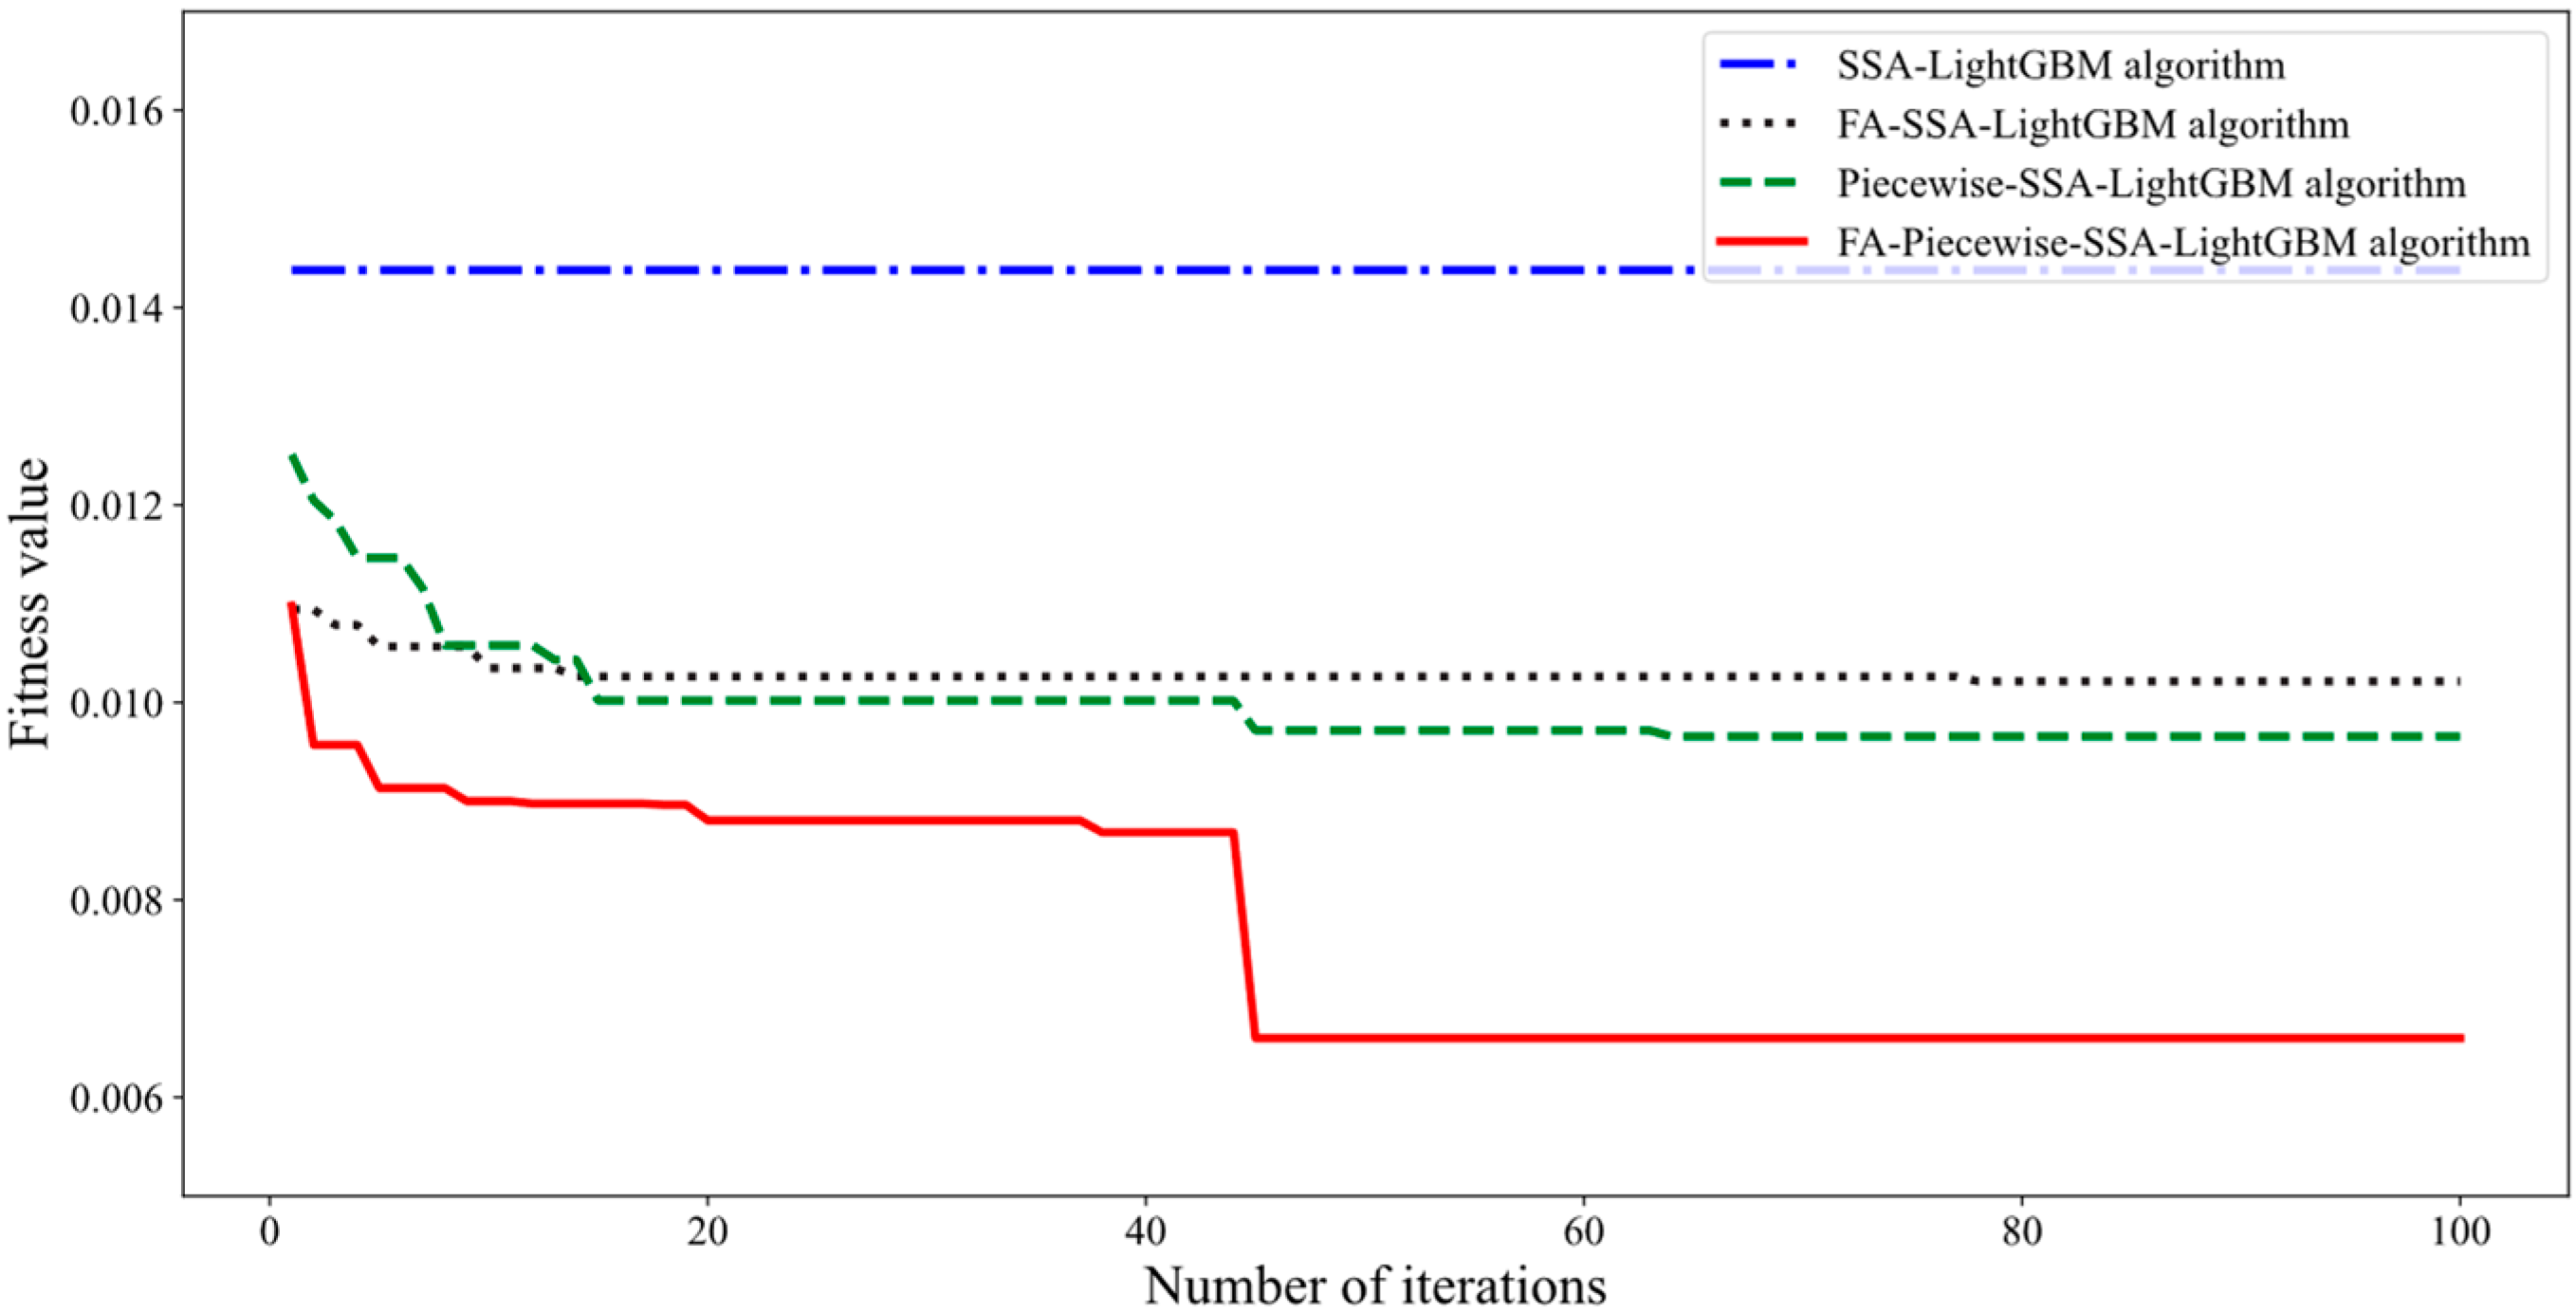
The experimental results demonstrate that the IoT network security situation assessment model proposed demonstrates excellent convergence, high accuracy, and low error in a comparative analysis with other models. The model converged at 0.0066 with an assessment accuracy of 99.34% and a mean squared error of 0.00001, which is closer to the true situation value. Therefore, applying this method to the problem of situation assessment can effectively assess the IoT security situation.
The paper is structured as follows: Section 2 provides an overview of related research in IoT network security situation assessment and discusses the shortcomings of existing studies; Section 3 introduces the SSA theory; Section 4 describes improvements to SSA; Section 5 provides a detailed description of the process of building an IoT network security situation assessment model using feature optimization and improved SSA-LightGBM; Section 6 presents an experimental comparison and analyzes the obtained results; and Section 7 summarizes this paper in full and presents future research perspectives.

2. Related Work

IoT network security situation assessment is a method used to collect data in an IoT network and analyze it using algorithmic models to produce situation assessment results that represent the current network security situation. In order to better secure the IoT [15,16], more and more scholars are working on network security situation assessment. Based on established theories, network security situation assessment is divided into two main approaches: mathematical models [17,18] and machine learning [19,20], as shown in Table 1.
Many scholars have used the mathematical model method for network security situation assessment. In 2020, Lixia Xie et al. [21] proposed a security situation assessment method for smart mobile device information systems, which aimed to improve the objectivity of the weight vector and to grade the system security level by improving the interval judgment matrix. Research experiments demonstrated the model’s enhanced stability and reliability, but it lacks a more realistic assessment method. In 2020, Yiwei Liao et al. [22] proposed a network security situation assessment method that extracted observation vectors by fusing multiple security data and then built and modified the state transfer matrix. The network’s current risk value was calculated based on the hidden state probability distribution. The results confirmed the model’s accuracy and effectiveness in evaluation and that it could meet practical application needs. However, there is a degree of complexity in model building and parameter selection, and more data are needed to verify the method’s validity and reliability. In 2022, Jinwei Yang et al. [23] proposed a network security situation assessment model using a combination of intrusion detection and attack graphs, aiming to effectively infer attack intent. However, further research and empirical analysis are needed to verify its universality and practicality.
Several scholars have also used the machine learning method for network security situation assessment. In 2020, Xiaoling Tao et al. [24] proposed a network security situation assessment method using stacking autoencoder (SAE) and back-propagation neural networks (BPNNs). To enhance computational efficiency and reduce the dimensionality of indicator data, SAE was used for dimensionality reduction, and the low-dimensional data were used as input data for BPNN security situation assessment. The validity of the model was demonstrated in experiments. However, the method was prone to overfitting problems, and further consideration needs to be given to how the model can be optimized to improve generalization. In 2021, Hongyu Yang et al. [25] introduced an adversarial deep learning approach for network security situation assessment, which utilizes depth autoencoder (DAE) for feature learning and deep neural as a network attack classifier. The experimental results demonstrated the method’s improved accuracy in identifying network attacks. However, the authors noted that further experimentation and testing with additional datasets are required to assess the comprehensiveness, accuracy, and reliability of the method. Their method for calculating the situation values also needs further optimization. In 2021, Xiao-ling Tao et al. [26] designed a network security situation assessment method using an autoencoder (AE) and minimalist memory unit, which eliminates the redundant part by using the data dimensionality reduction method of AE while using a deep neural network (DNN) of the minimalist memory unit to achieve an efficient and accurate network security situation assessment. Their experimental results demonstrated that the method offered greater accuracy and efficiency and met the challenges of increasingly complex and threat-diverse network environments. However, the model contains numerous parameters that tend to fall into over-fitting. In 2022, Hongyu Yang et al. [27] proposed a network security situation assessment method using network attack classification, which utilizes parallel feature extraction networks, bidirectional gated recurrent unit (BiGRU), and attention mechanisms to improve accuracy. The situation values were computed by adjusting the number of attacks using an error probability matrix and incorporating the severity factors of the attacks. Their experimental results demonstrated that the method achieved effective improvements in terms of accuracy and recall. However, the datasets used are outdated and cannot be adapted to the needs of the current complex network environment, and they could also be improved in terms of efficiency. In 2022, Ran Zhang et al. [28] proposed a WOA-SVM-based network security situation assessment method that uses adaptive weights and simulated annealing algorithms (SAAs) to improve the whale optimization algorithm (WOA), thereby improving the global optimization-seeking capability. Based on the experimental results, the method demonstrates superior accuracy in assessing the network security situation and exhibits improved convergence compared with other enhanced assessment algorithms. However, the model needs further refinement to improve its applicability and efficiency for practical applications. In 2023, Ziyi Liu et al. [29] developed a wireless situation assessment approach utilizing the bidirectional parallel memory unit (BIPMU) to effectively evaluate real-time security conditions within wireless networks. Experimental outcomes underscore the heightened efficiency and accuracy of the proposed method when contrasted with earlier approaches.
After reviewing the research on IoT network security situation assessments, we found that most researchers mainly focused on model improvement while neglecting the importance of constructing optimal feature subsets. The existing methods often lack an effective feature selection strategy, which limits the accuracy of the assessment. Therefore, there is still room for improvement in IoT network security situation assessment. It is necessary to consider aspects such as optimal feature subset construction and model parameter optimization in order to improve situation assessment accuracy and further refine the research results in this area.

3. Principle of the Sparrow Search Algorithm

The sparrow search algorithm [30] (SSA) is a heuristic optimization algorithm that is used for solving multivariate non-linear optimization problems. Inspired by the flocking behavior of birds in nature, it finds the optimal solution by translating the search behavior in a flock of birds into an algorithmic operation. The SSA is divided into two roles, the explorer and follower, and also uses a vigilante mechanism. The explorer explores the search space, the follower follows the explorer, and the vigilante prevents the algorithm from getting stuck in a local optimum by randomly distributing some individuals in the search space. The position of explorers and followers is updated during the search using the following formula:
X i , j t + 1 = { X i , j t e ( i α i t e r max ) , R 2 < S T X i , j t + Q L , R 2 S T
X i , j t + 1 = { Q e X w t X i , j t i 2 , i > n 2 X p t + 1 + | X i , j t X p t + 1 | A + L , i n 2
where t indicates the number of iterations; j = 1 , 2 , 3 , d , represents the dimension of the parameters being optimized in the problem; i t e r max indicates the maximum number of iterations the algorithm can run; α and Q denote random numbers; X i , j t represents the position of the i - th sparrow of dimension j at the t - th iteration; R 2 and S T are alert and safety values, respectively; L is a variable consisting of a one-row multidimensional matrix with all elements being 1; X w t indicates the current global worst position; X p t + 1 denotes the optimal position of the sparrow in the p - th dimension at the t + 1 - th iteration of the population; and A + = A T ( A A T ) 1 , where A represents a one-row multidimensional matrix with elements randomly assigned as 1 or −1.
In sparrow populations, a certain number of sparrows are randomly assigned as vigilantes, usually at a rate of 10% to 20% of the total. The formula for updating the vigilantes’ positions is as follows:
X i , j t + 1 = { X b e s t t + β | X i , j t X b e s t t | , f i > f g X i , j t + K ( | X i , j t     X w o r s t t | ( f i     f w )   +   ε ) , f i = f g
where X b e s t t indicates the best of all current sparrow positions; K [ 1 , 1 ] is a random value; β is the step control parameter; f i is a sparrow’s current fitness allocation value; f g and f w represent the global best and worst fitness assignment values, respectively; and ε is a constant.

4. Piecewise Chaos Mapping and the Firefly Perturbation Strategy

The SSA is easy to implement, but it has a tendency to converge toward local optimum solutions, thus limiting its global search capability. In addition, the search process lacks stability, and the convergence speed is slow. To overcome these problems, piecewise chaotic mapping [31] and firefly perturbation strategies [32] are introduced to improve the performance of the algorithm. Piecewise chaotic mapping is used to generate random number seeds, perturb the state of the population, increase the search range, and escape from the local optimum solution. The firefly perturbation strategy is then used to increase search diversity, and the algorithm’s global search capability and efficiency are enhanced. These improvements can enhance the search efficiency and accuracy of the optimization algorithm, resulting in a more efficient search for the global optimum solution.

4.1. Piecewise Chaos Mapping

Population initialization is a crucial step in the SSA as it directly impacts the algorithm’s search efficiency and convergence speed. In this paper, we use piecewise chaotic mapping to initialize the sparrow population instead of randomly generating the initial population as in the traditional SSA to improve search efficiency and avoid getting trapped in a local optimum solution. This approach enables the population to be more evenly distributed in the search space, thus enhancing the global search capability and efficiency of the algorithm. The expression for the piecewise chaos mapping is as follows:
x k + 1 = { x k P , 0 x k < P x k     P 0.5     P , P x k < 0.5 1     P     x k 0.5     P , 0.5 x k < 1 P 1     x k P , 1     P x k < 1
where x k denotes the value of the k - th iteration step, which takes a value in the range [ 0 , 1 ] , and P is a constant between 0 and 1.

4.2. Firefly Perturbation Strategy

In the SSA, each sparrow can only search within its domain and is prone to fall into local optimal solutions. To avoid this, this paper adds firefly perturbations, which shake violently around the locally optimal solution in order to jump out of a current locally optimal solution and move toward a more optimal solution. In addition, firefly perturbations can increase the diversity of the algorithm, helping it to better explore the search space and improve its global search capabilities.
In the firefly algorithm, each firefly emits a bright light signal to attract other individual fireflies. The algorithm assumes that there is no gender difference between individual fireflies, so an individual firefly can draw in any firefly that is brighter than itself. The luminosity of a firefly correlates with its attraction, i.e., if a firefly can migrate toward another firefly that is brighter than itself, then its luminosity will decrease with increasing distance. If a firefly cannot see a firefly brighter than itself, then it will migrate at random. To enhance search efficiency, the algorithm uses the brightness values of fireflies as the objective function and incorporates a random wandering mechanism to augment the algorithm’s global search capability.
1.
The relative fluorescence brightness of fireflies is:
I = I 0 e γ r i , j
The brightness of a firefly is proportional to the degree of superiority of the objective function value. Maximum brightness I 0 corresponding to the optimal solution; γ represents the light intensity absorption coefficient; and r i , j represents the inter-firefly distance.
2.
The attractiveness of the fireflies is:
β = β 0 e γ r 2 i , j
where β 0 is the maximum attraction.
3.
The formula for updating the position between individual fireflies is:
x i = x i + β ( x j x i ) + α ( r a n d 1 2 )
where x i and x j are the spatial locations of fireflies i and j , respectively; α [ 0 , 1 ] is the step factor; and r a n d is a random number that obeys a uniform distribution over [ 0 , 1 ] .

5. Proposed Approach

This paper presents an enhanced IoT network security situation assessment model comprising a feature optimization module and an improved SSA-LightGBM module. The architecture is depicted in Figure 1.

5.1. Feature Optimization Module

In order to avoid overfitting and reduce computational complexity, the number of features needs to be optimized using feature optimization methods. This paper introduces a hybrid feature optimization method. Firstly, the ICA method is introduced to learn a low-dimensional separation matrix while minimizing information loss. The feature weights were then calculated and fused using a combination of three methods including mRMR, Spearman’s rank correlation coefficient, and XGBoost feature importance. Finally, the classifier is evaluated to obtain the optimal subset of features. The steps are as follows:
Step 1: Use the ICA algorithm to reduce the dimensionality of the high-dimensional data set to obtain the initial feature matrix.
Step 2: Compute the weight vector for each feature separately using mRMR, Spearman’s rank correlation coefficient, and XGBoost feature importance.
1.
The weight vector obtained using mRMR is as follows:
W M = { m 1 ( x ) , m 2 ( x ) , , m n ( x ) }
2.
The weight vector obtained using Spearman’s rank correlation coefficient is as follows:
W S = { s 1 ( x ) , s 2 ( x ) , , s n ( x ) }
3.
The weight vector obtained using XGBoost feature importance is as follows:
W X = { g 1 ( x ) , g 2 ( x ) , , g n ( x ) }
Step 3: Fuse the three weight vectors to obtain a combined weight vector as follows:
W = W M + W S + W X
Step 4: To enhance classifier accuracy, fuse the feature weights to obtain the values in descending order. Then, evaluate each feature weight value using the classifier to obtain the optimal feature subset.
By combining different feature selection methods, a better representation of the data in the feature space can be obtained. The method proposed can eliminate redundant features, avoid loss of valid information, and reduce computational costs, thus improving the performance of subsequent algorithms.

5.2. Improved SSA-LightGBM Module

LightGBM is an efficient gradient-boosting algorithm, but it has some drawbacks, such as difficulty in setting parameters and sensitivity to noise and outliers in the training data. Traditional optimization algorithms such as particle swarm optimization (PSO) and the SSA can be used to solve these problems, but they are slow to converge and inefficient. In this paper, an enhanced SSA is utilized to optimize LightGBM with the following steps:
Step 1: Initialize the population using the piecewise chaotic mapping strategy. Determine the iteration number and predator ratio to joiners.
Step 2: Compute and rank the fitness values of individual sparrows.
Step 3: Update the predator position to approach the optimal sparrow position within the population.
Step 4: Update the joiner position to approach the current optimal position within the population.
Step 5: Update the position of the vigilantes so that they avoid getting too close to other sparrows.
Step 6: Compute the fitness value, and update the sparrow position accordingly.
Step 7: Randomly perturb the sparrow locations using a firefly perturbation strategy to increase search diversity.
Step 8: Compare the fitness values of the perturbed sparrows with those of the original sparrows. If a perturbed sparrow exhibits a superior fitness value, then update that sparrow’s position.
Step 9: Determine if the stopping requirement is met. If so, then obtain the optimal parameter, assign it to LightGBM as the initial parameter, and exit. Otherwise, start again at Step 2.

6. Experiment and Analysis

6.1. Experimental Environment and Model Configuration

6.1.1. Experimental Data and Preprocessing

The UNSW-NB15 dataset is a publicly available, authentic, and representative IoT network security dataset containing real attack and normal network traffic data. Therefore, using the UNSW-NB15 dataset for IoT network security situation assessment is a reasonable choice. In order to train the model, three classification features in the UNSW-NB15 dataset, including proto, service, and state, need to be one-hot encoded to be transformed into numerical features, resulting in a 197-dimensional classification vector. In this process, numerical normalization is used to mitigate the magnitude of disparity among features. Thus, the model can be better trained.

6.1.2. Evaluation Metrics

In order to assess the model performance, this paper uses precision, accuracy, recall, and F1 score to evaluate the model performance. Mean absolute error (MAE), mean relative error (MRE), mean square error (MSE), and root mean square error (RMSE) were used as evaluation metrics for the accuracy of the situation assessment fit.
1.
The model performance evaluation was completed as follows:
A c c u r a c y = T P + T N T P + T N + F P + F N × 100 %
P r e c i s i o n = T P T P + F P × 100 %
R e c a l l = T P T P + F N × 100 %
F 1 = 2 × P r e c i s i o n × R e c a l l P r e c i s i o n + R e c a l l × 100 %
where true positive (TP) denotes the correct classification of positive examples using the classifier; true negative (TN) represents the accurate classification of negative examples using the classifier; false positive (FP) refers to the incorrect classification of negative case samples as positive cases using the classifier; and false negative (FN) indicates the incorrect classification of positive example samples as negative examples using the classifier.
2.
The accuracy of the fit of the situation assessment was completed as follows:
MRE = 1 N i = 1 N | y i y ^ i y i |
MAE = 1 N i = 1 N | y i y ^ i |
MSE = 1 N i = 1 N ( y i y ^ i ) 2
RMSE = 1 N i = 1 N ( y i y ^ i ) 2
where N denotes sample size; y i indicates true situation value; and y ^ i indicates predicted situation value.

6.2. Feature Optimization Results

This paper uses the ICA algorithm to reduce the data dimensionality to 57 dimensions. The feature weight values are then obtained by combining three feature selection methods including mRMR, Spearman’s rank correlation coefficient, and XGBoost feature importance for fusion, the results of which are shown in Figure 2. To strike a balance between the number of features and model performance, this paper sets multiple thresholds, as indicated in Table 2. Based on the results presented in Table 2, the classifier demonstrated the highest performance in terms of accuracy, precision, recall, and F1 score when 52 features are selected in the same training set. Therefore, in this paper, the selected 52 features are fed into the classification model for classification.

6.3. Situation Assessment

This paper uses the UNSW-NB15 dataset for experiments and calculates situation values by attack threat impact, as detailed in Table 3, for each type of attack threat impact. After testing the multi-classification results, the IoT network security situation values are calculated and evaluated according to Equation (16):
SA ( t ) = i = 1 n ω i x i
where n indicates the number of attacks in a given period of time; ω i indicates the probability of occurrence of different attack types; and x i indicates the threat impact for each type of attack.

6.4. Results and Analysis of Experiments

6.4.1. Ablation Analysis

To assess the influence of feature optimization and the improved SSA-LightGBM algorithm on the proposed model’s performance, an ablation experimental analysis was conducted. The traditional LightGBM, the feature-optimized LightGBM, the improved SSA-LightGBM, and the method proposed in this study were compared to explore the individual contributions of different algorithms to the overall model performance. The results are depicted in Figure 3.
The results show that the feature optimization and the improved SSA-LightGBM result in significant improvements in model performance. With the default parameters, the feature-optimized LightGBM model shows varying degrees of improvement in the precision, recall, and F1 score metrics compared with the original model. The improved SSA-LightGBM model also performs better when using the same classifier. This further validates the effectiveness of the proposed feature optimization and improved SSA-LightGBM algorithms on the overall model performance.

6.4.2. Convergence Analysis

To enhance the IoT network security situation assessment accuracy, the LightGBM algorithm was optimized using an improved SSA. The LightGBM optimal hyperparameters were obtained using iterative calculations. The specific parameters are listed in Table 4.
To validate the performance of the proposed improved SSA algorithm, individual fitness values were used as a measure, where the fitness function was defined as the difference between one and the accuracy. Therefore, smaller fitness values represent better individuals, and the change in the fitness function reflects the convergence of the assessed model. Figure 4 compares the convergence of the SSA-LightGBM, FA-SSA-LightGBM, Piecewise-SSA-LightGBM, and FA-Piecewise-SSA-LightGBM evaluation models.
Based on the analysis of the results presented in Figure 4, as the number of iterations increases, differences can be found in the changes in the fitness values of the different assessment models during the iterations. The SSA-LightGBM evaluation model starts with the highest fitness value and keeps falling into local extremes that cannot be jumped out of, eventually converging to a minimum value of 0.0143. The FA-SSA-LightGBM assessment model is the least adaptive at the very beginning. After the 13th iteration, the algorithm starts to fall into long-term local extremes. Although the algorithm successfully escaped from local optima at the 77th iteration, it regrettably returned to local optima at the 78th iteration and ultimately converged to a minimum value of 0.0102. The Piecewise-SSA-LightGBM evaluation model started with high fitness values, but then jumped out of the local extremes several times during the iterations, eventually converging to a minimum value of 0.0096 at the 64th iteration. Compared with the previous two assessment models, this model is more likely to go beyond the local extremes and has a smaller fitness value. The initial fitness value of the FA-Piecewise-SSA-LightGBM evaluation model is relatively low, and the fitness curve jumps out of the local extremes several times during the iterations, eventually converging to a minimum value of 0.0066 at the 45th iteration. This indicates that the FA-Piecewise-SSA-LightGBM evaluation model has a faster convergence rate and smaller fitness values than the other three models. The algorithm demonstrates a lower likelihood of falling into local optima and exhibits improved performance, indicating the increased accuracy and reliability of the model.

6.4.3. Effectiveness Evaluation

To validate the effectiveness of the proposed method, this study used the UNSW-NB15 dataset and applied an improved feature optimization algorithm to perform feature selection. The selected features were then used as input data for further analysis and evaluation. In this paper, the support vector machine (SVM), random forest (RF), k-nearest neighbor (KNN), gradient boosting decision tree (GBDT), XGBoost, and LightGBM algorithms were selected for comparative analysis. The performance of the algorithms was verified using accuracy, precision, recall, and F1 evaluation metrics. The results of the evaluation are summarized in Table 5.
The proposed method demonstrates strong performance across all metrics, as indicated in Table 5. The accuracy, precision, recall, and F1 values increased by 1.58%, 1.52%, 1.59%, and 1.58%, respectively, compared to the LightGBM before the improvement. The reason for this is that algorithms such as SVM, RF, KNN, and GBDT cannot handle complex large-scale datasets effectively, resulting in an inability to achieve optimal performance and a tendency to over-fit. The XGBoost algorithm takes longer to train and is less efficient when dealing with large-scale data. The use of a global sorting algorithm affects the accuracy of the algorithm. In contrast, LightGBM shows efficiency and accuracy advantages. The use of an improved SSA to optimize the LightGBM parameters also further improves the performance of the algorithm.

6.4.4. Analysis of Situation Assessment Results

Test data were selected from the test set, and the IoT network security situation values were calculated using Equation (16) and then compared using the SVM, RF, KNN, GBDT, XGBoost, and LightGBM models. The proposed method in this paper was compared with the traditional SVM, RF, KNN, GBDT, XGBoost, and LightGBM methods using the same test set to calculate the situation values. The comparison errors are summarized in the following analysis. The results are shown in Table 6. The results indicate that the method proposed in this paper exhibits the lowest error in the situation assessment results compared with the traditional SVM, RF, KNN, GBDT, XGBoost, and LightGBM methods. Specifically, compared with SVM and LightGBM, the MRE of the method in this paper reduced by 59.07% and 68.18%, the MAE reduced by 34.69% and 64.84%, the MSE reduced by 50% and 85.71%, and the RMSE reduced by 5.56% and 56.2%, respectively. These findings demonstrate that the method proposed in this paper surpasses other methods in terms of error, implying its superior reliability.

7. Conclusions

To address the inefficiency and low accuracy issues associated with traditional IoT network security situation assessment methods when dealing with large-scale and complex network data, this paper proposes an IoT network security situation assessment method using feature optimization and improved SSA-LightGBM. Firstly, ICA was used for dimensionality reduction, and feature optimization was performed by combining mRMR, Spearman’s rank correlation coefficient, and XGBoost feature importance. The SSA was then optimized using piecewise chaos mapping and firefly perturbation strategies to improve the LightGBM and increase model performance. In the final stage, model training was conducted to enhance the performance of the proposed method. This involved calculating the situation values and assessing the state of IoT network security using the trained model. The results demonstrate that the model achieves an evaluation accuracy of 99.34%, an MSE of 0.00001, a faster convergence rate, and a more effective measure of the network security situation. Future work will test the proposed model on additional datasets to verify its generalization capability and further optimize the calculation of the situation values.

Author Contributions

Conceptualization, B.X.; methodology, B.X.; validation, F.L., H.L. and L.W.; formal analysis, A.Y.; resources, L.W.; writing—original draft preparation, F.L.; writing—review and editing, B.X.; project administration, F.L. All authors have read and agreed to the published version of the manuscript.

Funding

This research was funded by Basic Scientific Research Business Expenses of Hebei Provincial Universities (Project Number: JST2022001), and the Tangshan Science and Technology Project (Project Number: 22130225G).

Institutional Review Board Statement

Not applicable.

Informed Consent Statement

Not applicable.

Data Availability Statement

The data are from UNSW Canberra at the ADFA public dataset (https://www.unsw.edu.au/canberra, accessed on 10 February 2023).

Acknowledgments

We thank the Basic Scientific Research Business Expenses of Hebei Provincial Universities, grant number JST2022001, and Tangshan Science and Technology Project, grant number 22130225G, for supporting this work.

Conflicts of Interest

The authors declare no conflict of interest.

References

  1. Laghari, A.A.; Wu, K.; Laghari, R.A.; Mureed, A.; Khan, A.A. A review and state of art of Internet of Things (IoT). Arch. Comput. Methods Eng. 2021, 29, 1395–1413. [Google Scholar] [CrossRef]
  2. Jagatheesaperumal, S.K.; Rajkumar, S.; Suresh, J.V.; Gumaei, A.H.; Alhakbani, N.; Uddin, M.Z.; Hassan, M.M. An IoT-Based Framework for Personalized Health Assessment and Recommendations Using Machine Learning. Mathematics 2023, 11, 2758. [Google Scholar] [CrossRef]
  3. Fu, H.; Manogaran, G.; Wu, K.; Cao, M.; Jiang, S.; Yang, A. Intelligent decision-making of online shopping behavior based on internet of things. Int. J. Inf. Manag. 2020, 50, 515–525. [Google Scholar] [CrossRef]
  4. Pivoto, D.G.S.; Almeida, L.F.F.d.; Righi, R.d.R.; Rodrigues, J.J.P.C.; Lugli, A.B.; Alberti, A.M. Cyber-physical systems architectures for industrial internet of things applications in Industry 4.0: A literature review. J. Manuf. Syst. 2021, 58, 176–192. [Google Scholar] [CrossRef]
  5. Liu, J.; Wu, J.; Sun, L. Control method of urban intelligent parking guidance system based on Internet of Things. Comput. Commun. 2020, 153, 279–285. [Google Scholar] [CrossRef]
  6. Malik, P.K.; Sharma, R.; Singh, R.; Gehlot, A.; Satapathy, S.C.; Alnumay, W.S.; Pelusi, D.; Ghosh, U.; Nayak, J. Industrial Internet of Things and its applications in industry 4.0: State of the art. Comput. Commun. 2021, 166, 125–139. [Google Scholar] [CrossRef]
  7. Kiran, A.; Mathivanan, P.; Mahdal, M.; Sairam, K.; Chauhan, D.; Talasila, V. Enhancing Data Security in IoT Networks with Blockchain-Based Management and Adaptive Clustering Techniques. Mathematics 2023, 11, 2073. [Google Scholar] [CrossRef]
  8. Al-Hadhrami, Y.; Hussain, F.K. DDoS attacks in IoT networks: A comprehensive systematic literature review. World Wide Web 2021, 24, 971–1001. [Google Scholar] [CrossRef]
  9. Ngo, Q.D.; Nguyen, H.T.; Le, V.H.; Nguyen, D. A survey of IoT malware and detection methods based on static features. ICT Express 2020, 6, 280–286. [Google Scholar] [CrossRef]
  10. Popoola, S.I.; Ande, R.; Adebisi, B.; Gui, G.; Hammoudeh, M.; Jogunola, O. Federated deep learning for zero-day botnet attack detection in IoT-edge devices. IEEE Internet Things J. 2021, 9, 3930–3944. [Google Scholar] [CrossRef]
  11. Alfandi, O.; Khanji, S.; Ahmad, L.; Khattak, A. A survey on boosting IoT security and privacy through blockchain: Exploration, requirements, and open issues. Clust. Comput. 2021, 24, 37–55. [Google Scholar] [CrossRef]
  12. Abd El-Latif, A.A.; Abd-El-Atty, B.; Mazurczyk, W.; Carol, F.; Venegas-Andraca, S.E. Secure data encryption based on quantum walks for 5G Internet of Things scenario. IEEE Trans. Netw. Serv. Manag. 2020, 17, 118–131. [Google Scholar] [CrossRef]
  13. Yang, H.; Zeng, R.; Wang, F.; Xu, G.; Zhang, J. An unsupervised learning-based network threat situation assessment model for internet of things. Secur. Commun. Netw. 2020, 2020, 1–11. [Google Scholar] [CrossRef]
  14. Yan, J.; Xu, Y.; Cheng, Q.; Jiang, S.; Wang, Q.; Xiao, Y.; Ma, C.; Yan, J.; Wang, X. LightGBM: Accelerated genomically designed crop breeding through ensemble learning. Genome Biol. 2021, 22, 271. [Google Scholar] [CrossRef] [PubMed]
  15. Malhotra, P.; Singh, Y.; Anand, P.; Bangotra, D.K.; Singh, P.K.; Hong, W. Review of security issues in Internet of Things and artificial intelligence-driven solutions. Sensors 2021, 21, 1809. [Google Scholar] [CrossRef]
  16. Ahmid, M.; Kazar, O. A Comprehensive Review of the Internet of Things Security. J. Appl. Secur. Res. 2023, 18, 289–305. [Google Scholar] [CrossRef]
  17. Peter, O.J.; Qureshi, S.; Yusuf, A.; Al-Shomrani, M.; Idowu, A.A. A new mathematical model of COVID-19 using real data from Pakistan. Results Phys. 2021, 24, 104098. [Google Scholar] [CrossRef]
  18. Ahmed, I.; Modu, G.U.; Yusuf, A.; Kumam, P.; Yusuf, I. A mathematical model of Coronavirus Disease (COVID-19) containing asymptomatic and symptomatic classes. Results Phys. 2021, 21, 103776. [Google Scholar] [CrossRef]
  19. Bharadwaj, H.K.; Agarwal, A.; Chamola, V.; Lakkaniga, N.R.; Hassija, V.; Guizani, M.; Sikdar, B. A review on the role of machine learning in enabling IoT based healthcare applications. IEEE Access 2021, 9, 38859–38890. [Google Scholar] [CrossRef]
  20. Churcher, A.; Ullah, R.; Ahmad, J.; ur Rehman, S.; Masood, F.; Gogate, M.; Alqahtani, F.; Nour, B.; Buchanan, W.J. An Experimental Analysis of Attack Classification Using Machine Learning in IoT Networks. Sensors 2021, 21, 446. [Google Scholar] [CrossRef]
  21. Xie, L.; Yan, L.; Zhang, X.; Yang, H. A security situation assessment model of information system for smart mobile devices. Wirel. Commun. Mob. Comput. 2020, 2020, 8886516. [Google Scholar] [CrossRef]
  22. Liao, Y.; Zhao, G.; Wang, J.; Li, S. Network security situation assessment model based on extended hidden Markov. Math. Probl. Eng. 2020, 2020, 1428056. [Google Scholar] [CrossRef]
  23. Yang, J.; Yang, Y.; Zheng, L.; Cheng, R.; Lin, S. Network Security Situation Assessment Based on Attack Graph Techniques. J. Phys. Conf. Ser. 2022, 2310, 012071. [Google Scholar] [CrossRef]
  24. Tao, X.; Kong, K.; Zhao, F.; Cheng, S.; Wang, S. An efficient method for network security situation assessment. Int. J. Distrib. Sens. Netw. 2020, 16, 1550147720971517. [Google Scholar] [CrossRef]
  25. Yang, H.; Zeng, R.; Xu, G.; Zhang, L. A network security situation assessment method based on adversarial deep learning. Appl. Soft Comput. 2021, 102, 107096. [Google Scholar] [CrossRef]
  26. Tao, X.; Liu, Z.; Yang, C. An efficient network security situation assessment method based on AE and PMU. Wirel. Commun. Mob. Comput. 2021, 2021, 1173065. [Google Scholar] [CrossRef]
  27. Yang, H.; Zhang, Z.; Xie, L.; Zhang, L. Network security situation assessment with network attack behavior classification. Int. J. Intell. Syst. 2022, 37, 6909–6927. [Google Scholar] [CrossRef]
  28. Zhang, R.; Liu, M.; Pan, Z. Network Security Situation Assessment Based on Improved WOA-SVM. IEEE Access 2022, 10, 96273–96283. [Google Scholar] [CrossRef]
  29. Liu, Z.; Yang, C.; Liu, Y.; Ding, Y. A BIPMU-based network security situation assessment method for wireless network. Comput. Stand. Interfaces 2023, 83, 103661. [Google Scholar] [CrossRef]
  30. Gharehchopogh, F.S.; Namazi, M.; Ebrahimi, L.; Abdollahzadeh, B. Advances in sparrow search algorithm: A comprehensive survey. Arch. Comput. Methods Eng. 2023, 30, 427–455. [Google Scholar] [CrossRef]
  31. Luo, Y.; Zhou, R.; Liu, J.; Cao, Y.; Ding, X. A parallel image encryption algorithm based on the piecewise linear chaotic map and hyper-chaotic map. Nonlinear Dyn. 2018, 93, 1165–1181. [Google Scholar] [CrossRef]
  32. Han, X.; Wu, B.; Wang, D. Firefly algorithm with disturbance-factor-based particle filter for seismic random noise attenuation. IEEE Geosci. Remote Sens. Lett. 2019, 17, 1268–1272. [Google Scholar] [CrossRef]
Figure 1. Proposed IoT network security situation assessment model architecture.
Mathematics 11 03617 g001
Figure 2. Feature weight value.
Mathematics 11 03617 g002
Figure 3. Comparison of results from ablation experiments.
Mathematics 11 03617 g003
Figure 4. Fitness curves of different optimization algorithms.
Mathematics 11 03617 g004
Table 1. Overview and Comparison of Situation Assessment Methods.
ApproachYearAuthorCharacteristics
Mathematical Model2020Lixia Xie et al. [21]Assessment model based on an improved BP network.
Mathematical Model2020Yiwei Liao et al. [22]Awareness technology based on multisource heterogeneous information.
Mathematical Model2022Jinwei Yang et al. [23]Assessment model based on the combination of intrusion detection.
Machine Learning2020Xiao-ling Tao et al. [24]Using SAE and BPNN to evaluate a security situation.
Machine Learning2021Hongyu Yang et al. [25]Using DAE for feature learning and accurately identifying attacks.
Machine Learning2021Xiao-ling Tao et al. [26]Using AE and the minimalist memory unit.
Machine Learning2022Hongyu Yang et al. [27]Utilizing parallel feature extraction networks, BiGRU, and attention mechanisms.
Machine Learning2022Ran Zhang et al. [28]Using improved WOA-SVM.
Machine Learning2023Ziyi Liu et al. [29]Assessment model based on BIPMU.
Table 2. Accuracy of feature optimization under different thresholds.
ThresholdNumber of FeaturesAccuracyPrecisionRecallF1
0.015799.3799.3999.3799.38
0.035699.4999.4999.4999.49
0.065299.6199.6299.6199.61
0.104299.5599.5599.5599.55
0.143398.9299.1398.9299.01
0.192299.4799.4799.4799.47
0.251699.2699.2799.2799.26
0.331198.9298.9798.9298.94
0.40596.6596.8496.6596.72
Table 3. Threat impacts for each attack type.
Attack TypeThreat Factor
Normal1
Analysis2
Reconnaiss3
Fuzzers4
Dos5
Generic6
Shellcode7
Worms8
Exploits9
Backdoor10
Table 4. Optimal hyperparameters obtained using the improved SSA-LightGBM algorithm.
ParameterValue RangePrecisionOptimal Value
max_depth[8, 35]128
num_leaves[5, 100]144
bagging_fraction[0.1, 0.95]0.010.95
feature_fraction[0.1, 0.95]0.010.95
n_estimators[5, 100]179
lambda_l1[0, 0.9]0.010.9
lambda_l2[0, 40]119
learning_rate[0.02, 0.2]0.010.2
Table 5. Comparison of algorithm performance.
ModelAccuracyPrecisionRecallF1
SVM95.7595.3395.7595.42
RF96.2796.3296.2696.23
KNN96.2796.6796.2796.4
GBDT96.5596.5496.5596.53
XGBoost97.0597.0697.0597.05
LightGBM97.7697.8297.7697.76
Our approach99.3499.3499.3599.34
Table 6. Evaluation error based on seven models.
ModelMREMAEMSERMSE
SVM0.003250.002940.000020.00396
RF0.012750.014250.000620.02489
KNN0.005050.007640.000090.00979
GBDT0.006390.00860.000120.01087
XGBoost0.00570.008710.000180.01175
LightGBM0.004180.005460.000070.00854
Our approach0.001330.001920.000010.00374
Disclaimer/Publisher’s Note: The statements, opinions and data contained in all publications are solely those of the individual author(s) and contributor(s) and not of MDPI and/or the editor(s). MDPI and/or the editor(s) disclaim responsibility for any injury to people or property resulting from any ideas, methods, instructions or products referred to in the content.

