Article

Optimal Control Design and Online Controller-Area-Network Bus Data Analysis for a Light Commercial Hybrid Electric Vehicle

by
Aminu Babangida
*,
Chiedozie Maduakolam Light Odazie
and
Péter Tamás Szemes
Department of Mechatronics, Faculty of Engineering, University of Debrecen, Òtemetö Utca 2-4, 4028 Debrecen, Hungary
*
Author to whom correspondence should be addressed.
Mathematics 2023, 11(15), 3436; https://doi.org/10.3390/math11153436
Submission received: 30 June 2023 / Revised: 22 July 2023 / Accepted: 3 August 2023 / Published: 7 August 2023
(This article belongs to the Special Issue Dynamics and Control Theory with Applications)

Abstract

:
In this article, a hybrid powertrain for the Volkswagen (VW) Crafter is designed using the Model-In-The-Loop (MIL) method. An enhanced Proportional-Integral (PI) control technique based on integral cost functions is developed by carrying out a time-based simulation in MATLAB/Simulink software to realize the optimal fuel economy of the vehicle. Moreover, a comparative study is conducted between the vehicle’s hybrid and pure electric versions to assess the optimal battery energy consumption per unit distance traveled. Communication within our vehicles’ Electronic Control Units (ECUs) is facilitated by a message-based protocol called a Controller Area Network (CAN). Consequently, this paper presents an online CAN Bus data analysis using the Hardware-In-The-Loop (HIL) method. This method uses a standard frame, J1939 CAN protocol, implemented with Net CAN Plus 110 hardware. A graphical user interface is developed on a host Personal Computer (PC) using LabVIEW for decoding the acquired raw CAN data to physical values. The simulation results reveal that the proposed controller is promising and suitable for realizing optimal performance over the HIL method.

1. Introduction

1.1. Background

An Internal Combustion Engine (ICE) in conventional vehicles is the primary source of toxic gases that threaten human lives and livestock. Replacing the ICE with electric propulsion leads to a clean and safer environment. Transportation systems are almost a quarter of the causes of greenhouse emissions, which cause air pollution in various cities [1] due to high traffic [2], and they are harmful to the living [3]. This effect has led to the shift toward renewable energy sources [4]. Hybrid Electric Vehicles (HEVs) have evolved to reduce air pollution levels and improve efficiency and drivability compared to traditional vehicles [4], and effective utilization of conventional energy is an emerging research area. However, HEVs are the development goal in the automotive industry [5], and their optimal fuel economy is a critical factor for their success [6,7]. Therefore, the sole aim for evolving the HEVs is to improve fuel economy, reduce ICE emission levels, and ensure that they are performing within an acceptable range [8,9]. In comparison, pure Electric Vehicles (EVs) have eliminated emissions and improved fuel economy [10,11] with a smooth transition to transportation electrification [12]. This paper proposes an enhanced classical PI control technique based on integral objective functions to realize an optimal fuel economy for a parallel hybrid car.
The literature survey revealed that in the early stage of the HEV control methods for optimal fuel economy, linear control algorithms such as the Proportional Integral Derivative (PID), Linear Quadratic Regulator (LQR), and analytical approach [13,14,15] were adopted. The proposed analytical method is quite cumbersome due to the computational effort. The classical PID and LQR are not promising and might perform poorly because of their unrealistic nature to handle the complexity of the nonlinear systems. In addition, the LQR is not promising, due to the difficulty in computing precise weighting matrices. The broader application of EVs has led to the development of complex, more reliable alternative nonlinear control strategies and has significantly accomplished optimal fuel and energy consumption for pure and hybrid EVs.
One of the promising control strategies applied for optimal fuel consumption in pure electric and hybrid vehicles is the Fuzzy Logic Controller (FLC). The FLC seems to be a powerful tool control strategy [16]. In [17], an FLC was applied to minimize energy consumption by establishing a power split among the electric motors for a four-wheel independent-drive EV. Similarly, the study in [18,19,20,21] applied FLC-based energy management and the power control technique for the HEV and achieved optimal fuel economy. Niels et al. performed a comparative study to investigate the fuel economy of the parallel HEV [22]. The proposed FLC was found to be an alternative control scheme for optimal fuel consumption. In [23], two driving cycles were proposed, based on the FLC control algorithm to study fuel consumption for a parallel HEV: Urban Dynamometer Driving Schedule (UDDS) and Highway Fuel Economy Test Drive Cycle (HWFET).
Another popular control strategy used for the optimal fuel consumption for HEVs is the Model Predictive Controller (MPC). The MPC is a control algorithm that uses a dynamical model of the control plant to predict the direction of its desired response [24,25]. The study in [26] proposed an MPC controller to control gas emissions and improve fuel economy. The study in [27] explored the various literature results for HEVs based on MPC control as the energy management strategy. The study [28] evaluated the MPC for HEVs at different driving conditions, such as urban and highway driving, for optimal fuel economy. Poor prediction in the MPC would make its performance worse.
Recently, another novel approach proposed for optimal fuel economy is the Neural Network (NN). Millo et al. in [29] developed an NN algorithm exploited through deep Recurrent Neural Networks (RNNs) for the optimal fuel consumption for the HEV. In [30], the proposed NN is trained based on dynamic programming (DP) for the optimal fuel economy of the HEV. Several control techniques in control theory applications have been inspired by intelligent methods like the Genetic Algorithm (GA), neuro-fuzzy membership function, and adaptive control techniques like the Adaptive Neuro-Fuzzy Inference System (ANFIS), which have been applied to search for an optimal path for the optimal fuel economy in hybrid cars. For example, a PI controller optimized according to the symmetrical optimum tuning procedure was suggested to examine the optimal fuel consumption for HEVs [31]. The study in [32] proposed an algorithm-based GA to optimize the system transmission efficiency of the HEV, thereby achieving an optimal fuel economy. Junjiang et al. in [33] performed an EV study based on the neuro-fuzzy membership function and MPC for energy efficiency and ride comfort. The energy recovery efficiency of the EV was improved by proposing a neuro-fuzzy optimization framework to optimize the neuro-fuzzy membership function to realize the neuro-fuzzy control.
Motivated by the above, this research develops an enhanced PI controller to investigate the optimal fuel economy using the MIL and HIL methods for a VW Crafter, which is transformed into a hybrid at the Department of Mechatronics Engineering. The ICE and the electric motor (e-motor) propel the vehicle. The ICE is a four-cylinder, four-stroke diesel engine with a displacement of 1968 cc (120.1 cu in), with a range of approximately 8–900 km, and the tank capacity is up to 70 L. A 2011 Nissan Leaf battery pack having 48 modules, 192 cells, 360 V of nominal voltage, and 24 kWh of overall pack capacity is proposed as a traction battery. However, a new gearbox is designed for the motor as rear wheel drive while the engine is front wheel drive. The vehicle could operate in engine, electric, or hybrid mode with a switching mechanism.

1.2. Model-In-The-Loop Development

The MIL development is the first stage of our Crafter design process. The hybrid powertrain is simulated in this phase to ensure it meets the design goal [34]. The establishment of the Crafter began when the first Crafter was released in 2006 by a German manufacturer. Later, in 2016, the first electric (e-Crafter) was released. However, the conventional version of the Crafter’s pick-up style was converted into a hybrid by integrating an e-motor at the rear wheel. Details of this transformation are discussed in the coming sections of this paper.
A conventional manufactured WV Crafter 2021, propelled by a Turbo Charged Direct Injection Common Rail (2.0 TDI CR) diesel engine, with a manual, six-speed gearbox, was designed to study its theoretical optimal fuel economy. The VW Crafter is a pickup-style vehicle whose vehicle weight has reduced to 2758 kg after conversion from the van type, with 3500 kg as the overall weight. The throttle set-point was determined by a PI-controller-based Worldwide Harmonized Light Vehicles Test Procedure (WLTP) profile. The six-speed manual gearbox was coupled to a friction disc clutch to facilitate vehicle movement.
On the one hand, the pure electric and hybrid models were designed using the MIL method. The hybrid version has a parallel architecture whose wheel was propelled by both the ICE and the Permanent Magnet Synchronous Motor (PMSM). Moreover, a 2011 Nissan Leaf battery with a nominal voltage of 360 V and 24 kWh capacity was used as a traction battery. The Nissan Leaf battery has 48 modules, each with four cells (2 in series, 2 in parallel), totaling 192 cells in the pack. It is a lithium-ion-based battery whose cell individual current capacity in Ampere-hour (Ah) is 33.1, making the maximum capacity of the pack to be 66.2 Ah.

1.3. Hardware-In-The-Loop Development

An online CAN Bus Data Acquisition (DAQ) using the HIL method was developed on a real car to collect the data from the vehicle CAN Bus. A standard frame, the J1939 CAN protocol, was implemented with the aid of Net CAN Plus 110 hardware. The car CAN Bus data were acquired and stored on a computer as a Comma-Separated-Value (CSV) file using LabVIEW software 20.0, 64-bit (National Instrument, Austin, TX, USA). A graphical user interface was implemented on the host PC to analyze the acquired raw CAN data in physical values.
CAN is a suitable protocol for several distributed embedded system applications. Initially developed in the early 1980s by Bosch, aiming at the automotive industry, this protocol gained wide acceptance, and today, practically all current car manufacturers include CAN in their models [35]. CAN is a broadcast bus designed to operate at speeds of up to 1 Mbit/s [36] and a payload size of up to 8 bytes [37]. All the ECUs in a vehicle are connected by a CAN Bus, which offers an average transmission speed of 500 kbps, meeting the required speed. Additionally, various design elements of the CAN Bus communication protocol, such as message arbitration and message validation, aid in the CAN Bus’s ability to achieve the reliability criterion. The major challenge is understanding raw CAN Bus messages from the Vehicle ECU. The raw CAN Bus messages contain CAN frames, and these are not human-readable. The CAN frames must be decoded and evaluated into scaled engineering values to make sense of the data.
In the early stage of technological advancement, the conventional approach of vehicle performance assessment, such as the Onboard Diagnostic (OBD2), was the most common. The performance of the vehicle for optimization and diagnosis was mostly checked via OBD2 [38,39,40,41,42,43,44,45,46,47] and the fuel consumption study as in [48,49], as well as the numerical and experimental determination of the optimal fuel economy in [50].
To remain up to date due to the rapid improvement in the technological process, the vehicle’s data collection method should continue to pass through the rapid development phase to make it easier and comply with the safety standards. For example, the study in [51] presented a vehicle ICT platform based on the sensor Hub framework and compared the vehicle’s OBD2 and CAN Bus data. The study used an “ObdCanCompare” novel measurement approach, collected vehicle sensor data, and displayed them on a smartphone. In [52], vehicle CAN Bus data were extracted for roadway condition monitoring. The authors in [53] conducted an outline mission profile of agricultural tractors through CAN Bus data analytics. In [54], “the vehicle behavior was simulated with a PC connected on the CAN BUS network designed for the HIL system”. The study in [55] identified the differences between the solutions available on the market by comparing the FMS (Fleet Management System) CAN standard, the OBD standard, and the Proprietary Vehicle CAN protocol based on the measurement and analysis. The data acquisition was designed for an EV in [56] using high-amperage current sensors and an embedded system that records a vehicle’s input data such as current, displacement, and velocity. Some of the main contributions of this paper are as follows:
  • Unlike the conventional approaches proposed in [38,39,40,41,42,43,44,45,46,47,48,49,50,51,52,53,54,55], this research proposes a new methodology, an online CAN Bus data analysis with the help of Net CAN plus 110 hardware.
  • This paper presents an optimal energy development approach for the reference vehicle of the engineering faculty at the University of Debrecen by performing a time-based simulation in MATLAB/Simulink, unlike the study in [57], which is limited to studying the real transformation of the vehicle from conventional to hybrid.
  • The battery charge level might not guarantee optimal performance of the HEV as proposed in [19] using the FLC technique. This paper considers almost every aspect of performance evaluation to ensure the optimal fuel economy of the proposed hybrid car.
  • The proposed conventional PID controller in [13,14,15] and [58] might not guarantee optimal fuel economy. The computed fitness function in [59,60] did not achieve more stable systems; therefore, good fuel economy could not be realized. An optimal solution is realized in this paper by computing minimum values of the integral error objective functions. In addition to reducing the computational effort of the analytical approach in ref. [15], PMSM is more efficient than the proposed Brushless Direct Current (BLDC) motor as in [60] for EV application.
  • The study in [61] found the power transmission efficiency to be approximately 84%. Moreover, the designed EV is 15% (75–60) more efficient in fuel economy than the traditional car with an ICE. Our research has shown that the designed HEV is 31% (91–60) more efficient than the designed conventional vehicle as in [61]. In this paper, a transmission efficiency of 94% is achieved.

2. System Description and Design

2.1. HEV Configuration

The simulated hybrid model was driven by the diesel engine and the e-motor based on the Nissan Leaf traction battery. A new gearbox was designed for the real hybrid version of this car to enable the vehicle to operate in electric or engine mode. In this new model, the front wheel was propelled by the diesel ICE, and the e-motor propelled the rear wheel.
Figure 1 shows the hybrid vehicle architecture with the DAQ system incorporated. To read the CAN Bus messages from the control unit of the vehicle, the hardware components consisted of the Phoenix Contact Industrial Box PC, the Phoenix Contact Quint Power Supply Unit, the Phoenix Contact WLAN 5100, the Vision Systems Net CAN Plus 110, the FL Switch 1000, and the Stilo STB1 Circuit Breaker. Moreover, the Phoenix Contact Wireless Module—FL Timeserver NTP was interconnected together and connected to the car. The host PC was connected to the Phoenix Contact Industrial Box PC remotely via a Local Area Network using an ethernet cable. The LabVIEW software was run on this host PC to read the CAN Messages from the EV through the four (4) Net CAN Plus 110 devices connected to it.

2.2. Vehicle Dynamics Description

The vehicle dynamics system in this paper is described as half a car, with 3 degrees of freedom (DOF), as shown in Figure 2. The tire dynamics were modeled based on the Pacejka Tire Formula. The vehicle and tire specifications were also adopted from our previous papers [59,60].
The free-body diagram of Figure 2, as derived in [62], is considered as follows:
{ m · x ¨ = F x F d x F g x m · z ¨ = F d z + F s z F + F s z R F g x I y y · θ ¨ = L F · F s z F + L r · F s z R + h · F x M d y m w · z ¨ 1 = F s z F + F s 1 m w · z ¨ 2 = F s z R + F s 2
where F x , F d x , F g x , F d z , F s z F , F s z R , F g z , and M d y are the wheel axis longitudinal force, vertical drag force, gravity force component, longitudinal drag force, elastic force and damping force of the front wheel, elastic and damping force of the rear wheel, gravity force component, and drag moment, respectively [62]. Also, L F and L r are the “longitudinal distances from the center of mass to the front and rear axles” [62], while h is regarded as the CG (Center of Gravity) height, respectively [62]. However, the friction (viscous force) between the vehicles and air are directly related to the squared difference between the vehicle and wind velocities [62].
{ F d x = 1 2 · C d · ρ · A ( x ˙ w ) 2 F d z = 1 2 · C 1 · ρ · A ( x ˙ w ) 2
where C d , ρ , and A are the coefficient of drag, air density, and vehicle front area, respectively [63]. Moreover, m , m w , and I y y are the sprung mass, unsprung mass, and tire moment of inertia, respectively.

2.3. Tire Dynamics Description

“The longitudinal force arising from the road-tire interaction is given by the Pacejka Tire formula, an empirical equation based on four fitting coefficients” [64]. “The Tire-Road Interaction block models the longitudinal forces at the tire-road contact patch using the Pacejka Tire Formula” [64]. The constant coefficients are B , C , D , and E . The formula in Equation (3) gives the characteristics function.
F x = f ( k , F z ) = F z · D · sin ( C · arctan { B k E [ B k a c r tan ( B k ) ] } )
Table 1 presents the constant coefficients of Pacejka Tire formula under different road conditions.

2.4. ICE Modeling

The ICE can be modeled as described in [65]. Engine torque Q is related to the output power P and the rotational speed ω by Equation (4).
Q = P ω
The engine efficiency η f is related to the heating value Q h v and the specific fuel consumption S F C by Equation (5):
η f = 1 Q h v · S F C
The fuel flow rate m f is related to the S F C and P as described by Equation (6).
S F C = m f P
P relates the mean effective pressure M E P , the number of crank revolutions for each power stroke per cylinder n R , the volume displaced V d , and the rotational speed of the crankshaft N by Equation (7).
M E P = P · n R V d · N
The ICE in this research is a four-stroke engine and its M E P is related to the air–fuel ratio F A and the air-inlet density P a · i by Equation (8), where η v is the volumetric efficiency.
M E P = η f · η v · Q h v · P a · i · F A
The volumetric efficiency is related to the mass of the air induced into the cylinder m a in Equation (9).
η v = m a P a · i · V d
The emission in the engine modeling was not modeled, since the design in theory was assumed to comply with the euro 6d emission standard.

2.5. Motor Modeling

PMSM is broadly used for mechanical applications. However, the Field-Oriented Control (FOC) strategy aims to control the motor torque and the magnetic field, which can be performed by controlling components of the stator current [66]. Therefore, in the case of the simplified equivalent PMSM model, we only analyzed the outer loop, which uses a PI control technique to regulate the speed of the motor. Generally, a 3-phase PMSM, using the FOC strategy, has two control loops with two PIs in the inner loop to control the current vectors.
A PMSM is widely used to overcome the disadvantages of BLDC motors [67]. Virani et al. in [67] employed the FOC approach to regulate the speed of the PMSM for an EV application. Moreover, Espina et al. reviewed various studies for the FOC of the PMSMs [68]. A PMSM is classified as the “Surface Mounted Permanent Magnet Synchronous Motor (SPMSM)” and the “Interior Permanent Magnet Synchronous Motor (IPMSM)”.
The mathematical model of the PMSM can be described as in [69] using the ( d , q ) frame of reference, where V d and V q , L d and L q , and i d and i q are the stator voltage, inductance, and current components in the ( d , q ) axis, respectively [69]. Using the Park transformation [69]:
P ( θ ) = 1 2 · ( 1 2 cos θ sin θ 1 2 cos ( θ 2 3 π ) sin ( θ 2 3 π ) 1 2 sin ( θ 4 3 π ) cos ( θ 4 3 π ) )
( V d V q ) = ( R a L q · ω L d R a ) · ( i d i q ) + ( L d 0 0 L q ) · d d t ( i d i q ) + ( 0 ϕ f · ω )
where R a , ϕ f , and ω are the stator resistance per phase, rotor flux linkage, and electrical pulsation, respectively. The electromagnetic torque developed by the motor is given by
C e m = 1 2 · ( i s ) · { d d θ m ( L ) } · ( i s )
where θ m is the mechanical angle [69].
The motor converts electrical energy into mechanical rotational motion, supporting the vehicle’s movement. When the car decelerates, the motor acts as a generator and converts the mechanical energy into electrical energy, thus opposing the vehicle’s motion. A complex PMSM was modeled to estimate the electrical efficiency of the electric vehicle. The electrical losses of the three-phase model were used to simulate the electric car at the system level, which captures the behavior of the complex model as adopted from [70]. Moreover, the methodology applied for vehicle modeling was adopted from [71,72]. Table 2 presents the parameters of the three-phase PMSM used in the experimental determination of electrical losses.
Moreover, the motor specification based on the maximum and rated power and torques is presented in Table 3.

2.6. Gearbox Design for the Electric Mode

After the transformation of the Crafter from the conventional to hybrid one, we designed a new gearbox for the electric mode.
Table 4 presents the initial parameters of the gearbox and how it was used to obtain the new gear ratio of the e-motor mode.
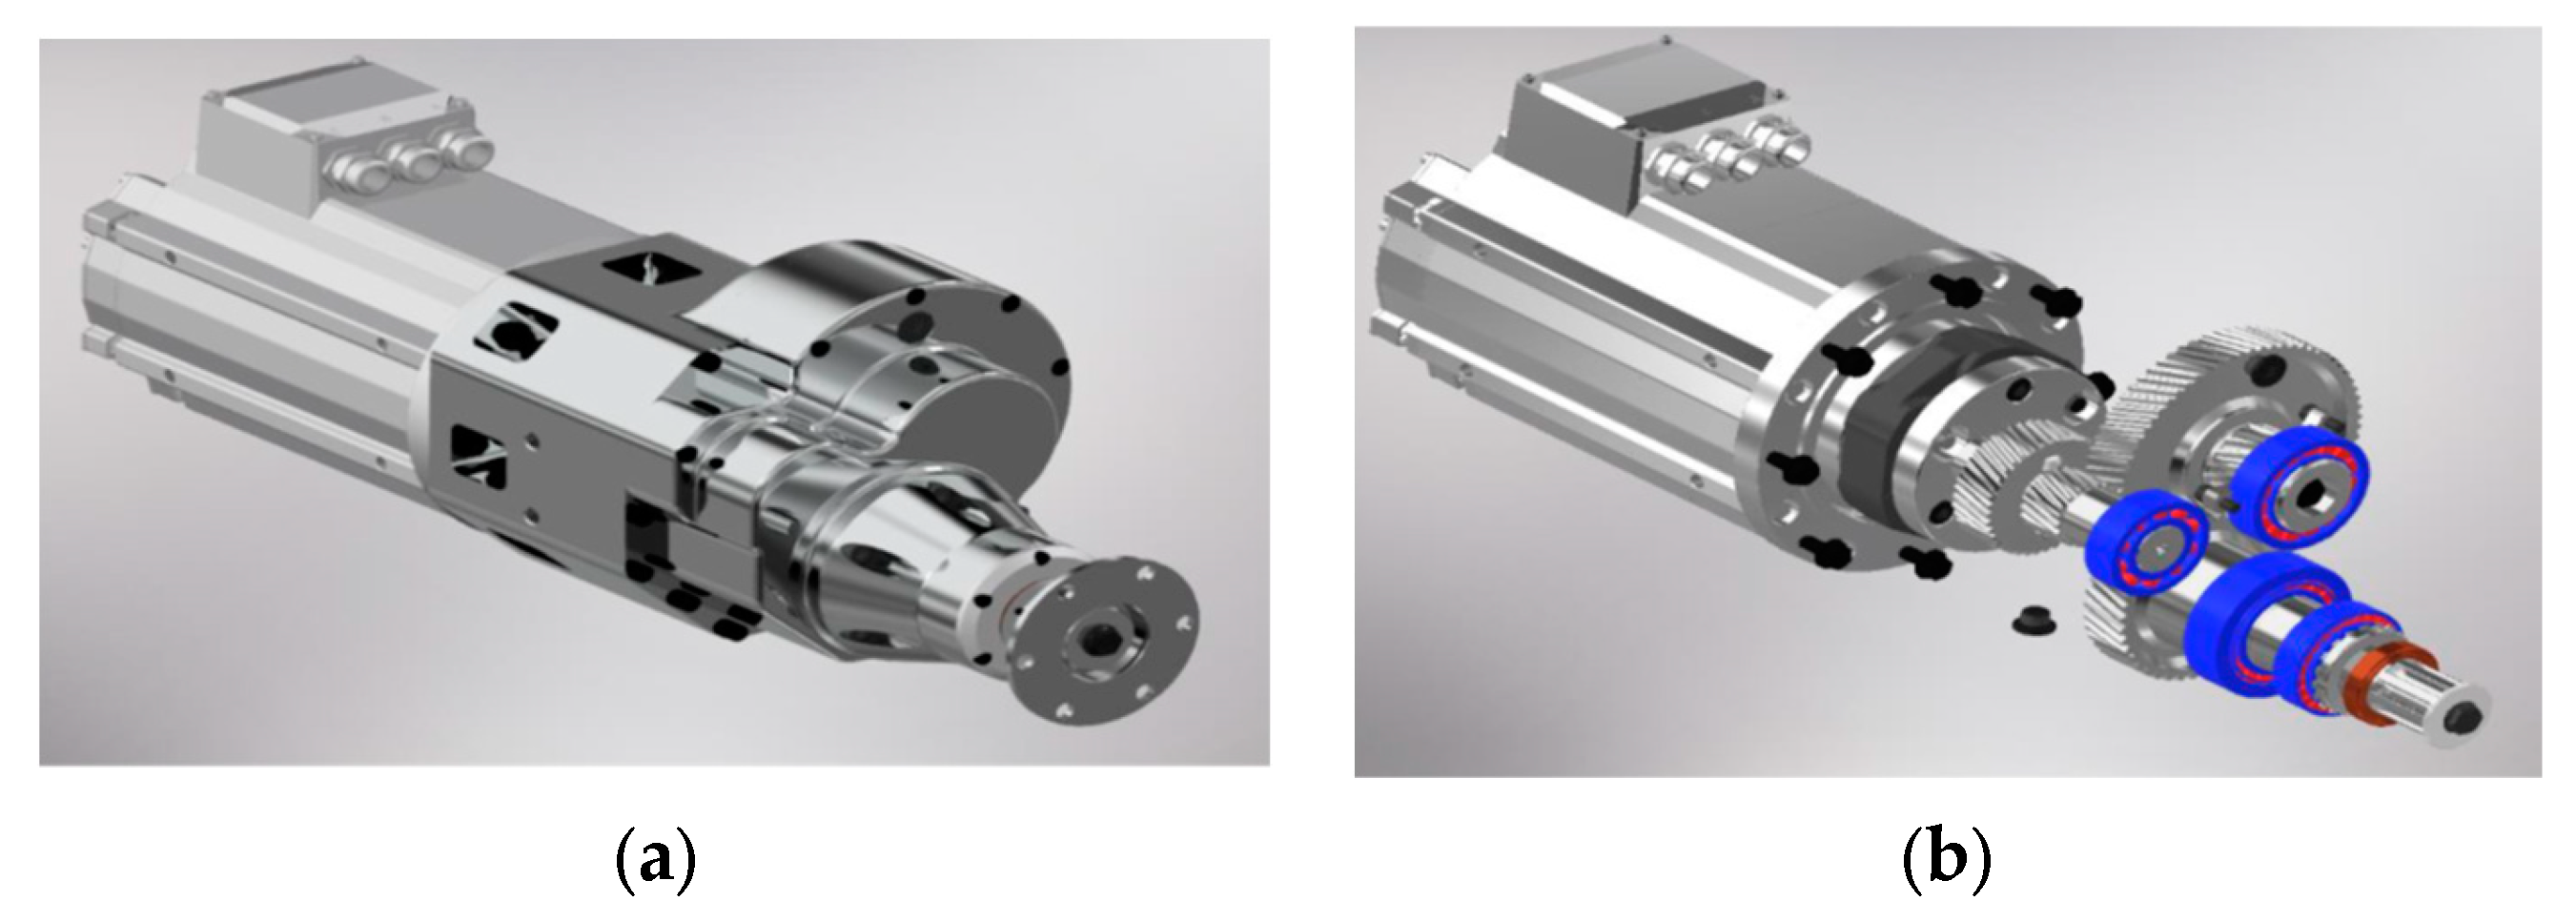
Figure 3 shows the 3D CAD model of the gearbox for the e-mode drive. The blue and red colors in the CAD model of Figure 3b are the bearings’ parts, ensuring the effective power transfer. While Figure 4 shows the transformed hybrid vehicle with a new gearbox for the e-mode drive.

2.7. MATLAB Simulation

A time-based simiulation was carried out in the MATLAB/Simulink environment for both the pure electric Crafter (e-Crafter) and its hybrid version.
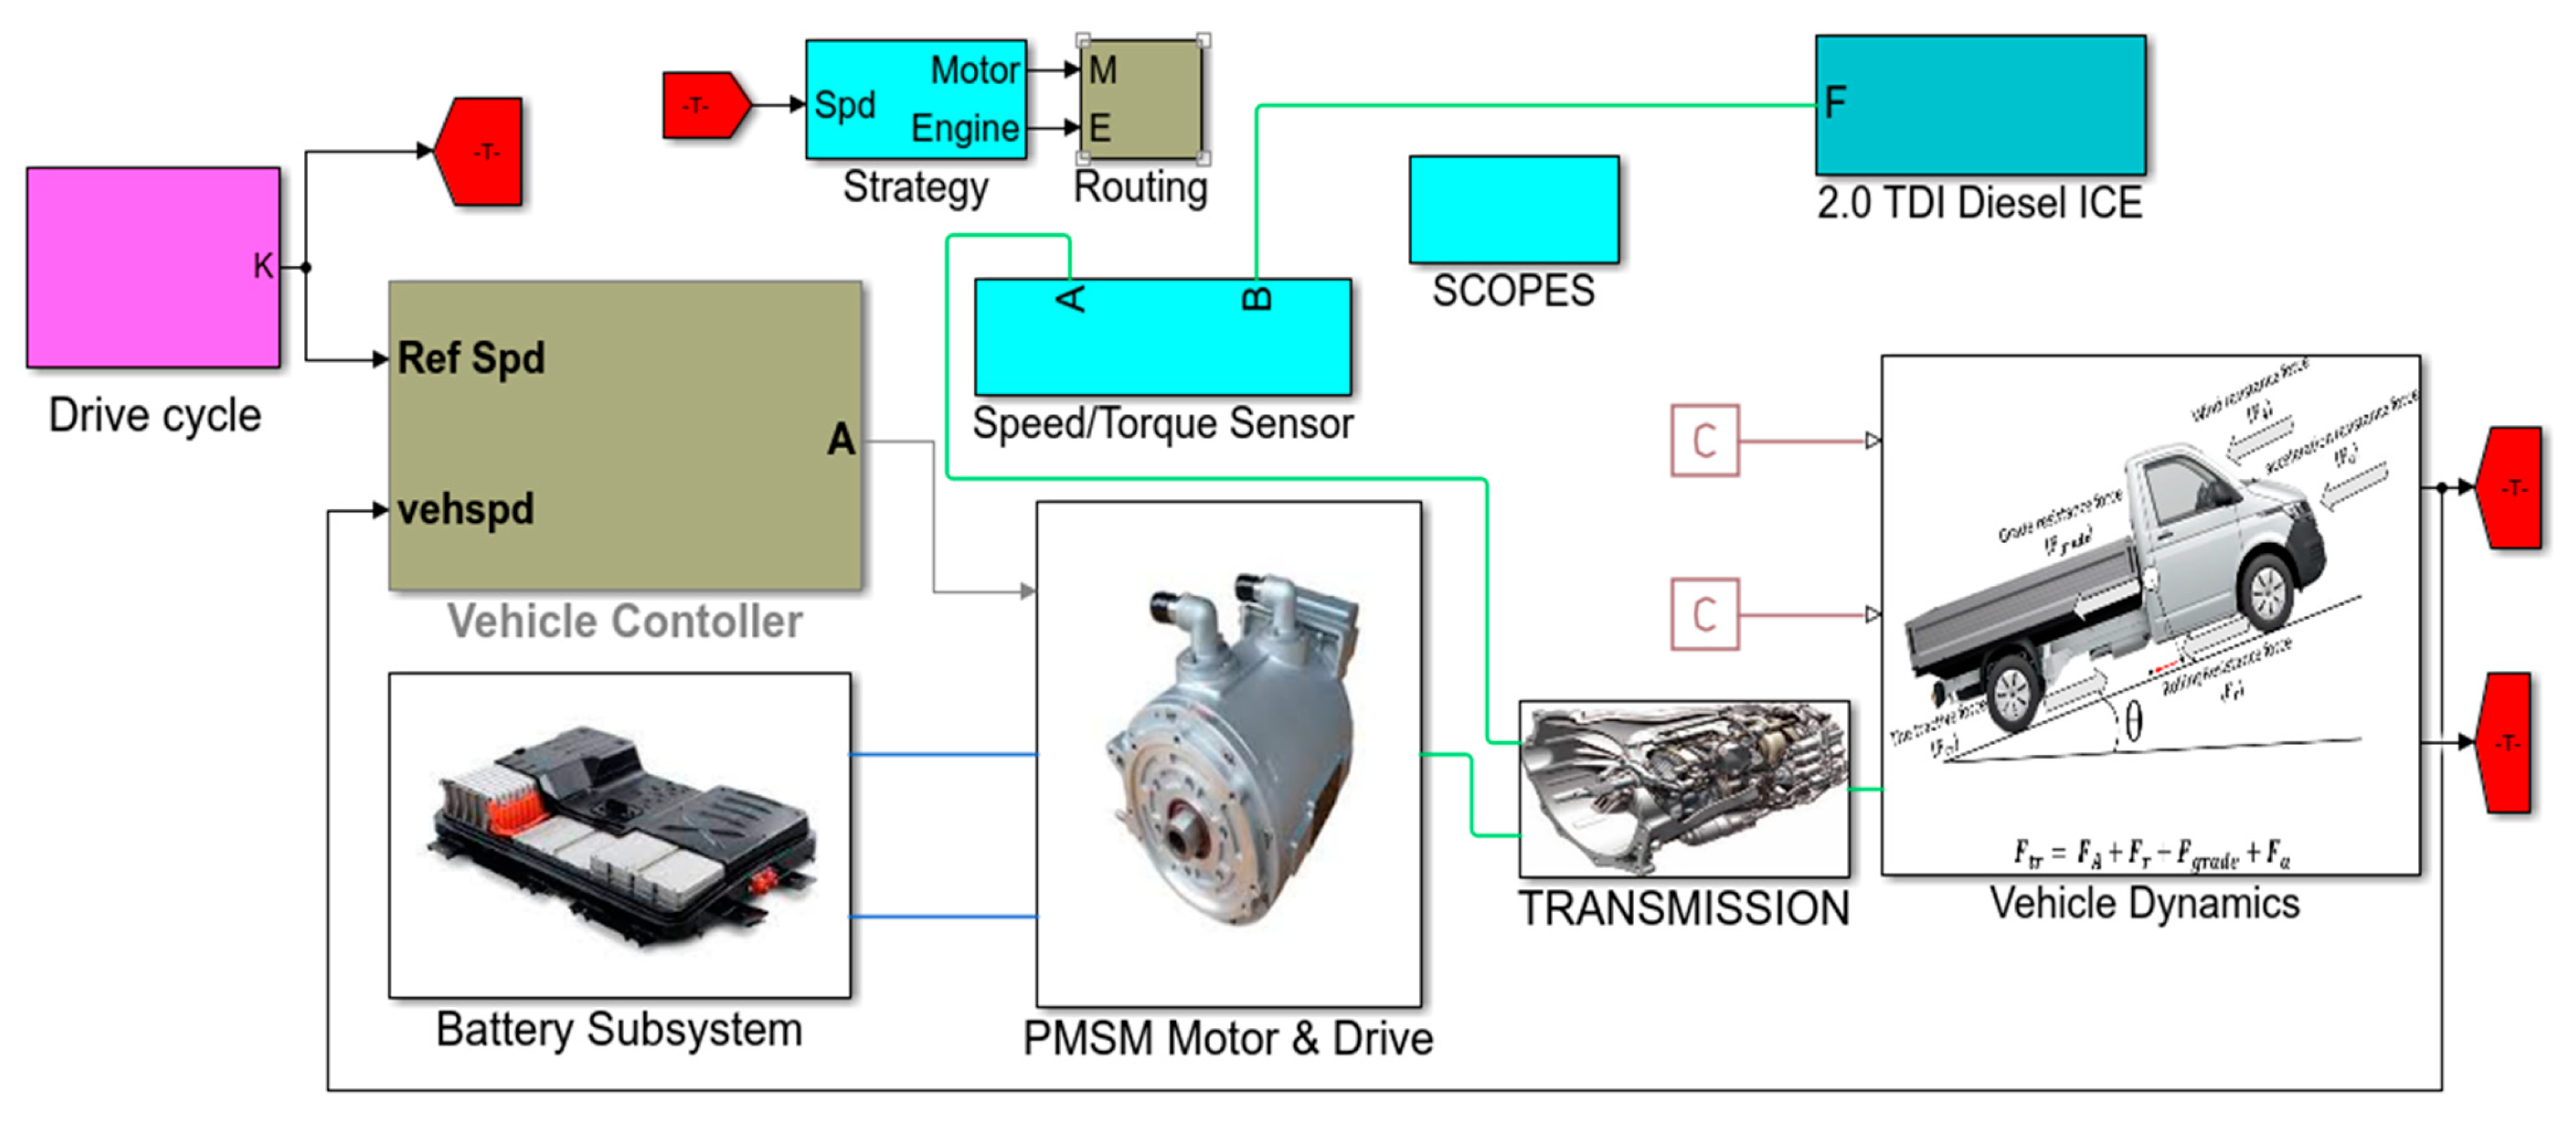
Figure 5 shows the designed pure e-Crafter MATLAB model. While Figure 6 shows its hybrid version.

2.8. Experimental Set-Up

The CAN Bus messages of the vehicle were read from the car using four (4) sets of Net CAN plus 110 devices. The vehicle was in charging mode during the measurement. The Net CAN plus 110 devices with IP address 192.168.10.13 read the charging data. The Net CAN plus with IP address 192.168.10.12 read the Inverter data. Moreover, the Net CAN plus with IP address 192.168.10.10 read the temperature data, and finally, the Net CAN plus with IP address 192.168.10.11 read the auxiliary data. The application was run on the LabVIEW platform; it received inputs of the IP Address, the Port number of the Net CAN plus 110 devices, and the Bus Speed of 500 Kbps. However, the user clicks on the Open button, and the CAN Channel opens to connect to the Net CAN plus 110 devices to read the CAN data from the car. Figure 7 shows the experimental set-up for CAN Bus analysis of the vehicle.

3. Simulation and Experimental Results

3.1. Simulation Results

This subsection presents the results obtained from the simulation analysis. The pure e-Crafter and hybrid versions were simulated in a MATLAB/Simulink environment. The models consist of a Nissan Leaf battery, a PMSM and drive, transmission systems, a diesel engine, and a vehicle dynamic subsystem. The transmission system consisting of a gearbox manages the power distribution to the wheel translated into vehicle movement. The engine’s rated power is 52 kW, where the peak and rated currents are 418 A and 166 A, respectively. The ratio of the maximum tractive force to the normal force is the tractive ratio or coefficient of traction, just like the friction coefficient. Therefore, it must overcome the resistance forces described in Section 2.2 for the vehicle to move. The tractive force needed to propel the vehicle under a flat surface was calculated to be within the acceptable amount of the battery, the engine, and the motor-rated values. Figure 8, Figure 9 and Figure 10 show the simulation results obtained from the drive cycle input test. Figure 8, Figure 9 and Figure 10 show the simulation results that are fully explained in Section 4.

3.2. Experimental Results

This subsection presents the results obtained from the experimental analysis and comparison with the simulations. The experimental verification of the theoretical findings was carried out to understand vehicle performance and behaviours. One of the means of obtaining information about the modes and operation of cars is from the CAN messages, also known as CAN frames. This article compared the simulated and measured results, keeping the simulation results as the benchmark. Figure 11, Figure 12 and Figure 13 show some of the experimental and simulation results. From the experimental results, we can validate and determine the effectiveness of our design. This, however, makes it easy for researchers and engineers to use the data for further modeling and improvement in vehicle parameters such as battery capacity, motor size, and energy consumption. The analysis and interpretation of the experimental and simulation results are presented in detail in Section 4.

4. Discussion

The tests conducted using HWFET and WLTP input profiles based on a PMSM rear-wheel traction machine are presented in Figure 8a,b. WLTP is the standard drive cycle used for conventional vehicles with ICEs to determine the emission level of hybrid or pure electric cars. In hybrid cases, the test is usually conducted to ascertain fuel consumption. This research evaluates fuel economy and the energy consumption per 100 km traveled by the designed car, achieving a maximum speed of 45 km/h in 180 s.
Simultaneously, the vehicle was tested at a top speed of 80 km/h in the case of the HWFET drive cycle in 180 s. The results explored through MATLAB simulation reveal the proposed controller’s promising potential in tracking the vehicle trajectory in both cases. The electrical and mechanical power are illustrated in Figure 8c, being approximately 52 kW and 47.4 kW, respectively. However, the only usable power in the engine during this test was 20 kW, as shown in Figure 9d.
The corresponding mechanical and electrical energy of the system is shown in Figure 8a. The small gap between the plots represents the energy lost in transmission from the energy supply system, i.e., the battery, to the motor. The enegy and power density of the Nissan Leaf battery pack were 140 Wh/kg and 2.5 kW/kg, respectively. The energy consumed per 1 km travelled by the vehicle was approximately 0.22 kWh, shown in Figure 8a. The simulated current of the Nissan Leaf battery was 150 A due to the WLTP test procedure, depicted in Figure 9b and Figure 10b for both pure and hybrid versions of the vehicle. In the case of the hybrid car, the battery current was 150 A during acceleration and −150 A during deceleration. In contrast, for the pure electric, the battery current was 150 A during the acceleration and −90 A during the deceleration.
The motor torque is shown in Figure 10a during the four-quadrant operation of the e-motor. Positive and negative torque or power are due to the motoring and generation action of the e-motor. When the vehicle accelerates, the motor operates in the first quadrant, and its speed and torque are both positive. Consequently, the motor converts electrical energy into mechanical rotational motion, supporting the vehicle’s movement. When the car decelerates, the motor acts as a generator and converts the mechanical energy into electrical energy, opposing the vehicle’s motion. However, the speed–torque envelope of the e-motor demonstrates an excellent performance as it has static characteristics shown in Figure 9c, known as the contour plot of the PMSM. The yellow color indicates low loss and high efficiency of the PMSM. However, the constant power of the motor in Figure 9c over a range of speeds proves the promising potential of our proposed motor for EV applications.
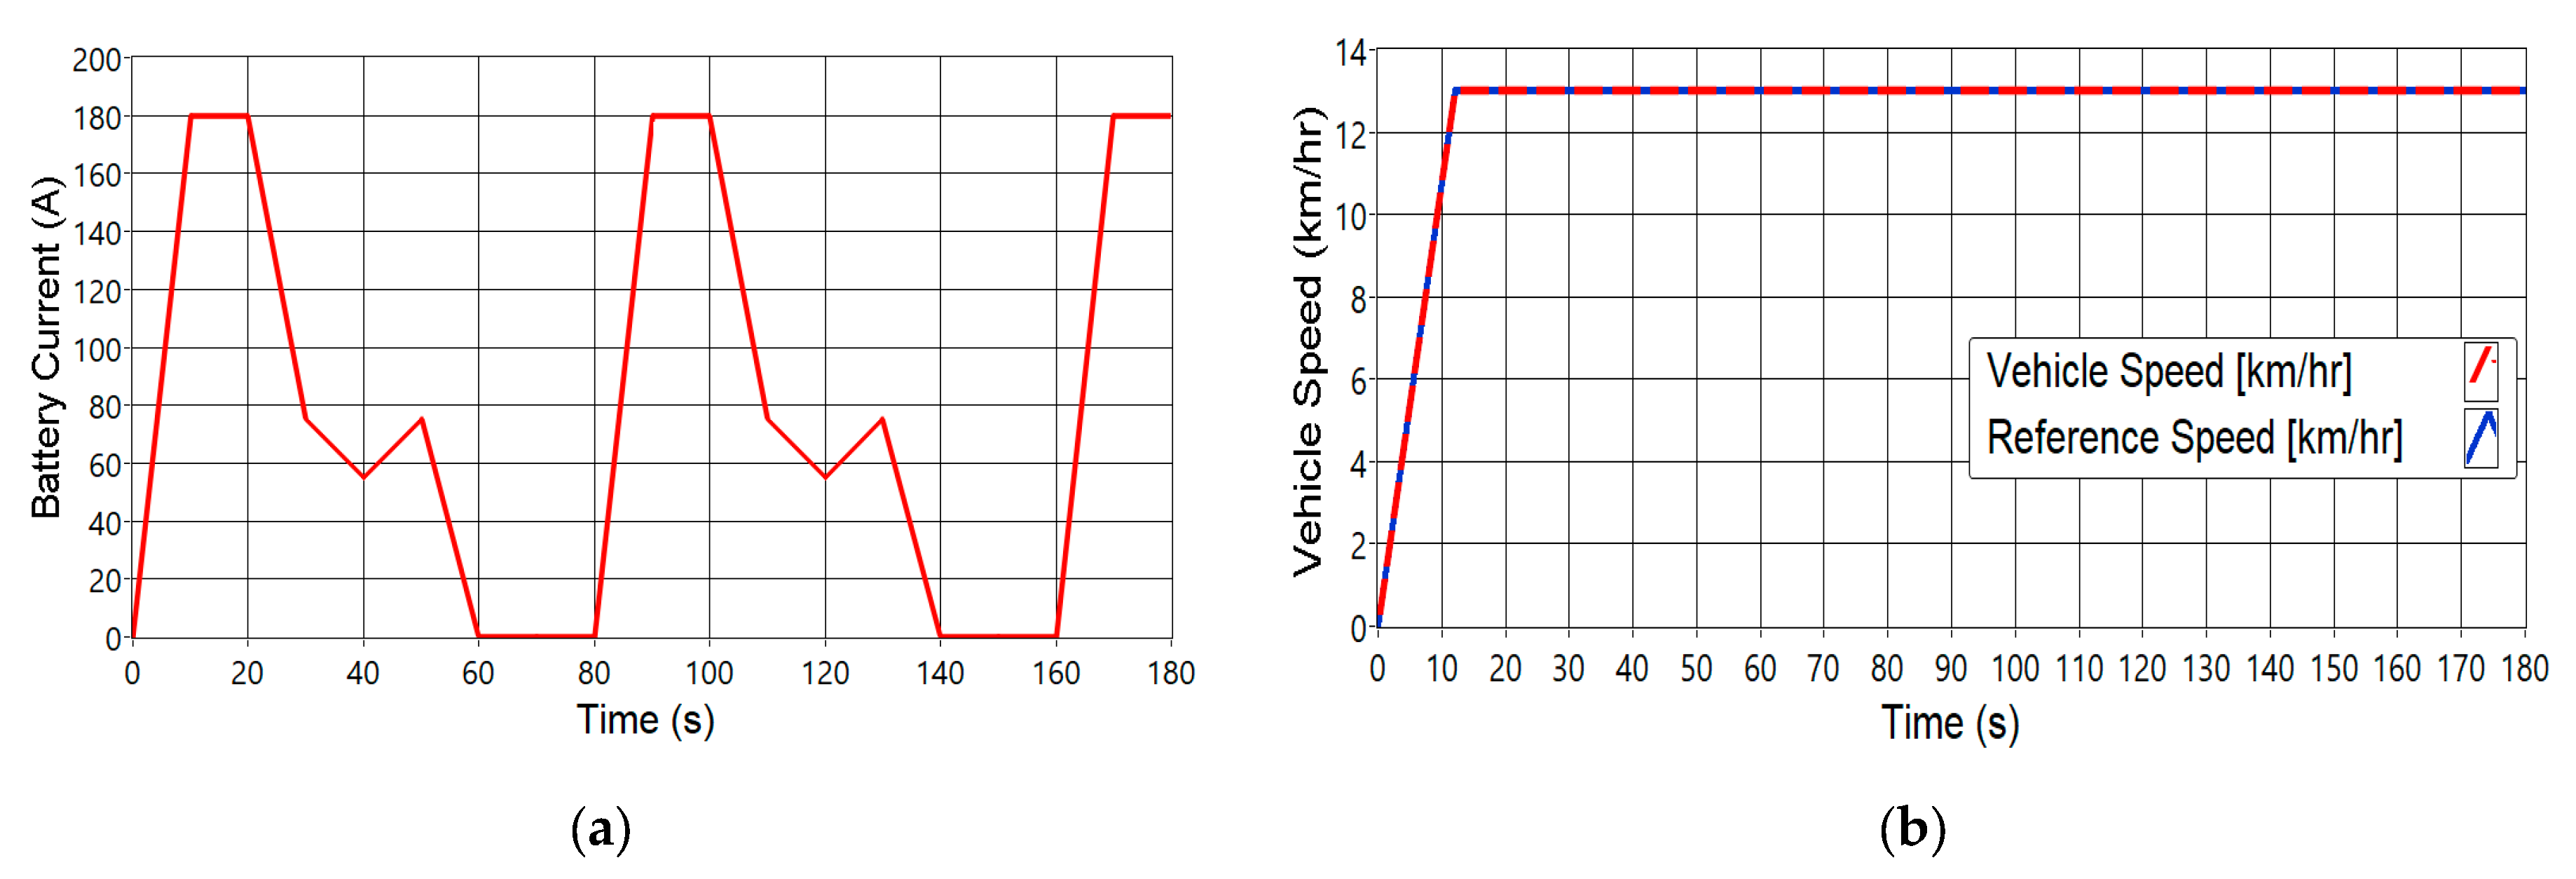
The experiment was conducted at the Department of Mechatronics Engineering, the University of Debrecen. Three scenarios were considered: the first and the second were when the vehicle was in the charging mode and when it was discharging, respectively. The data were collected based on these scenarios, and no information regarding energy consumption was recorded. The third condition involved conducting a field test. However, only a top speed of 20 km/h is permitted for the actual vehicle. The vehicle was tested at a speed of 13 km/h, as shown in Figure 13c, at Dakar Ring, Hajdúhadház, Hungary. The DAQ system implemented in this article worked effectively, but a more flexible approach would be needed to assess the vehicle’s performance from the engine control unit via CAN Bus analysis. Additionally, the error frames received during decoding messages make it difficult to identify all the data on the CAN network.
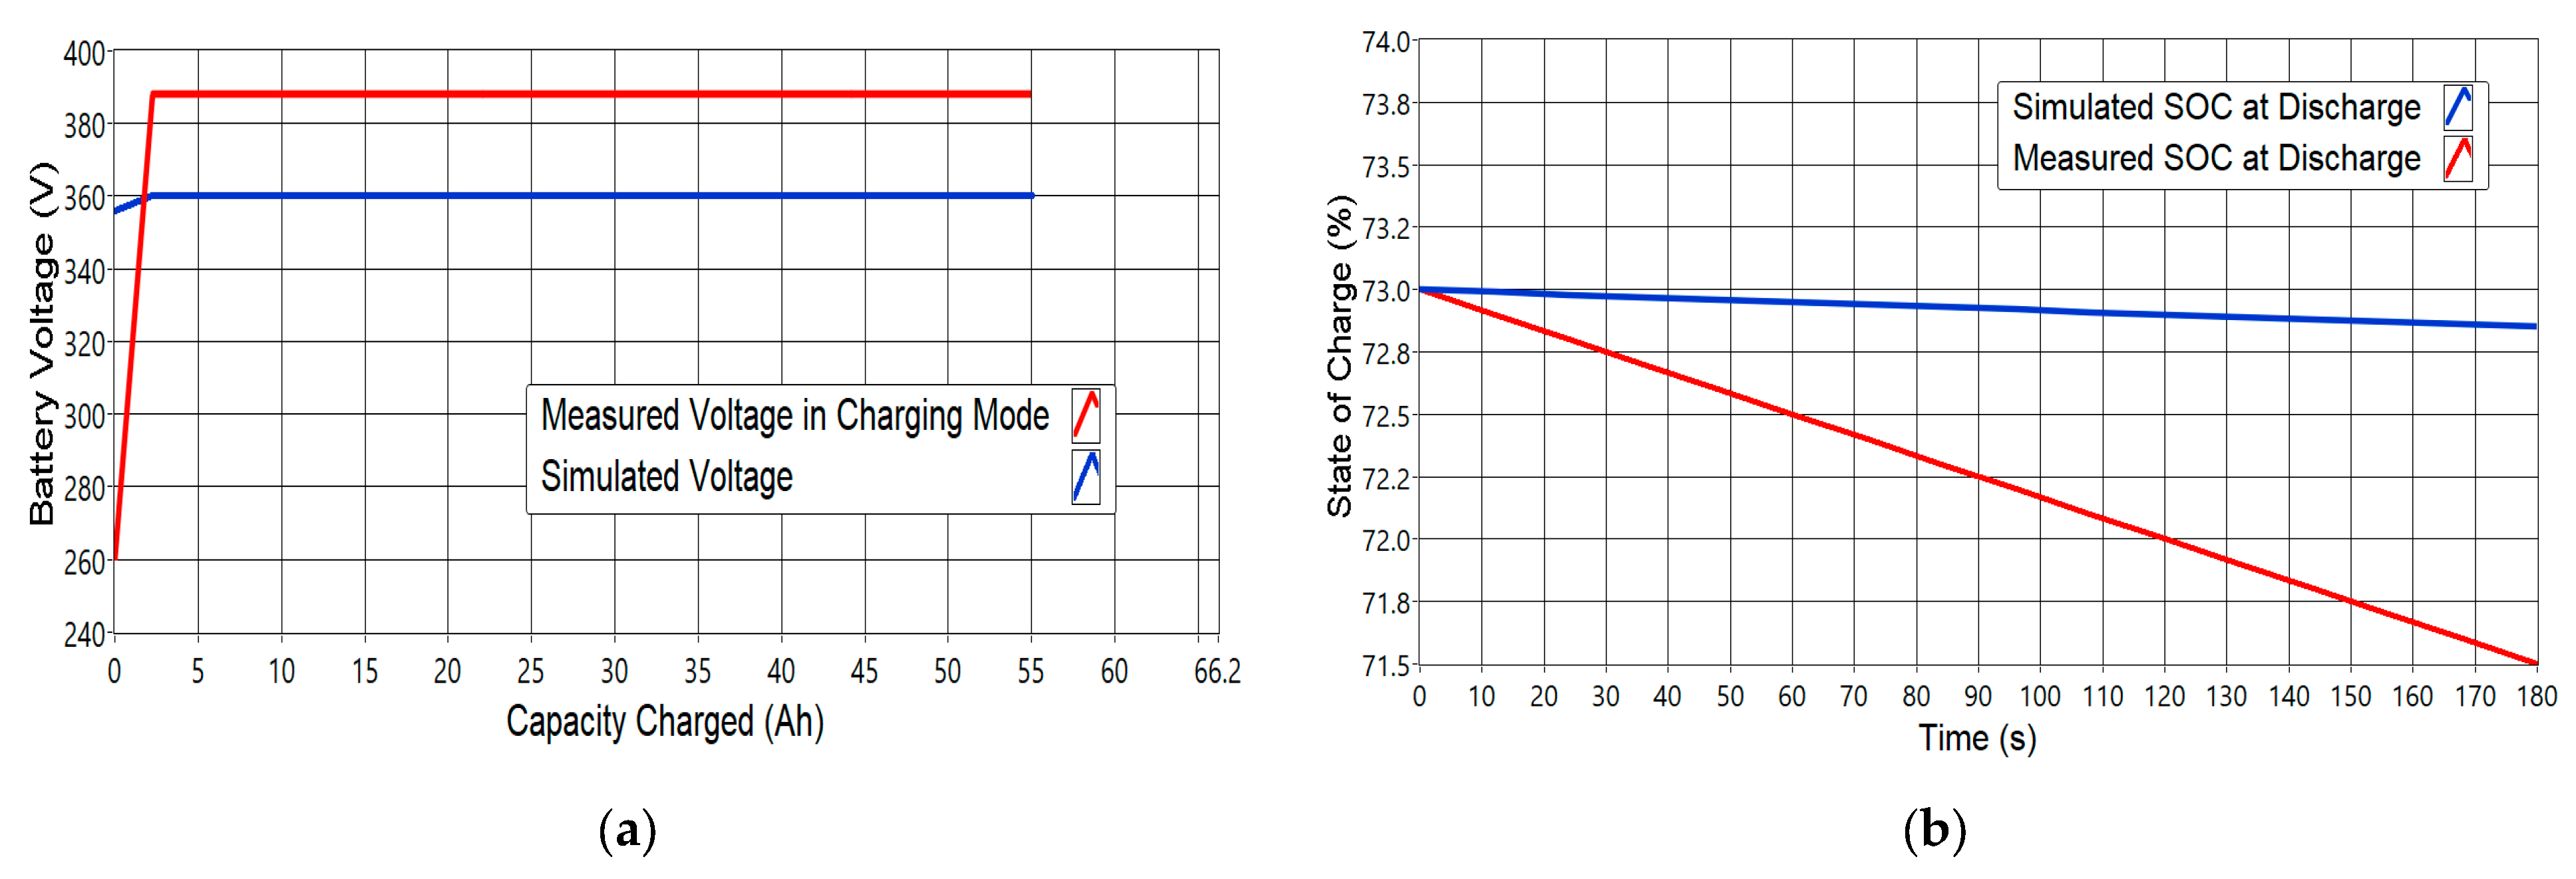
The vehicle’s measured voltage while charging increased from 260 V to 388 V. For the simulation, the battery’s nominal voltage was at 360 V and steady within 180 s. The charged capacity of the battery was 55 Ah when the Leaf battery increased to 388 V, which is 11.2 Ah away from reaching the peak capacity of 66.2 Ah at the maximum voltage of 403.2 V. The physical engineering CAN data were calculated using low- and high-byte values in the 1st and 2nd bytes of the CAN Bus frame of the corresponding CAN ID. To obtain the actual measured voltage, we added the low byte and the high byte because the CAN Bus message comprises 8-bit data; 16-bit data are calculated using the low byte and high byte. The high byte, which is 1, is an 8-bit value multiplied by the highest value of the low byte, which is 255. In this way, we decoded the raw CAN data from the hexadecimal into engineering values with the help of the CAN DBC file. However, significant differences were noted between the simulated and measured voltages and the SOC. This means that the experimental results are not optimal, while the simulation results, used as a benchmark, are optimal and can be used to perform system identification to manage our actual vehicle power and energy level.
The measured and simulated battery SOC were 71.5% and 72.5% at 180 s, respectively, as shown in Figure 11b. The simulated SOC started at the same initial SOC of the actual vehicle, which was 73%. The same applies to the battery capacity in Figure 12a. In this situation, the vehicle was in discharging mode to compare the simulated and measured results. Moreover, the measured maximum battery current of the Nissan Leaf battery for the car was 180 A, as shown in Figure 13a. A Leaf battery cell can draw up to 90 A, and the total current of the pack is simulated to be 180 A. This showed that our Nissan Leaf battery was drawing its maximum current during the charging mode. During the field test, the vehicle was first tested at 13 km/h, and the PI controller in MATLAB/Simulink software (MATLAB R2021b, MathWorks, Natic, MA, USA) controlled its simulated speed. The result of the test is shown in Figure 13b. The simulation results show an increase in battery consumption since vehicle consumption depends on the battery as the energy source. In the discharging mode, the initial and measured current capacities of the Leaf battery were 55 Ah and 53.5 Ah, respectively. Then, the remaining battery capacity would be 23.34 kWh. Therefore, for the simulation, the initial and final current capacities were 55 Ah and 54.7 Ah, respectively. Then, the remaining energy capacity would be 23.87 kWh. Therefore, for the simulation, the battery stored more energy out of its total energy capacity. With the simulation, through a system identification, the Nissan Leaf battery in our VW Crafter could be improved to over 8 years and range of up to more than 135 km.
The fuel consumption was assessed in Liter/100 km, km/Liter, Mile Per Gallon (MPG), and Total Fuel Used (TFU) in liters (L). The diesel engine is a TDI CR, 2.0 L. The fuel consumption was approximately 2.8 L/100 km and 36 km/L. The enhanced PI controller has demonstrated good tracking capability for vehicle-speed-based WLTP and highway profiles. The system’s uncertainties, coupled with the issue of nonlinearities and parameter variations, originate from operating conditions like temperatures, humidity, and other considerable factors. They could significantly affect the performance of the controller in this research. The designed PI controller was set based on the performance matrices obtained by taking several experiments until optimized gains were realized. The system was stabilized with several iterations, and the minimum values (close to zero) of these performance indices were computed iteratively. These errors are based on the codes obtained from the mathematical formulations of the integral square error according to disturbance rejection and system robustness of the proposed PI controller [73]. IAE is the integral absolute error, ITAE is the integral time absolute error, ISE is the integral square error, and ITSE is the integral time squared absolute error used for this purpose.
However, the results presented in Table 5, Table 6 and Table 7 were analyzed on the basis of these indices. The aim was to keep them as close to zero as possible to achieve an optimized system performance in our vehicle. Similar to commonly used control response criteria, such as settling time, the results based on these performance indices were analyzed with respect to the PI controller parameters. With ISE, a frequent faster response would be achieved. An ITAE value of 8.1543 10 5 significantly improved the system response’s overshoot at controller gains of 2000 and 700, as presented in Table 5. The optimal fuel and energy at these gains were 2.769 L/100 km and 22.09 kWh/100 km, respectively, while the consumed fuel was 84.94 MPG.
The IAE value alone cannot be used to assess the vehicle performance, due to its slower response but less oscillation in the response compared to ISE and ITSE. Therefore, the average experimental fuel consumption of the conventional VW Crafter was 10.1 L/100 km, and consumption in MPG was 28. The experimental results of the VW Crafter manufactured in 2018 showed a fuel consumption of 10.8 L/100 km and 26 MPG. As proposed in this research, the simulated results demonstrated a significant conversion of the conventional VW Crafter to a hybrid because of the drastic reduction in fuel consumption.
Briefly, the results presented in Table 5, Table 6 and Table 7 represent the optimal consumption of the pure and hybrid versions of the vehicle at different levels of the driver input. As the gains of the controller changed, the energy value continued changing from 22.09 to 22.07 kWh/200 km in the case of the hybrid vehicle. The energy consumption increased when the vehicle operated in electric mode, as presented in Table 5 and Table 6, because the battery was the sole energy source in this mode. A manual tunning approach was applied to iteratively compute the performance indices for the controller to realize optimal fuel economy. Using GA to predict an optimal tracking of the control algorithm iteratively took longer than expected owing to the complexity of the system, which is not presented in this article. Therefore, future studies will consider more simplified models, and the Bacterial Memetic Algorithm (BMA) could be suitable for realizing the optimized efficiency of the designed vehicle.

5. Conclusions

In this paper, an optimal control design was carried out based on the mathematical background description of the VW Crafter vehicle, introducing a new methodology for vehicle data analysis, particularly in the field of electric vehicle engineering. The vehicle controller was designed on the basis of an enhanced PI control algorithm to meet the potential requirements of the anticipated robustness and fast response tracking capability. The development and evaluation of the PI controller were conducted using integral cost functions. Following the hybrid conversion of the vehicle, an HIL method was implemented to acquire the vehicle CAN Bus data. The experimental and simulation results were compared. Furthermore, the enhanced PI controller was developed to seek an optimal solution for fuel economy. This was achieved by compensating for disturbances from the motor and external environment, along with model uncertainties and nonlinearities inherent in the vehicle system. Consequently, the optimal tracking accuracy of the controller demonstrated through the simulation would significantly contribute to obtaining our vehicle’s optimized parameters through system identification for further analysis.

Author Contributions

Conceptualization, A.B. and P.T.S.; methodology, A.B.; software, C.M.L.O. and A.B.; validation, A.B., P.T.S. and C.M.L.O.; formal analysis, A.B.; investigation, A.B.; resources, P.T.S.; data curation, C.M.L.O.; writing—original draft preparation, A.B.; writing—review and editing, A.B.; visualization, C.M.L.O.; supervision, P.T.S.; project administration, P.T.S.; funding acquisition, P.T.S. All authors have read and agreed to the published version of the manuscript.

Funding

This research was funded by the TKP2020-NKA-04 project implemented with support from Hungary’s National Research, Development, and Innovation Fund, financed under the 2020-4.1.1-TKP202020 funding scheme. Therefore, the authors wish to thank the help of the Hungarian Research Fund (OTKA K143595).

Data Availability Statement

Not applicable.

Acknowledgments

The authors wish to acknowledge the support of the TKP2020-NKA-04 project implemented with support from Hungary’s National Research, Development, and Innovation Fund, financed under the 2020-4.1.1-TKP202020 funding scheme. Therefore, the authors wish to thank the help of the Hungarian Research Fund (OTKA K143595). Aminu Babangida wishes to acknowledge Kano University of Science and Technology, Wudil-Nigeria, for its moral, spiritual, and financial support.

Conflicts of Interest

The authors declare no conflict of interest.

References

  1. Al Khoury, J.; Nader, W.B. Design and simulation of turbogenerators for series hybrid electric vehicles. Energy Convers. Manag. 2021, 236, 114078. [Google Scholar] [CrossRef]
  2. Schmid, M.; Vögele, U.; Endisch, C. A novel matrix-vector-based framework for modeling and simulation of electric vehicle battery packs. J. Energy Storage 2020, 32, 101736. [Google Scholar] [CrossRef]
  3. Maaruf, M.; Khalid, M. Global sliding-mode control with fractional-order terms for the robust optimal operation of a hybrid renewable microgrid with battery energy storage. Electronics 2022, 11, 88. [Google Scholar] [CrossRef]
  4. Maaruf, M.; Khalid, M. Hybrid Solar/PEM Fuel Cell/and Water Electrolyzer Energy System for All-Electric Ship. In Proceedings of the 2022 IEEE Kansas Power and Energy Conference (KPEC), Manhattan, KS, USA, 25–26 April 2022; pp. 1–5. [Google Scholar] [CrossRef]
  5. He, H.; Luo, J.; Peng, J.; Wu, J. Parameter Matching and Simulation Analysis of Electromechanical Coupling Device for Hybrid Electric Vehicle. Energy Procedia 2017, 105, 2329–2334. [Google Scholar] [CrossRef]
  6. Montazeri-Gh, M.; Poursamad, A.; Ghalichi, B. Application of genetic algorithm for optimization of control strategy in parallel hybrid electric vehicles. J. Frankl. Inst. 2006, 343, 420–435. [Google Scholar] [CrossRef]
  7. Gozukucuk, M.A.; Akdogan, T.; Hussain, W.; Tasooji, T.K.; Sahin, M.; Celik, M.; Ugurdag, H.F. Design and simulation of an optimal energy management strategy for plug-in electric vehicles. In Proceedings of the 2018 6th International Conference on Control Engineering and Information Technology, CEIT 2018, Istanbul, Turkey, 25–27 October 2018; pp. 25–27. [Google Scholar] [CrossRef]
  8. Van Mierlo, J.; Maggettto, G. Views on hybrid drivetrain power management strategies. In Proceedings of the EVS-17, Montreal, QC, Canada, 15–18 October 2000; Available online: http://etecnts1.vub.ac.be/etec/ (accessed on 13 February 2022).
  9. Kim, T.Y.; Lee, S.H. Combustion and Emission Characteristics of Wood Pyrolysis Oil-Butanol Blended Fuels in a Di Diesel Engine. Int. J. 2012, 13, 293–300. [Google Scholar] [CrossRef]
  10. Dlugosch, O.; Brandt, T.; Neumann, D. Combining analytics and simulation methods to assess the impact of shared, autonomous electric vehicles on sustainable urban mobility. Inf. Manag. 2020, 59, 103285. [Google Scholar] [CrossRef]
  11. Keskin, M.; Çatay, B.; Laporte, G. A simulation-based heuristic for the electric vehicle routing problem with time windows and stochastic waiting times at recharging stations. Comput. Oper. Res. 2021, 125, 105060. [Google Scholar] [CrossRef]
  12. Marmaras, C.; Xydas, E.; Cipcigan, L. Simulation of electric vehicle driver behaviour in road transport and electric power networks. Transp. Res. Part C Emerg. Technol. 2017, 80, 239–256. [Google Scholar] [CrossRef]
  13. Haitao, Y.; Yulan, Z.; Zunnian, L.; Kui, H. LQR-based power train control method design for fuel cell hybrid vehicle. Math. Probl. Eng. 2013, 2013, 968203. [Google Scholar] [CrossRef] [Green Version]
  14. Ahmed, A.; Yelamali, P.; Udayakumar, R. Modelling and simulation of hybrid technology in vehicles. Energy Rep. 2020, 6, 589–594. [Google Scholar] [CrossRef]
  15. Katrašnik, T. Analytical method to evaluate fuel consumption of hybrid electric vehicles at balanced energy content of the electric storage devices. Appl. Energy 2010, 87, 3330–3339. [Google Scholar] [CrossRef]
  16. Precup, R.-E.; Preitl, S.; Korondi, P. Fuzzy Controllers With Maximum Sensitivity for Servosystems. IEEE Trans. Ind. Electron. 2007, 54, 1298–1310. [Google Scholar] [CrossRef]
  17. Miranda, M.H.R.; Silva, F.L.; Lourenço, M.A.M.; Eckert, J.J.; Silva, L.C.A. Electric vehicle powertrain and fuzzy controller optimization using a planar dynamics simulation based on a real-world driving cycle. Energy 2022, 238, 121979. [Google Scholar] [CrossRef]
  18. Schouten, N.J.; Salman, M.A.; Kheir, N.A. Energy management strategies for parallel hybrid vehicles using fuzzy logic. Control Eng. Pract. 2003, 11, 171–177. [Google Scholar] [CrossRef]
  19. Saju, C.; Michael, P.A.; Jarin, T. Modeling and control of a hybrid electric vehicle to optimize system performance for fuel efficiency. Sustain. Energy Technol. Assess. 2022, 52, 102087. [Google Scholar] [CrossRef]
  20. Eckert, J.J.; da Silva, S.F.; de Menezes Lourenço, M.A.; Corrêa, F.C.; Silva, L.C.A.; Dedini, F.G. Energy management and gear shifting control for a hybridized vehicle to minimize gas emissions, energy consumption and battery aging. Energy Convers. Manag. 2021, 240, 114222. [Google Scholar] [CrossRef]
  21. Hasan, S.K. Fuzzy Logic Controller for Parallel Plug-in Hybrid Vehicle; University of Wisconsin Milwaukee: Milwaukee, WI, USA, 2012. [Google Scholar]
  22. Schouten, N.J.; Salman, M.A.; Kheir, N.A. Fuzzy logic control for parallel hybrid vehicles. IEEE Trans. Control Syst. Technol. 2002, 10, 460–468. [Google Scholar] [CrossRef]
  23. Halima, N.B.; Hadj, N.B.; Chaieb, M.; Neji, R. Energy Management of Parallel Hybrid Electric Vehicle Based on Fuzzy Logic Control Strategies. J. Circuits Syst. Comput. 2023, 32, 2350007. [Google Scholar] [CrossRef]
  24. Xu, E.; Wei, F.; Lin, C.; Meng, Y.; Zhu, J.; Liu, X. Model predictive control-based energy management strategy with vehicle speed prediction for hybrid electric vehicles. AIP Adv. 2022, 12, 075019. [Google Scholar] [CrossRef]
  25. Gaya, M.S.; Muhammad, A.; Abdulkadir, R.A.; Salim, S.N.S.; Madugu, I.S.; Tijjani, A.; Yusuf, L.A.; Umar, I.D.; Khairi, M.T.M. Enhanced pid vs. model predictive control applied to bldc motor. IOP Conf. Ser. Mater. Sci. Eng. 2018, 303, 012017. [Google Scholar] [CrossRef]
  26. Vu, T.M.; Moezzi, R.; Cyrus, J.; Hlava, J.; Petru, M. Parallel hybrid electric vehicle modelling and model predictive control. Appl. Sci. 2021, 11, 10668. [Google Scholar] [CrossRef]
  27. Zhou, Q.; Du, C. A quantitative analysis of model predictive control as energy management strategy for hybrid electric vehicles: A review. Energy Rep. 2021, 7, 6733–6755. [Google Scholar] [CrossRef]
  28. Hu, X.L.X.; Zhang, X.; Tang, X. Model predictive control of hybrid electric vehicles for fuel economy, emission reductions, and inter-vehicle safety in car-following scenarios, Energy. Energy 2020, 196, 117101. [Google Scholar] [CrossRef]
  29. Millo, F.; Rolando, L.; Tresca, L.; Pulvirenti, L. Development of a neural network-based energy management system for a plug-in hybrid electric vehicle. Transp. Eng. 2023, 11, 100156. [Google Scholar] [CrossRef]
  30. Chen, Z.; Mi, C.C.; Xu, J.; Gong, X.; You, C. Energy Management for a Power-Split Plug-in Hybrid Electric Vehicle Based on Dynamic Programming and Neural Networks. IEEE Trans. Veh. Technol. 2013, 63, 1567–1580. [Google Scholar] [CrossRef]
  31. Cipek, M.; Pavković, D.; Petrić, J.Š. A control-oriented simulation model of a power-split hybrid electric vehicle. Appl. Energy 2013, 101, 121–133. [Google Scholar] [CrossRef]
  32. Alegre, S.; Míguez, J.V.; Carpio, J. Modelling of electric and parallel-hybrid electric vehicle using Matlab/Simulink environment and planning of charging stations through a geographic information system and genetic algorithms. Renew. Sustain. Energy Rev. 2017, 74, 1020–1027. [Google Scholar] [CrossRef]
  33. Zhang, J.; Yang, Y.; Hu, M.; Yang, Z.; Fu, C. Longitudinal–vertical comprehensive control for four-wheel drive pure electric vehicle considering energy recovery and ride comfort. Energy 2021, 236, 121417. [Google Scholar] [CrossRef]
  34. Mackanic, D.; Marquez, E.D.; Dennington, J.; McClean, J.; Wheeler, K.; Nelson, D. Development of a Software-in-the-Loop Model for a Parallel Plug-in Hybrid Electric Vehicle. SAE Tech. Pap. 2016. [Google Scholar] [CrossRef]
  35. Bartolini, C.; Lipari, G.; Almeida, L. Using Priority Inheritance techniques to override the size limit of CAN messages. IFAC Proc. Vol. 2007, 7, 127–134. [Google Scholar] [CrossRef] [Green Version]
  36. Tindell, K.W.; Hansson, H.; Wellings, A.J. Analyzing real-time communications: Controller area network (CAN). In Proceedings of the 1994 Proceedings Real-Time Systems Symposium, San Juan, PR, USA, 7–9 December 1994; pp. 259–263. [Google Scholar] [CrossRef]
  37. De Andrade, R.; Hodel, K.N.; Justo, J.F.; Laganá, A.M.; Santos, M.M.; Gu, Z. Analytical and Experimental Performance Evaluations of CAN-FD Bus. IEEE Access 2018, 6, 21287–21295. [Google Scholar] [CrossRef]
  38. Ruta, M.; Scioscia, F.; Gramegna, F.; Di Sciascio, E. A mobile knowledge-based system for on-board diagnostics and car driving assistance. In Proceedings of the UBICOMM 2010—4th International Conference on Mobile Ubiquitous Computing, Systems, Services and Technologies, Florence, Italy, 25–30 October 2010; pp. 91–96. [Google Scholar]
  39. Moniaga, J.V.; Manalu, S.R.; Hadipurnawan, D.A.; Sahidi, F. Diagnostics vehicle’s condition using obd-ii and raspberry pi technology: Study literature. J. Phys. Conf. Ser. 2018, 978, 012011. [Google Scholar] [CrossRef]
  40. Kushiro, N.; Oniduka, Y.; Sakurai, Y. Initial Practice of Telematics-Based Prognostics for Commercial Vehicles: Analysis Tool for Building Faults Progress Model for Trucks on Telematics Data. Procedia Comput. Sci. 2017, 112, 2155–2164. [Google Scholar] [CrossRef]
  41. Yadav, A.; Bose, G.; Bhange, R.; Kapoor, K.; Iyengar, N.C.S.N.; Caytiles, R.D. Security, vulnerability and protection of vehicular on-board diagnostics. Int. J. Secur. Appl. 2016, 10, 405–422. [Google Scholar] [CrossRef]
  42. Gilman, E.; Keskinarkaus, A.; Tamminen, S.; Pirttikangas, S.; Röning, J.; Riekki, J. Personalized assistance for fuel-efficient driving. Transp. Res. Part C Emerg. Technol. 2015, 58, 681–705. [Google Scholar] [CrossRef] [Green Version]
  43. Rajput, P.; Parekh, R. On-Board Diagnostics based remote emission test for Light Motor Vehicles. In Proceedings of the CONECCT 2020–6th IEEE International Conference on Electronics, Computing and Communication Technologies, Online, 2–4 July 2020. [Google Scholar] [CrossRef]
  44. Malekian, R.; Moloisane, N.R.; Nair, L.; Maharaj, B.T.; Chude-Okonkwo, U.A.K. Design and Implementation of a Wireless OBD II Fleet Management System. IEEE Sens. J. 2017, 17, 1154–1164. [Google Scholar] [CrossRef] [Green Version]
  45. D’Agostino, M.; Naddeo, M.; Rizzo, G. Development and validation of a model to detect active gear via OBD data for a Through-The-Road Hybrid Electric Vehicle. IFAC Proc. Vol. 2014, 19, 6618–6623. [Google Scholar] [CrossRef]
  46. Pan, J.S.; Snasel, V.; Corchado, E.S.; Abraham, A.; Wang, S.L. Preface. Adv. Intell. Syst. Comput. 2014, 297, 2014. [Google Scholar] [CrossRef]
  47. Kim, H.S.; Jang, S.J.; Jang, J.W. A study on development of engine fault diagnostic system. Math. Probl. Eng. 2015, 2015, 271374. [Google Scholar] [CrossRef] [Green Version]
  48. Rimpas, D.; Papadakis, A.; Samarakou, M. OBD-II sensor diagnostics for monitoring vehicle operation and consumption. Energy Rep. 2020, 6, 55–63. [Google Scholar] [CrossRef]
  49. Fonseca, H.; Ferreira, C.; Fernandes, T. New Methodologies To Measure in Real Time Fuel Consumption of Internal Combustion Engines. In Proceedings of the 15th International Conference on Experimental Mechanics, Porto, Portugal, 22–27 July 2012; pp. 1–8. [Google Scholar]
  50. Balcı, Ö.; Karagöz, Y.; Gezer, O.; Kale, S.; Köten, H.; Pusat, S.; Yüksek, L. Numerical and experimental investigation of fuel consumption and CO2 emission performance for a parallel hybrid vehicle. Alex. Eng. J. 2021, 60, 3649–3667. [Google Scholar] [CrossRef]
  51. Sik, D.; Balogh, T.; Ekler, P.; Lengyel, L. Comparing OBD and CAN Sampling on the go with the SensorHUB Framework. Procedia Eng. 2016, 168, 39–42. [Google Scholar] [CrossRef]
  52. Li, H.; Saldivar-Carranza, E.; Mathew, J.K.; Kim, W.; Desai, J.; Wells, T.; Bullock, D.M. Extraction of Vehicle CAN Bus Data for Roadway Condition Monitoring; Purdue University: West Lafayette, IN, USA, 2020. [Google Scholar] [CrossRef]
  53. Mattetti, M.; Maraldi, M.; Lenzini, N.; Fiorati, S.; Sereni, E.; Molari, G. Outlining the mission profile of agricultural tractors through CAN-BUS data analytics. Comput. Electron. Agric. 2021, 184, 106078. [Google Scholar] [CrossRef]
  54. Mocera, F. A Model-Based Design Approach for a Parallel Hybrid Electric Tractor Energy Management Strategy Using Hardware in the Loop Technique. Vehicles 2021, 3, 1–19. [Google Scholar] [CrossRef]
  55. Szalay, Z.; Kánya, Z.; Lengyel, L.; Ekler, P.; Ujj, T.; Balogh, T.; Charaf, H. ICT in road vehicles—Reliable vehicle sensor information from OBD versus CAN. In Proceedings of the 2015 International Conference on Models and Technologies for Intelligent Transportation Systems, MT-ITS 2015, Budapest, Hungary, 3–5 June 2015; pp. 469–476. [Google Scholar] [CrossRef]
  56. Aguilar-Alvarez, P.; Valencia-Palomo, G.; López-Estrada, F.-R.; Zepeda-Hernández, J.Á.; López-Pérez, M.-D.-J.; Santos-Ruiz, I.; García-Ramos, O.-Y. Instrumentation and Dynamic Characterization of a Commercial Electric Vehicle for Rural Public Transport. IEEE Access 2023, 11, 12639–12647. [Google Scholar] [CrossRef]
  57. Bodzás, S.; Tiba, Z.; Ailer, P.; Husi, G. Redesign of a Volkswagen Crafter vehicle to a hybrid vehicle having e-motor and diesel engine. IOP Conf. Ser. Mater. Sci. Eng. 2022, 1237, 012008. [Google Scholar] [CrossRef]
  58. Minh, V.T.; Moezzi, R.; Cyrus, J.; Hlava, J. Optimal Fuel Consumption Modelling, Simulation, and Analysis for Hybrid Electric Vehicles. Appl. Syst. Innov. 2022, 5, 36. [Google Scholar] [CrossRef]
  59. Babangida, A.; Szemes, P.T. Electric Vehicle Modelling and Simulation of a Light Commercial Vehicle Using PMSM Propulsion. Hung. J. Ind. Chem. 2021, 49, 37–46. [Google Scholar] [CrossRef]
  60. Babangida, A.; Szemes, P.T. Energy Consumption Simulation and Economic Benefit Analysis for a Light Duty Urban Commercial Electric Vehicle. In Proceedings of the IEEE 20th International Power Electronics and Motion Control Conference (PEMC), Brasov, Romania, 25–28 September 2022; pp. 667–672. [Google Scholar] [CrossRef]
  61. Du, G.; Member, S.; Cao, W.; Member, S.; Hu, S. Assessment of an Electric Vehicle Powertrain Model Based on Real-World Driving and Charging Cycles. IEEE Trans. Veh. Technol. 2018, 68, 1178–1187. [Google Scholar] [CrossRef] [Green Version]
  62. Pappalardo, C.M.; Lombardi, N.; Dašić, P.V.; Guida, D. Design and development of a virtual model of an electric vehicle of category L7. IOP Conf. Ser. Mater. Sci. Eng. 2019, 568, 012114. [Google Scholar] [CrossRef]
  63. Saleem, A.; Iqbal, A. Calculation Along with Factors Affecting the Total Tractive Power and Energy Demand. In Proceedings of the 3rd International Conference on Computing, Mathematics and Engineering Technologies: Idea to Innovation for Building the Knowledge Economy, iCoMET 2020, Sukkur, Pakistan, 29–30 January 2020. [Google Scholar]
  64. Pacejka, H.B. Tire and Vehicle Dynamics; Elsevier Scinence: Amsterdam, The Netherlands, 2005. [Google Scholar]
  65. Norbakyah, J.S.; Daniel, H.W.C.; Atiq, W.H.; Daud, M.Z.; Salisa, A.R. Modeling, simulation and model optimization of internal combustion engine for PHERB powertrain. J. Teknol. 2017, 79, 161–173. [Google Scholar] [CrossRef] [Green Version]
  66. Han, W. Simulation Model Development of Electric Motor and Controller; Chalmers University of Technology: Goteborg, Sweden, 2017; pp. 1–73. [Google Scholar]
  67. Virani, V.P.; Arya, S.; Baria, J. Modelling and Control of PMSM Drive by Field Oriented Control For HEV. SSRN Electron. J. 2019, 1–11. [Google Scholar] [CrossRef]
  68. Espina, J.; Arias, A.; Balcells, J.; Ortega, C. Speed anti-windup PI strategies review for field oriented control of permanent magnet synchronous machines. In Proceedings of the CPE 2009—6th International Conference-Workshop—Compatability and Power Electronics, Badajoz, Spain, 20–22 May 2009; pp. 279–285. [Google Scholar] [CrossRef] [Green Version]
  69. Zarour, L.; Chenni, R.; Borni, A.; Bouzid, A. Improvement of synchronous and asynchronous motor drive systems supplied by photovoltaic arrays with frequency control. J. Electr. Eng. 2008, 59, 169–177. [Google Scholar]
  70. Ito, I. Battery Electric Vehiclle Model in Simscape. Available online: https://githumb.com/mathworks/Simscape-Battery-Electric-VehicleModel/releases/tag/1.0.0 (accessed on 1 January 2021).
  71. Khaled, N. Hybrid Electric Vehicle (HEV) Model for a Passenger Car. 2022. Available online: https://www.mathworks.com/matlabcentral/fileexchange/75226-hybrid-electric-vehicle-hev-model-for-a-passenger-car (accessed on 10 December 2022).
  72. Simscape Powertrain Spark Ignition Model. Available online: https://github.com/maybachy1121/Simscape-Powertrain-SI-Model/find/master (accessed on 10 December 2022).
  73. Tan, W.; Marquez, H.J.; Chen, T. Performance assessment of PID controllers. Control Intell. Syst. 2004, 32, 158–166. [Google Scholar] [CrossRef] [Green Version]
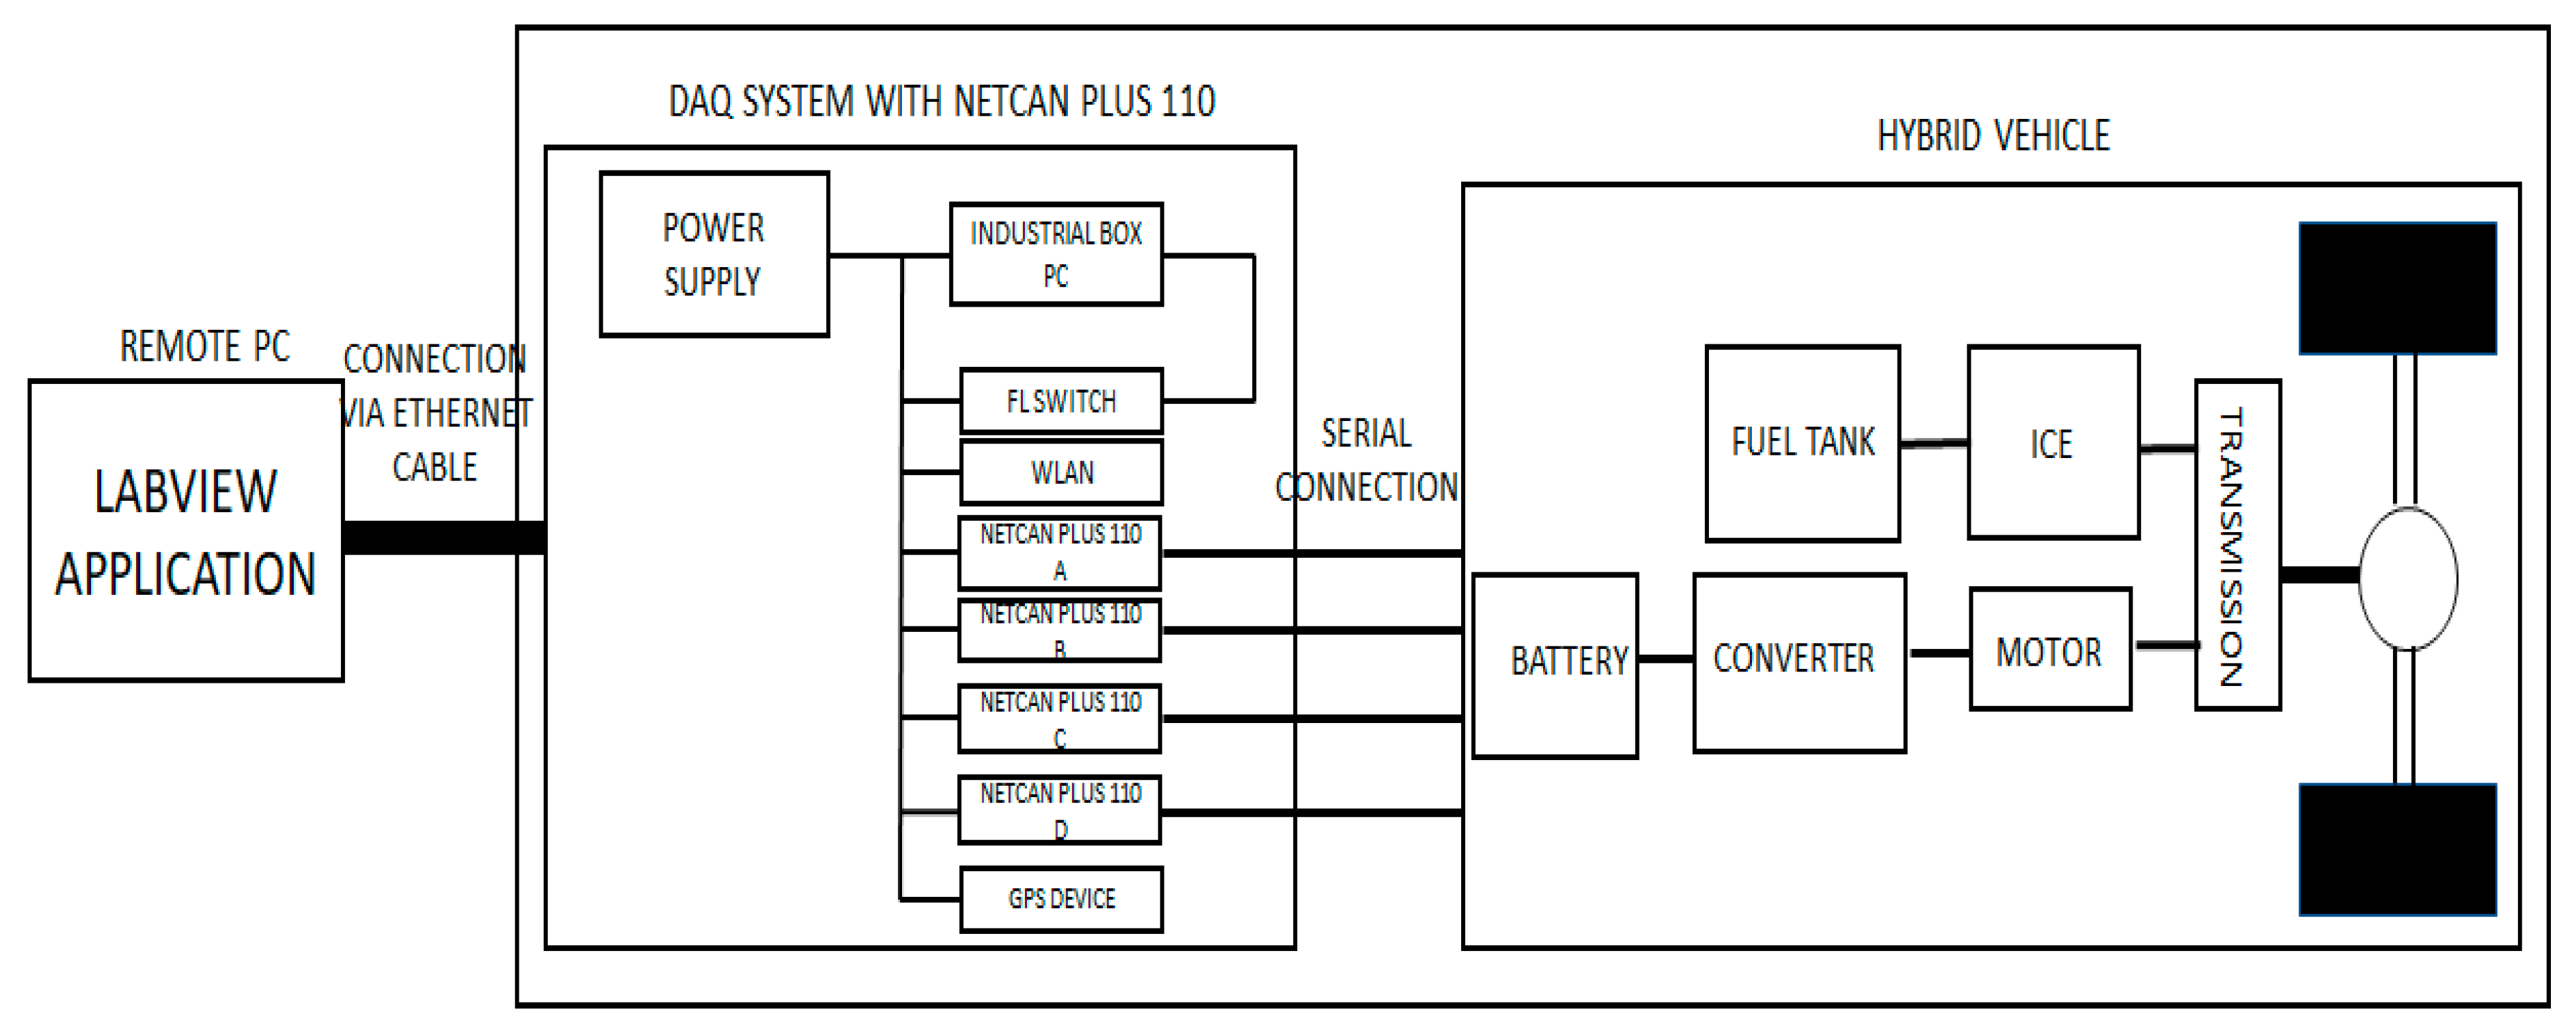
Figure 1. HEV configuration with DAQ system.
Mathematics 11 03436 g001
Figure 2. Vehicle dynamics system [62].
Mathematics 11 03436 g002
Figure 3. Three-dimensional simulation of the gearbox: (a) enclosed and (b) opened [57].
Mathematics 11 03436 g003
Figure 4. Transformed hybrid model with new gearbox.
Mathematics 11 03436 g004
Figure 5. Pure e-Crafter MATLAB model.
Mathematics 11 03436 g005
Figure 6. MATLAB model of the hybrid model.
Mathematics 11 03436 g006
Figure 7. Experimental set-up: (a) the hardware connection of the enclosed box seen on the vehicle; (b) the part of the vehicle containing the electrical part and the hardware connection in the enclosed box for the Net CAN Plus 110; and (c) the laptop connected to the vehicle with NI LabVIEW running for reading the CAN Bus messages.
Mathematics 11 03436 g007
Figure 8. (a) The vehicle speed due to the WLTP cycles test. (b) The vehicle speed due to the highway test profile. (c) The motor and the Nissan Leaf battery power consumed for the hybrid vehicle. The small space between the motor and the battery power indicates a small loss in power transmission from the Nissan Leaf battery to the e-motor.
Mathematics 11 03436 g008
Figure 9. (a) The motor and the battery energy consumption per unit distance traveled from the WLTP drive cycle test for the hybrid vehicle. (b) The simulated Nissan leaf current from the WLTP drive cycle test for the hybrid vehicle. (c) The static characteristics of the PMSM for the pure e-Crafter. (d) The ICE consumed power.
Mathematics 11 03436 g009
Figure 10. (a) The motor torque originating from the pure e-Crafter. (b) The Nissan Leaf battery current originated from the pure e-Crafter.
Mathematics 11 03436 g010
Figure 11. (a) The simulated and measured voltages plotted against the battery capacity in Ah of the battery when the vehicle was in charging mode. (b) The simulated and measured battery state of the charge (SOC) when the car was discharging plotted against the time.
Mathematics 11 03436 g011
Figure 12. (a) The measured and simulated capacity when the vehicle was discharging. (b) The measured and simulated voltages plotted against the SOC when the vehicle was in charging mode.
Mathematics 11 03436 g012
Figure 13. (a) The measured Nissan Leaf current plotted against time. (b) The vehicle’s reference and actual speeds (13 km/h) controlled by the PI algorithm from the MATLAB software (MATLAB R2021b, MathWorks, Natic, MA, USA).
Mathematics 11 03436 g013
Table 1. Tire specification based on the characteristics equation [64].
SurfaceBCDE
Ice420.11
Snow520.31
Wet tarmac122.30.821
Dry tarmac101.910.97
Table 2. Three-phase PMSM specification [70].
ParametersValues
Stator resistance (R)0.07 Ohm
d-axis Inductance ( L d )0.0013 H
q-axis Inductance ( L q )0.0039 H
Rotor Flux (Vs)0.1447 Weber
Pole Pairs4
Sample time (T)2 × 10⁻⁶ s
Table 3. PMSM specification based on the peak and rated values.
ParametersSpecifications
Peak/Rated Power 82.3/53.5 kW
Peak/Rated Torque173/78.6 Nm
Peak/Rated RPM8000/6500 rpm
Time Constant0.02 s
Series Resistance0
Rotor Inertia3.90 × 10−4 kg/m2
Rotor Damping1 × 10−5 Nm/(rad/s)
Table 4. Gear initial parameters [57].
Diameters, d (mm) Axial Module, m (mm) Number of Teeth, z Gear Ratio, i
d1 2.25 26 1.54
d2 2.25 40
d3 2.5 20 3.4
d4 2.5 68
d5 3 18 2.33
d6 3 42
i = 12.22
Table 5. Battery energy consumption for the HEV and the computed objective functions.
Vehicle
Controller
Speed Ref.Performance IndicesEnergy Economy (kWh/100 km)
K p K i IAEISEITAEITSE
15002000WLTP0.0887 3.9468 10 4 0.85530.003722.07
20002000WLTP0.0780 3.0490 10 4 0.76700.002922.08
20001500WLTP0.0574 1.6524 10 5 0.56690.001622.07
1000600WLTP0.0029 5.9647 10 7 0.0368 8.6933 10 6 22.09
2000700WLTP0.09180.0403 8.1543 10 5 8.0297 10 4 22.09
Table 6. Battery energy consumption for the pure e-Crafter and the computed objective functions.
Vehicle
Controller
Speed Ref.Performance IndicesEnergy Economy (kWh/100 km)
𝐾𝑝𝐾𝑖 IAEISEITAEITSE
700800WLTP0.37530.00713.65930.067022.75
700600WLTP0.42430.00904.13540.085622.76
600500WLTP0.49070.01214.78290.114522.77
1000800WLTP0.31060.00483.03810.046222.74
20001000WLTP0.1387 9.6148 10 4 1.37390.009422.73
Table 7. Fuel economy for the HEV Crafter.
K p K i Drive Cycle (km/h)L/100 kmkm/LMPGTFU (L)
15002000WLTP2.76936.1184.950.02476
20002000WLTP2.76936.1284.950.02476
20001500WLTP2.76936.1184.930.02476
1000600WLTP2.77436.0584.790.0248
2000700WLTP2.76936.1184.940.02476
Disclaimer/Publisher’s Note: The statements, opinions and data contained in all publications are solely those of the individual author(s) and contributor(s) and not of MDPI and/or the editor(s). MDPI and/or the editor(s) disclaim responsibility for any injury to people or property resulting from any ideas, methods, instructions or products referred to in the content.