1. Introduction
Due to new technology, today we are able to generate sequences from the genome with lower cost. However, at the same time, we have a great challenge to analyze large scale datasets from genome sequences. In phylogenomics, a new field that applies tools from phylogenetics to genome datasets, we often conduct comparative phylogenetic analyses, that is, to compare evolutionary histories among a set of taxa between different genes from the genome (for example, see [
1]). However, we often face the problem in this process that some taxa in the dataset have missing gene(s) [
2,
3]. When this happens, systematists infer missing part of a gene tree from other gene trees using a supervised learning method, such as the linear regression model.
A phylogenetic tree is a weighted tree which represents evolutionary history of a given set of taxa (or species). In phylogenetic trees, leaves represent species or taxa in the present time which we can observe and internal nodes in the tree, which represent ancestors of the species, do not have any labels. A gene tree is a phylogenetic tree reconstructed from an alignment of a gene in a genome. Gene trees with the same set of species or taxa do not have to have the same tree topology since each gene might have different mutation rates due to the selection pressures, etc. [
4]. In a comparative phylogenetic analysis, we often compare gene trees (for example, we compare how they are different, how their mutation rates are different, and often we are interested in inferring the species tree).
To infer a missing part of a gene tree, we often apply a supervised method to regress the missing part. In this process, first, we compute an unique vector representation of each gene tree. Then we infer the missing components of the vector of the tree from the vectors computed from other gene trees in a dataset using a regression model, such as a multiple linear regression [
3].
However, a set of all such vectors realizing all possible phylogenetic trees, which is called a space of phylogenetic trees, is not Euclidean. In fact, a space of phylogenetic trees is an union of polyhedral cones with a large co-dimension, so this is not even convex in terms of Euclidean metrics. Therefore, it is not appropriate to apply classical regression models, such as linear regression or neural networks, since they assume convexity in terms of Euclidean geometry. Thus, in this short paper, we propose an analogue of a classical multiple linear regression in the setting of tropical geometry with the max-plus algebra—an application of tropical polytopes to infer the missing part of a phylogenetic tree.
Equidistant trees are used to model gene trees under the multi-species coalescent model [
4]. Therefore, in this paper, we focus on an equidistant tree, which is a rooted phylogenetic tree such that the total weight on an unique path from its root to each leaf is the same, and we focus on the space of all possible equidistant trees. It is well-known that the space of all possible equidistant trees is a
tropical Grassmannian, which means that it is a tropically linear space with respect to the
tropical metric [
5,
6,
7]. Therefore, with the tropical metric with the max-plus algebra, we can conduct statistical analyses using tropical linear algebra, which is an analogue of a classical linear algebra. In fact, there has been much development in statistical learning over the space of phylogenetic trees using tools from tropical geometry [
7,
8,
9,
10,
11,
12].
Since a tropical polytope is tropically convex and since the space of equidistant trees is tropically convex, if all vertices are equidistant trees, then a tropical polytope is contained in the space of equidistant trees. Thus, in this paper, we propose to use a tropical polytope over the space of equidistant trees to infer missing part of a phylogenetic trees. This proposed method has basically four main step: (1) compute induced trees on the set of leaves which we observe in T, a tree with missing leaf (leaves) from a training set; (2) compare T with these induced trees; (3) compute a tropical polytope with trees with full set of leaves whose induced trees have closest tree topologies with T; and (4) project T onto the tropical polytope computed in step (3).
In
Section 2, we discuss basics from tropical geometry and in
Section 3, we discuss basics from phylogenetics. In
Section 4, we show our novel method to impute a missing part of a phylogenetic tree. Then, in
Section 5, we show a theoretical condition of
T that the worst case scenario for the estimated tree via our method has the
Robinson–Foulds distance at most 4. Then,
Section 6 shows computational experiments of our method against other methods including a multiple linear regression and our method performs well.
2. Basics in Tropical Geometry
In this section, we discuss basics from tropical geometry. We consider the
tropical projective torus,
where
is the vector with all ones in
. Basically this means that any vectors in
is invariant with
, i.e.,
for any element
. For more details, see [
13,
14].
Under the tropical semiring
, the tropical arithmetic operations of addition and multiplication are defined as:
For any scalars
and for any vectors
, we have tropical scalar multiplication and tropical vector addition defined as:
Definition 1. Suppose we have a set . Iffor any and for any , then S is called tropically convex.
Suppose we have a finite subset . Then, the smallest tropically-convex subset containing V is called the tropical convex hull
or tropical polytope
of V. can also be written as: A tropical line segment, , between two points is a tropical convex hull of .
Example 1. Suppose we have three points . Then the tropical convex hull of these three points is shown in Figure 1. Remark 1. By the definition, if a set is tropically convex, then a tropical line segment between any two points in S must be contained in S.
Definition 2. For any points , the tropical metric),
,
between v and w is defined as: Example 2. Suppose we have points . Then we have the distance between these two points in terms of the tropical metric is Definition 3. Let and let be a tropical polytope with its vertex set V. For , let Then is a projection onto P with the property such thatfor all . Example 3. Suppose we have three points . Also suppose the tropical convex hull P of these three points. Suppose we have a point . Then,Thus, we have Thus, .
3. Basics in Phylogenetic Trees
Let . A phylogenetic tree T on is a weighted tree of m leaves with the labels and internal nodes in the tree not labeled. A subtree in T on is a subtree of T with leaves a. An equidistant tree on is a rooted phylogenetic tree on such that the total weight on the path from its root to each leaf i in has the same distance for each . In this paper, we assume on equidistant trees.
In order to conduct a statistical analysis, we have to convert a phylogenetic tree into a vector. Here, we discuss one way to convert a phylogenetic tree into a vector.
Definition 4. Suppose we have a dissimilarity map
such thatIf there exists a phylogenetic tree on such that is the total weight on the unique path from a leaf to a leaf , then we call D as a tree metric.
Remark 2. Since a tree metric of a phylogenetic tree on is symmetric and its diagonal is 0, we consider an upper triangular matrix of the tree metric and we consider the upper triangular matrix of the tree metric as a vector in .
Definition 5. Let be a metric over , namely, D is a map from to such that Suppose D is a metric on . Then if D satisfiesis attained at least twice for any , then D is called an ultrametric.
Example 4. Suppose we have andThen, D is an ultrametric. It is well-known that if we have an ultrametric on , then there is an unique equidistant tree on by the following theorem:
Theorem 1 ([
15])
. Suppose we have an equidistant tree T with a leaf label set and suppose for all is the distance from a leaf i to a leaf j. Then, D is an ultrametric if and only if T is an equidistant tree on . Therefore by Theorem 1, in this paper, we consider the set of ultrametrics, , on m as the space of equidistant trees on .
Definition 6. Let such that and . Suppose we have an equidistant phylogenetic tree T with the leave set . A clade of T with leaves is an equidistant tree on x constructed from T by adding all common ancestral interior nodes of any combinations of only leaves x and excluding common ancestors including any leaf from in T, and all edges in T connecting to these ancestral interior nodes and leaves x.
Definition 7. For a rooted phylogenetic tree, a nearest neighbor interchange (NNI) is an operation of a phylogenetic tree to change its tree topology by picking three mutually exclusive leaf sets and changing a tree topology of the clade, possibly the whole tree, consisting with three distinct clades with leaf sets , , and .
Remark 3. Since there are three possible ways of connecting three distinct clades, NNI possibly creates two new tree topologies on .
Definition 8. Suppose we have rooted phylogenetic trees on . The Robinson–Foulds (RF) distance is the number of operations that the subtree of has the same tree topology as the subtree of by removing a leaf of and the subtree of has the same tree topology as the subtree of by removing a leaf of .
Remark 4. The Robinson–Foulds distance is always divisible by 2.
Remark 5. One can see that the Robinson–Foulds distance between two trees which is one NNI move apart is 2.
5. Theoretical Results
Let such that and . Let be a sample of equidistant trees with m leaves. Let for be an equidistant tree with x by dropping tips y from , i.e., is an induced tree on a.
Theorem 2. Suppose is a sample of equidistant trees with and let such that is a subtree on x which is an equidistant tree with x by dropping tips y from and is an subgraph graph with y by adding all common ancestral interior nodes of any combinations of only leaves x and excluding common ancestors including any leaf from in for . Suppose and have the same tree topology for . If are clade in for and is also a clade in T, then an estimated tree via our method with the tropical polytope and T differ at most the Robinson–Foulds distance = 4.
Proof. Since
are connected trees for
,
forms a clade in
for
. Also
is a connected tree, so that
is also a clade in
T. This means that
and
for any
have only one NNI move distance. Since
and
have the same tree topology and since
is also a clade in
T,
, and
T differ only by one NNI move distance. Note that
and
have at most the Robinson–Foulds distance = 2 since
and
have just one NNI move difference, and so as with
T. Let
be an ultrametric form a tree
for
. Then, take any tropical line segment
. Since
and
have just one NNI move difference, by Theorem 8 in [
16], any tree topology of the tree realized from an ultrametric in
has the same tree topology of
or
. Since
P is tropically convex, any point in
P is a tropically convex combination of
for
. Thus, the tree topology of the tree realized by an ultrametric in
P has at most one NNI move different. Since the estimate
, and any tree realized from an ultrametric in
P to
T has at most 2 NNI move difference. Thus, we have the result. □
6. Computational Experiments
In this section, we apply this method to simulated data sets and compare its performance with the baseline model, which uses means of each missing element in an ultrametric computed from a tree, and the multiple linear regression model proposed by Yasui et al. in [
3].
6.1. Simulated Data
To assess a performance of this method, we use simulated datasets generated from the multi-species coalescent model using the software
Mesquite [
17].
Under the multi-species coalescent model, there are two parameters: species depth
and effective population size
. In this paper, we fix the effective population size as
and we vary
as we vary the ratio
6.2. Experimental Design
Here we vary . For this experiment, we fix the number of leaves as 10. Therefore . For each value of R, we generate a random species tree via the Yule model first. Then we generate the set of 1000 gene trees from the multi-species coalescent model given the species tree. Therefore, for each R, we have a simulated dataset with size 1000.
Note that when
R is larger we have tighter constraints to gene tree topologies by its species tree. Therefore, we do not have large variance for generating gene trees so that it is easier to estimate the missing part of a gene tree. On the other hand, if we have small
R, then we have a large variance for gene tree topologies, the coalescent model is becoming more like a random process [
4].
For estimating the performance of our method when we vary the number of leaves missing, we set three different cases: one leaf out of 10 leaves is removed, two leaves out of 10 leaves are removed, and three leaves out of 10 leaves are removed. For each scenario in terms of R and in terms of the number of leaves removed, we pick 200 random observations from the data set of 1000 trees as a test set.
To compare the performance of our method, we use the baseline model, i.e., we fill missing values of an ultrametric by taking the mean of observations with the full set of leaves and the multiple linear regression model proposed by Yasui et al. [
3]. For the multiple linear regression model, we set a missing element as a response variable and observed elements in an ultrametric as predictors [
3].
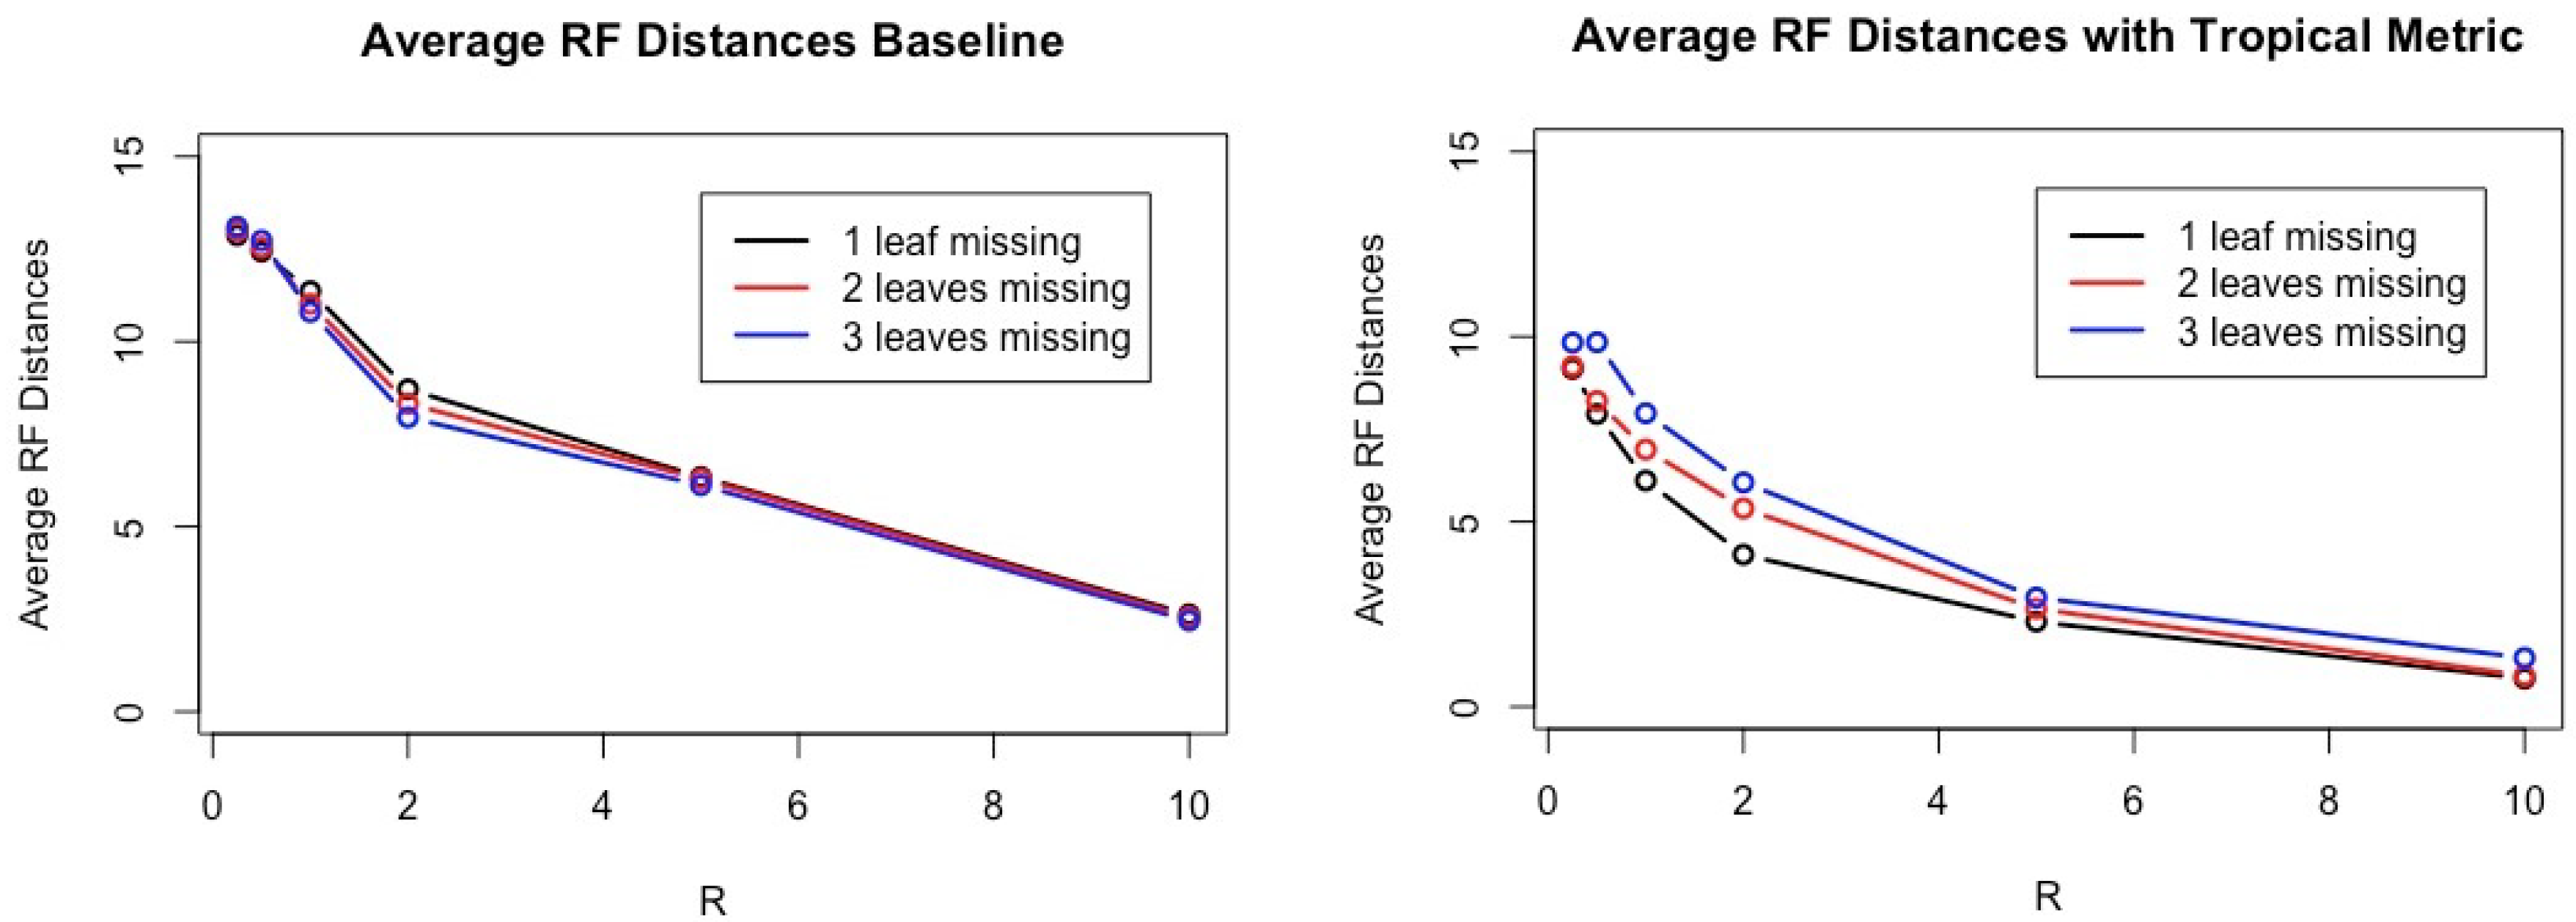
6.3. Results
To assess a performance of our method against the baseline and the method proposed by Yasui et al., we use the Robinson–Foulds distance between an estimated tree
and
T. The results are shown in
Table 1 and
Figure 2. Note that the smaller the Robinson–Foulds distance between two trees, the closer their tree topologies are. When the Robinson–Foulds distance is 0, their tree topologies are the same.
Figure 3 shows that the performance of the baseline and the performance of the linear regression model have very similar results for one, two, and three, the number of leaves removed and all ratio of
R.
According to computational experiments with simulated datasets shown in
Table 1 and
Figure 2, our method has smaller Robinson–Foulds distances in any cases compared to other methods. It is interesting that the number of leaves removed seems to greatly affect the results in general while
R clearly affects performances of all three methods compared.
If we have only one missing leaf and larger R, often the average Robinson–Foulds distances between inferred trees and true trees is less than 1 because we have often the condition satisfied in Theorem 2 due to very high constraints on tree topologies of gene trees.
8. Discussion
In this short paper, we show a novel method to impute a missing part of an equidistant tree on using a tropical polytope, which is an analogue of a linear regression in the setting of tropical geometry. From simulated data generated from the multi-species coalescent model, we show that this method works very well. In addition, we show a condition that the estimate tree and the true tree have at most a Robinson–Foulds distance of 4 (Theorem 2).
In order to demonstrate our method, we apply it to simulated data as well as an empirical data from Clavicipitaceae. This dataset contains more than 4000 genes and 860 out of 4268 gene trees miss some of leaves. Some trees miss 8 out of 12 tips. Then, we apply the tropical KDE developed by [
19] to find outlying gene trees and the results are consistent with the conclusion in [
18].
In the future, we can investigate applying the “tropical principal component analysis (PCA)” proposed by Yoshida, et al. in [
8] to an imputation of trees since the classical PCA can be viewed as a multivariate linear regression model with orthogonal projections.


