Abstract
In the spring of 2022, a new round of epidemic broke out in Shanghai, causing a shock to the Shanghai carbon trading market. Against this background, this paper studied the impact of the new epidemic on the price of Shanghai carbon emission rights and tried to explore the prediction model under the unexpected event. First, because a model based on point value data cannot capture the information hidden in inter-day price fluctuation, based on the interval price of Shanghai carbon emission rights (SHEA) and its influencing factors, an autoregressive conditional interval model with jumping and exogenous variables (ACIXJ) was established to explore the influence of the Russian–Ukrainian conflict and COVID-19 on the interval price of SHEA, respectively. The empirical results show that the conflict between Russia and Ukraine has no obvious influence on the price of SHEA, but COVID-19 led to a decline in the price trend of SHEA over four days before the city was closed, and the volatility changed significantly on the day before the city was closed. The price fluctuation was the strongest within 3 days after the city was closed; In addition, in order to accurately predict the interval data of SHEA against the background of COVID-19, based on the interval data decomposition algorithm (BEMD), a hybrid forecasting model of NDGM-ACIXJ/CNN-LSTM was constructed, in which the discrete gray model of approximate nonhomogeneous exponential series (NDGM) combined with the ACIXJ model is used to predict the high-frequency sub-interval, and the convolution neural network long-term and short-term memory model (CNN-LSTM) is used to predict the low-frequency sub-interval. The empirical results show that the prediction model proposed in this article has higher prediction precision than the reference models (ACIX, ACIXJ, NDGM-ACIXJ, BEMD-ACIX/CNN-LSTM, BEMD-ACIXJ/CNN-LSTM).
Keywords:
carbon emission rights in Shanghai (SHEA); convolutional neural network long-short memory model (CNN-LSTM); interval data decomposition algorithm (BEMD); autoregressive conditional interval model (ACIXJ) MSC:
62P05; 62P12
1. Introduction
In recent years, climate warming caused by excessive emissions of greenhouse gases has become one of the vital problems that affect human survival and development in countries all over the world. To respond to this issue, China has established a national carbon emissions trading market. Since it was founded relatively late, compared with the EU carbon trading market, the development of the domestic market mechanism is not mature enough, and it is affected by various factors. As the core factor of the carbon market, the price of carbon emission rights reflects the development of the carbon market. Therefore, research on the price of carbon emission rights has become an important issue of concern for many scholars. However, the operation of any market cannot be smooth sailing. At the end of 2019, COVID-19 broke out suddenly, which hit the carbon emission trading markets in China to different degrees; Hubei Province even closed its trading. As the national epidemic was returning to calm, when domestic economic development tends to be stable, the epidemic occurred in Shanghai in early March 2022, and due to the rapid expansion of the epidemic, the city was locked down on 28 March 2022. Before and after the lockdown, price fluctuation of SHEA appeared abnormal, which is reflected in the range of inter-day price fluctuation being larger than the normal period, and the overall was in a decline state. The range of intra-day price fluctuation is widening, from 0–2 in normal times to 5–9.9. This may cause negative emotions among investors and traders. Therefore, it is essential to study the impact of unexpected events on the carbon trading market, which has not yet been reported. In addition, anomalous changes in the price of carbon emission rights have significantly affected market value and its performance. The price of carbon emission rights predicted accurately enables us to understand changing trends in prices, thus helping investors to avoid carbon market risks and make reasonable decisions.
In recent years, analyzing the impact of emergencies on various markets has become a serious concern of many scholars at home and abroad [1,2,3,4,5]. In 2020, Abdullah M et al. [6] used front-panel data to analyze the influence of COVID-19 on the China stock market. In 2020, Liew et al. [7] used the Shanghai Composite Index and its constituent indexes to comprehensively evaluate the impact of COVID-19 on the performance of the China stock market. In 2017, Ramiah et al. [8] researched the impact of Brexit on British economic sectors with the help of event analysis.
However, the above-mentioned research methods are all according to the point value data to measure the inter-day trend, which cannot capture the constant change of the intra-day data [9]. However, the intra-day price fluctuation just reflects the micro-structure of the market and the emotional information of investors. Therefore, it is comparatively important to obtain worthy intra-day news by using the interval data composed of the daily lowest price and the highest price. At first, the regressive analysis of interval data was based on the interval point value attribute, that is, establishing time series models for the endpoint values of the interval, respectively, to obtain the predicted interval [10]. However, the point information inside the interval is not fully utilized, and is unable to catch the dynamic features of interval data. Therefore, to solve this problem, Han et al. [11] proposed the autoregressive model (ACI) in 2013. Compared with the existing interval model, ACI can better capture the dynamic characteristics of intra-day data, and the proposed minimum DK distance estimation method can also give the most accurate parameters. Subsequently, Yang et al. [12] further improved Han’s model by adding interval dummy variables to quantify the influence of emergencies on interval data. In 2020, Qiao et al. [13] added exogenous variables based on Yang, proposed the autoregressive model with exogenous variables (ACIX), and researched the impact of Brexit on the US stock market. The above model can well describe the change process of inter-day and intra-day data, but it also ignores an important fact; that is, unexpected events will lead to large fluctuations of data, which will make the observed data appear to “jump” points. Therefore, the traditional autoregressive model cannot well grasp the data rule; as a result, there is no statistical consistency at the jumping point. Therefore, one of the research objectives of this paper is reflected in two aspects: on the one hand, the jump point information is extracted for a better established model; on the other hand, interval data are constructed and the established model is used to extract intra-day interval data information. Based on this objective, this paper further improved Qiao’s model and proposed an autoregressive conditional interval model with exogenous variables and jumps (ACIXJ), which is used to study the impact of the Russian–Ukrainian conflict and COVID-19 on the interval price of Shanghai carbon emission rights. First, the minimum DK distance estimation method proposed by Sun et al. [14] was used to obtain the coefficient of the ACIXJ model, With the help of Wald statistics [13], the significance of the obtained parameters is tested, to study the impact of COVID-19 on the price of Shanghai carbon emission rights.
To achieve the emission reduction target of the national carbon emission market, help enterprises analyze the characteristics of market fluctuations, and provide convenience for managers, the price prediction of the domestic carbon market has become a concern of many scholars. Liu Jinpei et al. [15] used the metrological model to predict carbon prices in 2019. However, due to the nonlinear, nonstationary, and high noise characteristics of the carbon price, traditional metrological models have no advantages. Many studies [16,17] have introduced machine learning and artificial intelligence methods into carbon market price prediction. However, faced with the at present highly unstable carbon market, the effectiveness of artificial intelligence methods in forecasting is also worrying. Nowadays, the artificial intelligence method based on decomposition prediction has attracted widespread attention [18,19,20,21,22], but few scholars will discuss the combination of a metrological model and artificial intelligence in decomposition prediction. In 2021, Huang et al. [23] proposed a GARCH/CNN-LSTM model based on VMD decomposition to forecast the EUA price of the European Union, providing a reference for the research in this paper.
However, these models did not consider established prediction models in the context of unexpected events, and only for point value data. Therefore, another research objective of this paper is to establish a prediction model based on interval data under unexpected events. Because the inter-day and intra-day interval price fluctuations of SHEA under COVID-19 are larger than those in normal periods, the previous prediction model cannot capture the abnormal fluctuation information and the general law correctly. Combined with the idea of decomposition and prediction, the two-dimensional interval decomposition algorithm [24] (BEMD) is considered to decompose the carbon interval price into several sub-intervals with different frequencies, and the Lempel-ZLV [25] complexity algorithm is used to divide the subintervals into high-frequency intervals and low-frequency intervals. The high-frequency interval is characterized by strong short-term fluctuation, high noise, and high randomness. As an improved model of the ARMA model [26], the metrological model ACIXJ is good at predicting the high-frequency component with strong noise and randomness, and it can well adapt to the data under the epidemic situation. At the same time, considering the strong randomness of the influencing factor data of the SHEA interval price, the NDGM model [27] was introduced to weaken its randomness, to solve the problem of inaccurate prediction caused by the strong randomness of exogenous variables in ACIXJ model. Low-frequency sequences are characterized by long-period fluctuations, while CNN-LSTM has excellent long-term memory storage and feature analysis ability, which is suitable for predicting low-frequency sequences.
Based on the above analysis, this paper constructed a carbon price prediction model under COVID-19, namely a BEMD-NDGM-ACIXJ/CNN-LSTM hybrid model, which can not only fully leverage the strengths of the metrological model and artificial intelligence, but also accurately capture the data abnormal fluctuation information caused by emergency events. The concrete performance is to decompose the interval price into high-frequency interval sequences and low-frequency interval sequences, and the NDGM-ACIXJ model and CNN-LSTM model are used to forecast the high-frequency interval series and low-frequency interval series, respectively. Finally, the predicted outcomes are added to obtain the final predicted outcomes.
2. Models
Under the background of the new economic environment, based on the random forest characteristic engineering algorithm, the ACIXJ model is established to study the influence of the Russia–Ukraine conflict and COVID-19 on the price of Shanghai carbon emission rights. Based on the BEMD decomposition method, the mixed model BEMD-NDGM-ACIXJ/CNN-LSTM was established by combining the metrological model and the deep learning model to predict and analyze the price of Shanghai carbon emission rights under COVID-19. Its structure diagram is as follows Figure 1:
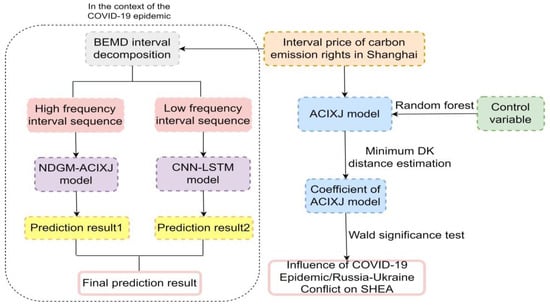
Figure 1.
Overall architecture.
2.1. Random Forest
The random forest feature engineering algorithm is used to rank the characteristic variables that affect the price of Shanghai carbon emission rights. According to the existing literature research, this paper selects 10 factors that affect the price of Shanghai carbon emission rights [28,29,30], which are Guodian power, China Thailand Securities Nonferrous Metals Industry Index (LOF), China Petroleum, Sanyo Chemical, China Construction, China Eastern Airlines, CSI 500 Shanghai ETF, and SHIBOR Week, all of which choose the highest price, lowest price, and close price. This paper increases the index of Shanghai’s high and low temperature.
2.2. Autoregressive Conditional Interval Model with Exogenous Variables and Jump (ACIXJ)
The ACIX interval model is derived from the AMAR model, which can make full use of the intra-day interval range and inter-day level information to effectively estimate and infer interval data. Since the data selected for this paper were in the epidemic period in Shanghai, this paper proposed an autoregressive conditional interval model with exogenous variables and jumps (ACIXJ):
where are unknown parameters, , is the lagged first order interval variable, , are control variables, represents the jump height, by using the point-by-point test method of Lee-Mykland [31], the jumping data point is identified, and the average value of the three data before and after is taken to replace the point. Take the difference between the original data and the new data as the jump height, and the jump height of the non-jump point is 0.
The and presented here are used to quantify the impact of COVID-19 on the inter-day trend and intra-day volatility range of interval prices. According to the law of high-frequency interval sequence, combining NDGM with the ACIXJ model, the NDGM-ACIXJ hybrid model is constructed to predict the high-frequency interval series of carbon emission rights. The specific process is shown in Figure 2a.
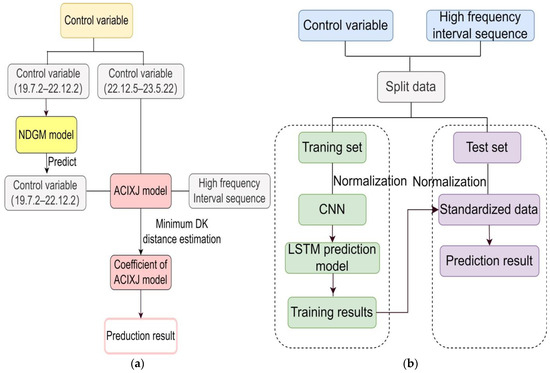
Figure 2.
(a) Prediction framework of NDGM-ACIXJ model; (b) Prediction framework of CNN-LSTM model.
In this paper, the minimum DK distance estimation method is used to obtain the model parameters, which are shown in the following:
- (1)
- First, assuming that the true value of interval price of carbon emission rights is . The endpoint values of all experimental interval data were substituted into Equation (1) to form the predicted interval as .
- (2)
- Second, the DK distance estimator is obtained fromwhere
According to the restrictions in Equation (4), data sets were selected, making full use of interval interior point information.
- (3)
- Finally, the fmincon function in MATLAB was used to solve forto obtain the parameter that minimizes the error.
In addition, this paper uses the Wald statistic based on interval data to test the significance of each parameter.
where , , After calculating and V, the estimated parameters are substituted into them to obtain two matrices. The hypothesis test is defined as , is a unit matrix of order , with denoting the number of parameters. is a vector of consisting of the estimated parameters, and r is defined as a zero matrix. In particular, when , if the original hypothesis is rejected, it is considered that the unexpected event has an effect on the variable corresponding to this parameter.
2.3. Convolutional Neural Network Long-Term Memory Model (CNN-LSTM)
In this paper, the CNN-LSTM model is established under the Keras framework in Python, and the specific hyperparameters are set as shown in Table 1. The CNN-LSTM hybrid model has a powerful feature extraction function, in which CNN can automatically extract the internal information of data, and LSTM is used to extract long-term time feature information, which can more accurately capture the hidden trend of time series data. The combination of the two can fully explore the data features and provide strong support for accurate price prediction. Furthermore, the low-frequency interval series show characteristics of longer period fluctuations. Therefore, the CNN-LSTM hybrid model is considered in this paper to predict the low-frequency interval series of carbon emission rights, and the specific process is shown in Figure 2b.

Table 1.
Parameter setting table of the model.
3. Data Sources and Empirical Analysis
3.1. Data Sources
This paper constructs the daily interval value return of Shanghai carbon emission rights from 2 July 2019 to 22 May 2023. Among them, 24 February is the period when the conflict between Russia and Ukraine broke out, and 28 March is the closing date of Shanghai; the interval value return is based on the following points:
is the logarithm of the daily lowest price, is the logarithm of the daily highest price, and is the logarithm of the daily close price. Based on the data selected in Section 2.1, the random forest regression algorithm under the SK-learn framework in Python was used to rank the importance of the features. The parameters are set as follows: the number of estimators is 800, random forest seeds are set to 30 and 35, respectively, and the rest of the parameters are the default parameters. The results obtained are shown in Figure 3. The variables with importance greater than 0.1 in both the highest and lowest price characteristic rankings were extracted as exogenous variables for the ACIXJ model. Therefore, Sanyo Chemical, China Construction, and China Eastern Airlines were selected as exogenous variables and used as input data for the ACIXJ model after being processed according to Formula (5).
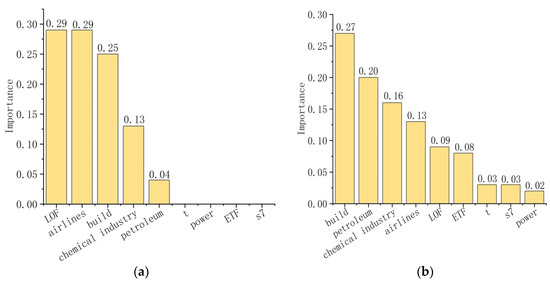
Figure 3.
Feature importance ranking (a) of lowest price; (b) of highest price.
Observing Figure 4, Figure 4 (top) shows the price trend chart of carbon emission rights in Shanghai from 2 July 2019 to 22 May 2023. Figure 4 (bottom) shows the price trend of carbon emission rights in the days before and after the Russia and Ukraine conflict and Shanghai closing. Observing Figure 4 (top), it is found that the price trend of Shanghai carbon emission rights remained stable after August 2020 until February 2022, and the data fluctuated around March. From Figure 4 (bottom), it is found that the lowest price showed an obvious downward trend around 5 and 25 March, but both rose after the decline; the highest price has an obvious downward trend around March 25, and then rises. The interval spread fluctuated continuously throughout March, reaching the maximum on the first day after the city was closed (29 March), and then it continued to decline—that is, the fluctuation slowed down. Based on the above analysis, it is preliminarily concluded that during the Russia and Ukraine conflict and the outbreak of a new round epidemic in Shanghai, the price of Shanghai carbon emission rights was obviously abnormal. In order to draw a more convincing conclusion, this paper makes the following empirical analysis.
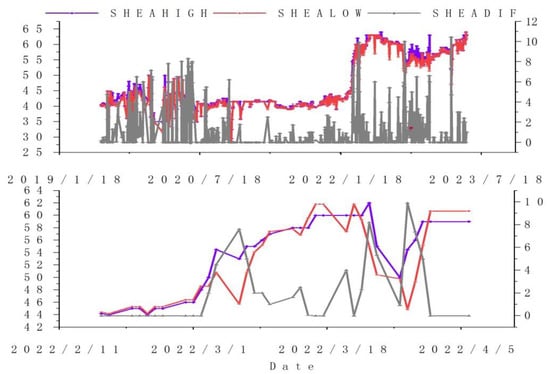
Figure 4.
Overall trend chart.
3.2. Empirical Analysis
3.2.1. Analysis of the Impact of Epidemic on the Price of Shanghai Carbon Emission Rights
After the data processing in Section 3.1, it is known from the ADF test that all experimental data are smooth series, i.e., they satisfy the conditions for the use of the ACIXJ model, and the results are shown in Table 2 and Table 3:
Table 2.
ADF test results for all lowest price variables.
Table 3.
ADF test results for all highest price variables.
When the T-statistic is less than the respective critical value, the corresponding series can be considered a smooth series. Observing Table 2 and Table 3, it can be seen that all variables are smooth series. Different time windows were considered to study the impact of two kinds of emergencies on the interval price of Shanghai carbon emission rights in different periods, which are, respectively, the outbreak time of the Russia and Ukraine conflict (24 February 2022) and the closing time of the city (28 March 2022), set as t = 0, and different time windows are set according to this time point, which is, respectively, after the incident [0; t1] (t1 = 0, 1, 2, 3, 4, 5) and before the incident [−1; t2](t2 = −1, −2, −3, −4, −5). The optimal coefficients of the ACIX model and ACIXJ model are obtained by using the minimum DK distance estimation method, which are substituted into their respective equations; taking the window [0; 0] as an example, the following results are obtained. As shown in Figure 5, Figure 6, Figure 7 and Figure 8.
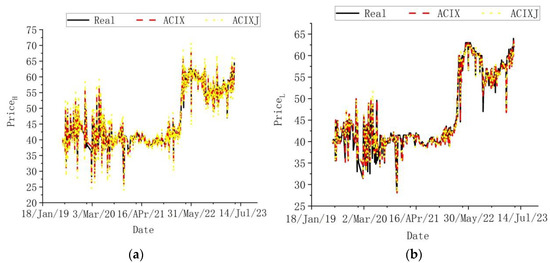
Figure 5.
(a) Highest price of ACIX and ACIXJ model prediction comparison against the background of Russian–Ukrainian conflict; (b) lowest price of ACIX and ACIXJ model prediction comparison against the background of Russian–Ukrainian conflict.
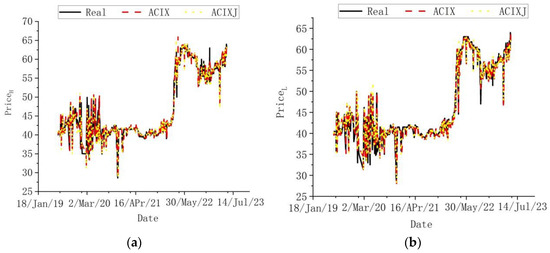
Figure 6.
(a) Highest price of ACIX and ACIXJ model prediction comparison against the background of COVID-19 epidemic; (b) lowest price of ACIX and ACIXJ model prediction comparison against the background of COVID-19 epidemic.
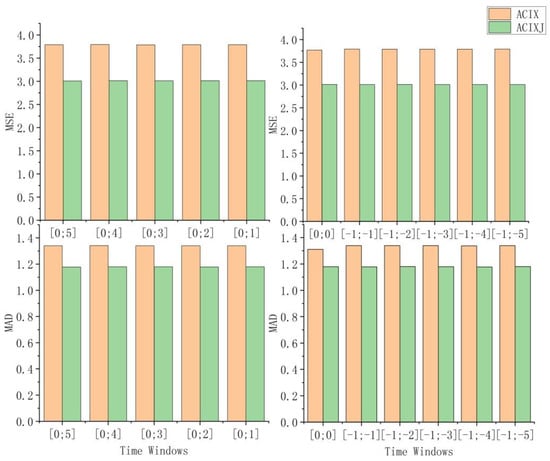
Figure 7.
Performance comparison results against the background of Russian–Ukrainian conflict.
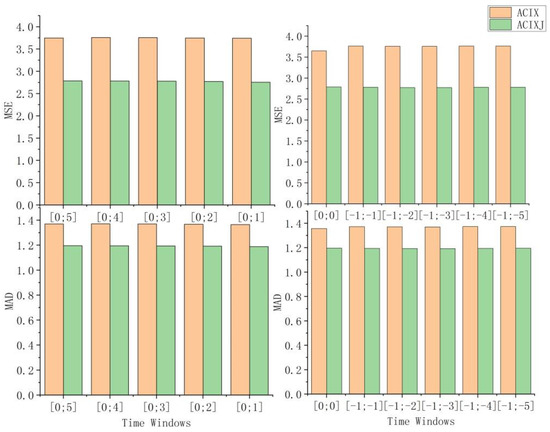
Figure 8.
Performance comparison results against the background of COVID-19 epidemic.
Figure 5 and Figure 6 show the prediction results of the ACIX and ACIXJ models on the highest price and lowest price of Shanghai carbon emission rights between 2 July 2019 and 22 May 2023. Figure 7 and Figure 8 shows the performance comparison results of the two models, in which MSE and MAD are obtained by calculating the mean values of MAD and MSE of the highest and lowest price of carbon emission rights in Shanghai. It can be seen that the predicted value of the ACIXJ model is closer to the real value. The calculation formula of the evaluation index is as follows:
Therefore, this paper considers using the ACIXJ model to study the impact of the Russia–Ukraine conflict and COVID-19 on the interval price of Shanghai carbon emission rights. In order to obtain more accurate results, this paper will study four cases, denoting Equation (1) as M, where M1, M2, and M3 are obtained by removing X1, X2, and X3 from Equation (1), respectively, and the Wald test is used to obtain Wald statistics of each coefficient in four cases, as shown in Figure 9 and Figure 10. ***, **, * indicates that the null hypothesis is rejected at the significance levels of 1%, 5%, and 10%, respectively—that is, the variable corresponding to this coefficient has a noticeable effect on the interval price of carbon emission rights, and the numbers in the figure represent the corresponding coefficients.
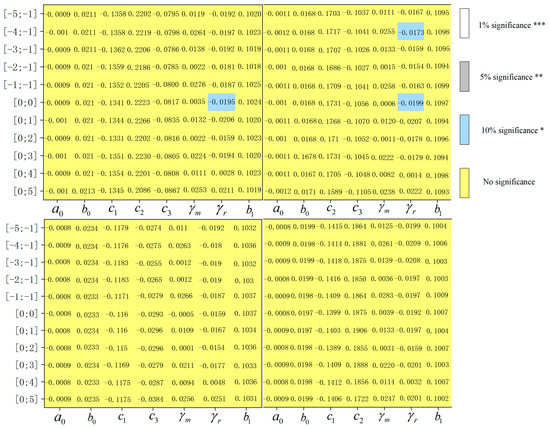
Figure 9.
Empirical results of the impact of Russia–Ukraine conflict on the price of carbon emission rights in Shanghai.
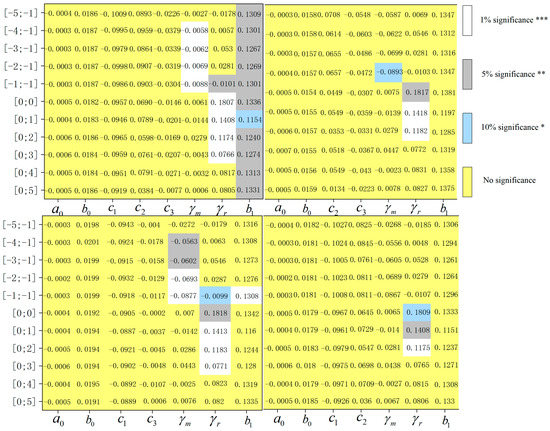
Figure 10.
Empirical results of the impact of COVID-19 epidemic on the price of carbon emission rights in Shanghai.
Figure 9 and Figure 10, respectively, show the empirical results of the impact of the Russia–Ukraine conflict and COVID-19 on the price of Shanghai carbon emission rights, including the parameter estimation results of the four models, i.e., M, M1, M2, and M3, in each time window and the Wald test results, from which we can get the following:
- (1)
- The Russia and Ukraine conflict has little impact on Shanghai carbon emission rights.
- (2)
- Ex ante window. As can be seen from the results of Figure 10, in both cases, in time windows [−1;−1], [−2;−1], [−3;−1], and [−1;−4], the estimator of is basically significant, which indicates that the price trend of Shanghai carbon emission rights declined four days before the city was closed. In [−1;−1], the estimators of are all significantly different from 0, and the significance shows the phenomenon of alternating positive and negative, which indicates that the intra-day fluctuation range of Shanghai carbon emission rights’ interval price changed significantly in the first days before the incident, and the fluctuation is relatively drastic, which is consistent with the analysis in Section 3.1.
- (3)
- Ex post window. It can be seen from Figure 10 that the estimators of are all in the windows [0;0], [0;1], [0;2], and [0;3]. Both of them are significant, and the significance is positive, which indicates that the intra-day fluctuation range of the price of Shanghai carbon emission rights has changed significantly within three days after the incident. The insignificance in other windows means that the market can respond quickly, keeping the price volatility of SHEA stable, which is consistent with the analysis in Section 3.1.
- (4)
- Estimator of lag first-order variable in the ACIXJ model in Figure 10. In the case of M, the coefficient of the lagging first-order variable is significantly positive, which shows that the price trend of the SHEA interval has a strong positive correlation with the price trend of the previous day.
3.2.2. Forecast and Analysis of the Price of Carbon Emission Rights under the Epidemic
After analyzing the impact of the pandemic, this paper argues that it is also important to predict the future price of carbon emission rights. First, the interval data price decomposition (BEMD) algorithm is used to decompose the interval price of carbon emission rights into several sub-series intervals, as shown in Figure 11a,b. With the help of the LZ complexity algorithm, the sub-series intervals are divided into high-frequency intervals and low-frequency intervals, as shown in Table 4.
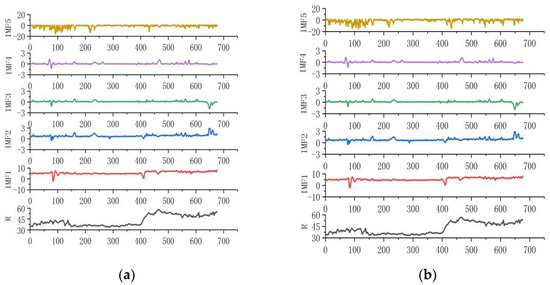
Figure 11.
(a) Decomposition result of BEMD for the highest price; (b) Decomposition result of BEMD for the lowest price.
Table 4.
LZ complexity of each subsequence.
First, the complexity of each sequence is calculated and ordered from largest to smallest, denoted as ; second, according to , the minimum value that makes the above equation greater than or equal to 0.8 is considered the boundary that divides high-frequency sequences from low-frequency sequences, so the IMF1 and R sequences are low-frequency sequences, and the other sequences are considered high-frequency sequences.
Considering that interval sequences with different frequencies have their own suitable prediction models, in this paper, the NDGM-ACIXJ hybrid model is proposed to predict the high-frequency interval series, and the CNN-LSTM is used to predict the low-frequency interval series, and then the prediction results are added together. To predict the interval price of carbon emission rights between 5 December 2022 and 22 May 2023, with the window [0; 0] as an example, the following results are obtained Figure 12.
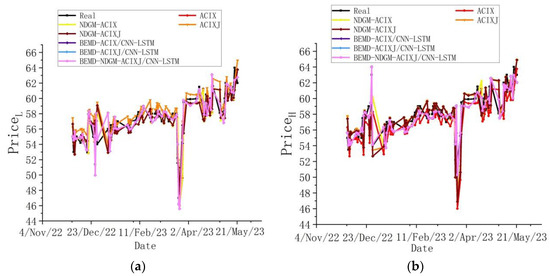
Figure 12.
(a) Lowest price comparison prediction results of different models; (b) Highest price comparison prediction results of different models.
According to the above figure, compared with the reference model, the BEMD-NDGM-ACIXJ/CNN-LSTM hybrid model predicts that the highest price and lowest price of carbon emission rights are closer to the real value, and they can predict the direction and amplitude of price fluctuation very well.
Figure 13 shows the performance comparison results of each prediction model. Models 1–7 are ACIX, NDGM-ACIX, ACIXJ, NDGM-ACIXJ, BEMD-ACIX/CNN-LSTM, BEMD-ACIXJ/CNN-LSTM, and BEMD-NDGM-ACIXJ/CNN-LSTM, respectively. It can be seen that Model 7 has the highest prediction accuracy among the six models; MSE is the smallest in each window, and the prediction accuracy of the six models from high to low is in the order of model 7, model 6, model 5, model 4, model 3, model 2, and model 1. Thus, it can be seen that the price decomposition prediction model and jump model are necessary for the carbon emission rights price prediction.
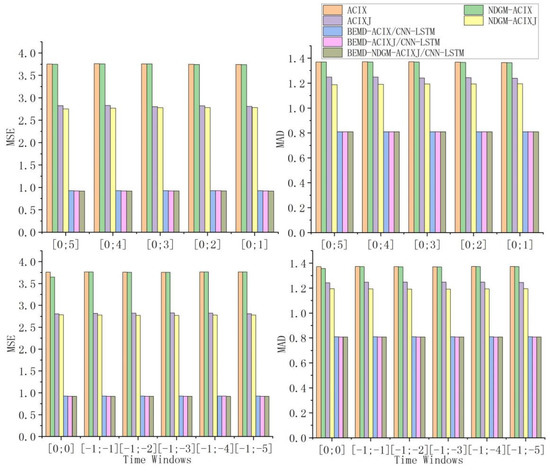
Figure 13.
Performance comparison results of each model in different windows.
4. Discussion
This paper discussed the impact of COVID-19 and the Russian–Ukrainian conflict on the price of Shanghai carbon emission rights and forecasted the price of Shanghai carbon emission rights under COVID-19. For the former, which has not been reported so far, this paper proposed the ACIXJ model for the research, which added a jump term than the previous ACIX model and can better adapt to the situation of drastic data changes; the hybrid forecasting model, BEMD-NDGM-ACIXJ/CNN-LSTM, combined econometric model, and deep learning to effectively improve forecasting accuracy.
However, there are some limitations to the research in this paper. For example, the minimum DK distance estimation method did not include infinitely many data in the interval when choosing the K; only 100 were chosen. Furthermore, the ACIXJ model in this paper is only applicable to interval data and cannot be used for point-value data. The findings of this paper can also be further expanded: (1) indicators measuring investor sentiment could be used as control variables to be selected in the future; (2) developing a more convenient interval estimation algorithm that allows more interval interior data to be applied; (3) applying experimental methods to EU carbon emission rights options data.
5. Conclusions
In this paper, an autoregressive conditional interval model with jumps based on dummy variables is first proposed to study the impact of the Russian–Ukrainian conflict and COVID-19 in the spring of 2022 on the price of Shanghai carbon emission rights. The dummy variables were used to evaluate the inter-day trend and intra-day volatility of carbon emission right interval prices caused by the epidemic. At the same time, the Wald statistic was used to measure the impact of the pandemic on inter-day trend and intra-day volatility. Second, the BEMD-NDGM-ACIXJ/CNN-LSTM decomposition hybrid model was constructed to predict the price of Shanghai carbon emission rights. Finally, using the interval price of SHEA for empirical analysis, the following results are obtained:
- (1)
- When studying the impact of Russia–Ukraine conflict and COVID-19 on prices of Shanghai carbon emission rights, the advantages of research based on interval price data are fully taken into account—that is, it can accurately capture information about the trend of inter-day price and the range of intra-day price fluctuations and construct the metrological model ACIXJ. The empirical results show that the Russia and Ukraine conflict has no obvious effect on the price of Shanghai carbon emission rights. In view of the impact of COVID-19, the results of the ex ante analysis show that the price decreases significantly in the first four days of lockdown, and the intra-day volatility changes significantly. the ex post analysis results show that the volatility is strong in the latter two days.
- (2)
- The mixed BEMD-NDGM-ACIXJ/CNN-LSTM model was constructed when the price of Shanghai carbon emission rights was predicted against the background of COVID-19, taking into full account the abnormal data fluctuation caused by unexpected events. The results show that the decomposition hybrid model proposed in this article has higher prediction precision than the reference model, and it fully leverages the strengths of combining the econometric model and deep learning.
The research results also have practical implications. Buyers always want to buy carbon allowances when the price drops, and there was a clear downward trend in the price of carbon emission rights before the epidemic outbreak, suggesting that it is best for buyers to buy and hold before the unexpected event becomes more serious. In addition, unexpected events can lead to unusual price changes before they occur; the carbon trading market can select suitable measures in response to these unusual changes to avoid long-term impacts.
Author Contributions
Conceptualization, Q.L. and J.Z.; methodology, Q.L.; software, Q.L.; validation, Q.L. and J.Z.; formal analysis, Q.L.; investigation, Q.L.; resources, Q.L.; data curation, Q.L.; writing—original draft preparation, Q.L.; writing—review and editing, Q.L., J.Z., H.J. and X.B.; visualization, Q.L.; supervision, Q.L., J.Z., H.J. and X.B.; project administration, Q.L.; funding acquisition, J.Z. All authors have read and agreed to the published version of the manuscript.
Funding
This research was funded by National Nature Science Foundation of China, Grant Number 51675161.
Data Availability Statement
https://www.wind.com.cn and https://www.eex.com/en (accessed on 1 March 2022).
Conflicts of Interest
The authors declare no conflict of interest.
References
- Wei, Y.; Qin, S.K.; Li, X.F.; Zhu, S.; Wei, G.W. Oil price fluctuation, stockmarket and macroeconomic fundamentals: Evidence from China before and after the financial crisis. Financ. Res. Lett. 2019, 30, 23–29. [Google Scholar] [CrossRef]
- Jebran, K. Volatility spillover between stock and foreign exchange market of China: Evidence from subprime Asian financial crisis. J. Asia Bus Stud. 2019, 12, 220–232. [Google Scholar] [CrossRef]
- Zhao, Z.; Wen, H.W.; Li, K. Identifying bubbles and the contagion effect between oil and stock markets: New evidence from China. Econ. Model. 2020, 94, 10–18. [Google Scholar] [CrossRef]
- Bai, H.; Hou, K.; Kung, H.; Li, E.X.; Zhang, L. The CAPM strikes back? An equilibrium model with disasters. J. Financ. Econ. 2019, 131, 269–298. [Google Scholar] [CrossRef]
- Yang, Z.; Zhou, Y. Quantitative Easing and Volatility Spillovers Across Countries and Asset Classes. Manag. Sci. 2017, 63, 333–354. [Google Scholar] [CrossRef]
- Al-Awadhi, A.M.; Alsaifi, K.; Al-Awadhi, A.; Alhammadi, S. Death and contagious infectious diseases: Impact of the COVID-19 virus on stock market returns. J. Behav. Exp. Financ. 2020, 27, 100326. [Google Scholar] [CrossRef] [PubMed]
- Liew; Khim-Sen, V.; Chin-Hong, P. Chinese stock market sectoral indices performance in the time of novel coronavirus pandemic. MPRA Pap. 2020, 43, 218–516. [Google Scholar]
- Ramiah, V.; Pham HN, A.; Moosa, I. The sectoral effects of Brexit on the British economy: Early evidence from the reaction of the stock market. Appl. Econ. 2017, 49, 2508–2514. [Google Scholar] [CrossRef]
- Yang, W.; Han, A.; Wang, S.Y. Analysis of the interaction between crude oil price and US stock market based on interval data. Int. J. Energy Stat. 2013, 1, 85–98. [Google Scholar] [CrossRef]
- Billard, L.; Diday, E. From the statistics of data to the statistics of knowledge: Symbolic data analysis. J. Am. Stat Assoc. 2003, 98, 470–487. [Google Scholar] [CrossRef]
- Han, A.; Hong, Y.M.; Wang, S.Y. Autoregressive Conditional Models for Interval-Valued Time Series Data. Ph.D. Thesis, Cornell University, New York, NY, USA, 2016. [Google Scholar]
- Yang, W.; Han, A.; Cai, K.; Wang, S. ACIX model with interval dummy variables and its application in Forecasting Interval-valued Crude Oil Prices. Procedia Comput. Sci. 2012, 9, 1273–1282. [Google Scholar] [CrossRef]
- Qiao, K.N.; Liu, Z.Y.; Huang, B.; Sun, Y.Y.; Wang, S. Brexit and Its Impact on the US Stock Market. J. Syst. Sci. Complex 2021, 34, 1044–1062. [Google Scholar] [CrossRef]
- Sun, Y.Y.; Han, A.; Hong, Y.M.; Wang, S. Threshold auto-regressive models for interval-valued time series data. J. Econom. 2018, 206, 414–446. [Google Scholar] [CrossRef]
- Liu, Z.B.; Huang, S. Carbon option price forecasting based on modified fractional Brownian motion optimized by GARCH model in carbon emission trading. N. Am. J. Econ. Financ. 2021, 101307, 1062–9408. [Google Scholar] [CrossRef]
- Sun, W.; Zhang, C. Analysis and forecasting of the carbon price using multi-resolution singular value decomposition and extreme learning machine optimized by adaptive whale optimization algorithm. Appl. Energy 2018, 231, 1354–1371. [Google Scholar] [CrossRef]
- Wang, J.J.; Qiu, S.Y. Improved Multi-Scale Deep Integration Paradigm for Point and Interval Carbon Trading Price Forecasting. Mathematics 2021, 9, 2595. [Google Scholar] [CrossRef]
- Wang, J.J.; Sun, X.; Qian, C.; Cui, Q. An innovative random forest-based nonlinear ensemble paradigm of improved feature extraction and deep learning for carbon price forecasting. Sci. Total Environ. 2021, 762, 143099. [Google Scholar] [CrossRef]
- Zhou, J.G.; Chen, D.F. Carbon Price Forecasting Based on Improved CEEMDAN and Extreme Learning Machine Optimized by Sparrow Search Algorithm. Sustainability 2021, 13, 4896. [Google Scholar] [CrossRef]
- Sun, W.; Huang, C. A carbon price prediction model based on secondary decomposition algorithm and optimized back propagation neural network. J. Clean Prod. 2020, 243, 118671. [Google Scholar] [CrossRef]
- Huang, Y.; He, Z. Carbon price forecasting with optimization prediction method based on unstructured combination. Sci. Total Environ. 2020, 725, 138350. [Google Scholar] [CrossRef]
- Zhu, B.; Ye, S.; Wang, P.; He, K.; Zhang, T.; Wei, Y.-M. A novel multiscale nonlinear ensemble leaning paradigm for carbon price forecasting. Energy Econ. 2018, 70, 143–157. [Google Scholar] [CrossRef]
- Huang, Y.M.; Dai, X.Y.; Wang, Q.W.; Zhou, D. A hybrid model for carbon price forecasting using GARCH and long short-term memory network. Appl. Energy 2021, 285, 116485. [Google Scholar] [CrossRef]
- Rilling, G.; Flandrin, P.; Goncalves, P.; MLilly, J. Bivariate Empirical Mode Decomposition. IEEE Signal Proc. Lett. 2007, 14, 936–939. [Google Scholar] [CrossRef]
- Lempel, A.; Ziv, J. On the Complexity of Finite Sequences. IEEE Trans. Inf. Theory 1976, 22, 75–81. [Google Scholar] [CrossRef]
- Han, A.; Hong, Y.M.; Wang, S.Y.; Yin, X. A vector auto-regressive moving average model for interval-valued time series data. Adv. Econom. 2016, 36, 417–460. [Google Scholar]
- Xie, N.M.; Liu, S.F. Research on the non—Homogenous discrete grey model and its parameter’s properties. Syst. Eng. Electron. 2008, 30, 863–867. [Google Scholar]
- Hammoudeh, S.; Lahiani, A.; Nguyen, D.K.; Sousa, R.M. An empirical analysis of energy cost pass-through to CO2 emission prices. Energy Econ. 2015, 49, 149–156. [Google Scholar] [CrossRef]
- Leitao, J.; Ferreira, J.; Santibanez-Gonzalez, E. Green bonds, sustainable development and environmental policy in the European Union carbon market. Bus. Strategy Environ. 2021, 30, 2077–2090. [Google Scholar] [CrossRef]
- Michaelowa, A.; Michaelowa, K.; Shishlov, I.; Brescia, D. Catalysing private and public action for climate change mitigation: The World Bank’s role in international carbon markets. Clim. Policy 2020, 21, 120–132. [Google Scholar] [CrossRef]
- Lee, S.S.; Mykland, P.A. Jumps in financial makets: A new nonparametric test and jump dynamics. Rev. Financ. Stud. 2008, 21, 2535–2563. [Google Scholar] [CrossRef]
Disclaimer/Publisher’s Note: The statements, opinions and data contained in all publications are solely those of the individual author(s) and contributor(s) and not of MDPI and/or the editor(s). MDPI and/or the editor(s) disclaim responsibility for any injury to people or property resulting from any ideas, methods, instructions or products referred to in the content. |
© 2023 by the authors. Licensee MDPI, Basel, Switzerland. This article is an open access article distributed under the terms and conditions of the Creative Commons Attribution (CC BY) license (https://creativecommons.org/licenses/by/4.0/).