


The Analysis of Risk Measurement and Association in China’s Financial Sector Using the Tail Risk Spillover Network
Abstract
:1. Introduction
2. Data Description
3. Research Methods
3.1. Risk Spillover Measure
3.1.1. Marginal Distribution Fitting: The GARCH Model
3.1.2. Tail Dependence Measure: SJR-Copula Model
3.1.3. Risk Spillover Measure: CoVaR Model
3.2. Risk Spillover Networks
3.3. Research on Network Generation and Evolutionary Mechanisms
3.3.1. Structure-Dependent Effects
3.3.2. Time-Dependent Effects
3.3.3. Network Node Properties
4. Empirical Results
4.1. Measurements of Systemic Risk Spillover Effects from Financial Institutions
4.1.1. Marginal Distribution Model Fitting Results
4.1.2. Results of the Tail Dependence Measures
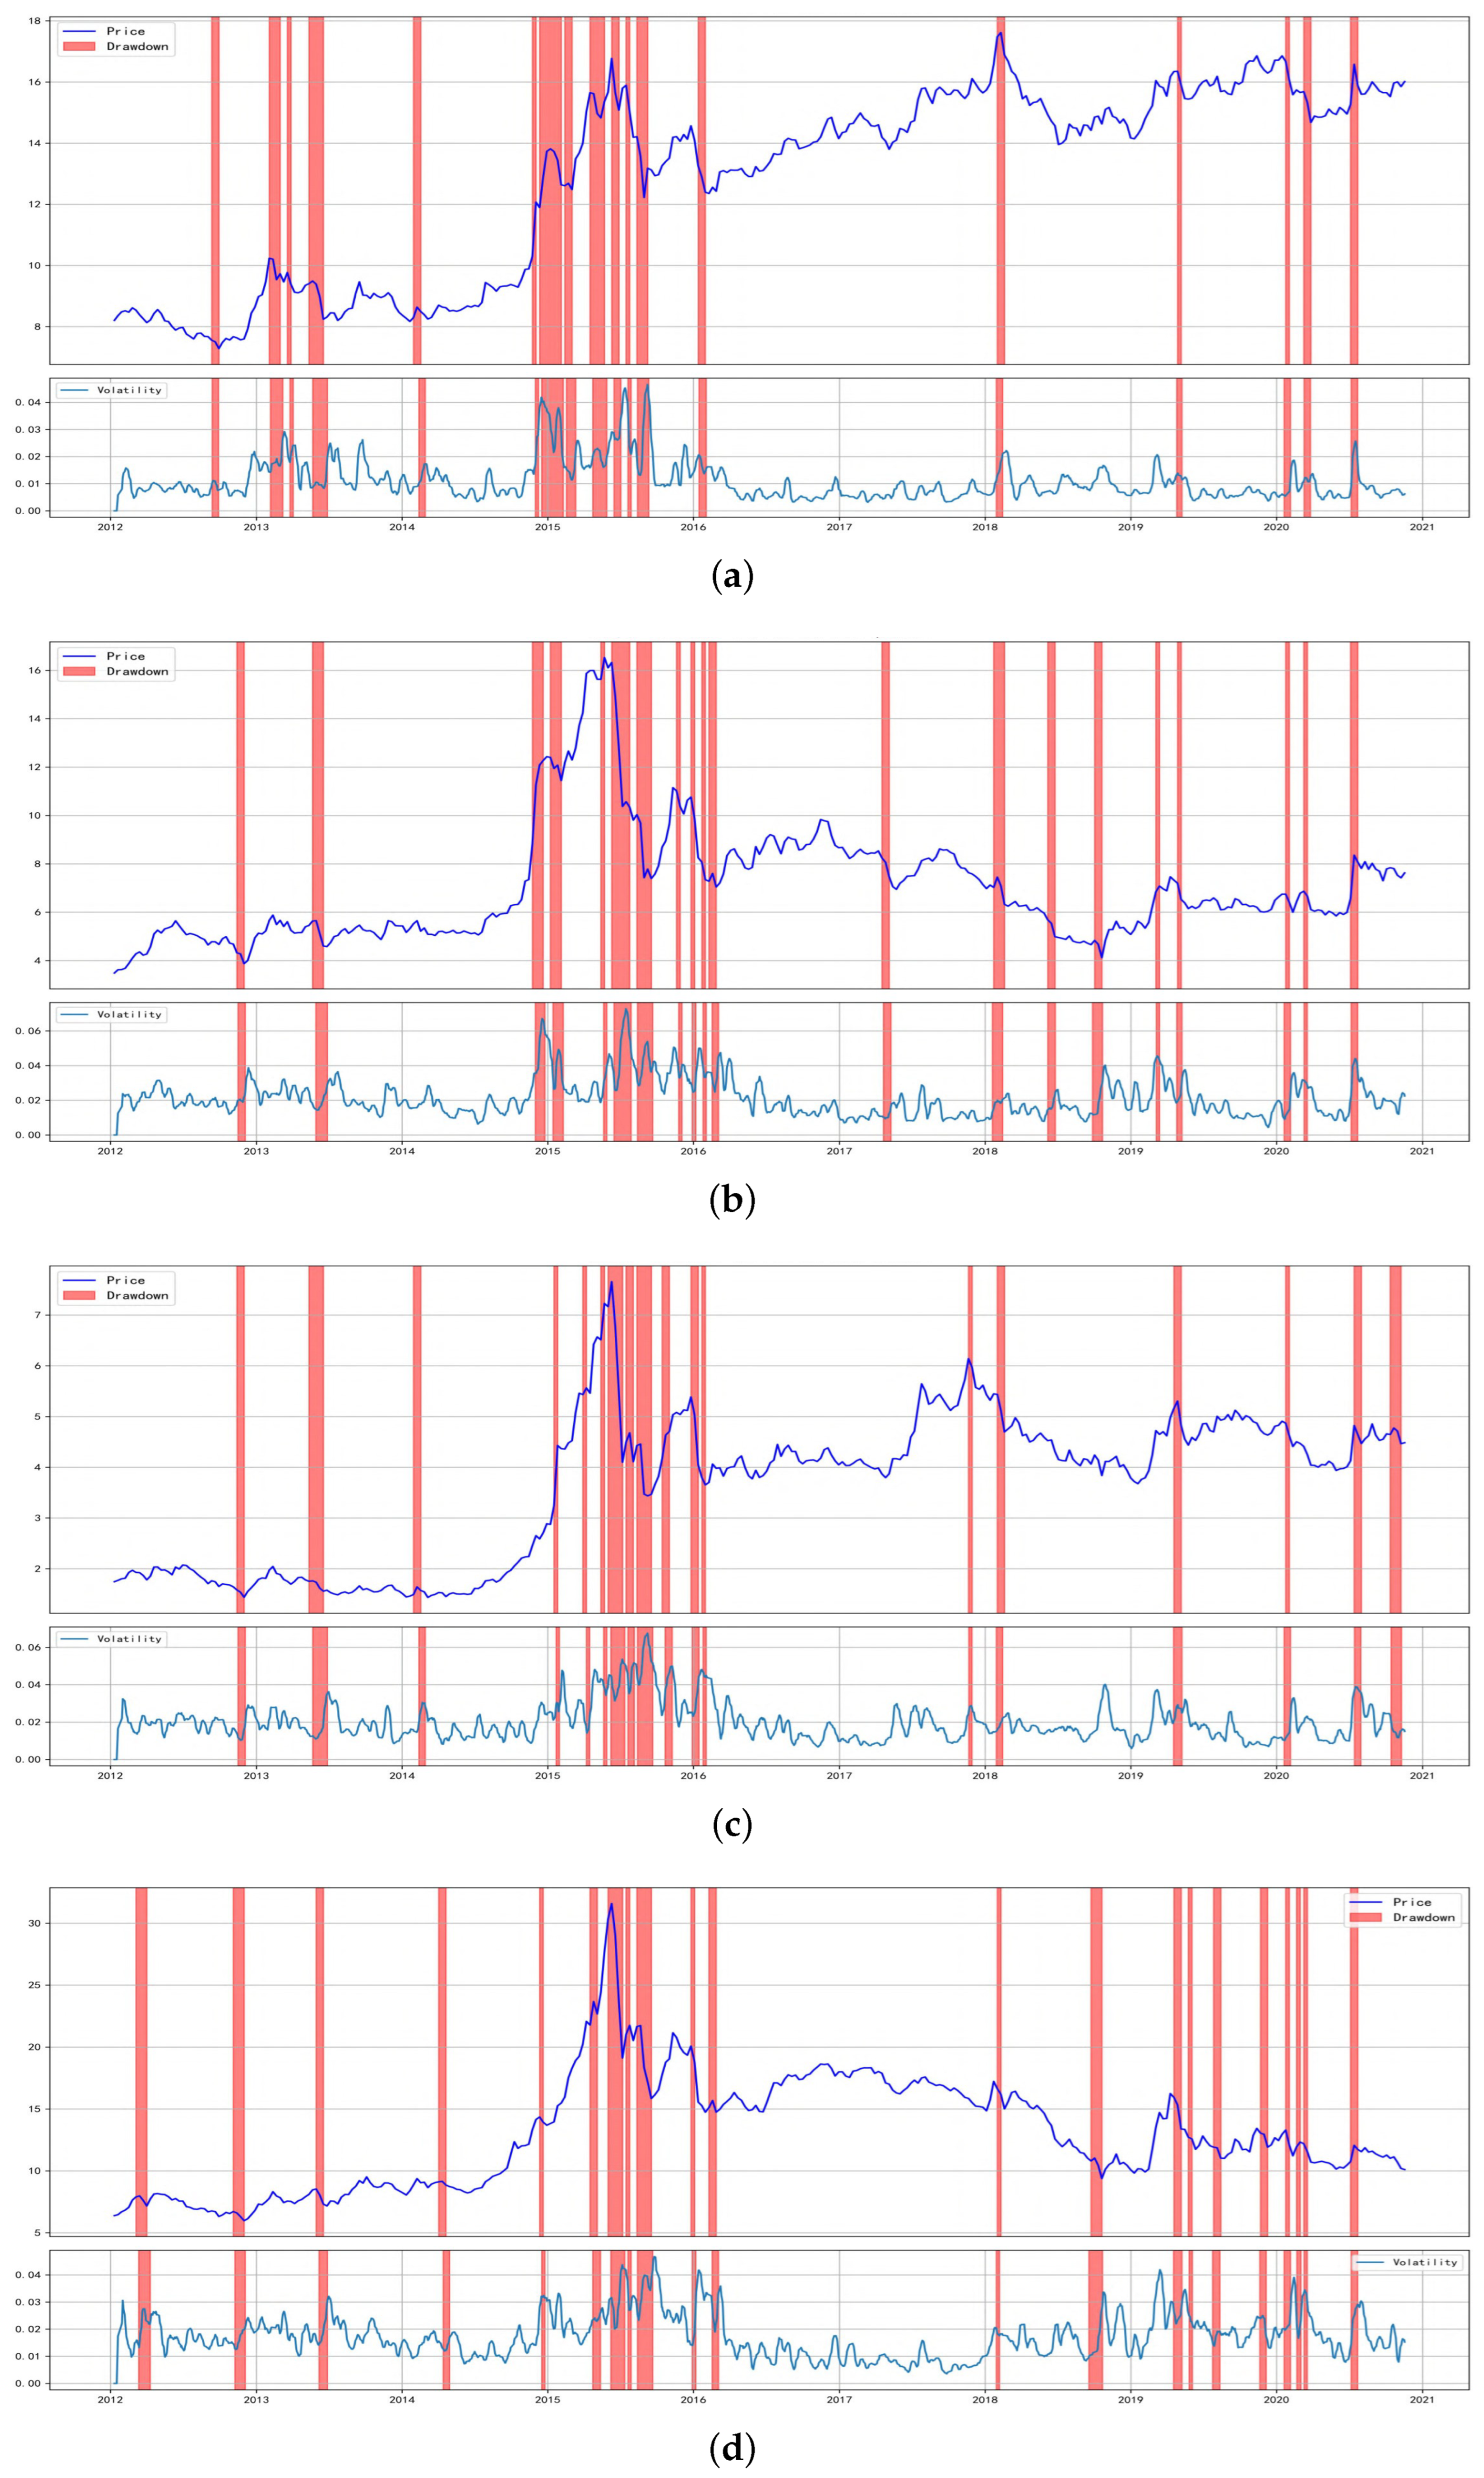
Definition and Identification of Extreme Scenarios
The Tail Dependence among Financial Sectors
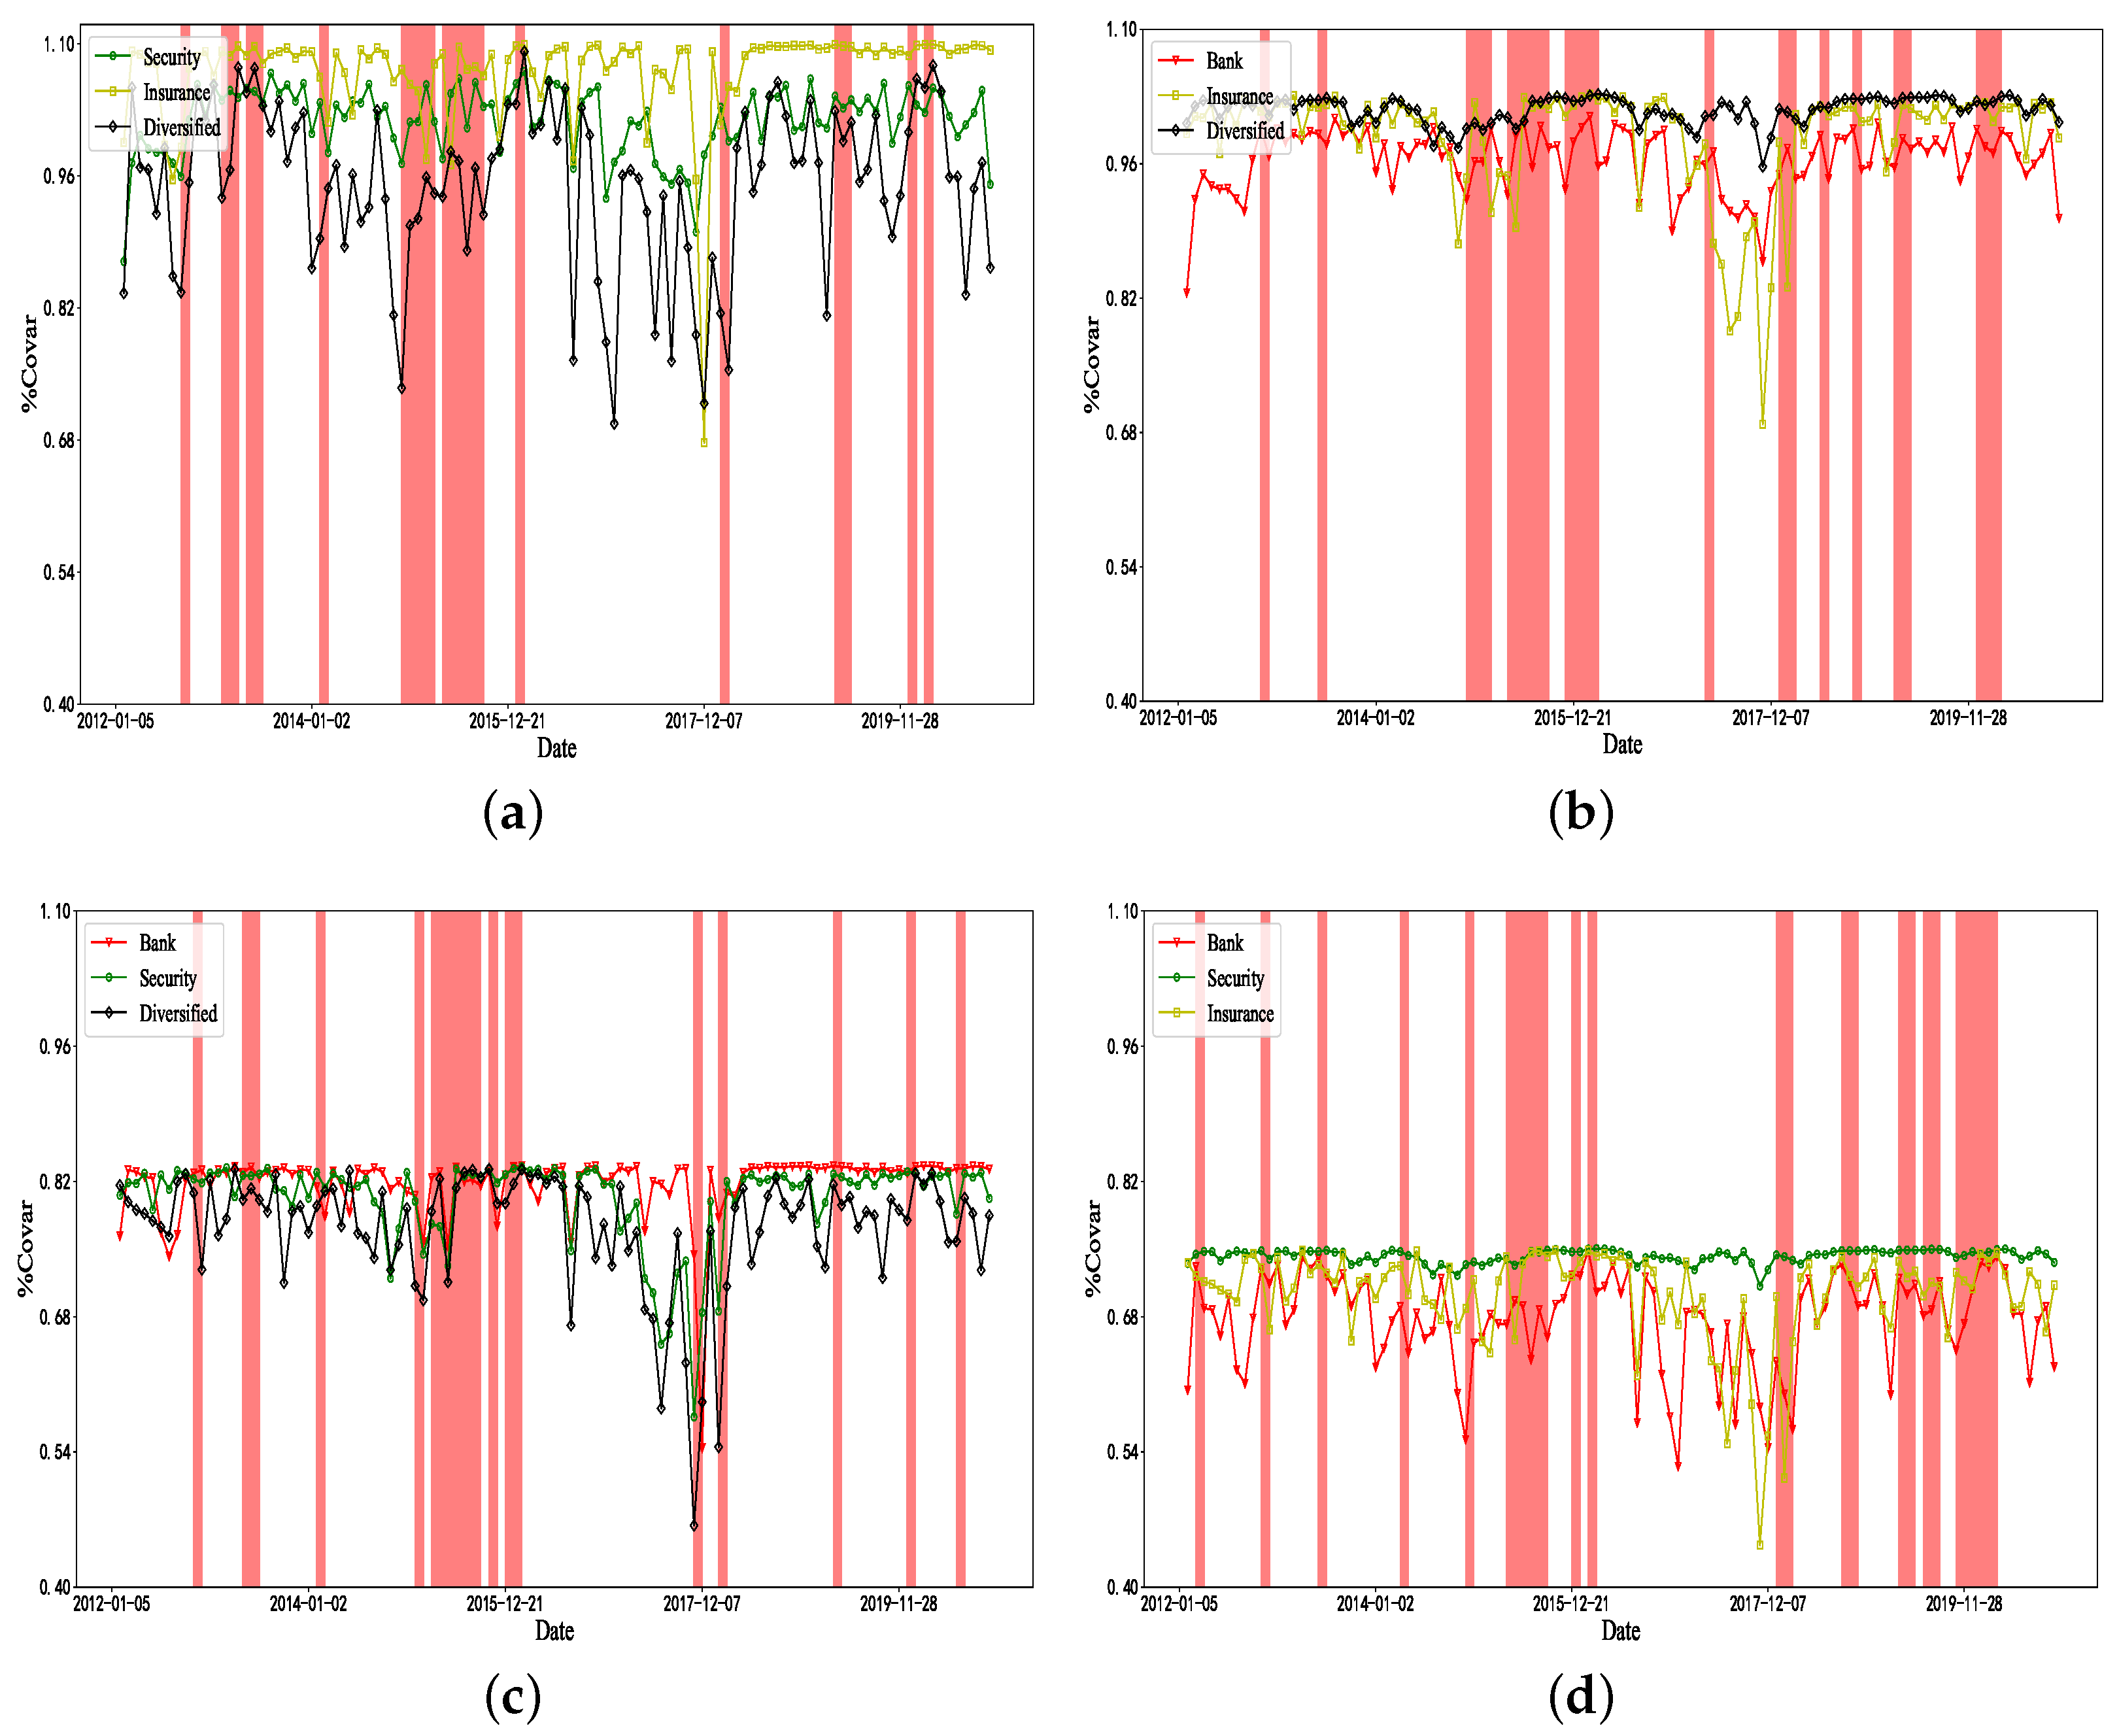
4.1.3. Financial Institution Risk Spillover Subsector Measures
4.1.4. Financial Institution Risk Spillover Subinstitutional Measures
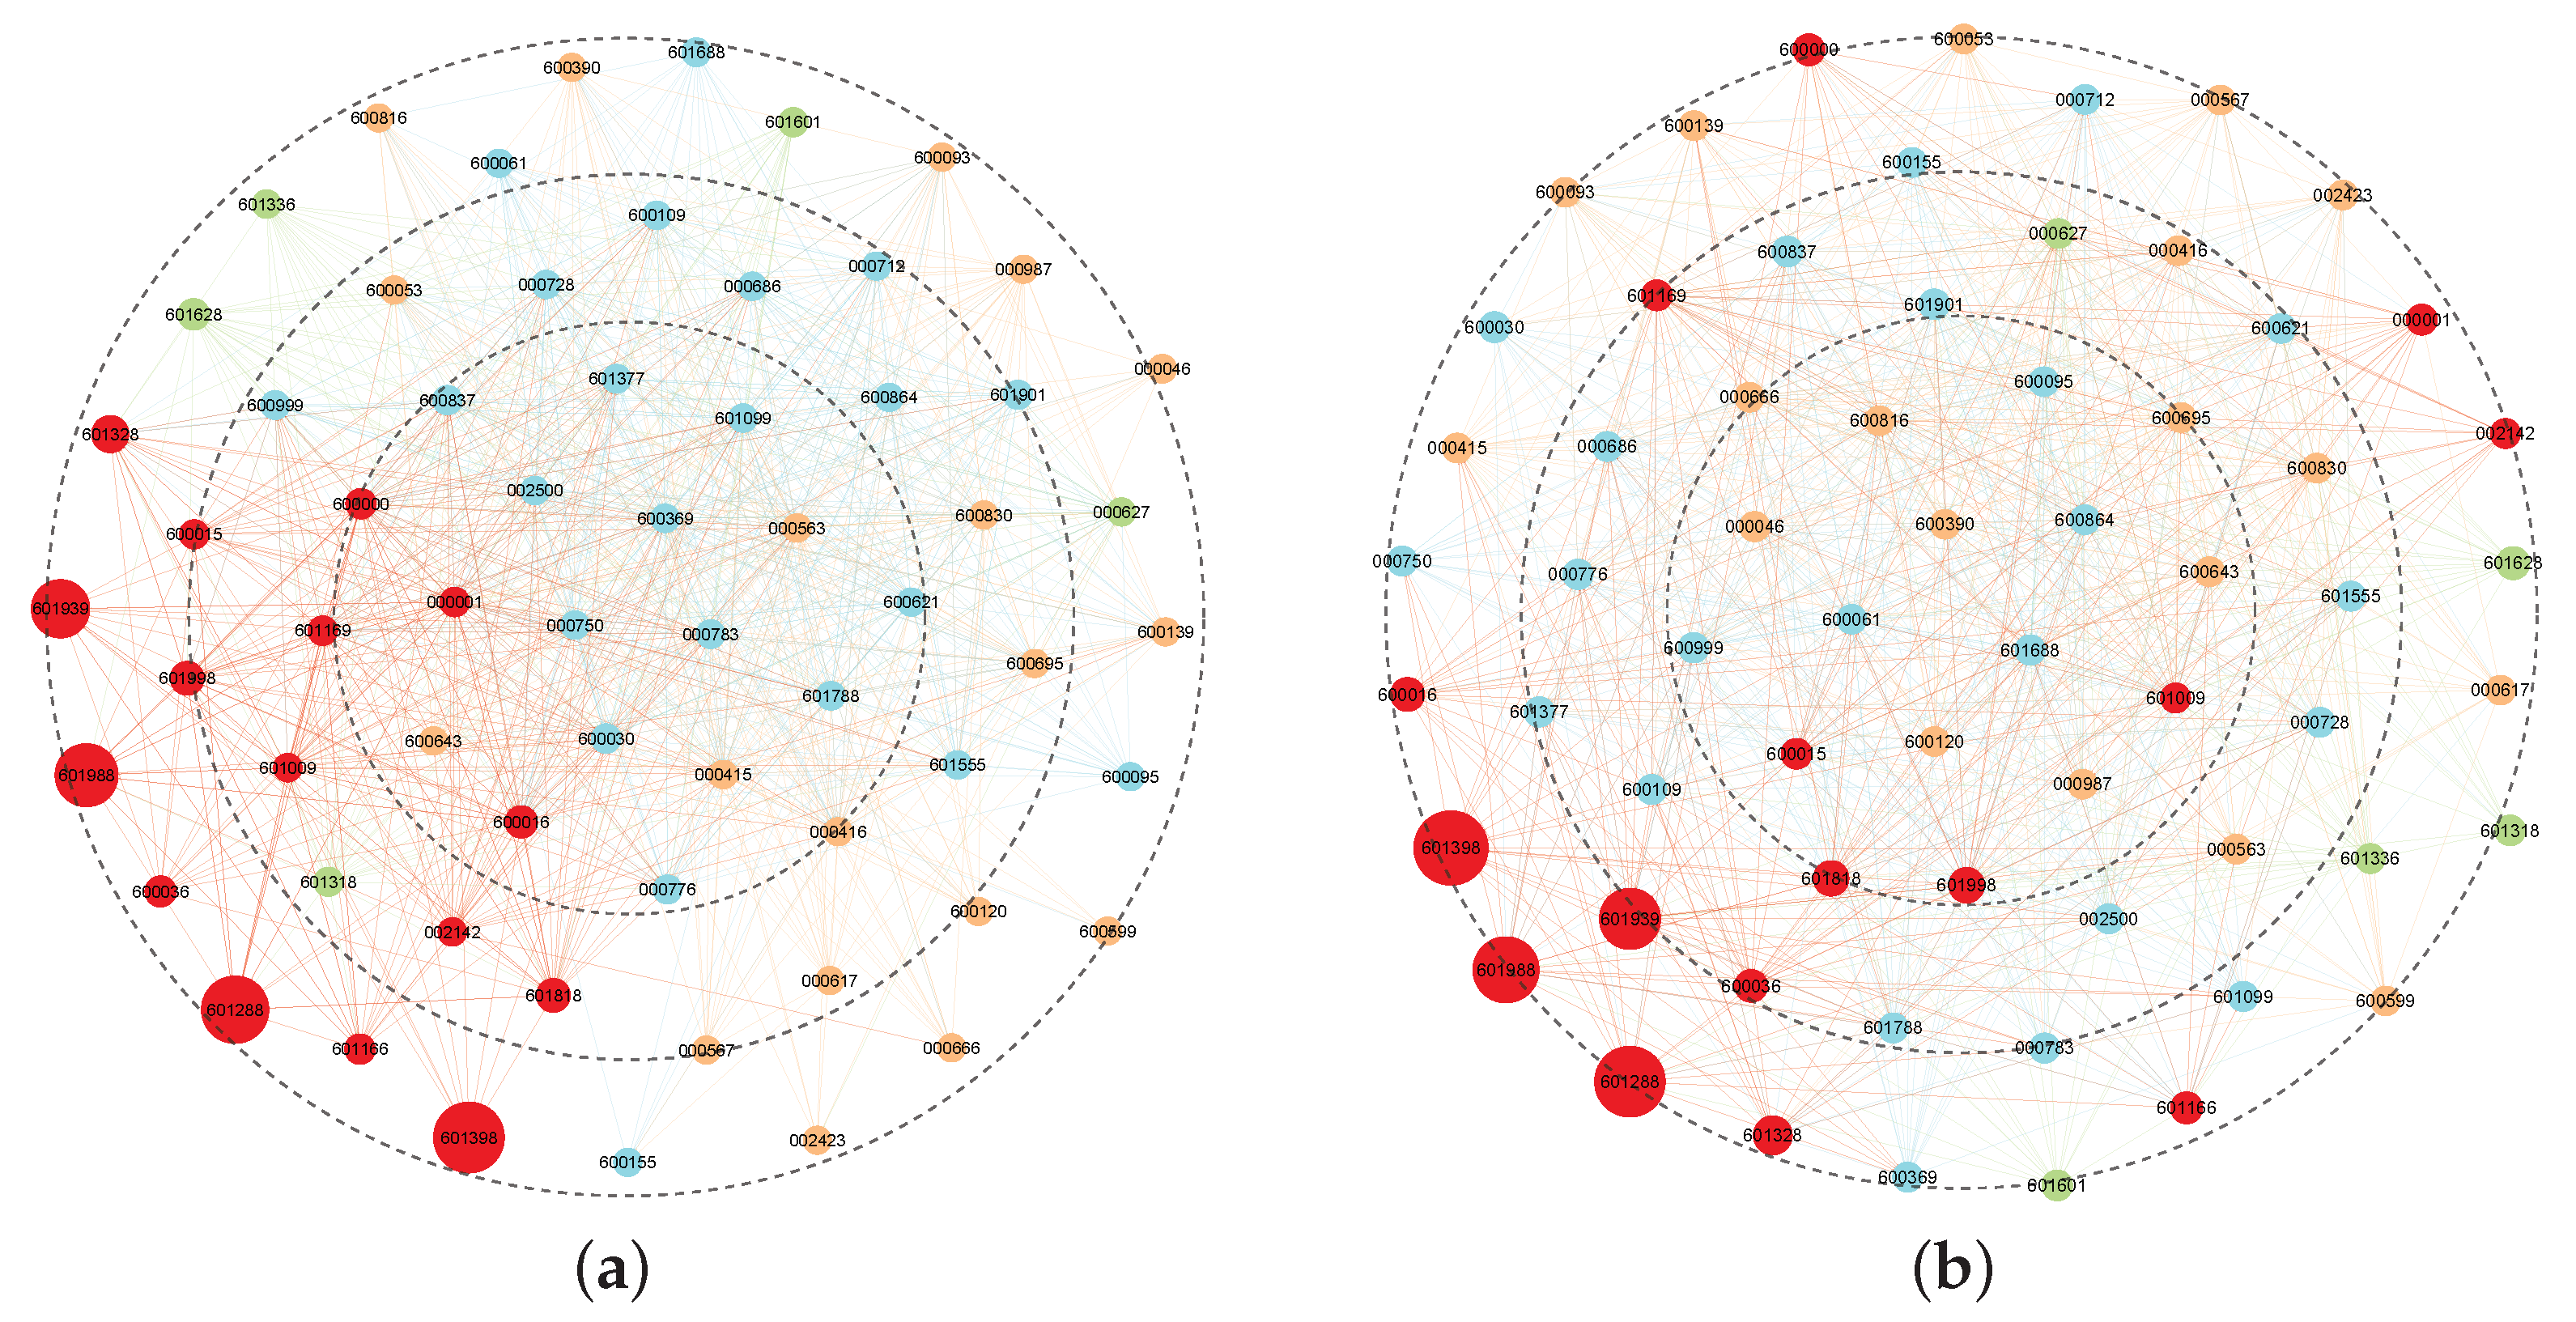
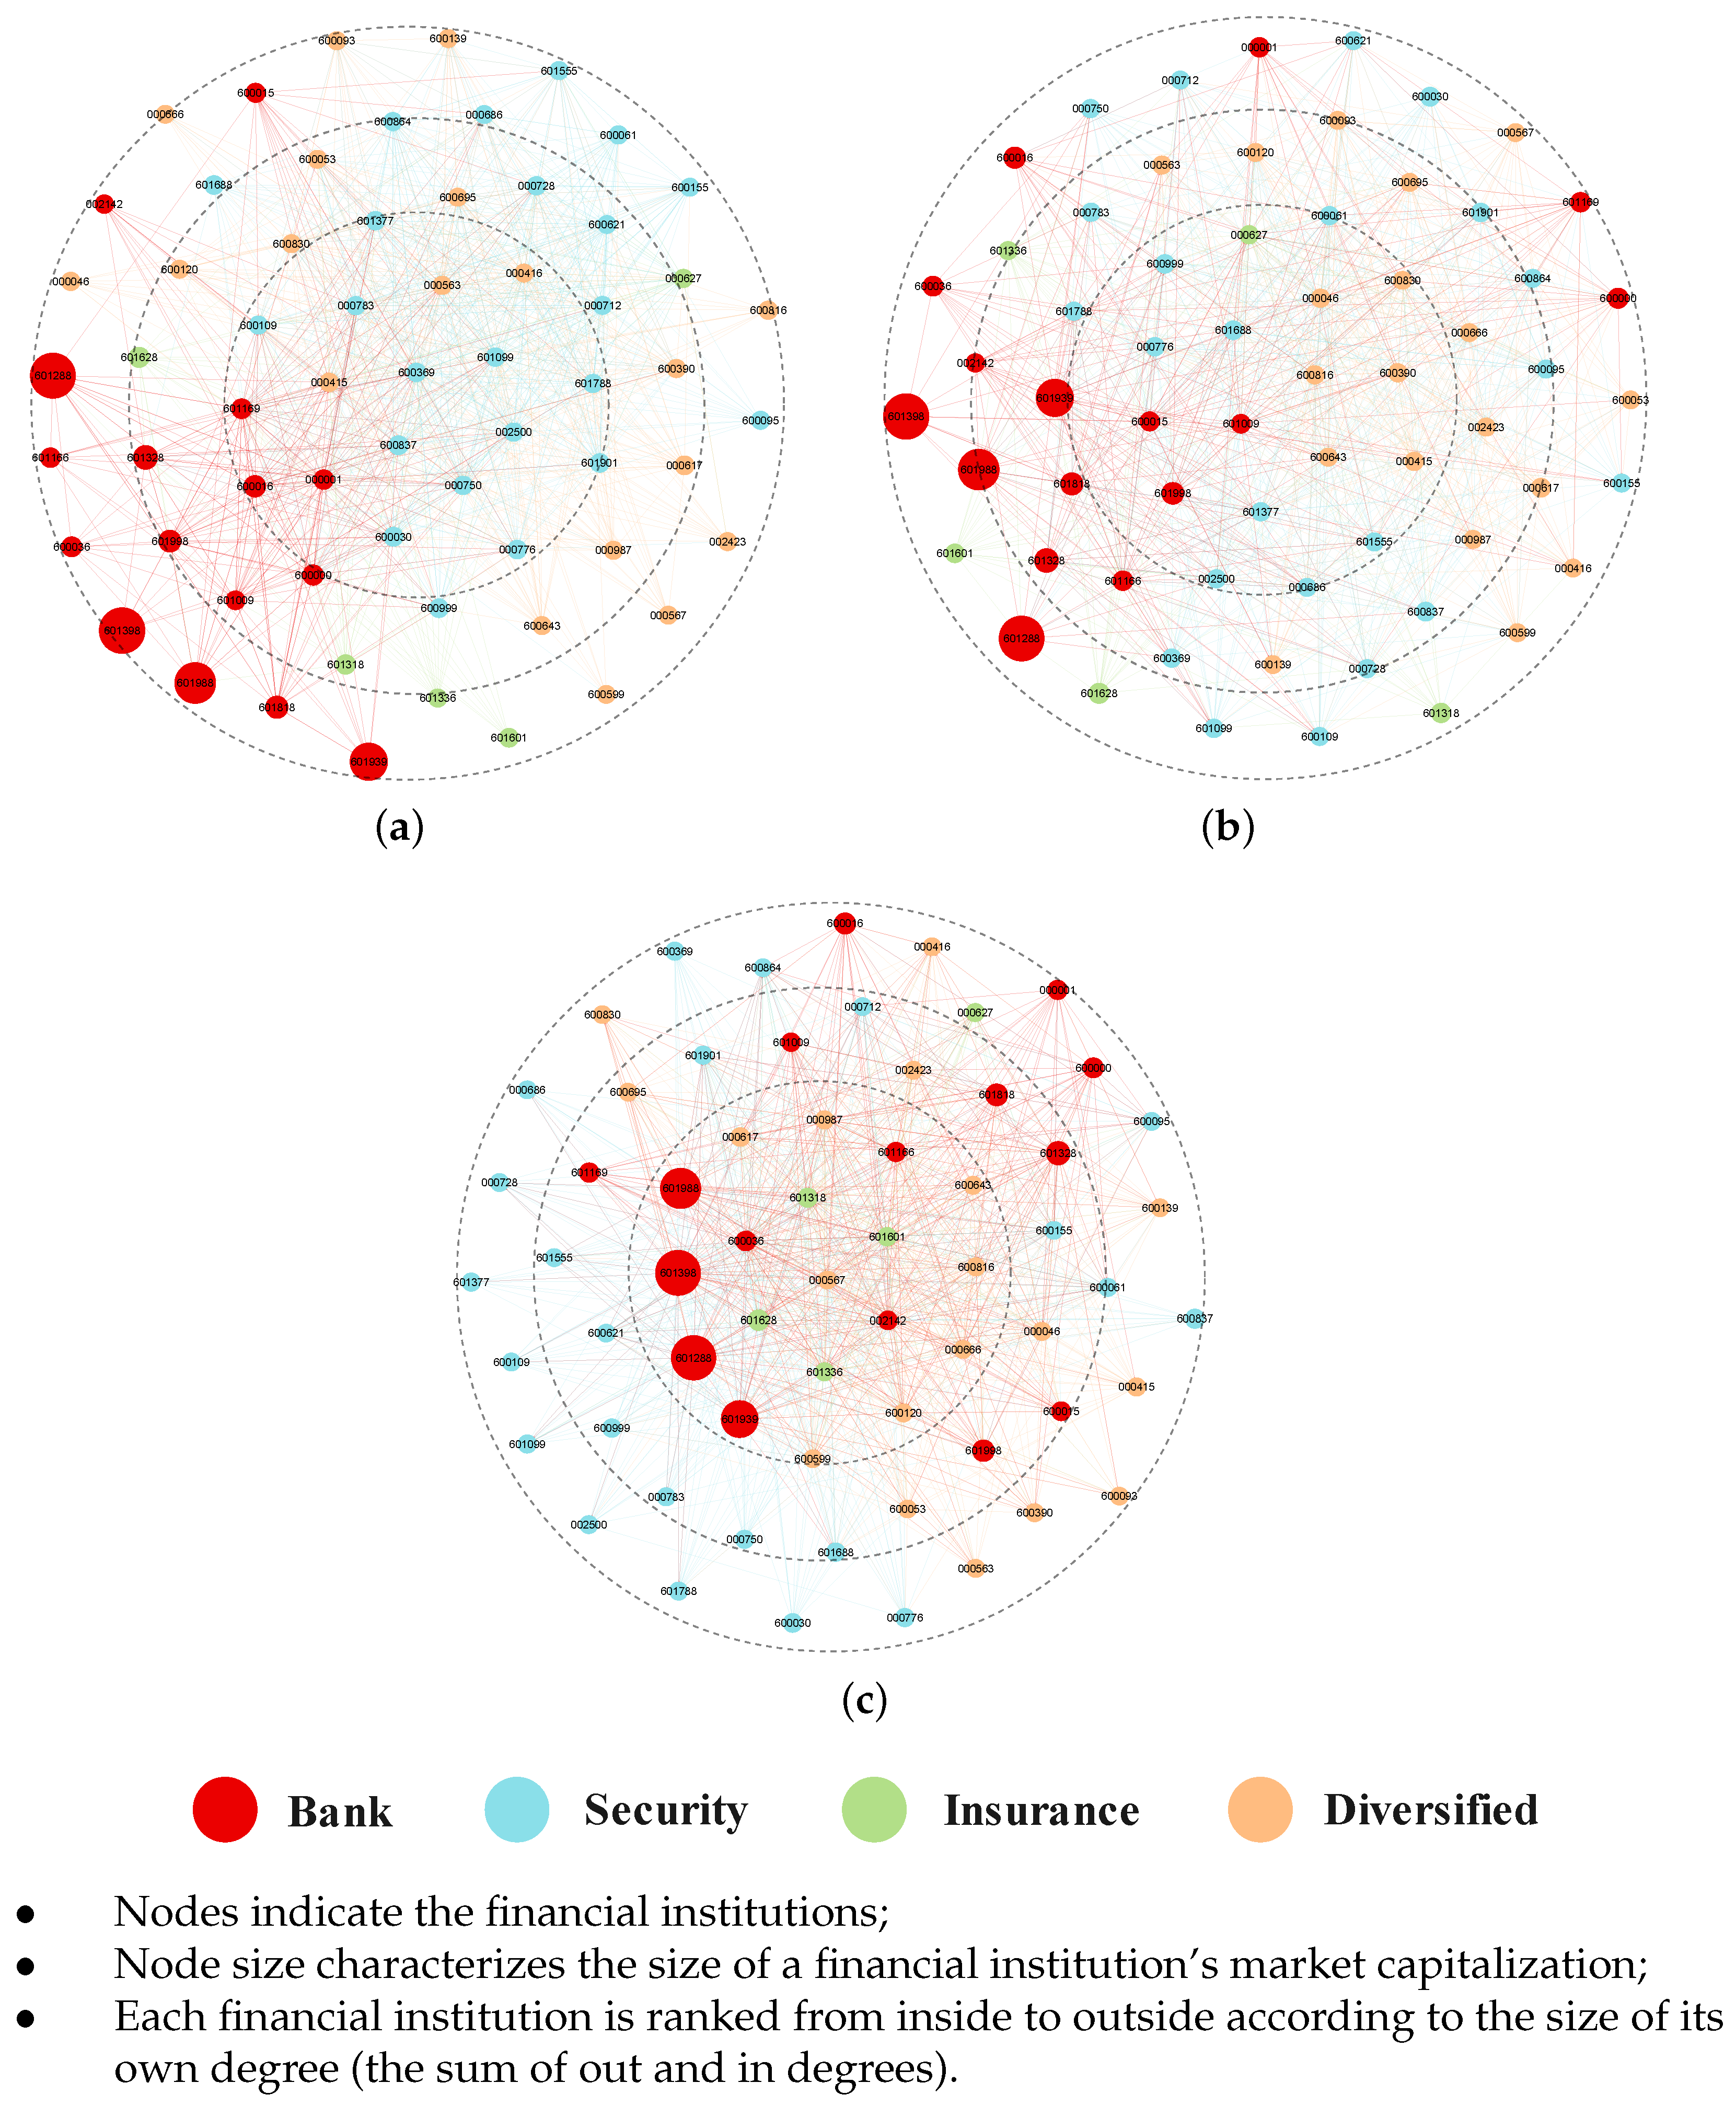
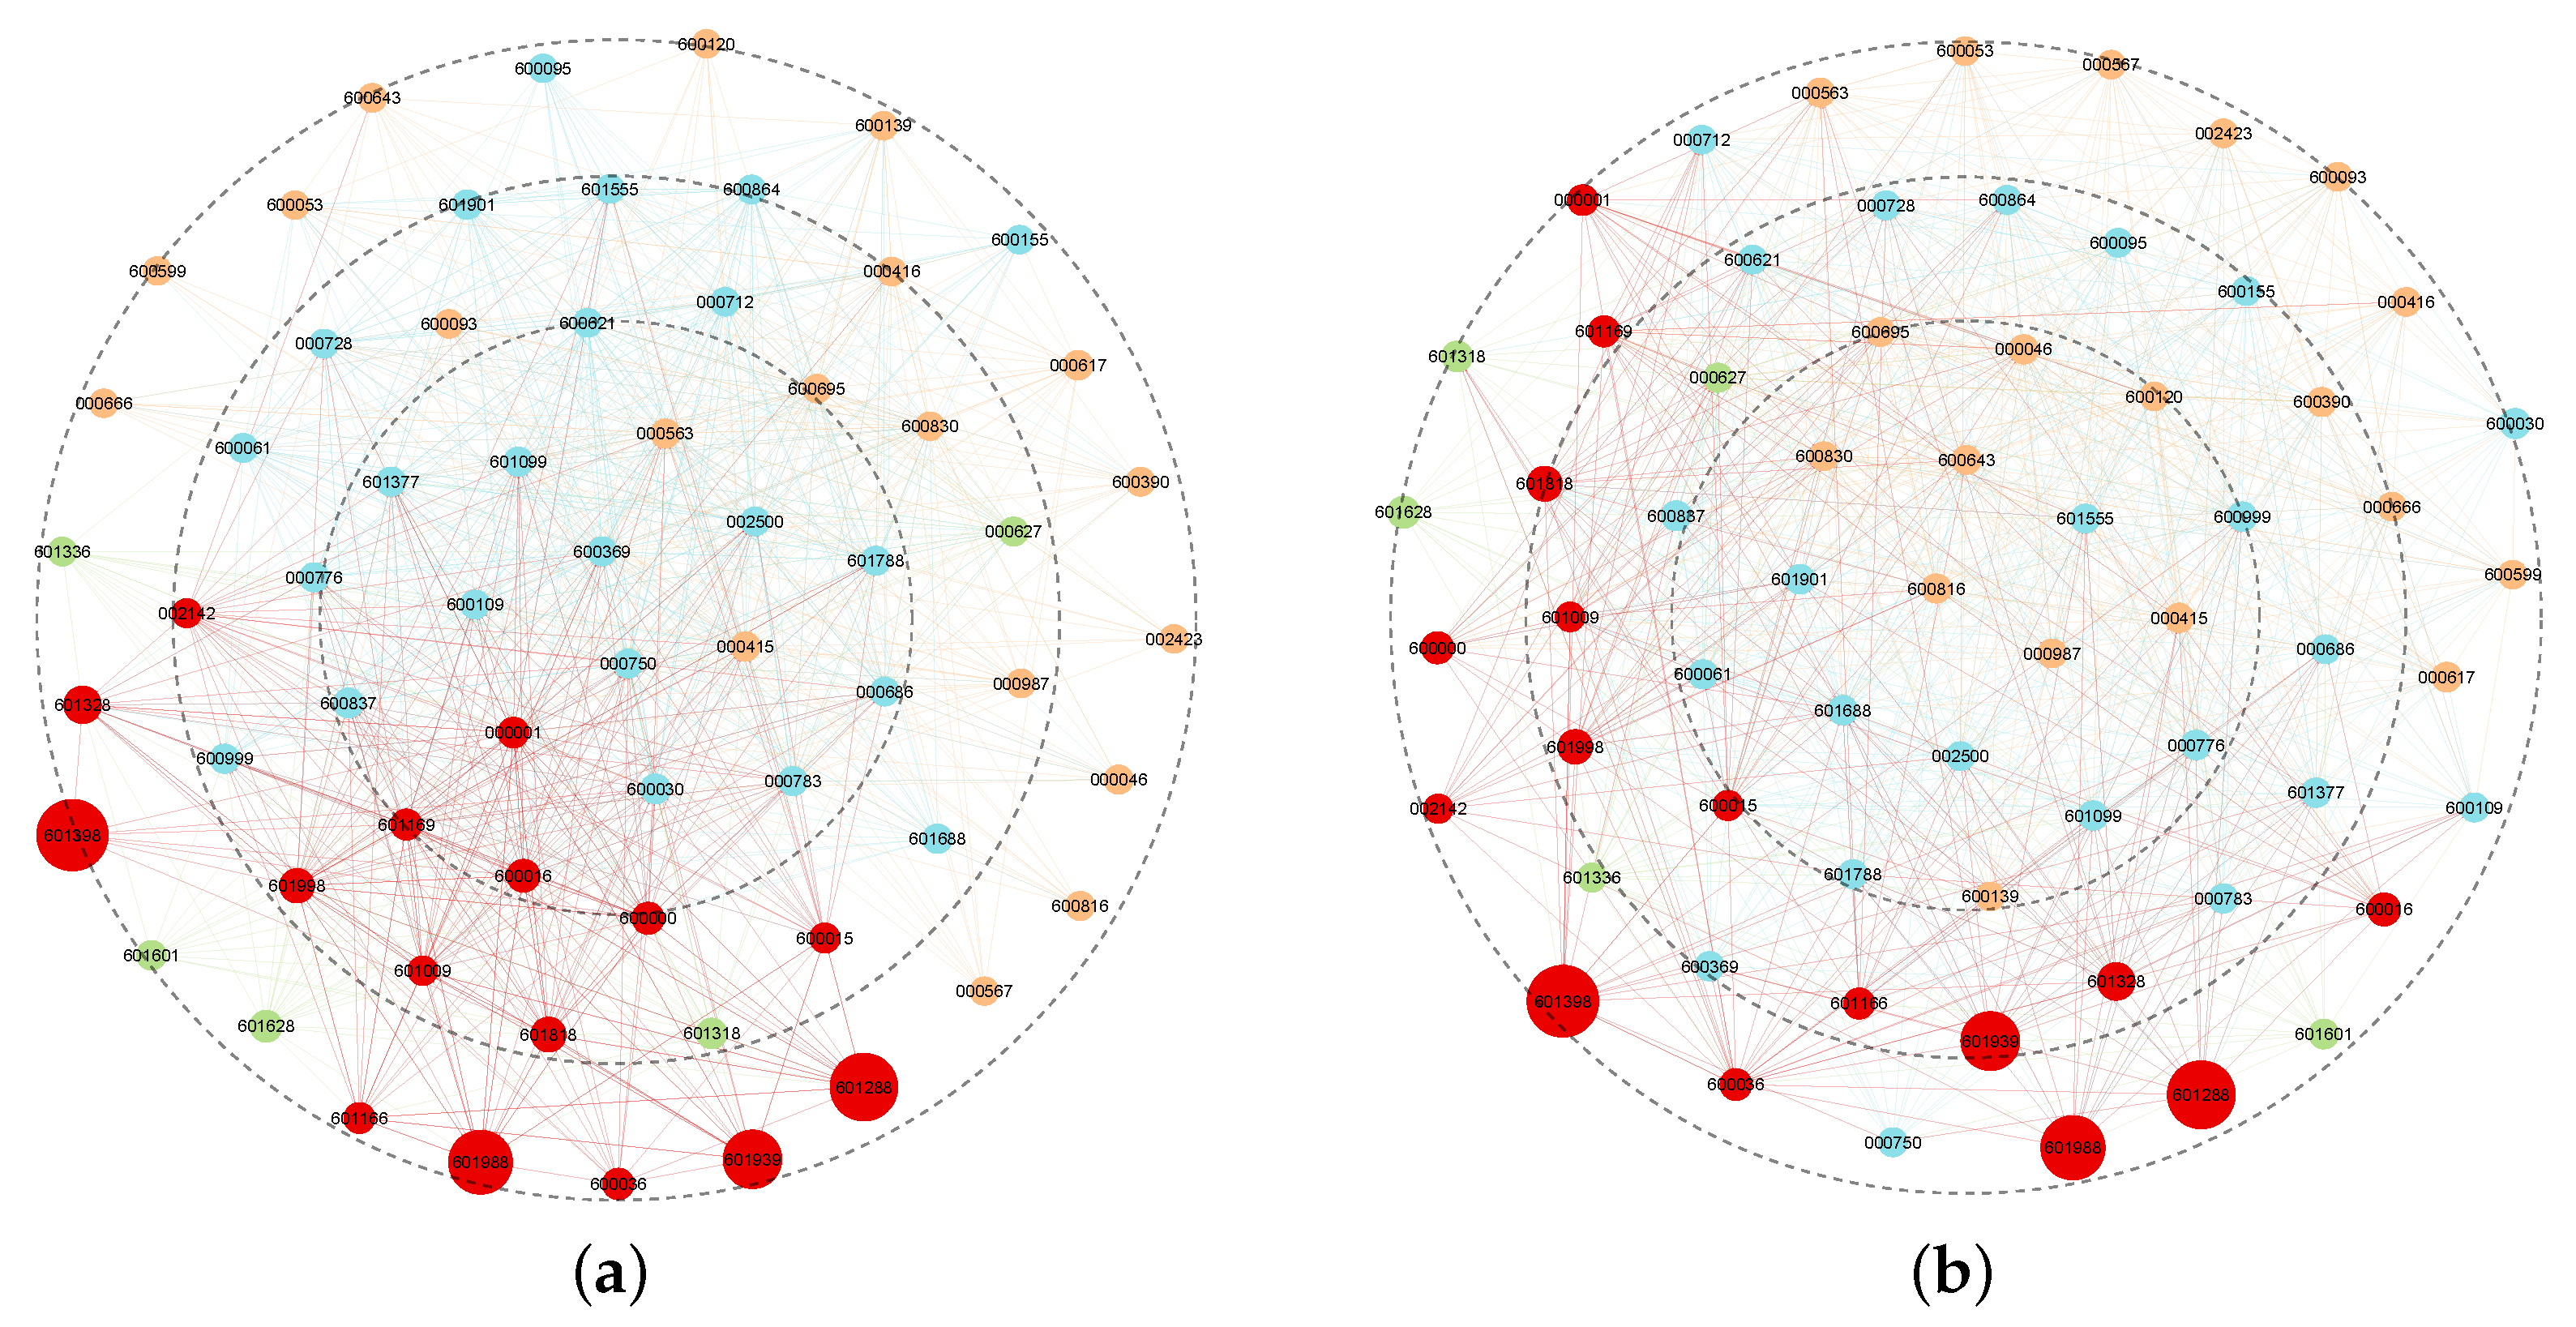
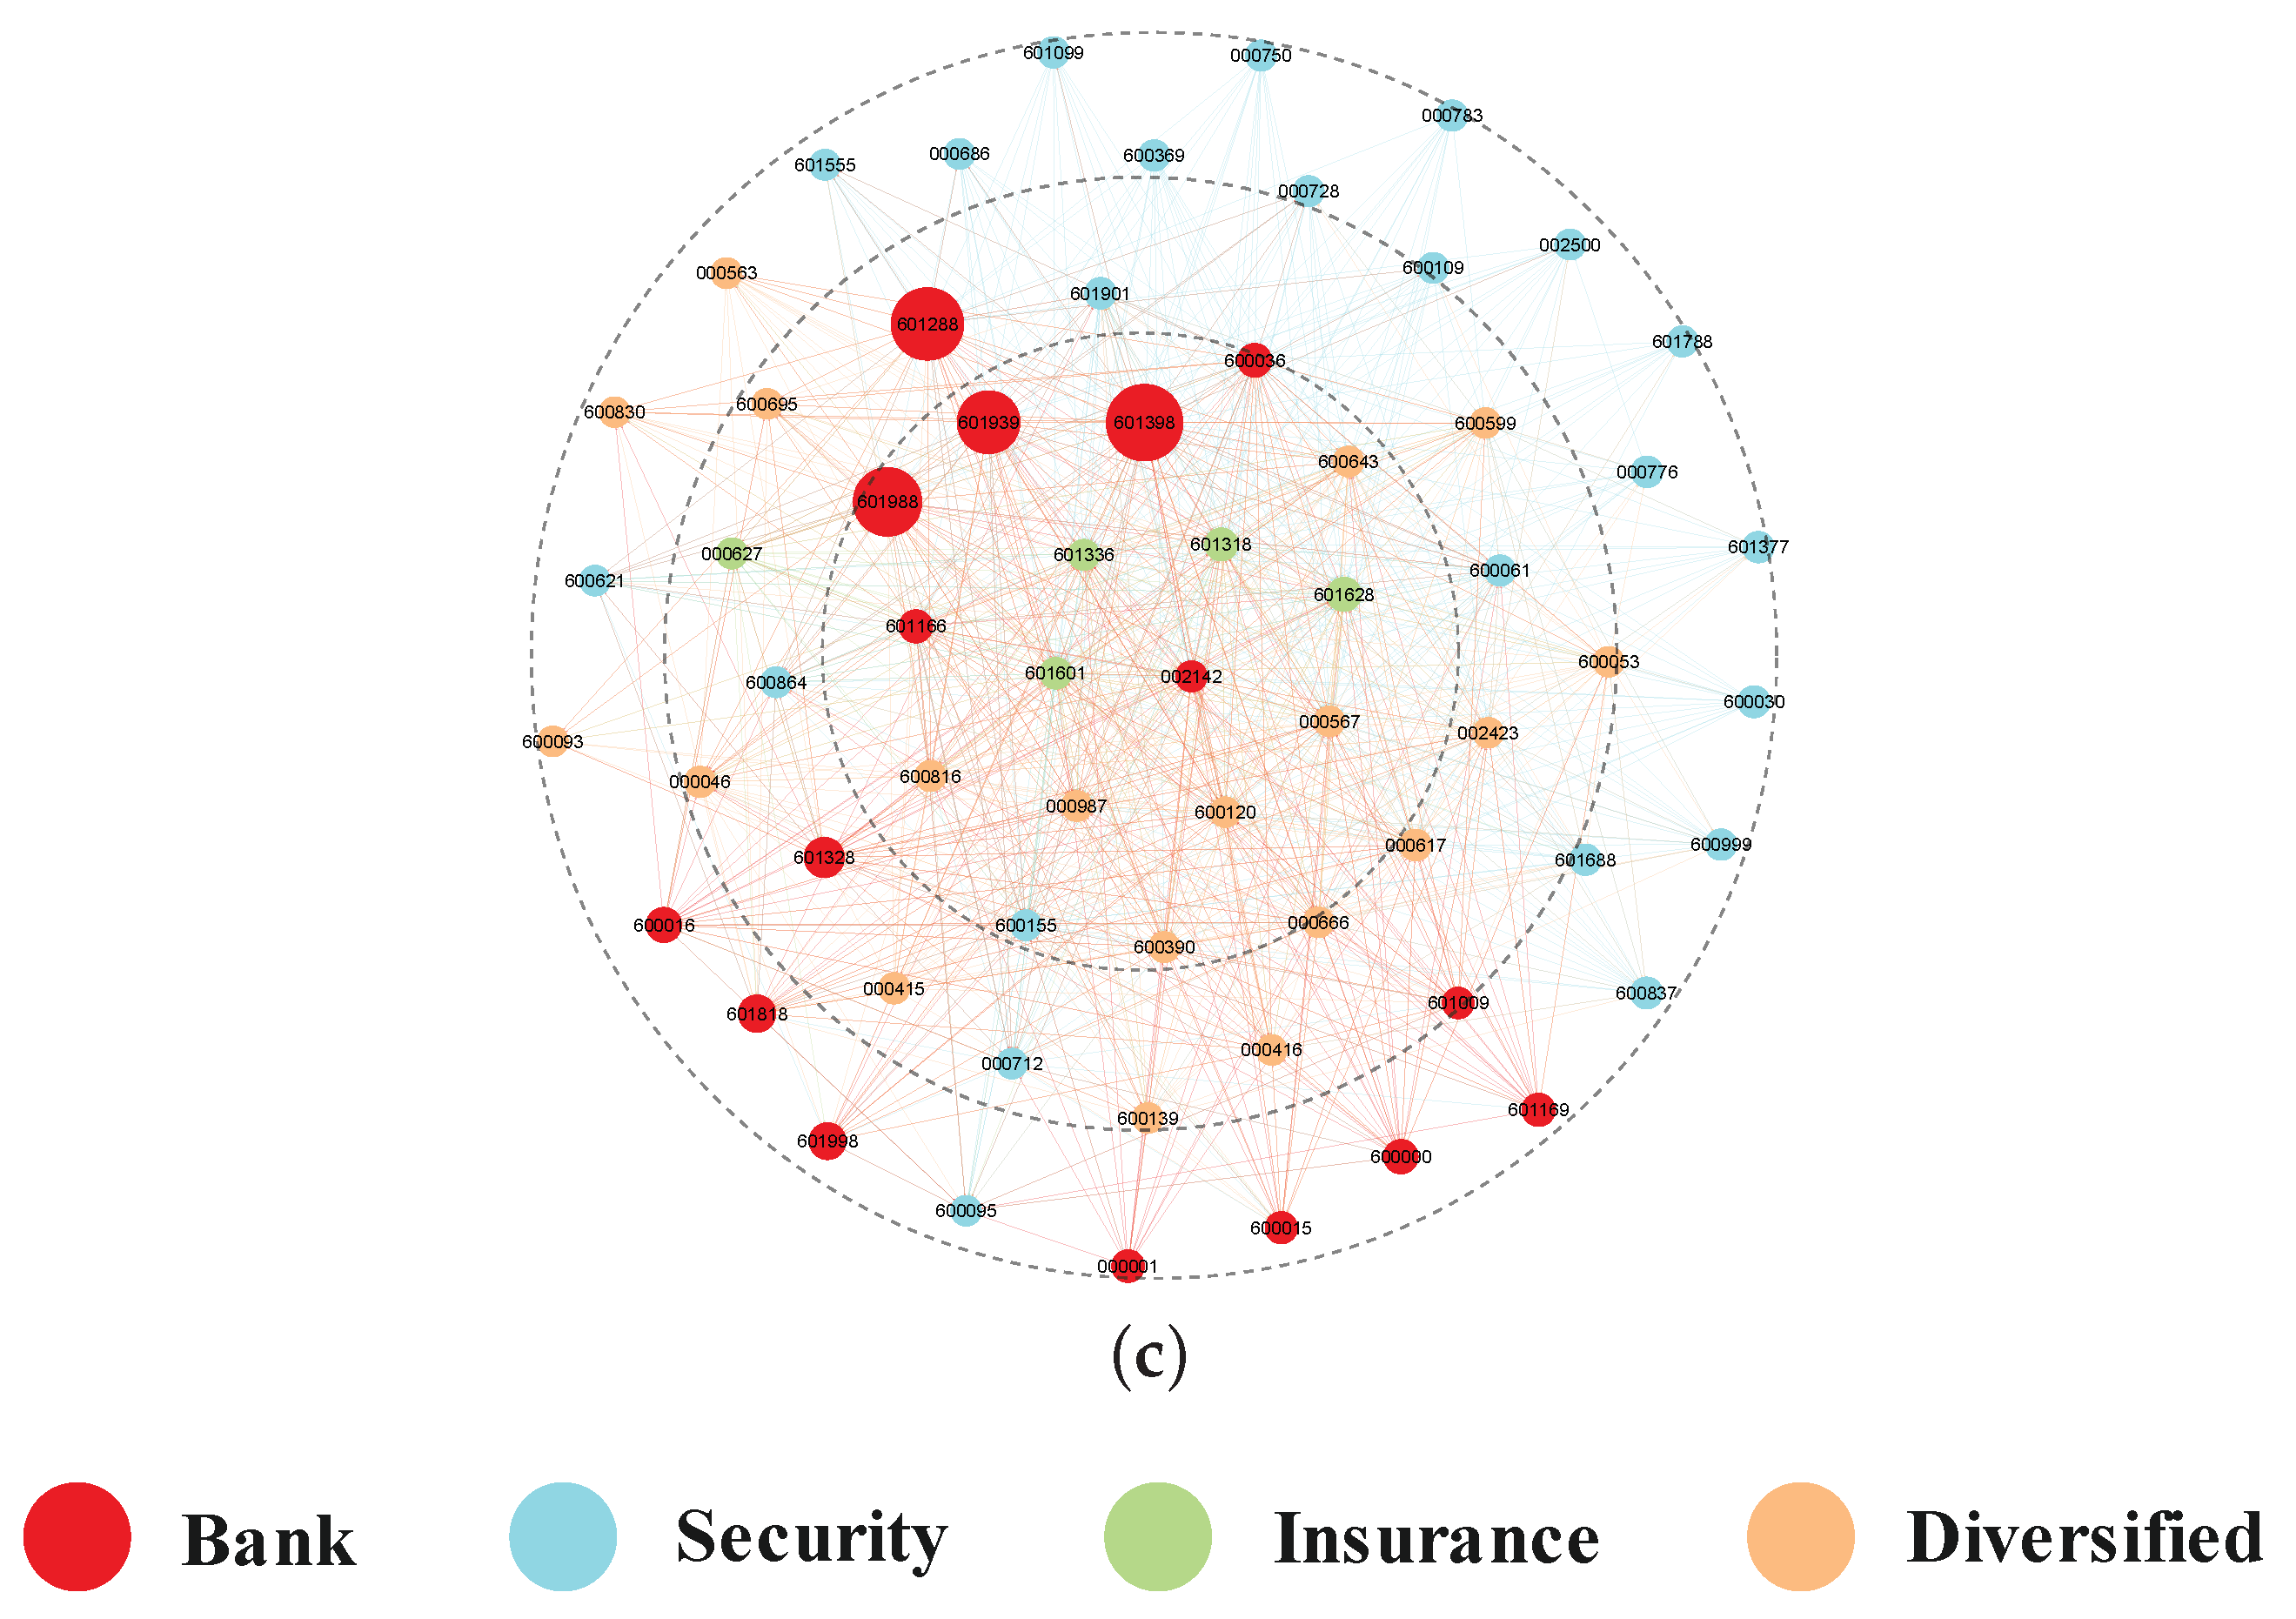
4.2. Risk Spillover Networks for Financial Institutions
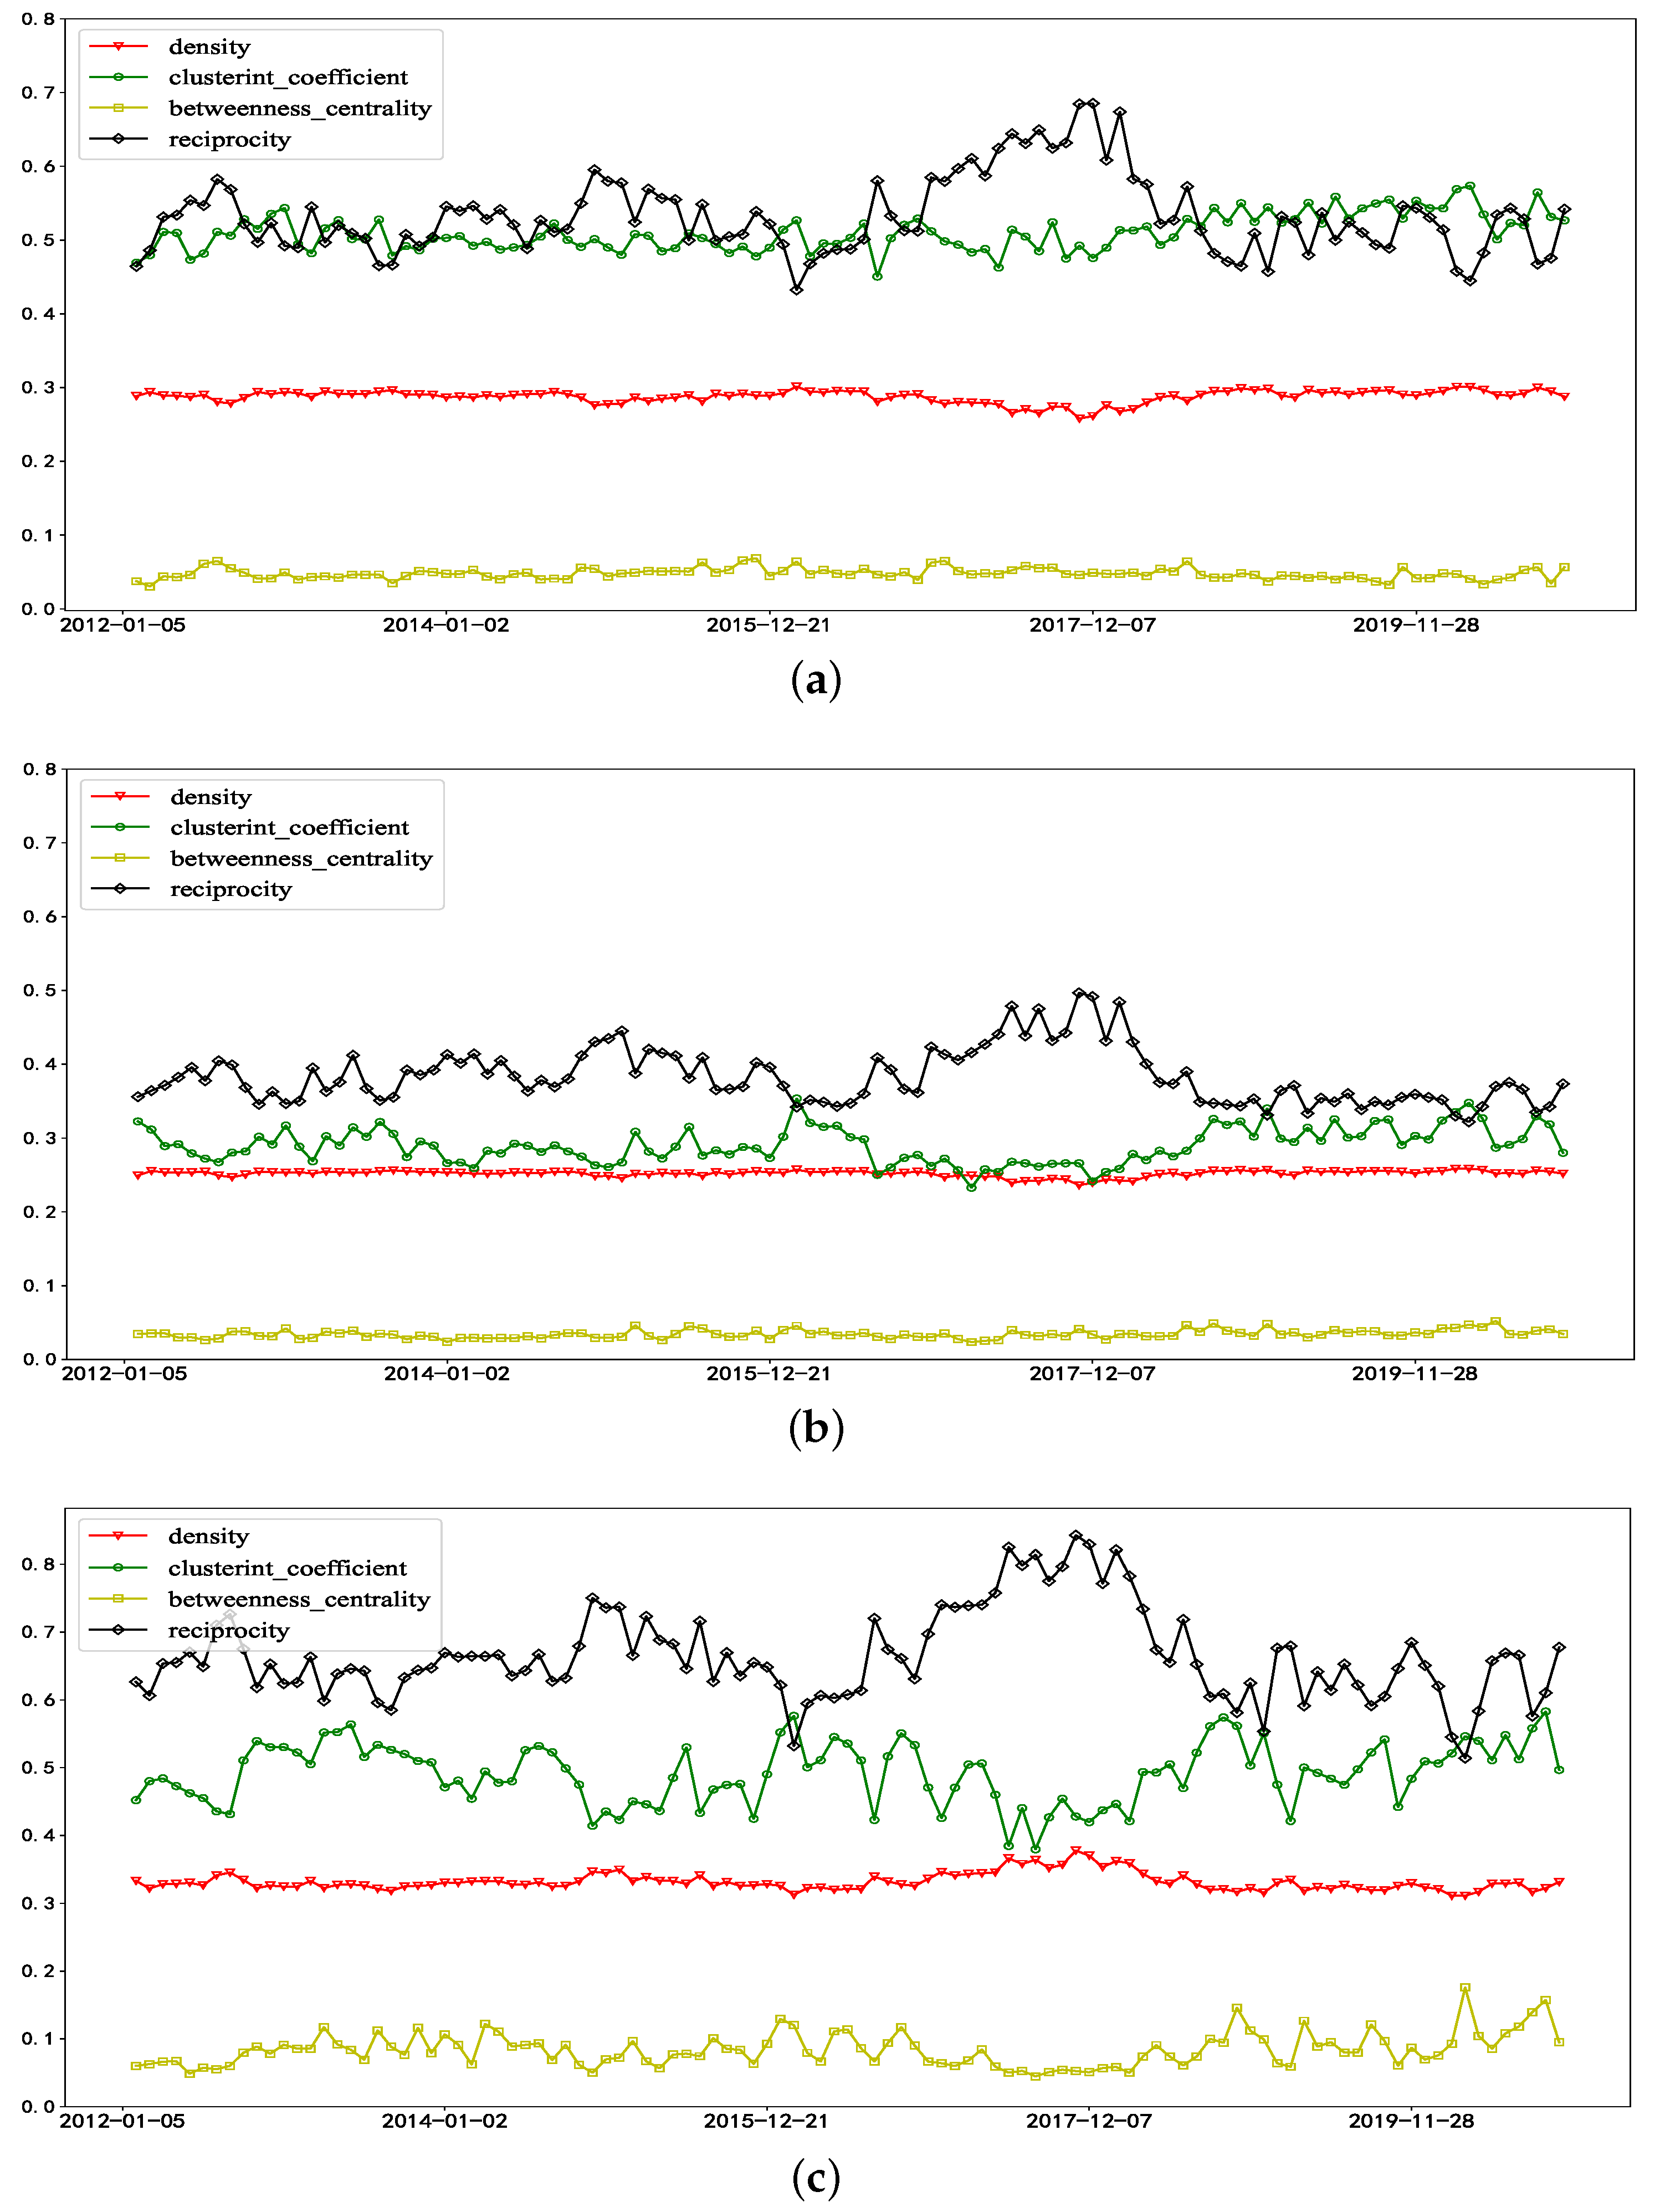
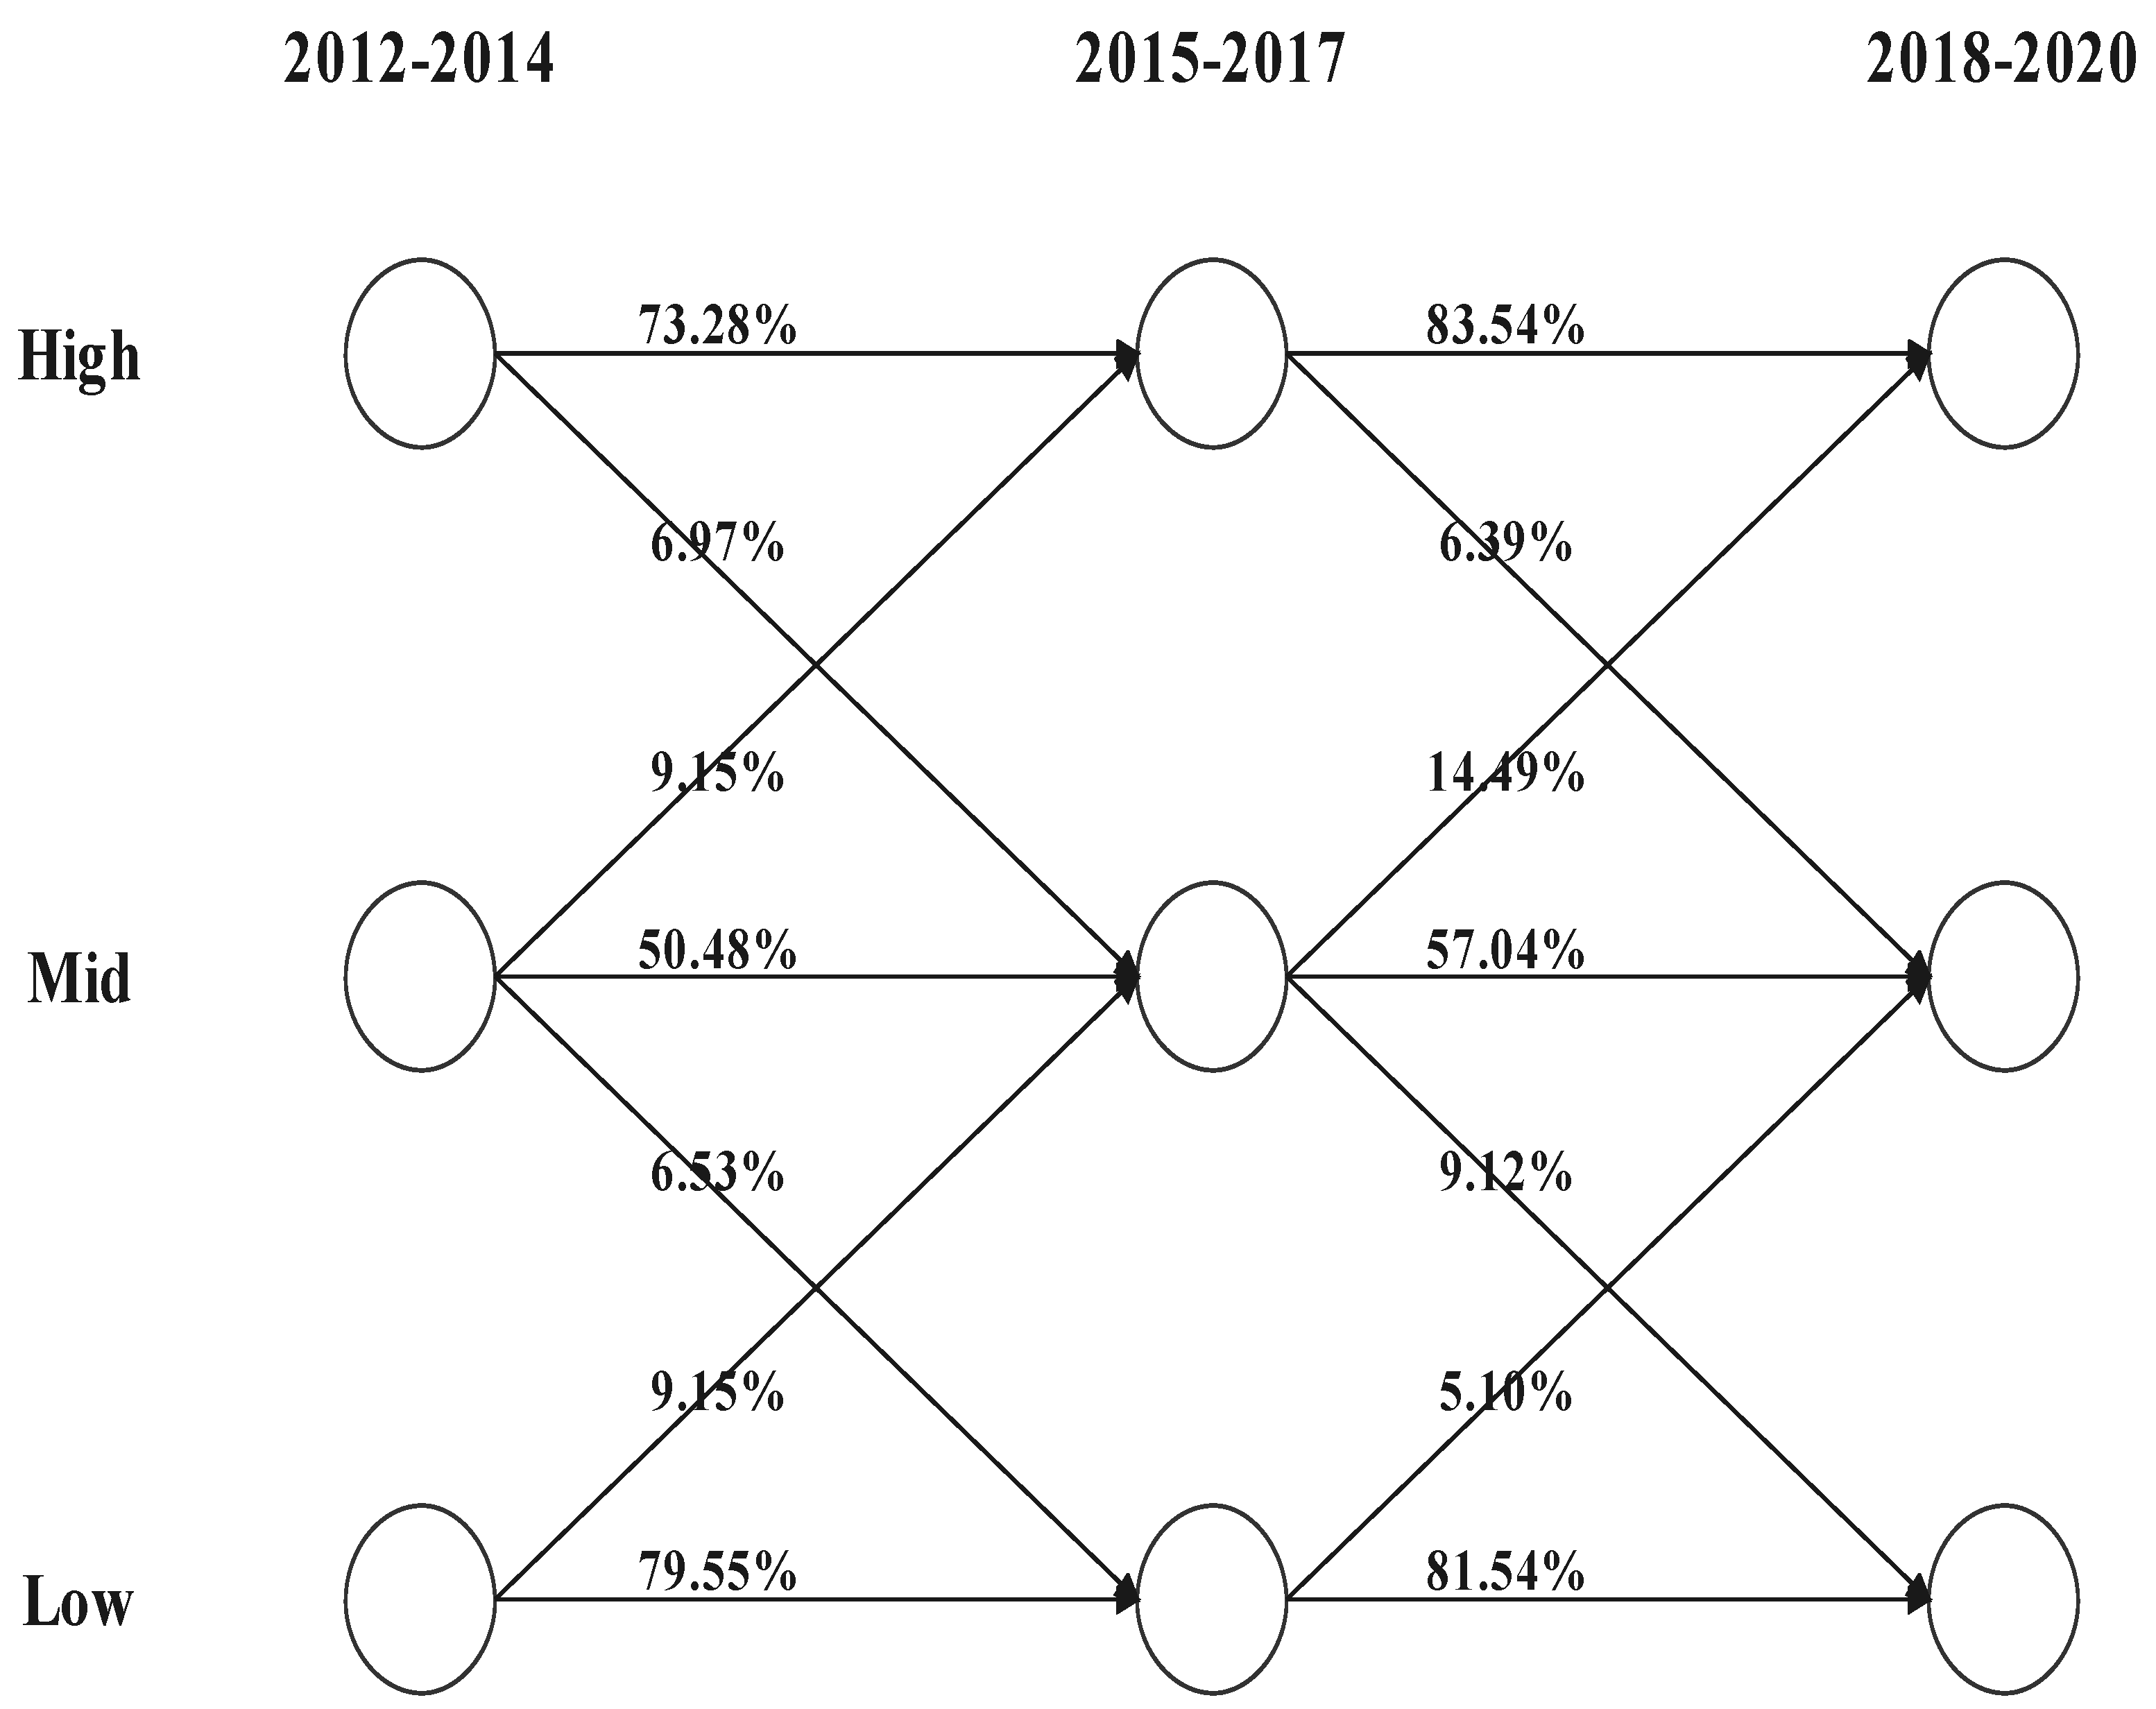
4.2.1. Evolution Analysis of Multistage Network Association Features
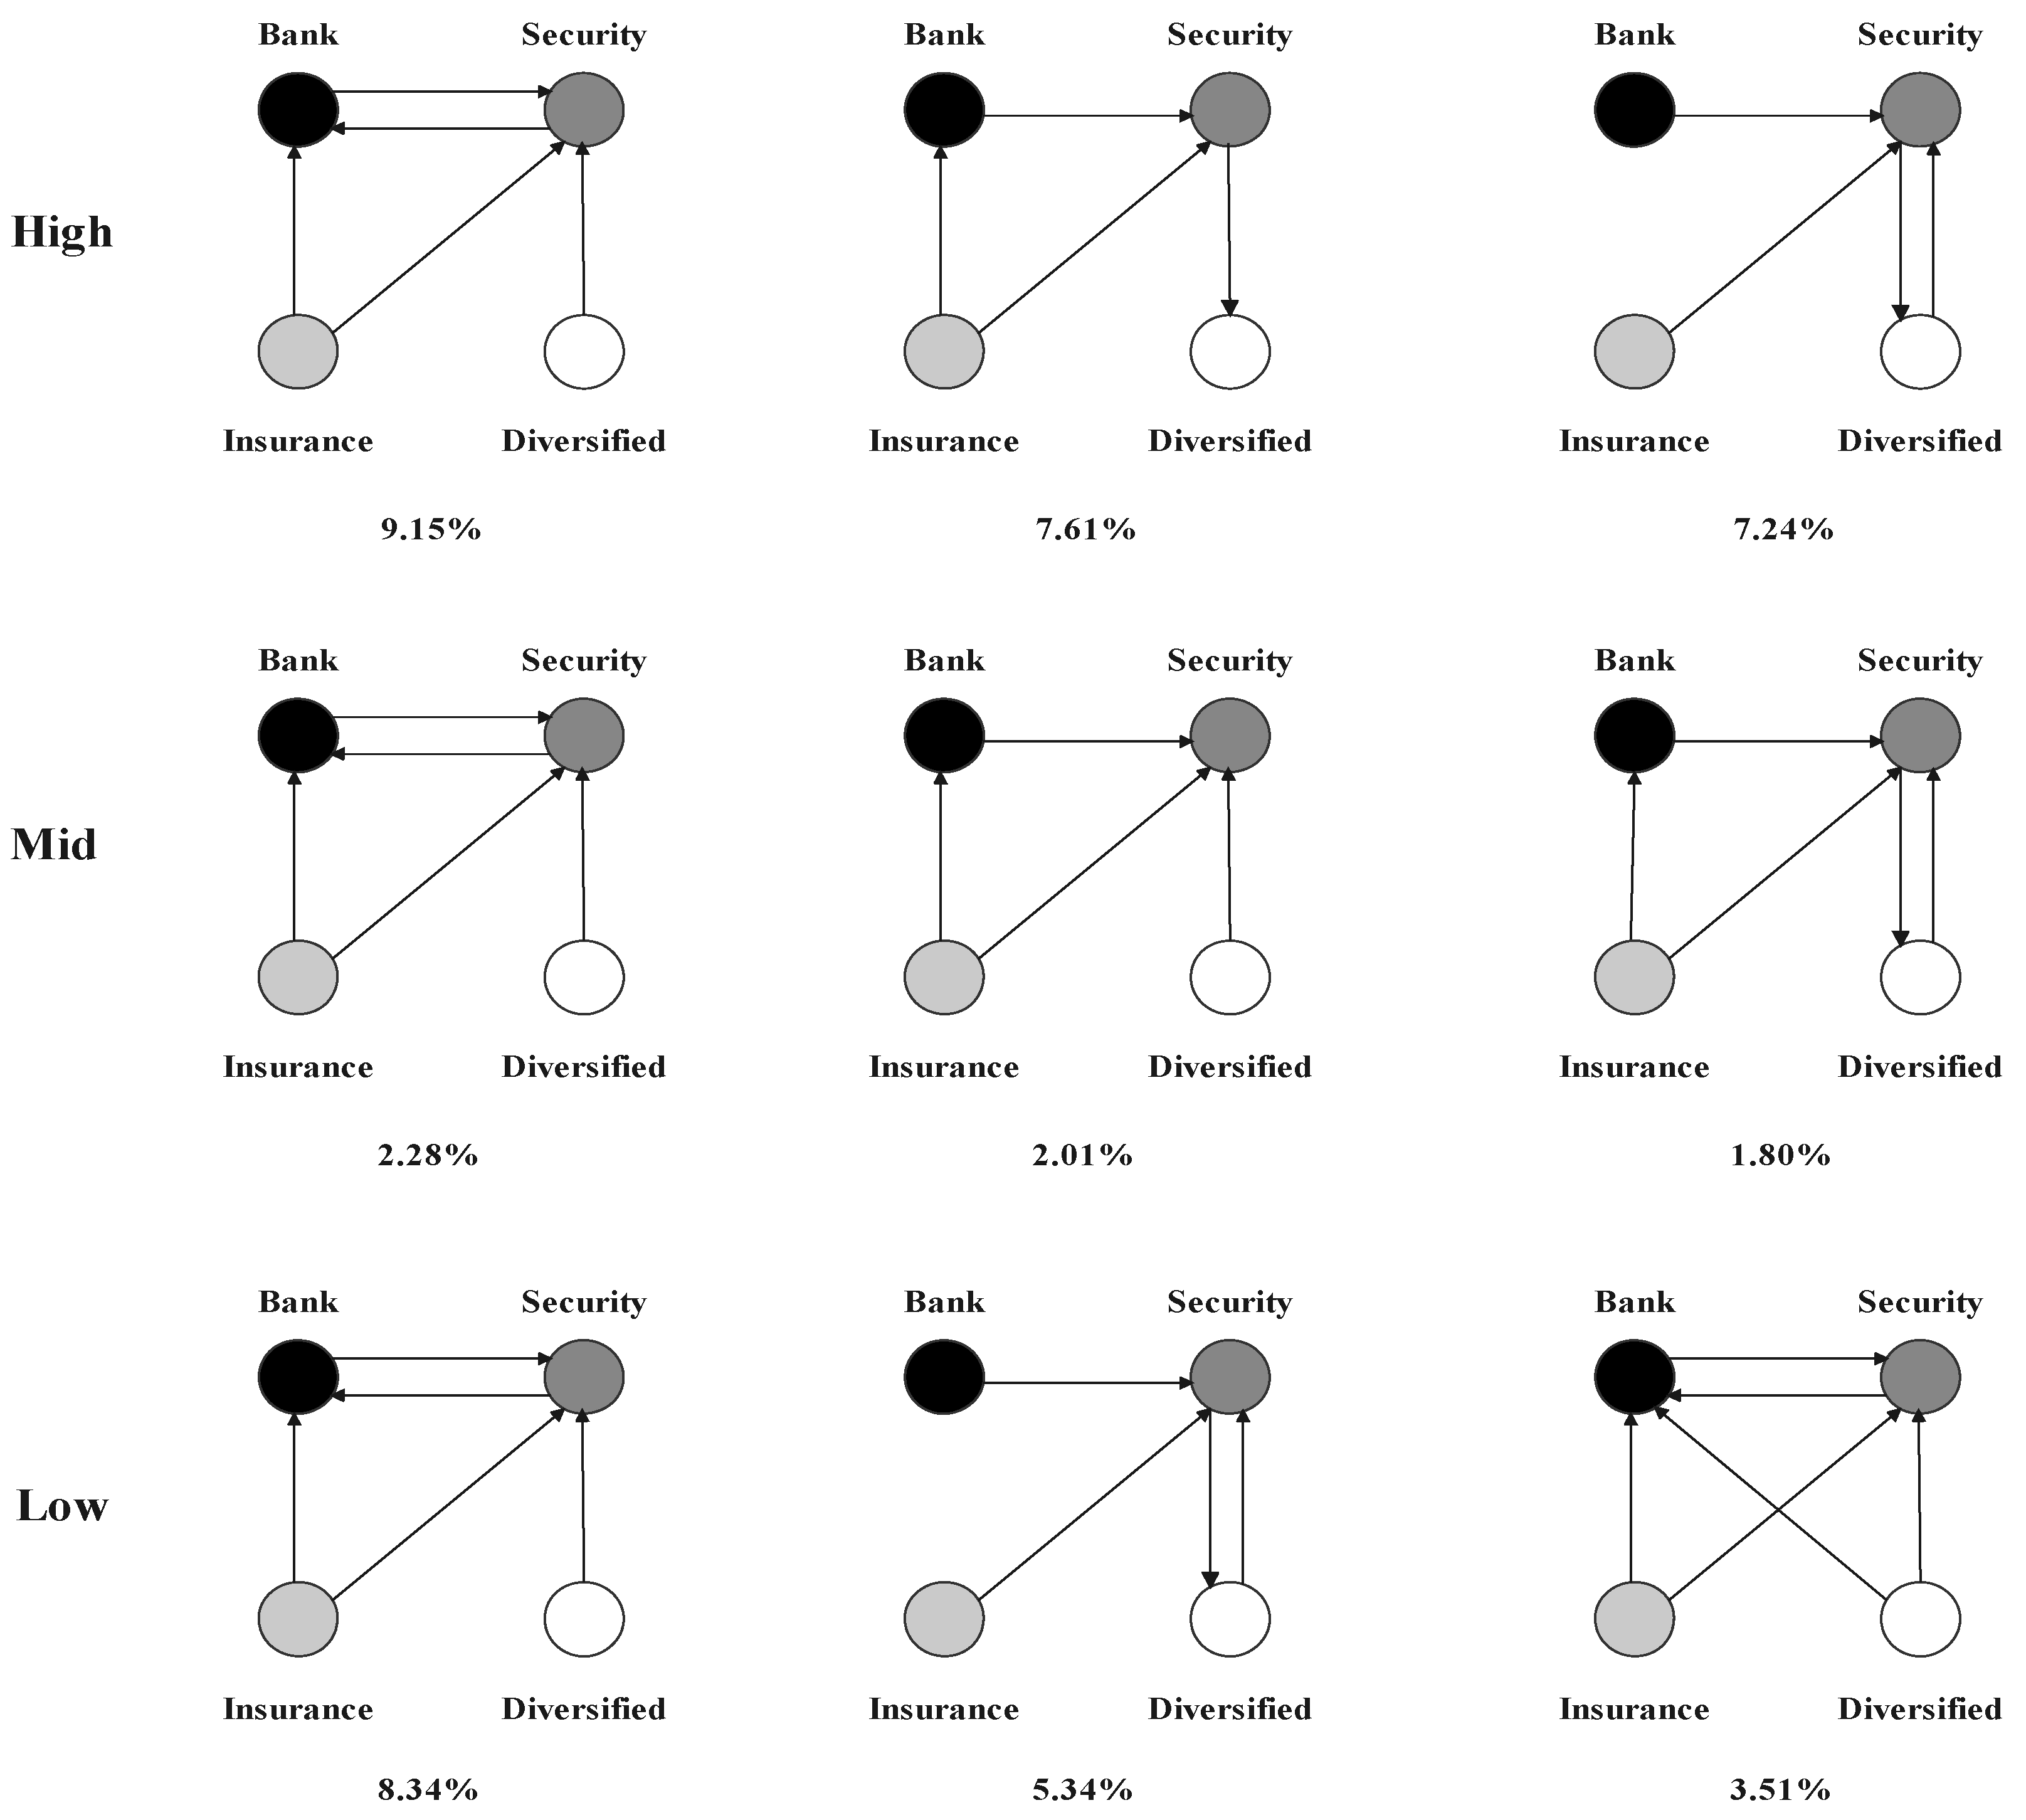
4.2.2. Motif Analysis of Risk Spillover Networks
- (1)
- The securities sector was exposed to risk spillovers from all other sectors and was the primary recipient of these spillovers. Moreover, the banking and insurance sectors did not have direct risk spillover relationships with the diversified financial sectors, making the securities sector a crucial node for their risk spillovers. This implied that, in the case of a risk event, the securities sector was the first to be affected by significant risk contagion, amplifying the risk spillover effect and transmitting it to other sectors. As a result, the securities sector should be closely monitored. On the other hand, the insurance sector acted as a source of risk spillover in motifs that had significant spillovers to the banking and securities sectors.
- (2)
- The banking and securities sectors, as well as the securities and diversified financial sectors formed a reciprocal relationship, indicating the close transmission of risk spillovers among these three sectors. For regulators, this conclusion highlighted the need for a comprehensive and coordinated approach to monitoring and regulating these sectors. In the event of a risk event, regulators need to be aware of the potential for risk to spread quickly to other sectors and take appropriate measures to minimize the impact of such a spillover. This requires close collaboration among the different regulatory bodies responsible for each sector and a coordinated approach to mitigating potential risks.
- (3)
- The base motifs of the moderate- and low-risk spillover networks were comparable to those of the high-risk spillover network; however, the proportion of these motifs was significantly lower, indicating a higher concentration of base motifs in the high-risk spillover network. The base motifs with the highest proportion in the high-, moderate-, and low-risk spillover networks were the same, suggesting that these motifs revealed the most-prevalent transmission pathways for intersectoral risk spillovers. By identifying the most-common pathways for risk transmission, investors can better assess the potential impact of a risk event in one sector on other sectors and make decisions accordingly.
4.3. Study on the Mechanism of Risk Spillover Network Generation and Evolution
4.3.1. TERGM Analysis
- (1)
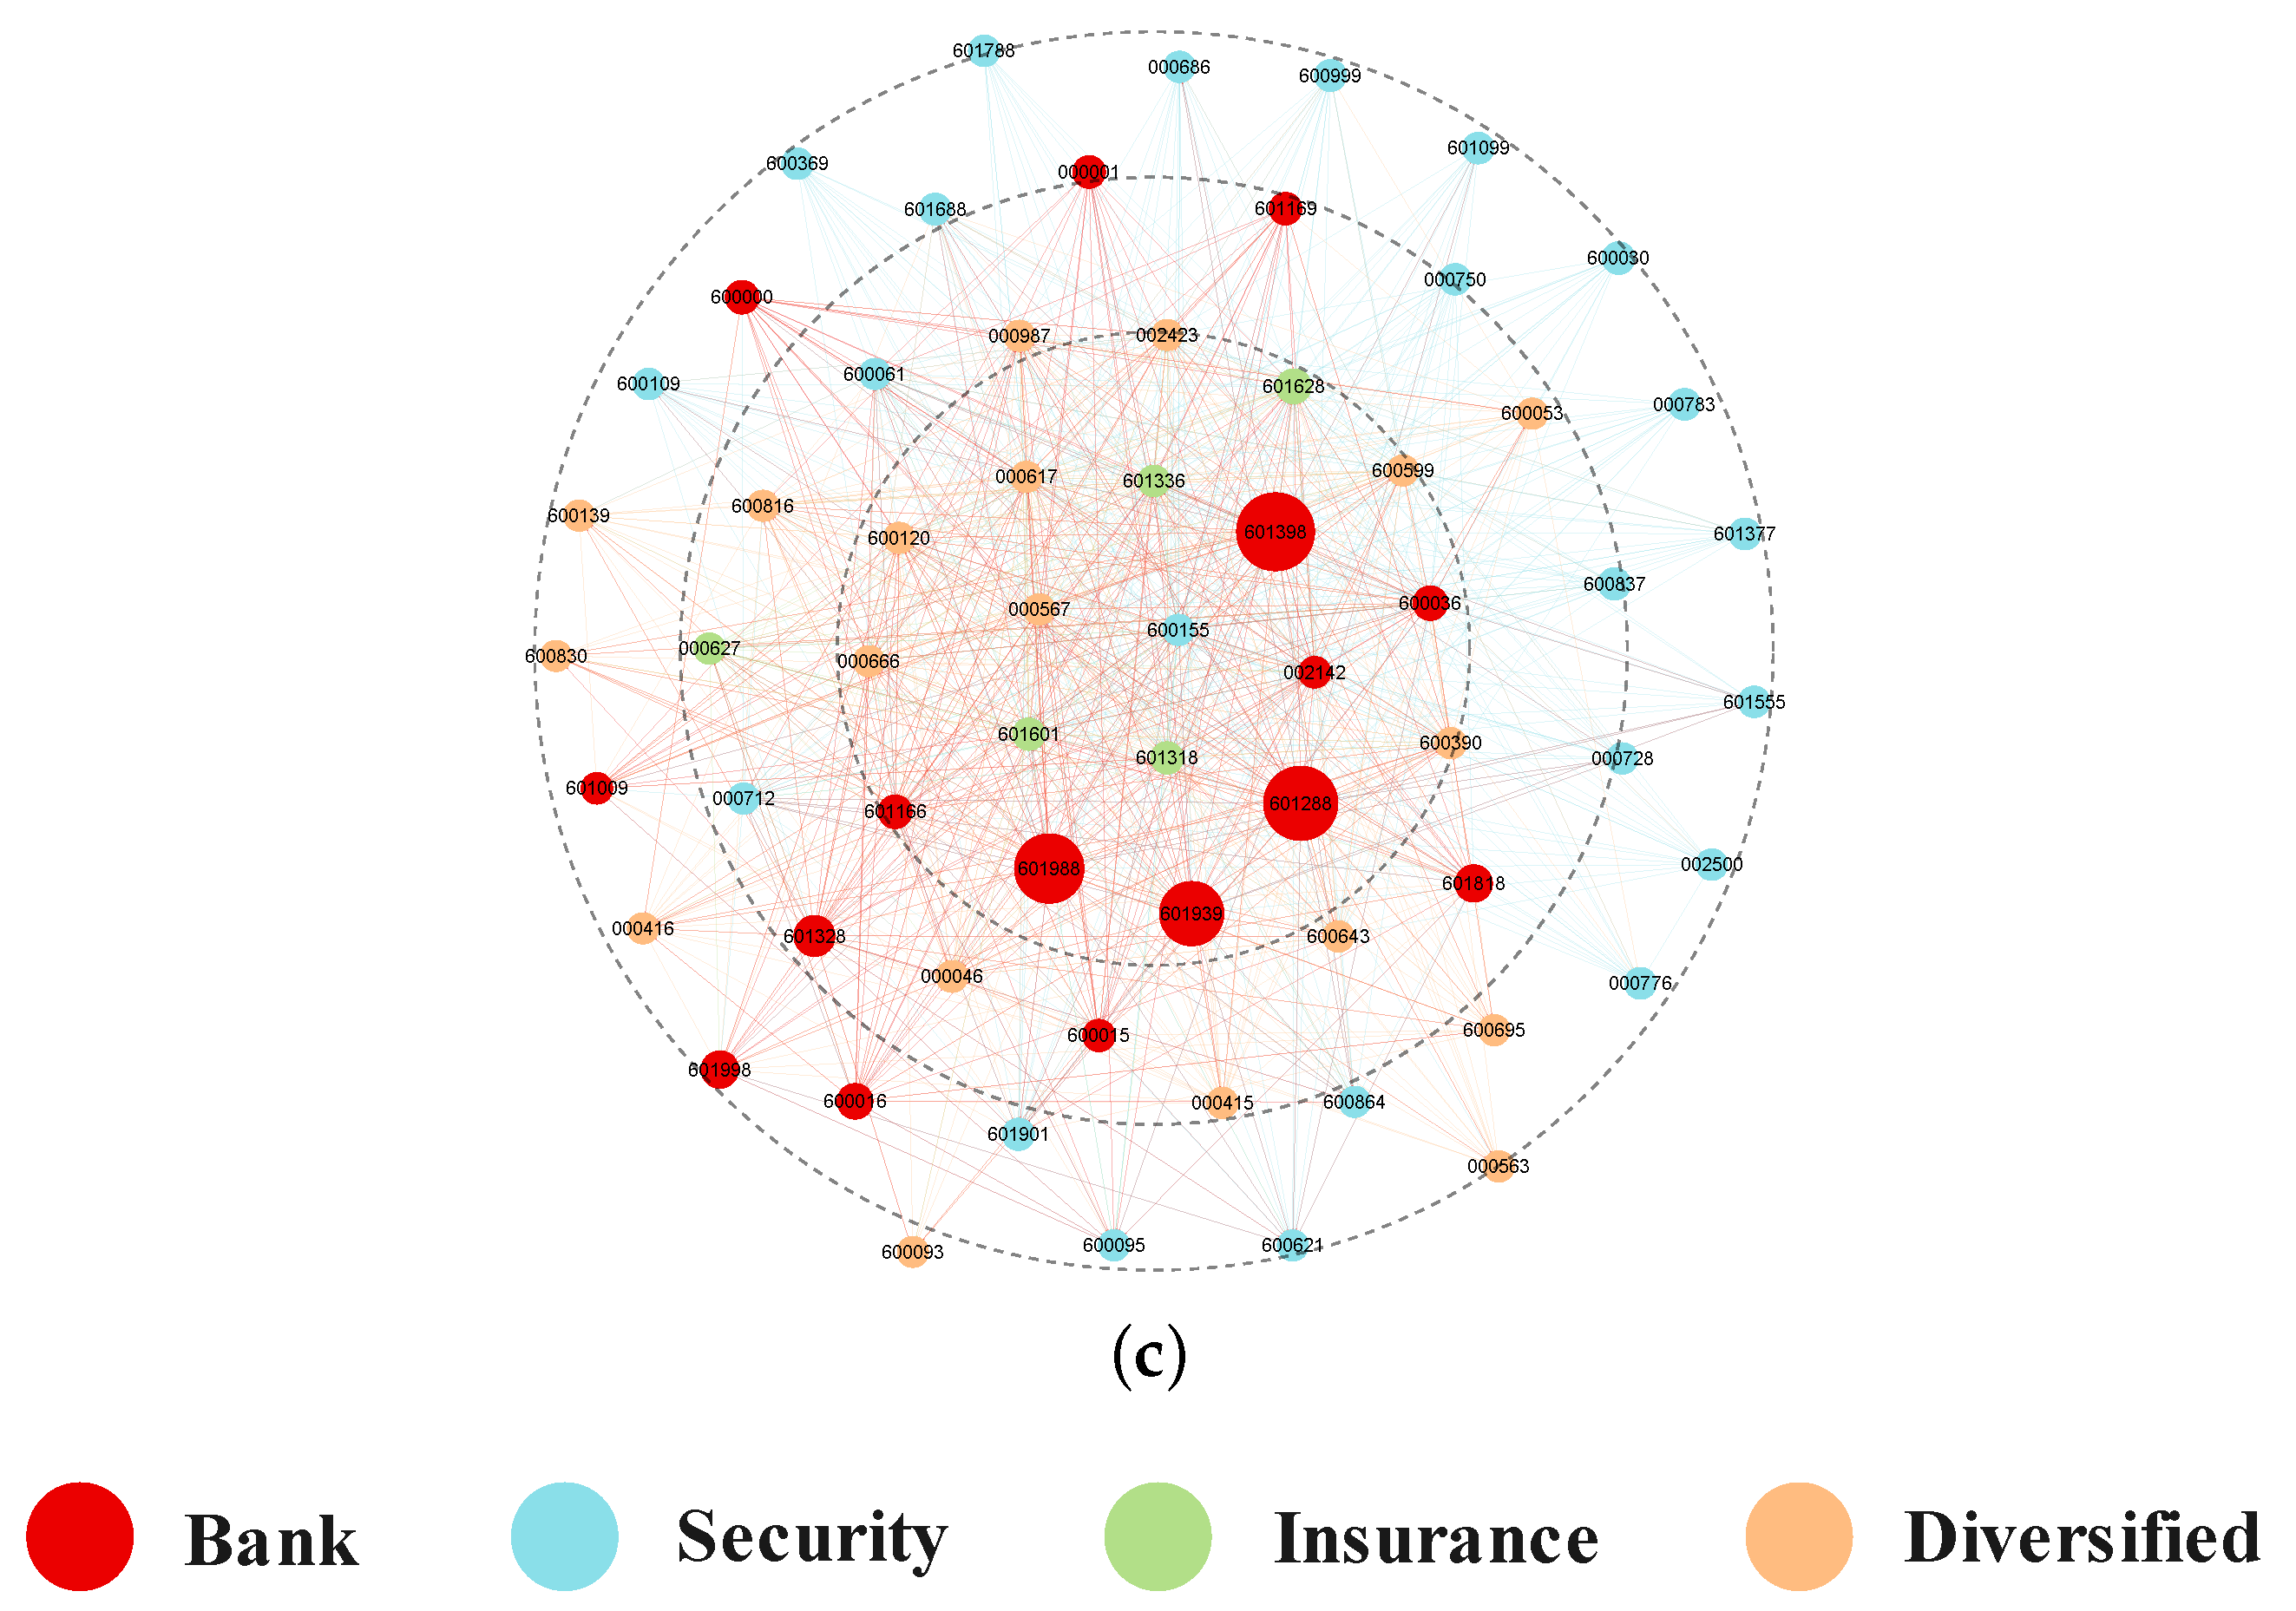
- Risk spillover networks had a “small-world” network topology characterized by a large number of pairwise interdependencies and a small number of highly centralized institutions that formed clusters around other institutions.
- (2)
- The attributes of the nodes in the network played a role in the formation of connections and preferences in the risk spillover network.
- (3)
- The relationships among the nodes in the network were both stable and variable over time, with coevolutionary relationships existing among different levels of risk spillover networks.
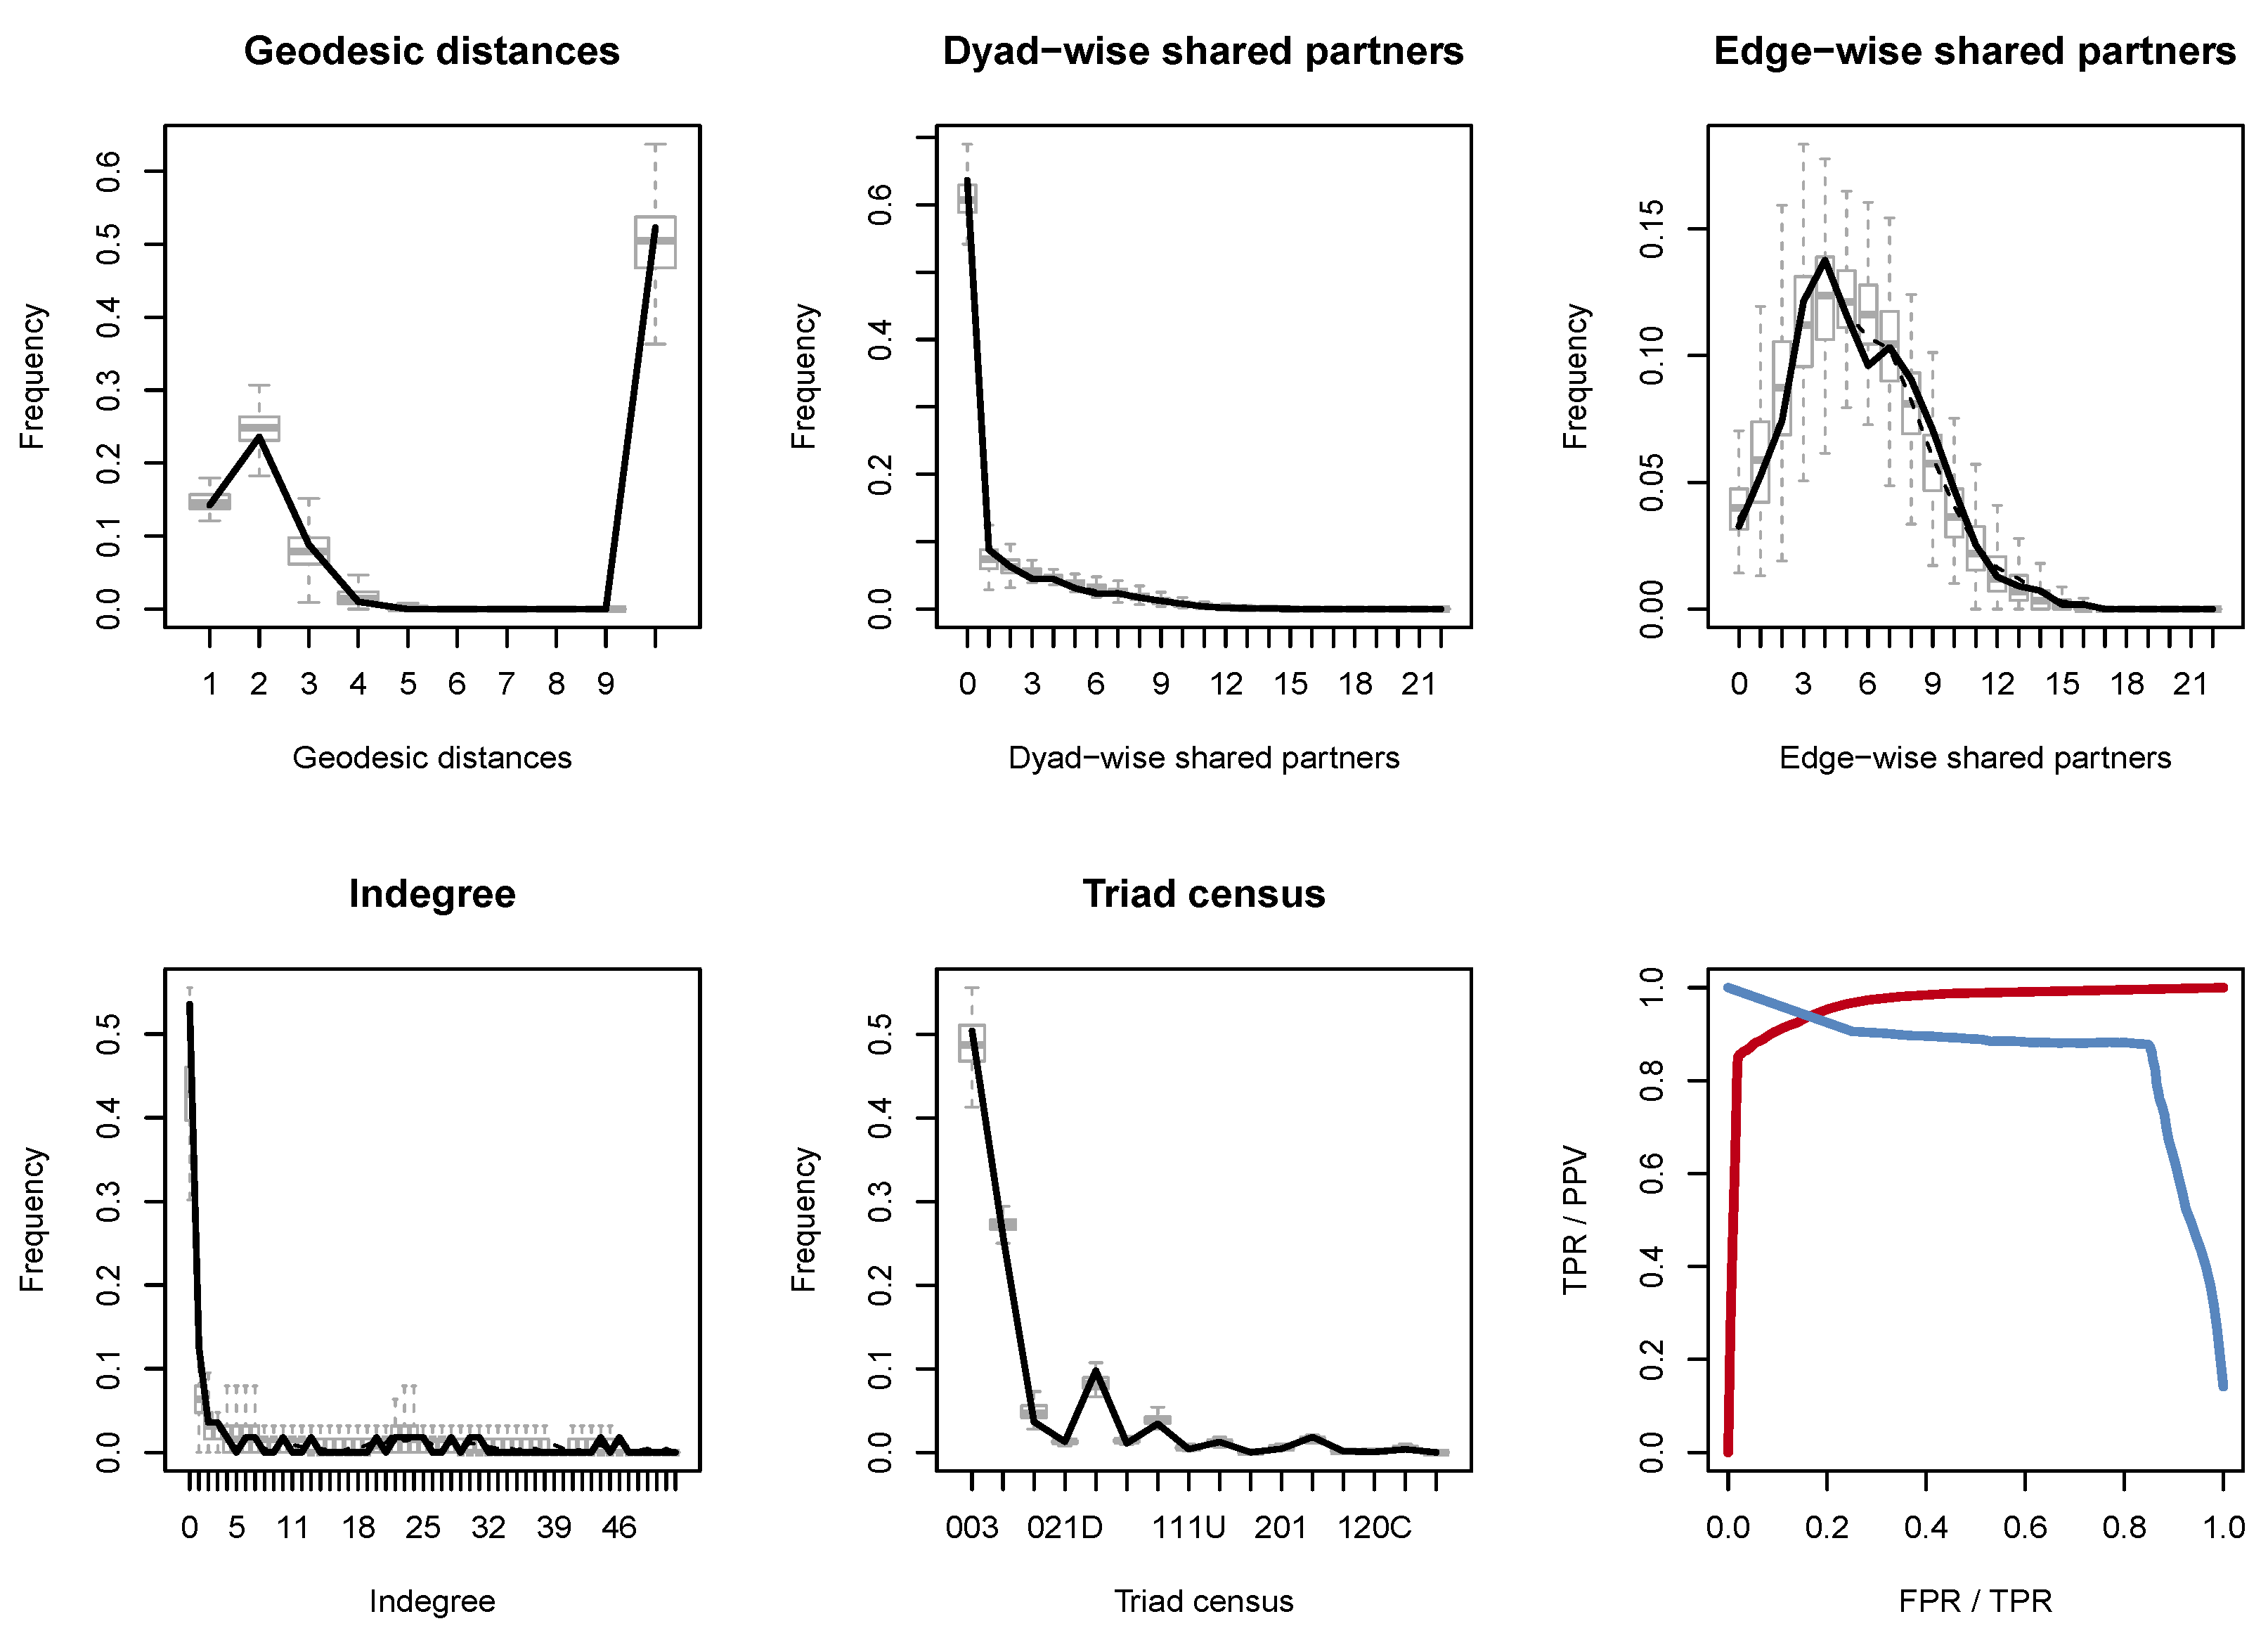
4.3.2. Goodness-of-Fit Test
5. Conclusions
Author Contributions
Funding
Data Availability Statement
Acknowledgments
Conflicts of Interest
Appendix A


References
- Acharya, V.V.; Pedersen, L.H.; Philippon, T.; Richardson, M. Measuring Systemic Risk. Rev. Financ. Stud. 2016, 30, 2–47. [Google Scholar] [CrossRef] [Green Version]
- Adams, Z.; Füss, R.; Gropp, R. Spillover Effects among Financial Institutions: A State-Dependent Sensitivity Value-at-Risk Approach. J. Financ. Quant. Anal. 2014, 49, 575–598. [Google Scholar] [CrossRef] [Green Version]
- Hautsch, N.; Schaumburg, J.; Schienle, M. Financial Network Systemic Risk Contributions. Rev. Financ. 2014, 19, 685–738. [Google Scholar] [CrossRef] [Green Version]
- Tobias, A.; Brunnermeier, M.K. CoVaR. Am. Econ. Rev. 2016, 106, 1705–1741. [Google Scholar]
- Girardi, G.; Tolga Ergün, A. Systemic risk measurement: Multivariate GARCH estimation of CoVaR. J. Bank. Financ. 2013, 37, 3169–3180. [Google Scholar] [CrossRef]
- Jin, X. Downside and upside risk spillovers from China to Asian stock markets: A CoVaR-Copula approach. Financ. Res. Lett. 2018, 25, 202–212. [Google Scholar] [CrossRef]
- Jian, Z.; Wu, S.; Zhu, Z. Asymmetric extreme risk spillovers between the Chinese stock market and index futures market: An MV-CAViaR based intraday CoVaR approach. Emerg. Mark. Rev. 2018, 37, 98–113. [Google Scholar] [CrossRef]
- Bellavite Pellegrini, C.; Cincinelli, P.; Meoli, M.; Urga, G. The role of shadow banking in systemic risk in the European financial system. J. Bank. Financ. 2022, 138, 106422. [Google Scholar] [CrossRef]
- Acharya, V.; Engle, R.; Richardson, M. Capital Shortfall: A New Approach to Ranking and Regulating Systemic Risks. Am. Econ. Rev. 2012, 102, 59–64. [Google Scholar] [CrossRef] [Green Version]
- Brownlees, C.; Engle, R.F. SRISK: A Conditional Capital Shortfall Measure of Systemic Risk. Rev. Financ. Stud. 2016, 30, 48–79. [Google Scholar] [CrossRef] [Green Version]
- Bellavite Pellegrini, C.; Cincinelli, P.; Meoli, M.; Urga, G. The contribution of (shadow) banks and real estate to systemic risk in China. J. Financ. Stab. 2022, 60, 101018. [Google Scholar] [CrossRef]
- Wang, G.J.; Jiang, Z.Q.; Lin, M.; Xie, C.; Stanley, H.E. Interconnectedness and systemic risk of China’s financial institutions. Emerg. Mark. Rev. 2018, 35, 1–18. [Google Scholar] [CrossRef]
- Ji, Q.; Liu, B.Y.; Nehler, H.; Uddin, G.S. Uncertainties and extreme risk spillover in the energy markets: A time-varying Copula-based CoVaR approach. Energy Econ. 2018, 76, 115–126. [Google Scholar] [CrossRef]
- Gong, X.L.; Liu, X.H.; Xiong, X.; Zhang, W. Financial systemic risk measurement based on causal network connectedness analysis. Int. Rev. Econ. Financ. 2019, 64, 290–307. [Google Scholar] [CrossRef]
- Minoiu, C.; Reyes, J.A. A network analysis of global banking: 1978–2010. J. Financ. Stab. 2013, 9, 168–184. [Google Scholar] [CrossRef]
- Georg, C.P. The effect of the interbank network structure on contagion and common shocks. J. Bank. Financ. 2013, 37, 2216–2228. [Google Scholar] [CrossRef] [Green Version]
- Benoit, S.; Colliard, J.E.; Hurlin, C.; Pérignon, C. Where the Risks Lie: A Survey on Systemic Risk. Rev. Financ. 2016, 21, 109–152. [Google Scholar] [CrossRef]
- Wang, Y.; Li, H.; Guan, J.; Liu, N. Similarities between stock price correlation networks and co-main product networks: Threshold scenarios. Phys. A Stat. Mech. Its Appl. 2019, 516, 66–77. [Google Scholar] [CrossRef]
- Yang, C.; Zhu, X.; Li, Q.; Chen, Y.; Deng, Q. Research on the evolution of stock correlation based on maximal spanning trees. Phys. A Stat. Mech. Its Appl. 2014, 415, 1–18. [Google Scholar] [CrossRef]
- Barbi, A.; Prataviera, G. Nonlinear dependencies on Brazilian equity network from mutual information minimum spanning trees. Phys. A Stat. Mech. Its Appl. 2019, 523, 876–885. [Google Scholar] [CrossRef] [Green Version]
- Diebold, F.X.; Yılmaz, K. On the network topology of variance decompositions: Measuring the connectedness of financial firms. J. Econom. 2014, 182, 119–134. [Google Scholar] [CrossRef] [Green Version]
- Lundgren, A.I.; Milicevic, A.; Uddin, G.S.; Kang, S.H. Connectedness network and dependence structure mechanism in green investments. Energy Econ. 2018, 72, 145–153. [Google Scholar] [CrossRef]
- Zeng, T.; Yang, M.; Shen, Y. Fancy Bitcoin and conventional financial assets: Measuring market integration based on connectedness networks. Econ. Model. 2020, 90, 209–220. [Google Scholar] [CrossRef]
- Ji, Q.; Bouri, E.; Lau, C.K.M.; Roubaud, D. Dynamic connectedness and integration in cryptocurrency markets. Int. Rev. Financ. Anal. 2019, 63, 257–272. [Google Scholar] [CrossRef]
- Härdle, W.K.; Wang, W.; Yu, L. TENET: Tail-Event driven NETwork risk. J. Econom. 2016, 192, 499–513. [Google Scholar] [CrossRef]
- Liu, B.Y.; Fan, Y.; Ji, Q.; Hussain, N. High-dimensional CoVaR network connectedness for measuring conditional financial contagion and risk spillovers from oil markets to the G20 stock system. Energy Econ. 2022, 105, 105749. [Google Scholar] [CrossRef]
- Chen, L.; Han, Q.; Qiao, Z.; Stanley, H.E. Correlation analysis and systemic risk measurement of regional, financial and global stock indices. Phys. A Stat. Mech. Its Appl. 2020, 542, 122653. [Google Scholar] [CrossRef]
- Silva, T.C.; Guerra, S.M.; Tabak, B.M.; de Castro Miranda, R.C. Financial networks, bank efficiency and risk-taking. J. Financ. Stab. 2016, 25, 247–257. [Google Scholar] [CrossRef]
- Poledna, S.; Bochmann, O.; Thurner, S. Basel III capital surcharges for G-SIBs are far less effective in managing systemic risk in comparison to network-based, systemic risk-dependent financial transaction taxes. J. Econ. Dyn. Control 2017, 77, 230–246. [Google Scholar] [CrossRef] [Green Version]
- Sun, Q.; Gao, X.; Wen, S.; Chen, Z.; Hao, X. The transmission of fluctuation among price indices based on Granger causality network. Phys. A Stat. Mech. Its Appl. 2018, 506, 36–49. [Google Scholar] [CrossRef]
- Ji, Q.; Bouri, E.; Roubaud, D. Dynamic network of implied volatility transmission among US equities, strategic commodities, and BRICS equities. Int. Rev. Financ. Anal. 2018, 57, 1–12. [Google Scholar] [CrossRef]
- Yun, T.S.; Jeong, D.; Park, S. “Too central to fail” systemic risk measure using PageRank algorithm. J. Econ. Behav. Organ. 2019, 162, 251–272. [Google Scholar] [CrossRef]
- Li, S.; Liu, M.; Wang, L.; Yang, K. Bank multiplex networks and systemic risk. Phys. A Stat. Mech. Its Appl. 2019, 533, 122039. [Google Scholar] [CrossRef]
- Billio, M.; Getmansky, M.; Lo, A.W.; Pelizzon, L. Econometric measures of connectedness and systemic risk in the finance and insurance sectors. J. Financ. Econ. 2012, 104, 535–559. [Google Scholar] [CrossRef]
- Wang, G.J.; Xie, C.; He, K.; Stanley, H. Extreme risk spillover network: Application to financial institutions. Quant. Financ. 2017, 17, 1417–1433. [Google Scholar] [CrossRef]
- Karimalis, E.N.; Nomikos, N.K. Measuring systemic risk in the European banking sector: A Copula CoVaR approach. Eur. J. Financ. 2018, 24, 944–975. [Google Scholar] [CrossRef] [Green Version]
- Drakos, A.A.; Kouretas, G.P. Bank ownership, financial segments and the measurement of systemic risk: An application of CoVaR. Int. Rev. Econ. Financ. 2015, 40, 127–140. [Google Scholar] [CrossRef]
- Bernard, C.; Czado, C. Conditional quantiles and tail dependence. J. Multivar. Anal. 2015, 138, 104–126. [Google Scholar] [CrossRef]
- Trabelsi, N.; Naifar, N. Are Islamic stock indexes exposed to systemic risk? Multivariate GARCH estimation of CoVaR. Res. Int. Bus. Financ. 2017, 42, 727–744. [Google Scholar] [CrossRef]
- Fang, L.; Chen, B.; Yu, H.; Qian, Y. Identifying systemic important markets from a global perspective: Using the ADCC ΔCoVaR approach with skewed-t distribution. Financ. Res. Lett. 2018, 24, 137–144. [Google Scholar] [CrossRef]
- Bernardi, M.; Durante, F.; Jaworski, P. CoVaR of families of Copulas. Stat. Probab. Lett. 2017, 120, 8–17. [Google Scholar] [CrossRef]
- Kayalar, D.E.; Küçüközmen, C.C.; Selcuk-Kestel, A.S. The impact of crude oil prices on financial market indicators: Copula approach. Energy Econ. 2017, 61, 162–173. [Google Scholar] [CrossRef]
- Talbi, M.; de Peretti, C.; Belkacem, L. Dynamics and causality in distribution between spot and future precious metals: A Copula approach. Resour. Policy 2020, 66, 101645. [Google Scholar] [CrossRef]
- Abakah, E.J.A.; Addo, E.; Gil-Alana, L.A.; Tiwari, A.K. Re-examination of international bond market dependence: Evidence from a pair Copula approach. Int. Rev. Financ. Anal. 2021, 74, 101678. [Google Scholar] [CrossRef]
- Patton, A.J. Modelling Asymmetric Exchange Rate Dependence. Int. Econ. Rev. 2006, 47, 527–556. [Google Scholar] [CrossRef] [Green Version]
- Chen, W.; Wei, Y.; Zhang, B.; Yu, J. Quantitative measurement of the contagion effect between US and Chinese stock market during the financial crisis. Phys. A Stat. Mech. Its Appl. 2014, 410, 550–560. [Google Scholar] [CrossRef]
- Martinez-Jaramillo, S.; Alexandrova-Kabadjova, B.; Bravo-Benitez, B.; Solórzano-Margain, J.P. An empirical study of the Mexican banking system’s network and its implications for systemic risk. J. Econ. Dyn. Control 2014, 40, 242–265. [Google Scholar] [CrossRef]
- Huang, W.Q.; Zhuang, X.T.; Yao, S.; Uryasev, S. A financial network perspective of financial institutions’ systemic risk contributions. Phys. A Stat. Mech. Its Appl. 2016, 456, 183–196. [Google Scholar] [CrossRef]
- Lusher, D.; Koskinen, J.; Robins, G. Exponential Random Graph Models for Social Networks: Theory, Methods, and Applications; Cambridge University Press: Cambridge, UK, 2013. [Google Scholar]
- Pircalabelu, E.; Claeskens, G. Focused model selection for social networks. Soc. Netw. 2016, 46, 76–86. [Google Scholar] [CrossRef] [Green Version]
- Yu, G.; Xiong, C.; Xiao, J.; He, D.; Peng, G. Evolutionary analysis of the global rare earth trade networks. Appl. Math. Comput. 2022, 430, 127249. [Google Scholar] [CrossRef]
- Obando, C.; Rosso, C.; Siegel, J.; Corbetta, M.; De Vico Fallani, F. Temporal exponential random graph models of longitudinal brain networks after stroke. J. R. Soc. Interface 2022, 19, 20210850. [Google Scholar] [CrossRef] [PubMed]
- Yin, M.; Zhu, L. Reciprocity in directed networks. Phys. A Stat. Mech. Its Appl. 2016, 447, 71–84. [Google Scholar] [CrossRef] [Green Version]
- Garlaschelli, D.; Loffredo, M.I. Patterns of Link Reciprocity in Directed Networks. Phys. Rev. Lett. 2004, 93, 268701. [Google Scholar] [CrossRef] [Green Version]
- Drehmann, M.; Tarashev, N. Measuring the systemic importance of interconnected banks. J. Financ. Intermediat. 2013, 22, 586–607. [Google Scholar] [CrossRef] [Green Version]
- Barabási, A.L.; Albert, R. Emergence of Scaling in Random Networks. Science 1999, 286, 509–512. [Google Scholar] [CrossRef] [PubMed] [Green Version]
- Battiston, S.; Delli Gatti, D.; Gallegati, M.; Greenwald, B.; Stiglitz, J.E. Liaisons dangereuses: Increasing connectivity, risk sharing, and systemic risk. J. Econ. Dyn. Control 2012, 36, 1121–1141. [Google Scholar] [CrossRef] [Green Version]
- Giuliani, E. Network dynamics in regional clusters: Evidence from Chile. Res. Policy 2013, 42, 1406–1419. [Google Scholar] [CrossRef]
- Guo, H.; Sun, Y.; Qiu, X. Cross-shareholding network and corporate bond financing cost in China. N. Am. J. Econ. Financ. 2021, 57, 101423. [Google Scholar] [CrossRef]
- Goodreau, S.; Kitts, J.; Morris, M. Birds of a feather, or friend of a friend? Using exponential random graph models to investigate adolescent social networks. Demography 2009, 46, 103–125. [Google Scholar] [CrossRef]


| Mean | Standard Deviation | Maximum | Minimum | Skewness | Kurtosis | Jarque–Bera | Ljung–Box | |
|---|---|---|---|---|---|---|---|---|
| Banking | *** | *** | ||||||
| Securities | *** | *** | ||||||
| Insurance | *** | *** | ||||||
| Diversified | *** | *** |
| To | |||||
| 0 | ⋯ | ||||
| 0 | ⋯ | ||||
| ⋯ | ⋯ | ⋯ | ⋯ | ⋯ | ⋯ |
| ⋯ | 0 | ||||
| From | ⋯ | TC |
| The Degree of Risk Spillover | Percentile | The Network Relation () |
|---|---|---|
| High | Top 30% | The value is 1; otherwise, it is 0 |
| Moderate | 30–60% | The value is 1; otherwise, it is 0 |
| Low | 60–100% | The value is 1; otherwise, it is 0 |
| Index | Function | Diagram |
|---|---|---|
| Density | The ratio of extant edges to potential edges |  |
| Reciprocity | The ratio of bidirectional edges to all edges |  |
| Cluster coefficient | The degree to which nodes tend to cluster together | 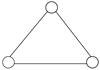 |
| Betweenness centrality | The proportion of nodes that are intermediaries |  |
| Index | Function | Diagram | |
|---|---|---|---|
| edges |  | Basic directed network relationship | |
| mutual |  | Network relationships have feedback | |
| Structure- dependent effects | gwideg |  | Network nodes have convergence |
| transity |  | Network forms triadic transmission closures | |
| gwdsp |  | Network has multipath nodes | |
| Time- dependent effects | stability |  | Network has path dependency |
| variability | 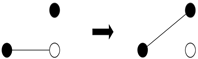 | Network is time-varying |
| Banking | Securities | Insurance | Diversified | |
|---|---|---|---|---|
| *** | ** | 0.0196 | ||
| ** | ** | |||
| *** | ** | * | ** | |
| *** | *** | *** | *** | |
| *** | *** | *** | *** | |
| * | * | * | ** | |
| v | *** | *** | *** | *** |
| *** | *** | *** | ||
| Full Sample Period | Extreme Scenarios | ||||||||||
|---|---|---|---|---|---|---|---|---|---|---|---|
| Overflow | Banking | Securities | Insurance | Diversified | To | Banking | Securities | Insurance | Diversified | To | |
| Spillover | |||||||||||
| Banking | 0.000 | 1.019 | 1.071 | 0.951 | 3.040 | 0.000 | 1.133 | 1.151 | 1.0521 | 3.336 | |
| Securities | 0.963 | 0.000 | 0.988 | 1.016 | 2.968 | 1.071 | 0.000 | 1.125 | 1.1281 | 3.324 | |
| Insurance | 0.818 | 0.803 | 0.000 | 0.773 | 2.394 | 0.881 | 0.913 | 0.000 | 0.884 | 2.679 | |
| Diversified | 0.676 | 0.743 | 0.703 | 0.000 | 2.122 | 0.744 | 0.824 | 0.801 | 0.000 | 2.369 | |
| From | 2.458 | 2.565 | 2.762 | 2.740 | 2.631 | 2.696 | 2.871 | 3.077 | 3.065 | 2.927 | |
| Triad Composition | High | Mid | Low | |
|---|---|---|---|---|
 | Banking | 187 | 18 | 5 |
| Securities | 38 | 75 | 0 | |
| Diversified | 133 | 126 | 169 | |
| Total | 358 | 219 | 174 |
| Triad Composition | High | Mid | Low | |
|---|---|---|---|---|
 | Bank, Securities | 1016 | 459 | 220 |
| Bank, Insurance | 91 | 24 | 138 | |
| Bank, Diversified | 103 | 194 | 981 | |
| Securities, Insurance | 169 | 51 | 37 | |
| Securities, Diversified | 1874 | 1108 | 354 | |
| Diversified, Insurance | 14 | 65 | 315 | |
| Total | 3267 | 1901 | 2045 |
| Triad Composition | High | Mid | Low | |
|---|---|---|---|---|
 | Bank, Securities, Insurance | 298 | 181 | 659 |
| Bank, Securities, Diversified | 466 | 553 | 786 | |
| Bank, Insurance, Diversified | 23 | 83 | 874 | |
| Securities, Insurance, Diversified | 126 | 143 | 503 | |
| Total | 913 | 960 | 2822 |
| Dependent
Variable: | High-Risk Spillover Network | Moderate-Risk Spillover Network | |||||
|---|---|---|---|---|---|---|---|
| (1) | (2) | (3) | (4) | (5) | (6) | ||
| edges | ** | *** | *** | *** | ** | ||
| Structure dependent | mutual | *** | *** | *** | *** | ||
| gwideg | *** | *** | *** | *** | |||
| gwesp | ** | ** | *** | ** | |||
| gwdsp | *** | *** | *** | *** | |||
| Time- dependent | stability | *** | *** | ||||
| variability | ** | ||||||
| Sender properties | epsTTM | * | * | * | |||
| liability- ToAsset | ** | * | * | ** | |||
| YOYNI | *** | * | * | * | |||
| npMargin | *** | ** | ** | ||||
| Receiver properties | epsTTM | * | |||||
| liability- ToAsset | *** | ** | ** | ** | |||
| YOYNI | * | * | |||||
| npMargin | |||||||
| Sectoral properties | industry | ** | *** | *** | * | ||
| Coevolutionary properties | high-risk spillover network | *** | *** | *** | |||
| moderate-risk spillover network | *** | *** | ** | ||||
| low-risk spillover network | ** | * | *** | *** | *** | *** | |
Disclaimer/Publisher’s Note: The statements, opinions and data contained in all publications are solely those of the individual author(s) and contributor(s) and not of MDPI and/or the editor(s). MDPI and/or the editor(s) disclaim responsibility for any injury to people or property resulting from any ideas, methods, instructions or products referred to in the content. |
© 2023 by the authors. Licensee MDPI, Basel, Switzerland. This article is an open access article distributed under the terms and conditions of the Creative Commons Attribution (CC BY) license (https://creativecommons.org/licenses/by/4.0/).
Share and Cite
Yao, C.-Z.; Zhang, Z.-K.; Li, Y.-L. The Analysis of Risk Measurement and Association in China’s Financial Sector Using the Tail Risk Spillover Network. Mathematics 2023, 11, 2574. https://doi.org/10.3390/math11112574
Yao C-Z, Zhang Z-K, Li Y-L. The Analysis of Risk Measurement and Association in China’s Financial Sector Using the Tail Risk Spillover Network. Mathematics. 2023; 11(11):2574. https://doi.org/10.3390/math11112574
Chicago/Turabian StyleYao, Can-Zhong, Ze-Kun Zhang, and Yan-Li Li. 2023. "The Analysis of Risk Measurement and Association in China’s Financial Sector Using the Tail Risk Spillover Network" Mathematics 11, no. 11: 2574. https://doi.org/10.3390/math11112574
APA StyleYao, C.-Z., Zhang, Z.-K., & Li, Y.-L. (2023). The Analysis of Risk Measurement and Association in China’s Financial Sector Using the Tail Risk Spillover Network. Mathematics, 11(11), 2574. https://doi.org/10.3390/math11112574