Article

Key Factors for a Successful OBM Transformation with DEMATEL–ANP

1
Institute of Industrial Management, National Central University, 300 Zhongda Road, Zhongli District, Taoyuan City 32001, Taiwan
2
Department of Industrial Management, National Taiwan University of Science and Technology, 43 Sec. 4 Keelung Road, Daan District, Taipei 106335, Taiwan
3
Department of Business Administration, Chung Yuan Christian University, 200 Chung Pei Road, Chung Li District, Taoyuan City 32023, Taiwan
*
Author to whom correspondence should be addressed.
Mathematics 2023, 11(11), 2439; https://doi.org/10.3390/math11112439
Submission received: 19 April 2023 / Revised: 22 May 2023 / Accepted: 23 May 2023 / Published: 25 May 2023
(This article belongs to the Special Issue Multi-criteria Decision Making and Data Mining, 2nd Edition)

Abstract

:
Production costs and global competition have increased sharply in recent years, forcing manufacturers to upgrade to the original brand manufacturer (OBM) to survive and thrive and capture more profit margins. However, studies that explore key factors that affect the success of such an important transition are lacking. Therefore, this study aims to investigate the key factors that will influence the success of contract manufacturers to upgrade to the OBM on the basis of a decision-making trial and evaluation laboratory with an analytic network process. Our results identify six key factors that exhibit a cause-and-effect relationship among the key criteria. Moreover, organizational innovation will determine the difference between the success and the failure of an OBM transition apart from material and component stability. Our findings can help researchers, policy makers, and practitioners increase their understanding of how to upgrade manufacturers successfully in global value chains.

1. Introduction

Upgrading the value chain is a huge challenge, and it is one of the most critical processes for managers to help their enterprises survive and grow [1]. In the manufacturing sector, competition is even more fierce among latecomer manufacturers from China, India, and Brazil compared with the past few decades [2]. As the business environment becomes increasingly competitive, original equipment manufacturers (OEMs) or original design manufacturers (ODMs) have encountered considerable pressure to maintain their low-cost strategy. Companies that rely on OEM or ODM models in developed countries (e.g., Taiwan and Korea) are particularly vulnerable to this low-cost competition. An original brand manufacturer (OBM) can be defined as a company that designs and develops a product and then sells it under its brand name. In general, an OBM has full control over its product’s design, quality, and branding, along with its marketing and sales. Therefore, an OBM typically generates higher profit margins than an OEM. An OEM produces spare parts, semi-finished products, or finished products on the basis of specific materials, specifications, processing procedures, inspection standards, or brand labels by customers, while an ODM can participate in the product design stage. Given the lack of their own brands, achieving higher profit margins in the global value chain is difficult for OEMs and ODMs. To gain higher profit margins in the global value chain, OEMs and ODMs should upgrade their business model to OBMs. Therefore, more advanced, high-quality, and innovative products can solve the aforementioned problems and increase customer satisfaction and loyalty.
Contract manufacturers with many years of design and production experience have advantages and are highly suitable to build their own brands. Some firms have successfully transformed their businesses, but many have failed because they have not adopted the right strategies. As an example of a success story, the largest customer of Giant Bicycles (accounting for 75% of its revenue) transferred to manufacturers in China in 1981 due to high production costs in Taiwan. To overcome this crisis, Giant Bicycles established its own brand and adopted the ODM and OBM models with a global marketing network. It positioned itself as the world’s best brand for designing and manufacturing bicycles. Their transition led to their success as a well-known bicycle brand at present. Other firms that successfully transformed from OEM to OBM include Acer, HTC, Johnson, and Maxxis in Taiwan [3], Cuckoo, Hankook Chinaware, and Lock & Lock in Korea [4], and TCL and Lenovo in China [2]. However, transformation can be a complex and challenging process for contract manufacturers due to poor strategic planning or lack of expertise in design and marketing, particularly for traditional manufacturing [5].
The objective of the current study is to explore the key factors that help firms remain competitive in the global marketplace and achieve sustainable growth by transforming successfully to the OBM model on the basis of multi-criteria decision-making. Previous studies have focused only on some specific cases or contexts, limiting the generalizability of their findings [3,4,6]. For example, case studies can provide insights into specific situations; however, they cannot offer a comprehensive understanding of the decision-making process or a framework for generalization in an OBM transition. Despite the growing popularity of multiple-criteria decision-making (MCDM) methods in various fields, empirical research that explores the key success criteria for OBM transformation is lacking. Therefore, the current study can contribute to the literature in several ways. First, this work can fill the gap in the existing literature by identifying criteria that affect the success of an OBM transformation on the basis of the Delphi method to achieve a reliable consensus among criteria from experts’ opinions. Second, we present the overall criteria ranking of an OBM transformation that can help firms increase the efficiency of decision-making through a decision-making trial and evaluation laboratory (DEMATEL) with an analytic network process (ANP). In contrast with the traditional MCDM, the integration of DEMATEL–ANP into the Delphi method not only enhances the quality of data but also improves the reliability of the findings. Finally, we illustrate the casual relationships that exhibit the interaction among six key criteria of an OBM transformation. By applying these success factors, companies can improve operational efficiency, increase profits, enhance their competitive position in global value chains, and reduce the risk of failure. The remainder of this paper is organized as follows. Related studies are presented in Section 2. In Section 3, we describe the methodology proposed in this study. The results and analysis are presented in Section 4. Discussions about the theoretical and practical implications are summarized in Section 5. Then, the conclusion of this study is drawn in Section 6.

2. Literature Review

The macroeconomic environment refers to broad economic factors, such as inflation, interest rates, exchange rates, public policies, and politics, which affect the success of a business transition [1,2]. The transition from OEM or ODM to OBM requires a significant change in business strategy and is considerably influenced by the macroeconomic environment. Mahmood et al. [3] demonstrate that political stability is an essential factor in creating an enabling environment for business transformation. Low interest rates, stable inflation, and exchange rates are essential conditions for firms to invest more in research and development (R&D) and build their brand and marketing. Aisen and Veiga [4] report that political instability exerts a negative effect on macroeconomic performance. As competition increases, firms must innovate and upgrade their business to retain their profits and market share. For example, OEMs and ODMs from Taiwan, Korea, and Japan are losing their competitive advantage to emerging countries, such as China or India, in recent decades [5]. Firms may experience conflicts of interest between their existing and new business models [6]. Price hikes and component shortages not only disrupt production but also affect the success of an OBM transition. In particular, if raw materials are unstable, then a company may experience difficulty in producing its product at a price that is competitive in the market. Therefore, a stable supply chain is a major factor in the profitability of an OBM model.
Collis [7] defines organizational capability as an organization’s ability to use its tangible and intangible resources effectively to achieve its goals. An OBM model requires a strong organizational capability to maintain its innovation and competitiveness in international markets [8]. An organization must have the innovative capability to differentiate its products and shape the market rather than just be a follower [9]. Strong innovation capabilities not only allow a company to develop new products quickly and efficiently but also build a strong brand reputation [10]. Organizations must learn new techniques and knowledge to adapt to business model requirements at each stage. Jerez-Gómez et al. [11] argue that an organization with a strong learning capability can innovate, develop, and implement effective strategies. In contrast with contract manufacturers, the OBM model requires a company to manage the entire supply chain from sourcing raw materials to delivering finished products to customers. Therefore, effective coordination and integration are essential for an organization to ensure that all necessary activities are performed efficiently and effectively. For example, organizations can reduce double marginalization to improve their revenue and profitability by coordinating closely with their suppliers and retailers. By coordinating with employees and departments, organizations can improve their operational performance to achieve common corporate goals [12]. Moreover, organizations can quickly adjust their production and delivery schedules to meet the changing needs of customers. An organization’s environmental responsiveness refers to its ability to sense and react quickly to changes in the environment. Moreover, customers’ growing concern about environmental responsibility will create an additional challenge for organizations during an OBM transition [13]. However, organizations can attract more customers and generate more competitive advantages through their commitment to the environment.
In practice, R&D and technological capabilities are the major drivers of innovation by recombining existing knowledge or generating new knowledge through research [14]. R&D creates technological progress, while technological competence is required for the effective use of new knowledge. If companies invest in R&D and develop strong technological capability, then they will be in a better position to innovate, improve product quality, reduce costs, and improve customer satisfaction. Tsai-Lin et al. [15] demonstrate that without cutting-edge R&D, innovation design, and technological capability, companies will experience difficulty in transforming their businesses into the OBM model. If companies can effectively leverage, absorb, and use external technologies, then they can catch up with the latest technologies and create innovation faster from the expertise of other companies or research institutions. External technologies not only allow firms to access cutting-edge research, development tools, and testing capabilities but also help them save time and budget in R&D [5,16]. In accordance with Coombs [17], the mastery of core competencies enables firms to develop a sustainable competitive advantage in long-term growth by leveraging their unique strengths and capabilities [8]. Moreover, the mastery of core competencies allows firms to make effective decisions with better outcomes on the basis of long-term technological strength.
Marketing capability is well-known as an important factor that contributes to a sustainable competitive advantage and business performance [18]. A clear market positioning strategy helps companies identify and target the right customers. By focusing on target customers, companies can effectively tailor their marketing strategies to meet customer needs [19]. Moreover, strong brand awareness can increase sales. Hoyer and Brown [20] report that brand awareness also influences consumers’ purchase intention. Meanwhile, the success of achieving global sales does not rely heavily on the effectiveness of distribution channels [21]. Furthermore, effective global logistics and support capabilities not only help firms deliver their products on time and in good condition but also support customers whenever they need them. In accordance with Shokouhyar et al. [22], after-sales service is an important component of customer satisfaction and loyalty. Several studies have shown that customers are more likely to return if they receive good after-sales service [23]. Furthermore, after-sales service can be a key differentiator for companies in a competitive market. If customers receive good after-sales service, then they are more likely to recommend the company to others.
Manufacturing capability is defined as a fundamental proficiency that allows firms to achieve production goals [24]. To transform successfully into the OBM model, the manufacturing capability of companies should have the ability to design efficient processes, supply chain management, quality control, and lean manufacturing [25]. Previous studies have shown that smart manufacturing practices can help firms effectively control operations in manufacturing, increase flexibility, improve quality, and enhance productivity [26]. In particular, the implementation of effective quality control helps firms ensure that products meet customer specifications and expectations, helping increase the satisfaction of existing customers and helping attract new customers. Lewis [27] suggests that lean manufacturing is the essential approach that can push the continuous improvement of manufacturing processes by eliminating waste and increasing efficiency.
MCDM is widely used to solve highly complex and uncertain decision-making problems in many areas that traditional methods cannot solve. DEMATEL was developed in the 1970s for evaluating interdependent relationships among factors; it has gained popularity in recent years [28,29]. In general, DEMATEL is a mathematical computational method that aims to explore the cause–effect relationship among criteria. In addition, the analytic hierarchy process (AHP) cannot solve interdependency between criteria. ANP is a nonlinear structure that has been proposed to analyze criteria priorities and their complex relationships [30]. ANP exhibits the advantage of analyzing complex and interdependent decision-making situations, such as resource allocation, technology selection, or strategic planning [31]. Other MCDM methods and variants, such as the technique for order of preference by similarity to ideal solution (TOPSIS), VIKOR, gray theory, AHP, ANP, and DEMATEL or fuzzy MCDM, have also been developed to solve different problems, with each method having its own characteristics for finding the best solutions [32,33,34]. However, TOPSIS does not consider the correlation between criteria in evaluating Euclidean distance, while VIKOR is challenging to apply when dealing with conflicting scenarios of real-world problems. If the decision-making process is ambiguous, gray theory methods can be used to test the interaction analysis. To deal with uncertain data or unclear judgment, fuzzy MCDM is a useful technique [35]. Nevertheless, fuzzy MCDM can only generate an approximate solution [32].
To increase the reliability and accuracy of the results, prior studies have developed many variants and combinations of the DEMATEL method, such as DEMATEL with ANP, hierarchical DEMATEL, and fuzzy DEMATEL. OBM transformation is a complex problem with many criteria that may be related to one another directly or indirectly. In the current study, a hybrid DEMATEL-based ANP approach is used to explore complicated causal relationships by providing a comprehensive analysis of a decision-making problem [36]. The hybrid DEMATEL–ANP method exhibits advantages in handling complex interactions between criteria and alternatives, and, thus, it also helps decision makers visualize the relationships between criteria, making the decision-making process more transparent and easier to understand [37]. In this regard, the DEMATEL–ANP method is well-suited for identifying the key success factors over other popular methods in the current study. Furthermore, DEMATEL–ANP is combined with the Delphi method to obtain consistent and reliable opinions from experts.

3. Methodology and Experimental Design

The research framework is generated by reviewing relevant studies on OBM transformation and interviewing experts on the basis of the Delphi method. After identifying criteria that affect OBM transformation, the DEMATEL method is applied to identify interrelationships between factors that affect OBM transformation by using a matrix to represent interdependencies between factors.

3.1. Formal Research Framework

First, a prototype research framework was established by reviewing relevant studies and interviewing a group of experts to construct the key success factors of an OBM transformation. Seven experts from academia and industry were carefully selected and invited to evaluate and calculate the weight of each criterion on a scale of 0–100. Seven experts with extensive experiences in OBM transition were invited for the interview to modify the question structure and to fill the survey to provide their expert opinion. In particular, all the experts have 10–33 years of experience in the electronics industry, R&D, marketing, and in the academic field. Two experts are from the electronics industry, while one expert is a professor at a university. A summary of the experts’ information is provided in Table A1. We applied the Delphi method to obtain the most reliable consensus from a group of experts [38]. By keeping the responses anonymous, the Delphi method allowed the experts to express their views freely without fear of criticism or negative feedback from their peers. All the experts were consulted two times on the same question, allowing them to correct their answers with the help of information they received from the other experts. To test the degree of expert consensus, we applied a consensus deviation index (CDI), which is calculated as follows:
C D I = S i j x i j
where x i j is the average value and S i j is the standard deviation.
CDI is a sensitive measure that can detect even small changes in the consensus level among experts while using the Delphi method. This parameter is useful for checking changes in consensus over time among experts. After conducting two rounds of the Delphi method, the formal research framework was established with 5 components and 19 criteria. All the CDI values were equal to or less than 0.1, indicating that the expert group reached a consensus on all the criteria, as presented in Table A2. We summarized all the criteria with related studies in Table 1.

3.2. DEMATEL-Based ANP Method

We propose the DEMATEL with ANP method to analyze the key factors for successful OBM transformation from the 19 criteria presented in the previous section. We applied the three-point scale method as follows: 0 means no influence at all, 1 is somewhat influential, and 2 is definitely influential. The summary of the proposed DEMATEL–ANP method is presented in Figure 1.
In accordance with Figure 1, DEMATEL is first implemented to calculate the direct influence matrix Z by using the results of the questionnaire survey in Section 3.1. Furthermore, the total direct influence matrix is established after the direct influence matrix Z is normalized. The unweighted supermatrix in ANP is analyzed by normalizing the total influence matrix of DEMATEL. Moreover, the unweighted supermatrix is multiplied by the corresponding cluster priority to obtain the weighted supermatrix. The limit supermatrix is generated by multiplying the weighted supermatrix by itself several times until the matrix converges. The operational steps of the DEMATEL–ANP method for analyzing the key success factors are as followed.
Step 1: The direct influence matrix Z is established. In this study, the collected data are averaged in accordance with the number of experts, and the mutual influence relationship of the direct influence matrix Z can be obtained.
Z = z 11 z 12 z 1 n z 21 z n 1 z 22 z 2 n z n 2 z n n
where z i j represents the influence level of criterion i on criterion j , and its diagonal element z i j is set to 0.
Step 2: Regularization directly affects matrix X . The direct influence matrix Z is normalized. The maximum value of the row sum and column sum is obtained as the reciprocal and then multiplied by the direct influence matrix. Therefore, the normalized direct relationship matrix X is calculated using Equations (3) and (4).
X = λ · Z
λ = min 1 max 1 i n j = 1 n | a i j | , 1 max 1 j n i = 1 n | a i j |   where   i , j { 1 , 2 , 3 , . . , n }
Step 3: The total influence matrix T is calculated. After normalizing the direct influence matrix, the total influence matrix T can be obtained by calculating the formula T = X ( I X ) 1 , where I is an n × n identity matrix.
lim k X k = 0
T = lim x X + X 2 + + X k = X ( I X ) 1
Step 4: By normalizing the total influence matrix T , we can obtain the unweighted supermatrix of ANP. The total influence matrix is normalized to produce a weighted matrix W .
Step 5: After multiplying W by itself several times, the limit supermatrix W * is generated to obtain the weight of each element.

4. Results and Analysis

4.1. Criterion Causality Determination

In this section, we present the causal relationship among the criteria for constructing a knowledge management system based on the DEMATEL method. To analyze the degree of importance and cause, we sum up each column of the total influence relationship matrix ( T ) to obtain the column sum ( d ) . Similarly, we evaluate the sum of the column and row ( d + r ) by adding column sum ( d ) to row sum ( r ) . The larger the value in ( d + r ) , the more important the criterion, and vice versa. Moreover, the difference between column and row ( d r ) is defined as the correlation. If the value of ( d r ) is higher, then the criterion has more influence on other factors. Therefore, improvement priority should be considered for that criterion. The result of the importance and correlation analysis is provided in Table 2. In addition, we summarize the result of the limit supermatrix in Table A3.
From the results in Table 2, we classify the criterion as “cause” if the difference between column and row is positive and “effect” if the difference is negative. The summary of the cause–effect characteristics for each criterion is presented in Table 3.
Furthermore, the decision of the key criteria is based on the DEMATEL row and column sum ( d + r ) ranking and the relative weight ranking of the limit supermatrix calculated using ANP on the basis of DEMATEL. The sum of the DEMATEL and DEMATEL–ANP scores is the Borda score; the higher the score, the more important the criterion. We summarize the overall ranking in Table 4. In accordance with the results in Table 2, D2 and D5 are the highest-ranking criteria that influence the success of an OBM transformation. Subsequently, A1, C1, A3, and B1 are among the essential factors that firms should focus on to enhance their performance. Moreover, D3 and E1 also exert a huge effect on the success of a transition.

4.2. Causal Diagram of Key Criteria

From the total influence relationship matrix ( T ) shown in Table A4 and the overall ranking in Table 4, the causal diagram of key criteria is produced as shown in Figure 2. Our empirical results show that six key factors (A1, A3, B1, C1, D2, and D5) affect the success of an OBM transformation. Among the six criteria, A1, A3, and B1 exhibit the most cause-and-effect relationships with other criteria. In particular, political and economic stability is the cause of material and component stability, organizational innovation, product design innovation, and perfect marketing channels. That is, political and economic stability is a critical factor that can affect the success of a business transformation. By contrast, C1 and D5 exhibit fewer relationships with other criteria. Moreover, material and component stability and organizational innovation have been demonstrated to influence each other. Intuitively, organizational innovation and product design innovation are causally linked. In particular, product design innovation is influenced by five other factors.

5. Discussions

In contrast with the traditional Delphi method, all the experts in this study completed the survey in person, with a clear explanation of each question and specific instructions on the methodology to avoid misleading information, achieving a reliable consensus within a short period of time. Moreover, we encouraged the experts to make comments and suggestions instead of simply filling the survey to enhance the quality of the study. By conducting the survey in person, we mitigated some of the disadvantages of the traditional Delphi method, such as limited open discussion or commitment in multiple rounds. In addition, the combination of the Delphi method, DEMATEL, and ANP to identify key criteria of an OBM transformation can benefit from qualitative and quantitative approaches to enhance the accuracy of the findings and reduce uncertainties compared with other hybrid MCDM methods. As a complex problem, this integration can identify the ranking and illustrate the cause-and-effect relationships among criteria to help decision makers easily understand the factors that affect an OBM transformation.
Upgrading to OBM can be a significant step for a company, and it poses many risks and challenges. One of the major challenges is managing the transition to a business-to-consumer (B2C) business model. Firms must shift their focus to meet the needs and preferences of end consumers, and such a shift requires a different mindset, skills, and approach to business. In addition, firms should develop their brand image, establish marketing channels, and invest in R&D to innovate their product to become more than just manufacturing. In addition, the OBM market is highly competitive and success has no guarantee. Any failure in a product launch or a lack of market demand can lead to financial loss or even bankruptcy. Moreover, firms may not have the expertise required to set up and manage distribution networks. This scenario can lead to inefficient and delayed deliveries and increased costs. In this section, we summarize the theoretical and practical implications of the six key factors that affect the success of an OBM transformation.
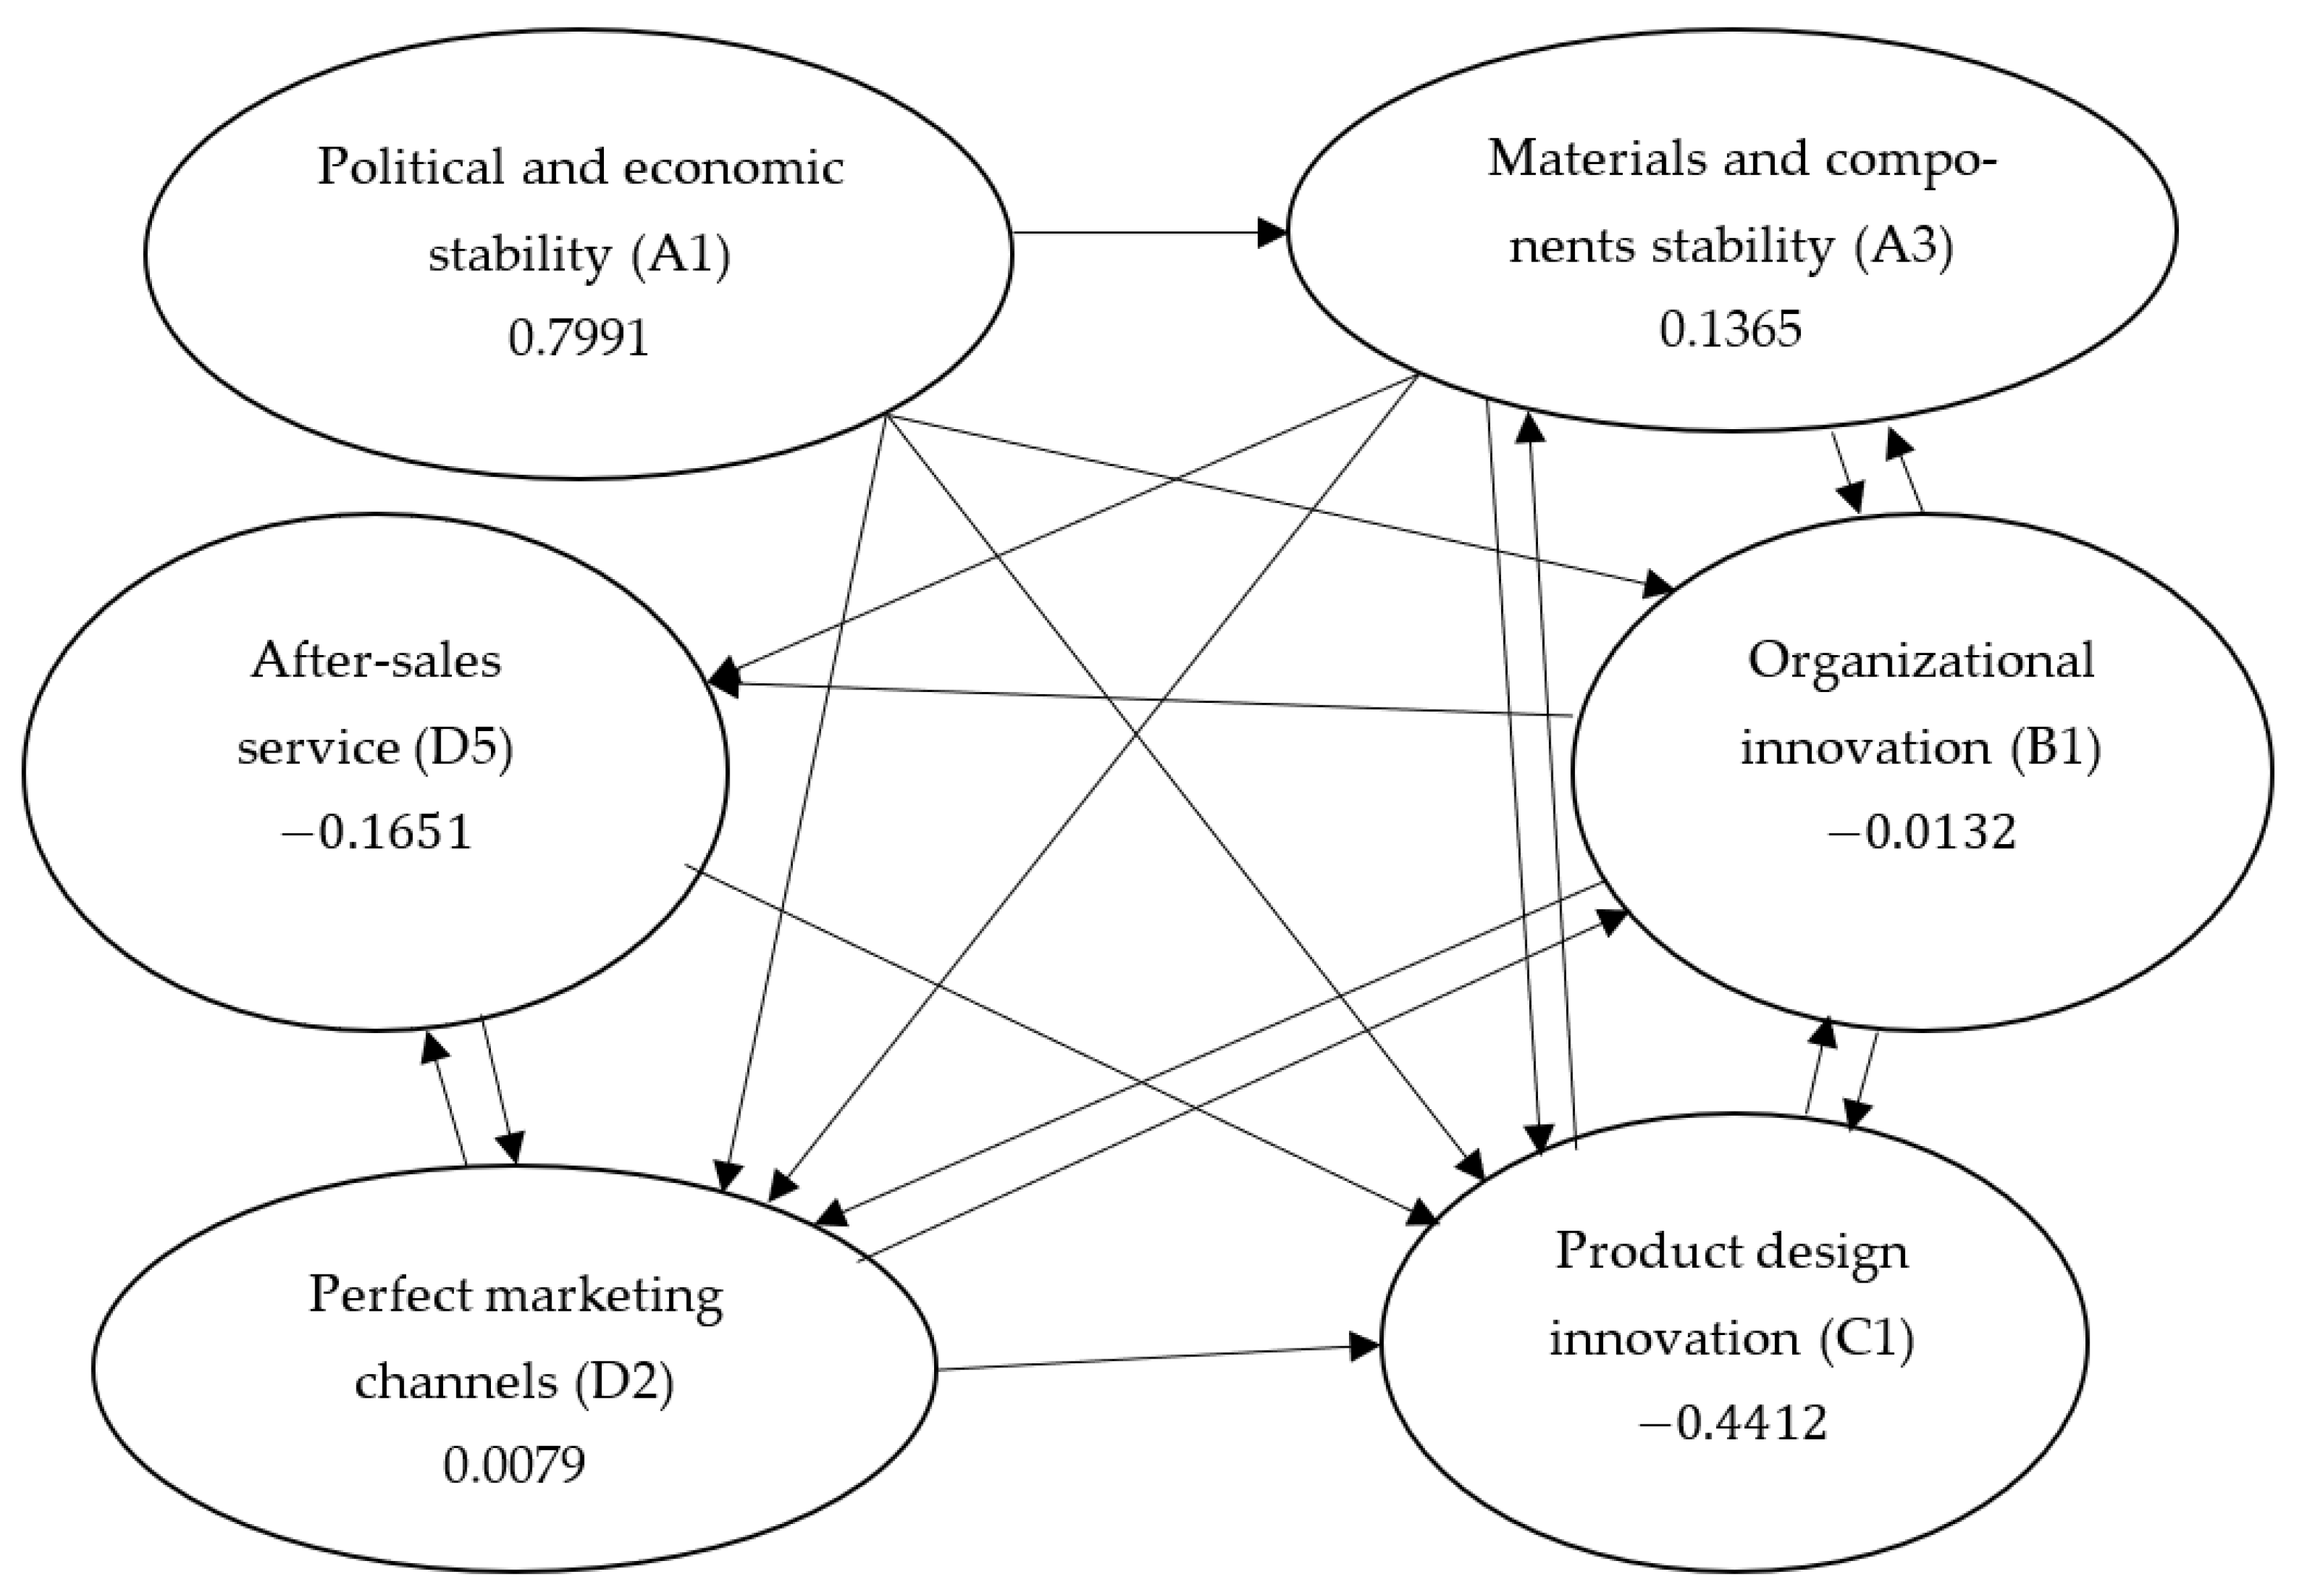
  • Political and economic stability (A1): In accordance with the results above, political and economic stability was constructed as a cause factor with a positive value (0.7991). In addition, the degree of importance between the dimensions was 5.8023. That is, political and economic stability may not be the most important factor in the success of an OBM transformation; however, it highly influences other factors. In a politically stable environment, manufacturers are more likely to experience a predictable regulatory environment, which can help them plan and execute their transformation strategies with greater confidence. For example, consistent policies and regulations with low inflation and stable interest rates can support businesses investing in R&D and innovation in the long run. By contrast, high inflation and volatile interest rates can make planning and budgeting for their transformation initiatives difficult for firms. In addition, economic instability can lead to a decrease in the demand for goods and services. Such a decrease can affect revenue and limit resources for their transformation effort.
  • Material and component stability (A3): Material and component stability was categorized as a cause factor with a positive value (0.1365). Moreover, the importance value of material and component stability was 6.7003. That is, material and component stability is more important than political and economic stability. Similar to political and economic stability, material and component stability can influence other factors. In an environment with stable materials and components, businesses can acquire more confidence in their ability to deliver products and services that meet the quality standards expected by their customers. This condition can be critical for businesses that are undergoing a transformation effort, because it can provide a foundation of stability upon which they can build their new business models and processes. Meanwhile, unreliable or inconsistent materials and components can lead to long lead time, quality issues, and increased production costs. These challenges can affect the effort to innovate and adopt new technologies, and, consequently, the success of a business transformation.
  • Organizational innovation (B1): The organizational innovation factor was described as an effect rather than a cause factor with a negative value ( 0.0132 ) and its degree of importance was 6.7948. This condition denotes that the organizational innovation factor is more affected than its influences in OBM transition. Furthermore, it is more important than political and economic stability, material and component stability, perfect marketing channels, and after-sales service. Organizational innovation is essential for any firms, particularly those undergoing a transformation process, because it enables them to develop new products, services, and business models that can better meet customer needs. Organizations that are able to innovate are more likely to be successful in transforming their business, given that they are better equipped to identify and capitalize on new opportunities. By contrast, firms that are slow to innovate may find transforming and adapting to changing market conditions difficult.
  • Product design innovation (C1): Among the six key factors, the product design innovation factor had the lowest difference between column and row (−0.4412). By contrast, its degree of importance between dimensions had the highest value (7.0150) compared with the five other factors. That is, the product design innovation factor is the most important factor; however, it tends to be affected by other factors. Product design innovation refers to the ability of a firm’s R&D department to create new and innovative products that meet the growing needs and preferences of current and future customers. In addition, innovation in product design can help businesses differentiate themselves from their competitors. Firms can also build a strong brand identity by creating unique and innovative products. However, innovation in product design also requires significant resources and investment. Businesses must be willing to invest in research and development and take risks on new product designs.
  • Perfect marketing channels (D2): From the results above, the perfect marketing channels factor was constructed as a cause factor with a positive value (0.0079). Moreover, its degree of importance between dimensions was 6.3900. That is, the perfect marketing channels factor tends to influence rather than be affected by other factors. In addition, it is also more important than the political and economic stability factor. Perfect marketing channels enable firms to reach and satisfy their target customers. For example, firms can build brand loyalty and create a stronger connection with their customers by engaging effectively with their customers through the right marketing channels. However, leveraging effective marketing channels requires significant knowledge and expertise. Businesses must be able to understand their target customers and identify the right marketing channels to reach them effectively. To be successful in their transformation effort, businesses must be able to identify the right marketing channels in each market and condition while also carefully managing costs and resources.
  • After-sales service (D5): Similar to organizational innovation and product design innovation, after-sales service was an effect factor with a negative value (−0.1651), while its value of importance between dimensions was 6.5466. This condition indicates that after-sales service is more affected by other factors. In addition, after-sales service is more important than political and economic stability and perfect marketing channels. Effective after-sales service enables firms to build stronger relationships with their customers and enhance customer satisfaction. Firms that can provide high-quality after-sales service are more likely to succeed in building customer loyalty and expanding market share. By contrast, firms that are unable to provide effective after-sales service may struggle to transform and adapt to customer needs. They may be more likely to experience negative word-of-mouth and customer churn, which can make achieving their transformation goals difficult.

6. Conclusions

Firms should carefully consider several key factors to upgrade successfully to become an OBM. In this study, we proposed the Delphi method to identify 19 criteria from interviews with experts and a review of the related literature on the successful transformation to an OBM model. Moreover, the DEMATEL–ANP method was applied to explore key criteria for helping firms successfully transition to an OBM. Among the six key factors with cause-and-effect relationships, organizational innovation is the influence factor for organizations to stay competitive, innovate, collaborate effectively, and plan strategically. In addition, political and economic stability is essential for companies to successfully transform into the OBM model. Moreover, the ranking of the key success factors was generated with 19 criteria to help firms identify and prepare for their transition. The findings of this study may provide valuable information to researchers and practitioners in successfully transitioning to the OBM model in the future. After conducting the Delphi method and DEMATEL with ANP analyses, the findings of this study were demonstrated to be reliable. Apart from the Delphi method, a sensitivity analysis can be performed to test the robustness of the results. In this study, we applied the Delphi method instead of a sensitivity analysis to obtain the most reliable consensus from a group of experts due to limited resources, and a sensitivity analysis is not a one-time activity. In particular, the experts in this study are limited to the electronics industry in Taiwan. Therefore, researchers and practitioners should extend this study to other countries and industries and conduct a sensitivity analysis periodically to test the robustness of the key factors for an OBM transition in the future. Being transparent about the empirical findings of the study in actual practice is important. This study provided a comprehensive overview of an OBM transformation. In practice, each firm may have its own challenges and requirements. Therefore, firms can refer to the key success factors identified in this study to customize their resources on the basis of the specific context of their OBM transformation. This study explored the key success criteria for OBM transition on the basis of DEMATEL–ANP. Future research should focus on comparing the effectiveness of the DEMATEL–ANP method with other MCDM methods and explore the constraint of resources to help firms increase their understanding of OBM transition.

Author Contributions

Conceptualization, T.S.N., J.-M.C., S.-H.T. and L.-F.L.; formal analysis, T.S.N., S.-H.T. and L.-F.L.; investigation, T.S.N., J.-M.C., S.-H.T. and L.-F.L.; methodology, T.S.N., J.-M.C., S.-H.T. and L.-F.L.; supervision, J.-M.C. and S.-H.T.; validation, T.S.N., J.-M.C., S.-H.T. and L.-F.L.; visualization, T.S.N., J.-M.C., S.-H.T. and L.-F.L.; writing—original draft, T.S.N. and L.-F.L.; writing—reviewing and editing, T.S.N., J.-M.C. and S.-H.T. All authors have read and agreed to the published version of the manuscript.

Funding

This research received no external funding.

Data Availability Statement

Not applicable.

Acknowledgments

We would like to express our gratitude to seven experts, reviewers, and editors for their generous support and feedback throughout this study.

Conflicts of Interest

The authors declare no conflict of interest.

Appendix A

Table A1. Expert information.
ExpertAgeAcademic QualificationsExperience
A41MasterFifteen years of experience in research and development in the electronics industry.
B54BachelorThirty years of experience in the field of electronic industry research and development and related fields of business marketing.
C53BachelorThirty-three years of experience in business marketing-related fields.
D41MasterFifteen years of experience in research and development in the electronics industry.
E54BachelorTwenty years of experience in business marketing-related fields and operating electronic industry-related companies.
F48MasterFifteen years of experience in business marketing-related fields.
G67PhDTen years of experience in marketing research in the academic field.
Table A2. Results of the second round of the Delphi method.
CriteriaABCDEFGAVGSDCDI
A17080808070707074.2865.3450.058
A290851008070859085.7149.3220.100
A38580808080858582.1432.6730.029
B17590909080858585.0005.7740.062
B28090909090808085.7145.3450.058
B38580808080808080.7141.8900.020
B49090909090858588.5712.4400.026
B59080809080808082.8574.8800.053
C19090909090909090.0000.0000.000
C29080809070858582.8576.9860.075
C310090909080959591.4296.2680.068
D1100901009080959592.8576.9860.075
D28090909090808085.7145.3450.058
D38090909090808085.7145.3450.058
D46080708080858577.1439.0630.098
D58090909080808084.2865.3450.058
E17080808080707075.7145.3450.058
E28090908080858584.2864.4990.048
E380909090100959591.4296.2680.068
Table A3. Criteria limit supermatrix.
A1A2A3B1B2B3B4B5C1C2C3D1D2D3D4D5E1E2E3
A10.0466 0.0466 0.0466 0.0466 0.0466 0.0466 0.0466 0.0466 0.0466 0.0466 0.0466 0.0466 0.0466 0.0466 0.0466 0.0466 0.0466 0.0466 0.0466
A20.0646 0.0646 0.0646 0.0646 0.0646 0.0646 0.0646 0.0646 0.0646 0.0646 0.0646 0.0646 0.0646 0.0646 0.0646 0.0646 0.0646 0.0646 0.0646
A30.0484 0.0484 0.0484 0.0484 0.0484 0.0484 0.0484 0.0484 0.0484 0.0484 0.0484 0.0484 0.0484 0.0484 0.0484 0.0484 0.0484 0.0484 0.0484
B10.0479 0.0479 0.0479 0.0479 0.0479 0.0479 0.0479 0.0479 0.0479 0.0479 0.0479 0.0479 0.0479 0.0479 0.0479 0.0479 0.0479 0.0479 0.0479
B20.0610 0.0610 0.0610 0.0610 0.0610 0.0610 0.0610 0.0610 0.0610 0.0610 0.0610 0.0610 0.0610 0.0610 0.0610 0.0610 0.0610 0.0610 0.0610
B30.0557 0.0557 0.0557 0.0557 0.0557 0.0557 0.0557 0.0557 0.0557 0.0557 0.0557 0.0557 0.0557 0.0557 0.0557 0.0557 0.0557 0.0557 0.0557
B40.0562 0.0562 0.0562 0.0562 0.0562 0.0562 0.0562 0.0562 0.0562 0.0562 0.0562 0.0562 0.0562 0.0562 0.0562 0.0562 0.0562 0.0562 0.0562
B50.0489 0.0489 0.0489 0.0489 0.0489 0.0489 0.0489 0.0489 0.0489 0.0489 0.0489 0.0489 0.0489 0.0489 0.0489 0.0489 0.0489 0.0489 0.0489
C10.0465 0.0465 0.0465 0.0465 0.0465 0.0465 0.0465 0.0465 0.0465 0.0465 0.0465 0.0465 0.0465 0.0465 0.0465 0.0465 0.0465 0.0465 0.0465
C20.0545 0.0545 0.0545 0.0545 0.0545 0.0545 0.0545 0.0545 0.0545 0.0545 0.0545 0.0545 0.0545 0.0545 0.0545 0.0545 0.0545 0.0545 0.0545
C30.0561 0.0561 0.0561 0.0561 0.0561 0.0561 0.0561 0.0561 0.0561 0.0561 0.0561 0.0561 0.0561 0.0561 0.0561 0.0561 0.0561 0.0561 0.0561
D10.0551 0.0551 0.0551 0.0551 0.0551 0.0551 0.0551 0.0551 0.0551 0.0551 0.0551 0.0551 0.0551 0.0551 0.0551 0.0551 0.0551 0.0551 0.0551
D20.0452 0.0452 0.0452 0.0452 0.0452 0.0452 0.0452 0.0452 0.0452 0.0452 0.0452 0.0452 0.0452 0.0452 0.0452 0.0452 0.0452 0.0452 0.0452
D30.0500 0.0500 0.0500 0.0500 0.0500 0.0500 0.0500 0.0500 0.0500 0.0500 0.0500 0.0500 0.0500 0.0500 0.0500 0.0500 0.0500 0.0500 0.0500
D40.0555 0.0555 0.0555 0.0555 0.0555 0.0555 0.0555 0.0555 0.0555 0.0555 0.0555 0.0555 0.0555 0.0555 0.0555 0.0555 0.0555 0.0555 0.0555
D50.0451 0.0451 0.0451 0.0451 0.0451 0.0451 0.0451 0.0451 0.0451 0.0451 0.0451 0.0451 0.0451 0.0451 0.0451 0.0451 0.0451 0.0451 0.0451
E10.0520 0.0520 0.0520 0.0520 0.0520 0.0520 0.0520 0.0520 0.0520 0.0520 0.0520 0.0520 0.0520 0.0520 0.0520 0.0520 0.0520 0.0520 0.0520
E20.0533 0.0533 0.0533 0.0533 0.0533 0.0533 0.0533 0.0533 0.0533 0.0533 0.0533 0.0533 0.0533 0.0533 0.0533 0.0533 0.0533 0.0533 0.0533
E30.0572 0.0572 0.0572 0.0572 0.0572 0.0572 0.0572 0.0572 0.0572 0.0572 0.0572 0.0572 0.0572 0.0572 0.0572 0.0572 0.0572 0.0572 0.0572
Table A4. Criteria total relationship matrix.
A1A2A3B1B2B3B4B5C1C2C3D1D2D3D4D5E1E2E3
A10.0943 0.2202 0.1742 0.1511 0.1861 0.1691 0.1996 0.1915 0.1626 0.1959 0.1949 0.1863 0.1519 0.1733 0.2044 0.1451 0.1594 0.1562 0.1847
A20.1660 0.2406 0.2237 0.2305 0.2587 0.2561 0.2665 0.2502 0.2471 0.2554 0.2603 0.2543 0.2152 0.2394 0.2606 0.2281 0.2227 0.2288 0.2608
A30.1340 0.2352 0.1277 0.1648 0.2054 0.1749 0.2005 0.1970 0.1771 0.1968 0.1918 0.1777 0.1596 0.1563 0.1961 0.1577 0.1779 0.1795 0.2083
B10.1192 0.2337 0.1541 0.1319 0.2043 0.1828 0.1858 0.1951 0.1991 0.2000 0.1951 0.1811 0.1539 0.1818 0.1809 0.1474 0.1728 0.1740 0.1980
B20.1452 0.2741 0.2013 0.2215 0.2013 0.2459 0.2551 0.2445 0.2331 0.2402 0.2496 0.2348 0.2012 0.2204 0.2450 0.2097 0.2224 0.2242 0.2498
B30.1213 0.2632 0.1699 0.1853 0.2349 0.1755 0.2340 0.2280 0.2174 0.2149 0.2243 0.2148 0.1882 0.2014 0.2287 0.1966 0.2077 0.2096 0.2330
B40.1361 0.2647 0.1935 0.2042 0.2316 0.2173 0.1844 0.2206 0.2142 0.2298 0.2297 0.2288 0.1896 0.2019 0.2252 0.1928 0.1907 0.1967 0.2249
B50.1211 0.2285 0.1659 0.1753 0.2074 0.2035 0.1978 0.1529 0.1795 0.1939 0.2026 0.1926 0.1435 0.1711 0.1975 0.1547 0.1802 0.1817 0.2057
C10.1115 0.2240 0.1505 0.1837 0.2041 0.1914 0.1944 0.1740 0.1407 0.2004 0.1953 0.1809 0.1371 0.1684 0.1717 0.1346 0.1693 0.1661 0.1888
C20.1370 0.2583 0.1852 0.2002 0.2304 0.2077 0.2294 0.2159 0.2185 0.1702 0.2252 0.2057 0.1576 0.1965 0.2151 0.1825 0.2000 0.1973 0.2240
C30.1444 0.2642 0.1850 0.2001 0.2357 0.2262 0.2348 0.2301 0.2233 0.2214 0.1798 0.2196 0.1618 0.2011 0.2205 0.1825 0.2048 0.2064 0.2292
D10.1429 0.2562 0.1859 0.1829 0.2277 0.2184 0.2361 0.2210 0.2056 0.2084 0.2216 0.1709 0.1919 0.2122 0.2225 0.1949 0.1916 0.1933 0.2170
D20.1144 0.2235 0.1331 0.1508 0.1947 0.1836 0.1951 0.1628 0.1624 0.1641 0.1635 0.1916 0.1182 0.1850 0.1959 0.1793 0.1452 0.1468 0.1890
D30.1374 0.2369 0.1546 0.1723 0.2015 0.1933 0.2060 0.1736 0.1811 0.1875 0.1961 0.2101 0.1795 0.1477 0.2107 0.1863 0.1765 0.1737 0.2087
D40.1616 0.2615 0.1914 0.1737 0.2238 0.2232 0.2284 0.2173 0.1924 0.2134 0.2136 0.2179 0.1931 0.2133 0.1778 0.2050 0.1921 0.1938 0.2268
D50.1144 0.2189 0.1418 0.1375 0.1944 0.1875 0.1906 0.1541 0.1581 0.1771 0.1852 0.1779 0.1636 0.1886 0.1912 0.1240 0.1411 0.1470 0.1977
E10.1277 0.2491 0.1701 0.1754 0.2179 0.2050 0.2172 0.2131 0.2021 0.1995 0.2130 0.2029 0.1470 0.1938 0.2121 0.1632 0.1475 0.2041 0.2206
E20.1303 0.2540 0.1824 0.1744 0.2310 0.2179 0.2217 0.2176 0.2016 0.1992 0.2172 0.2070 0.1552 0.1932 0.2167 0.1671 0.2064 0.1531 0.2295
E30.1425 0.2683 0.1916 0.1884 0.2347 0.2251 0.2340 0.2233 0.2122 0.2235 0.2330 0.2189 0.1831 0.2226 0.2290 0.2044 0.2071 0.2175 0.1867

References

  1. Bhattacharjee, A.; Higson, C.; Holly, S.; Kattuman, P. Macroeconomic instability and business exit: Determinants of failures and acquisitions of UK firms. Economica 2009, 76, 108–131. [Google Scholar] [CrossRef]
  2. Fischer, S. The role of macroeconomic factors in growth. J. Monet. Econ. 1993, 32, 485–512. [Google Scholar] [CrossRef]
  3. Mahmood, I.; Chung, C.N.; Mitchell, W. Political connections and business strategy in dynamic environments: How types and destinations of political ties affect business diversification in closed and open political economic contexts. Glob. Strategy J. 2017, 7, 375–399. [Google Scholar] [CrossRef]
  4. Aisen, A.; Veiga, F.J. How does political instability affect economic growth? Eur. J. Political Econ. 2013, 29, 151–167. [Google Scholar] [CrossRef]
  5. Luo, C.M.; Chang, H.F. SME competitive strategy: Learning from Taiwan’s ODM industry. Bus. Strategy Ser. 2011, 12, 107–114. [Google Scholar] [CrossRef]
  6. Chesbrough, H. Business model innovation: Opportunities and barriers. Long Range Plan. 2010, 43, 354–363. [Google Scholar] [CrossRef]
  7. Collis, D.J. Research note: How valuable are organizational capabilities? Strateg. Manag. J. 1994, 15, 143–152. [Google Scholar] [CrossRef]
  8. Knight, G.A.; Cavusgil, S.T. Innovation, organizational capabilities, and the born-global firm. J. Int. Bus. Stud. 2004, 35, 124–141. [Google Scholar] [CrossRef]
  9. Lawson, B.; Samson, D. Developing innovation capability in organisations: A dynamic capabilities approach. Int. J. Innov. Manag. 2001, 5, 377–400. [Google Scholar] [CrossRef]
  10. Saunila, M. Innovation capability in SMEs: A systematic review of the literature. J. Innov. Knowl. 2020, 5, 260–265. [Google Scholar] [CrossRef]
  11. Jerez-Gómez, P.; Céspedes-Lorente, J.; Valle-Cabrera, R. Organizational learning and compensation strategies: Evidence from the Spanish chemical industry. Hum. Resour. Manag. 2005, 44, 279–299. [Google Scholar] [CrossRef]
  12. Castañer, X.; Oliveira, N. Collaboration, coordination, and cooperation among organizations: Establishing the distinctive meanings of these terms through a systematic literature review. J. Manag. 2020, 46, 965–1001. [Google Scholar] [CrossRef]
  13. Feng, C.-C.; Chang, K.-F.; Lin, J.-X.; Lee, T.-C.; Lin, S.-M. Toward green transition in the post Paris Agreement era: The case of Taiwan. Energy Policy 2022, 165, 112996. [Google Scholar] [CrossRef]
  14. Nerkar, A.; Paruchuri, S. Evolution of R&D capabilities: The role of knowledge networks within a firm. Manag. Sci. 2005, 51, 771–785. [Google Scholar]
  15. Tsai-Lin, T.-F.; Chi, H.-R.; Chang, Y.-C. The business model and innovation mix in the transition of contract manufacturers in the greater China region. Asia Pac. Bus. Rev. 2021, 27, 444–469. [Google Scholar] [CrossRef]
  16. Chen, C.-L. Cross-disciplinary innovations by Taiwanese manufacturing SMEs in the context of Industry 4.0. J. Manuf. Technol. Manag. 2020, 31, 1145–1168. [Google Scholar] [CrossRef]
  17. Coombs, R. Core competencies and the strategic management of R&D. RD Manag. 1996, 26, 345–355. [Google Scholar]
  18. Vorhies, D.W.; Morgan, N.A. Benchmarking marketing capabilities for sustainable competitive advantage. J. Mark. 2005, 69, 80–94. [Google Scholar] [CrossRef]
  19. Iyer, P.; Davari, A.; Zolfagharian, M.; Paswan, A. Market orientation, positioning strategy and brand performance. Ind. Mark. Manag. 2019, 81, 16–29. [Google Scholar] [CrossRef]
  20. Hoyer, W.D.; Brown, S.P. Effects of brand awareness on choice for a common, repeat-purchase product. J. Consum. Res. 1990, 17, 141–148. [Google Scholar] [CrossRef]
  21. Kozlenkova, I.V.; Hult, G.T.M.; Lund, D.J.; Mena, J.A.; Kekec, P. The role of marketing channels in supply chain management. J. Retail. 2015, 91, 586–609. [Google Scholar] [CrossRef]
  22. Shokouhyar, S.; Shokoohyar, S.; Safari, S. Research on the influence of after-sales service quality factors on customer satisfaction. J. Retail. Consum. Serv. 2020, 56, 102139. [Google Scholar] [CrossRef]
  23. Murali, S.; Pugazhendhi, S.; Muralidharan, C. Modelling and investigating the relationship of after sales service quality with customer satisfaction, retention and loyalty—A case study of home appliances business. J. Retail. Consum. Serv. 2016, 30, 67–83. [Google Scholar] [CrossRef]
  24. Bag, S.; Gupta, S.; Kumar, S. Industry 4.0 adoption and 10R advance manufacturing capabilities for sustainable development. Int. J. Prod. Econ. 2021, 231, 107844. [Google Scholar] [CrossRef]
  25. Corbett, L.M.; Claridge, G. Key manufacturing capability elements and business performance. Int. J. Prod. Res. 2002, 40, 109–131. [Google Scholar] [CrossRef]
  26. Zheng, P.; Wang, H.; Sang, Z.; Zhong, R.Y.; Liu, Y.; Liu, C.; Mubarok, K.; Yu, S.; Xu, X. Smart manufacturing systems for Industry 4.0: Conceptual framework, scenarios, and future perspectives. Front. Mech. Eng. 2018, 13, 137–150. [Google Scholar] [CrossRef]
  27. Lewis, M.A. Lean production and sustainable competitive advantage. Int. J. Oper. Prod. Manag. 2000, 20, 959–978. [Google Scholar] [CrossRef]
  28. Shieh, J.-I.; Wu, H.-H.; Huang, K.-K. A DEMATEL method in identifying key success factors of hospital service quality. Knowl.-Based Syst. 2010, 23, 277–282. [Google Scholar] [CrossRef]
  29. Wang, Y.; Qi, L.; Dou, R.; Shen, S.; Hou, L.; Liu, Y.; Yang, Y.; Kong, L. An accuracy-enhanced group recommendation approach based on DEMATEL. Pattern Recognit. Lett. 2023, 167, 171–180. [Google Scholar] [CrossRef]
  30. Büyüközkan, G.; Güleryüz, S. An integrated DEMATEL-ANP approach for renewable energy resources selection in Turkey. Int. J. Prod. Econ. 2016, 182, 435–448. [Google Scholar] [CrossRef]
  31. Abdelkhalek, S.; Zayed, T. Performance assessment model of non-destructive technologies in inspecting concrete bridge decks. Struct. Infrastruct. Eng. 2023, 19, 216–237. [Google Scholar] [CrossRef]
  32. Aruldoss, M.; Lakshmi, T.M.; Venkatesan, V.P. A survey on multi criteria decision making methods and its applications. Am. J. Inf. Syst. 2013, 1, 31–43. [Google Scholar]
  33. Kumar, A.; Sah, B.; Singh, A.R.; Deng, Y.; He, X.; Kumar, P.; Bansal, R. A review of multi criteria decision making (MCDM) towards sustainable renewable energy development. Renew. Sustain. Energy Rev. 2017, 69, 596–609. [Google Scholar] [CrossRef]
  34. Zavadskas, E.K.; Turskis, Z. Multiple criteria decision making (MCDM) methods in economics: An overview. Technol. Econ. Dev. Econ. 2011, 17, 397–427. [Google Scholar] [CrossRef]
  35. Sarwar, M.; Ali, G.; Chaudhry, N.R. Decision-making model for failure modes and effect analysis based on rough fuzzy integrated clouds. Appl. Soft Comput. 2023, 136, 110148. [Google Scholar] [CrossRef]
  36. Tseng, S.-H.; Chen, H.-C.; Nguyen, T.S. Key Success Factors of Sustainable Organization for Traditional Manufacturing Industries: A Case Study in Taiwan. Mathematics 2022, 10, 4389. [Google Scholar] [CrossRef]
  37. Yang, C.-H.; Chen, Y.-C.; Hsu, W.; Chen, Y.-H. Evaluation of smart long-term care information strategy portfolio decision model: The national healthcare environment in Taiwan. Ann. Oper. Res. 2023, 1–32. [Google Scholar] [CrossRef]
  38. Landeta, J. Current validity of the Delphi method in social sciences. Technol. Forecast. Soc. Change 2006, 73, 467–482. [Google Scholar] [CrossRef]
  39. Feng, Y. Democracy, political stability and economic growth. Br. J. Political Sci. 1997, 27, 391–418. [Google Scholar] [CrossRef]
  40. Huang, Y.-L.; Intarakumnerd, P. Alternative technological learning paths of Taiwanese firms. Asian J. Technol. Innov. 2019, 27, 301–314. [Google Scholar] [CrossRef]
  41. Chen, D.; Wei, W.; Hu, D.; Muralidharan, E. Survival strategy of OEM companies: A case study of the Chinese toy industry. Int. J. Oper. Prod. Manag. 2016, 36, 1065–1088. [Google Scholar] [CrossRef]
  42. De Vasconcellos, S.L.; Garrido, I.L.; Parente, R.C. Organizational creativity as a crucial resource for building international business competence. Int. Bus. Rev. 2019, 28, 438–449. [Google Scholar] [CrossRef]
  43. Yusuf, S. From creativity to innovation. Technol. Soc. 2009, 31, 1–8. [Google Scholar] [CrossRef]
  44. North, K.; Kumta, G. Knowledge Management: Value Creation through Organizational Learning; Springer: Berlin/Heidelberg, Germany, 2018. [Google Scholar]
  45. Migdadi, M.M. Organizational learning capability, innovation and organizational performance. Eur. J. Innov. Manag. 2019, 24, 151–172. [Google Scholar] [CrossRef]
  46. Fernández-Mesa, A.; Alegre-Vidal, J.; Chiva-Gómez, R.; Gutiérrez-Gracia, A. Design management capability and product innovation in SMEs. Manag. Decis. 2013, 51, 547–565. [Google Scholar] [CrossRef]
  47. Grant, R.M. Prospering in dynamically-competitive environments: Organizational capability as knowledge integration. Organ. Sci. 1996, 7, 375–387. [Google Scholar] [CrossRef]
  48. Sharma, S.; Vredenburg, H. Proactive corporate environmental strategy and the development of competitively valuable organizational capabilities. Strateg. Manag. J. 1998, 19, 729–753. [Google Scholar] [CrossRef]
  49. Ng, S.C.; Zhao, X.; Fan, X.; Rungtusanatham, J.M. TQM and brand-building by Chinese original brand manufacturers: Impact on business performance. Int. J. Prod. Res. 2014, 52, 825–846. [Google Scholar] [CrossRef]
  50. Cepeda, G.; Vera, D. Dynamic capabilities and operational capabilities: A knowledge management perspective. J. Bus. Res. 2007, 60, 426–437. [Google Scholar] [CrossRef]
  51. Bhatia, M.S. Green process innovation and operational performance: The role of proactive environment strategy, technological capabilities, and organizational learning. Bus. Strategy Environ. 2021, 30, 2845–2857. [Google Scholar] [CrossRef]
  52. Sansone, C.; Hilletofth, P.; Eriksson, D. Evaluation of critical operations capabilities for competitive manufacturing in a high-cost environment. J. Glob. Oper. Strateg. Sourc. 2020, 13, 229–250. [Google Scholar] [CrossRef]
  53. Lee, K.; Song, J.; Kwak, J. An exploratory study on the transition from OEM to OBM: Case studies of SMEs in Korea. Ind. Innov. 2015, 22, 423–442. [Google Scholar] [CrossRef]
  54. Shih, Y.-Y.; Lin, C.-A. Co-location with marketing value activities as manufacturing upgrading in a COVID-19 outbreak era. J. Bus. Res. 2022, 148, 410–419. [Google Scholar] [CrossRef]
  55. Liu, F.-H.; Liu, H.-Y.; Lin, T.-L. The competence and constraints of brand building for contract manufacturers. J. Brand Manag. 2008, 15, 412–432. [Google Scholar] [CrossRef]
  56. Mao, Y. Factors that Influence Enterprise Transformation and Upgrading. In Transformation and Upgrading of Chinese Enterprises; Springer: Berlin/Heidelberg, Germany, 2019; pp. 223–236. [Google Scholar]
  57. Lin, F.; Siu, W.-S. Exploring brand management strategies in Chinese manufacturing industry. J. Brand Manag. 2020, 27, 48–76. [Google Scholar] [CrossRef]
  58. Huang, R.; Sarigöllü, E. How brand awareness relates to market outcome, brand equity, and the marketing mix. J. Bus. Res. 2012, 65, 92–99. [Google Scholar] [CrossRef]
  59. Huang, P.-L.; Lee, B.C.; Chen, C.-C. The influence of service quality on customer satisfaction and loyalty in B2B technology service industry. Total Qual. Manag. Bus. Excell. 2019, 30, 1449–1465. [Google Scholar] [CrossRef]
  60. Durugbo, C.M. After-sales services and aftermarket support: A systematic review, theory and future research directions. Int. J. Prod. Res. 2020, 58, 1857–1892. [Google Scholar] [CrossRef]
  61. Asugman, G.; Johnson, J.L.; McCullough, J. The role of after-sales service in international marketing. J. Int. Mark. 1997, 5, 11–28. [Google Scholar] [CrossRef]
  62. Zhou, B.; Marjerison, R.K.; Chang, F.-H. Chinese OEM Manufacturing Roadmap: SMEs–To Brand or Not to Brand. In Handbook of Research on Emerging Business Models and the New World Economic Order; IGI Global: Hershey, PA, USA, 2022; pp. 163–182. [Google Scholar]
  63. Barari, A.; de Sales Guerra Tsuzuki, M.; Cohen, Y.; Macchi, M. Intelligent manufacturing systems towards industry 4.0 era. J. Intell. Manuf. 2021, 32, 1793–1796. [Google Scholar] [CrossRef]
  64. Manzakoğlu, B.T.; Er, Ö. Design management capability framework in global value chains: Integrating the functional upgrading theory from OEM to ODM and OBM. Des. J. 2018, 21, 139–161. [Google Scholar] [CrossRef]
  65. Sun, H.; Zhao, Y. The empirical relationship between quality management and the speed of new product development. Total Qual. Manag. 2010, 21, 351–361. [Google Scholar] [CrossRef]
Figure 1. The proposed DEMATEL–ANP method.
Mathematics 11 02439 g001
Figure 2. Cause-and-effect relationship diagram among key criteria.
Mathematics 11 02439 g002
Table 1. Formal research framework.
ComponentCriteriaReferences
Macro environmentPolitical and economic stability (A1)Feng [39], Feng, Chang, Lin, Lee, and Lin [13], Mahmood, Chung, and Mitchell [3], Fischer [2]
Industry competitiveness (A2)Luo and Chang [5], Huang and Intarakumnerd [40]
Material and component stability (A3)Chen et al. [41], Huang and Intarakumnerd [40], Knight and Cavusgil [8]
Organizational capabilityOrganizational innovation (B1)Knight and Cavusgil [8], De Vasconcellos et al. [42], Yusuf [43], Saunila [10], Lawson and Samson [9]
Organizational management and learning ability (B2)North and Kumta [44], Migdadi [45], Fernández-Mesa et al. [46], Jerez-Gómez, Céspedes-Lorente, and Valle-Cabrera [11]
Coordination and integration ability (B3)Grant [47], Sharma and Vredenburg [48], Ng et al. [49]
Environmental responsiveness (B4)Feng, Chang, Lin, Lee, and Lin [13], Sharma and Vredenburg [48]
Operational capability (B5)Cepeda and Vera [50], Bhatia [51], Sansone et al. [52]
R&D and technological capabilitiesProduct design innovation (C1)Fernández-Mesa, Alegre-Vidal, Chiva-Gómez, and Gutiérrez-Gracia [46], Migdadi [45], Yusuf [43], Tsai-Lin, Chi, and Chang [15]
Ability to absorb and utilize external technologies (C2)Chen [16], Lee et al. [53], Shih and Lin [54], Luo and Chang [5]
Mastery and construction of core competencies (C3)Liu et al. [55], Knight and Cavusgil [8], Coombs [17]
Marketing capabilityClear market positioning strategy (D1)Iyer, Davari, Zolfagharian, and Paswan [19], Lee, Song, and Kwak [53]
Perfect marketing channels (D2)Kozlenkova, Hult, Lund, Mena, and Kekec [21], Mao [56], Lee, Song, and Kwak [53]
Brand awareness (D3)Lin and Siu [57], Huang and Sarigöllü [58], Huang et al. [59], Hoyer and Brown [20]
Global logistics and support capabilities (D4)Lee, Song, and Kwak [53], Chen, Wei, Hu, and Muralidharan [41]
After-sales service (D5)Shokouhyar, Shokoohyar, and Safari [22], Durugbo [60], Asugman et al. [61], Murali, Pugazhendhi, and Muralidharan [23]
Manufacturing capabilitySmart manufacturing capability (E1)Zheng, Wang, Sang, Zhong, Liu, Liu, Mubarok, Yu, and Xu [26], Zhou et al. [62], Barari et al. [63]
Lean production system (E2)Lewis [27], Zhou, Marjerison, and Chang [62]
Quality management (E3)Manzakoğlu and Er [64], Sun and Zhao [65], Knight and Cavusgil [8]
Table 2. Importance and the correlation.
Criteria Column   Sum   ( d ) Row   Sum   ( r ) The   Sum   of   Column   and   Row   ( d + r ) Difference   between   Column   and   Row   ( d r ) Ranking
A13.30072.50165.80230.799119
A24.56504.67529.2402−0.11021
A33.41843.28196.70030.136516
B13.39083.40406.7948−0.013215
B24.31934.12578.44500.19362
B33.94873.90437.85300.04447
B43.97704.11158.0885−0.13464
B53.45543.88277.3380−0.427310
C13.28693.72817.0150−0.441214
C23.85683.89147.7482−0.03469
C33.97103.99197.9629−0.02095
D13.90083.87387.77460.02708
D23.19893.19116.39000.007918
D33.53363.66837.2019−0.134712
D43.92004.00147.9215−0.08146
D53.19083.35586.5466−0.165117
E13.68143.51547.19680.166013
E23.77563.54997.32560.225711
E34.04584.08298.1288−0.03713
Table 3. Cause–effect characteristics of criteria.
CharacteristicCriteria
CauseA1, A3, B2, B3, D1, D2, E1, E2
EffectA2, B1, B4, B5, C1, C2, C3, D3, D4, D5, E3
Table 4. Summary of Weights of Criteria.
CriteriaDEMATEL RankingDEMATEL–ANP RankingBorda ScoreOverall Ranking
A11916353
A211219
A31614305
B11515305
B222418
B3761313
B444816
B51013239
C11417314
C2991811
C3551015
D1881612
D21818361
D31212247
D4671313
D51719361
E11311247
E211102110
E333617
Disclaimer/Publisher’s Note: The statements, opinions and data contained in all publications are solely those of the individual author(s) and contributor(s) and not of MDPI and/or the editor(s). MDPI and/or the editor(s) disclaim responsibility for any injury to people or property resulting from any ideas, methods, instructions or products referred to in the content.

