Article

Performance Analysis and Assessment of Type 2 Diabetes Screening Scores in Patients with Non-Alcoholic Fatty Liver Disease

by
Norma Latif Fitriyani
1,
Muhammad Syafrudin
2,*,
Siti Maghfirotul Ulyah
3,4,
Ganjar Alfian
5,
Syifa Latif Qolbiyani
6,
Chuan-Kai Yang
7,
Jongtae Rhee
8 and
Muhammad Anshari
9
1
Department of Data Science, Sejong University, Seoul 05006, Republic of Korea
2
Department of Artificial Intelligence, Sejong University, Seoul 05006, Republic of Korea
3
Department of Mathematics, Khalifa University, Abu Dhabi 127788, United Arab Emirates
4
Department of Mathematics, Faculty of Science and Technology, Universitas Airlangga, Surabaya 60115, Indonesia
5
Department of Electrical Engineering and Informatics, Vocational College, Universitas Gadjah Mada, Yogyakarta 55281, Indonesia
6
Department of Community Development, Universitas Sebelas Maret, Surakarta 57126, Indonesia
7
Department of Information Management, National Taiwan University of Science and Technology, Taipei City 106335, Taiwan
8
Department of Industrial and Systems Engineering, Dongguk University, Seoul 04620, Republic of Korea
9
School of Business & Economics, Universiti Brunei Darussalam, Bandar Seri Begawan BE1410, Brunei
*
Author to whom correspondence should be addressed.
Mathematics 2023, 11(10), 2266; https://doi.org/10.3390/math11102266
Submission received: 16 March 2023 / Revised: 28 April 2023 / Accepted: 2 May 2023 / Published: 12 May 2023

Abstract

:
Type 2 diabetes (T2D) and non-alcoholic fatty liver disease (NAFLD) are worldwide chronic diseases that have strong relationships with one another and commonly exist together. Type 2 diabetes is considered one of the risk factors for NAFLD, so its occurrence in people with NAFLD is highly likely. As the high and increasing number of T2D and NAFLD, which potentially followed by existing together number, an analysis and assessment of T2D screening scores in people with NAFLD is necessary to be done. To prevent this potential case, an effective early prediction model is also required to be developed, which could help the patients avoid the dangers of both existing diseases. Therefore, in this study, analysis and assessment of T2D screening scores in people with NAFLD and the early prediction model utilizing a forward logistic regression-based feature selection method and multi-layer perceptrons are proposed. Our analysis and assessment results showed that the prevalence of T2D among patients with NAFLD was 8.13% (for prediabetes) and 37.19% (for diabetes) in two population-based NAFLD datasets. The variables related to clinical tests, such as alanine aminotransferase (ALT), aspartate aminotransferase (AST), alkaline phosphatase (ALP), gamma-glutamyl transferase (GGT), and systolic blood pressure (SBP), were found to be statistically significant predictors (p-values < 0.001) that indicate a strong association with T2D among patients with NAFLD in both the prediabetes and diabetes NAFLD datasets. Finally, our proposed model showed the best performance in terms of all performance evaluation metrics compared to existing various machine learning models and also the models using variables recommended by WHO/CDC/ADA, with achieved accuracy as much as 92.11% and 83.05% and its improvement scores after feature selection of 1.35% and 5.35%, for the first and second dataset, respectively.

1. Introduction

Type 2 diabetes (T2D) has emerged as one of the chronic diseases to which people are most vulnerable. People with this disease are becoming increasingly susceptible to infections and complicated illnesses as a result of aspects of unhealthy lifestyles, especially poor eating habits and a lack of exercise [1,2]. When it happens, the blood glucose becomes improperly managed, which causes a number of difficulties, such as blurred vision, hearing difficulty, oral health problems, liver problems, etc. Non-alcoholic fatty liver disease (NAFLD) is highly likely to occur in people with T2D, affecting approximately 24–26% of people in the US and leading to a high percentage of them developing T2D or impaired glucose tolerance [3]. When they drink little to no alcohol, this effect happens and could lead to fat accumulation, which leads to liver damage and inflammation [4]. Type 2 diabetes is one of the risk factors for NAFLD, but it may also be the other way around. Non-alcoholic fatty liver disease may potentially be a factor in T2D (prediabetes and diabetes), as the liver is crucial in controlling blood sugar levels in the body, and fasting glucose levels are more difficult to regulate as a result of the critical organ’s accumulation of fat. Additionally, it increases the body’s resistance to insulin, putting the pancreas and its beta cells under stress and hastening the onset of T2D [5]. Therefore, T2D and NAFLD are correlated with one another, and they commonly exist together [6]. When this happens, it has the potential to cause chronic conditions (e.g., hepatic and extrahepatic), complications, such as the development of cardiovascular disease (CVD), chronic kidney disease (CKD), and stroke, which could result in a higher risk of mortality [7].
As reported by the International Diabetes Federation, the prevalence of T2D in 2021 was 536.5 million adult people and was going to rise to 783.2 million in 2045 around the world [8,9]. This was followed by the prevalence of NAFLD, which is estimated at around 24% of the total global population [10]. Given the significant global incidence of T2D and NAFLD and its hazards, an appropriate solution is needed to prevent the development of T2D in patients with NAFLD.
Analysis and assessment of disease screening scores are one of the alternatives that can be utilized to early detect T2D [11]. Analysis and assessment of disease screening scores is an important stage in order to identify the issues related to the patient, summarize the main predictors of the disease [12], as well as correctly detect problems to enable appropriate care for the patient [13]. Kianpour et al. [14] evaluated the performance of diabetes screening scores in the Iranian population. The evaluation is proposed to find out the association between the risk factors and T2D, the prevalence of T2D based on the results of capillary blood glucose (CBG), venus plasma glucose (VPG), and glycated hemoglobin (HbA1c) tests, and measure the effectiveness of those tests by measuring their sensitivity, specificity, positive predictive value (PPV), negative predictive value (NPV), and area under the curve (AUC). By conducting screening score analysis, they found that the risk factors have a strong relationship with T2D in the Iranian population, and using CBG, VPG, and HbA1c, the prevalence of T2D was higher compared to WHO or ADA recommendation tests, while the performance of those tests was better than that of WHO or ADA recommendation tests and also previous studies. Meng et al. in 2021 [12] assessed the performance of diabetes and kidney disease screening scores in the United States and Korean populations. Statistical analyses are conducted to summarize the nationally representative sample, find out the characteristics and general status among the subject’s populations, measure the association between predictors and the diseases, and assess the performance of the diagnostic tests using various cut points based on cut-point determination methods. The screening score assessment showed that 30% to 60% of participants were categorized as being at high risk, and some of the measured predictors were found to be statistically significant and associated with the diseases. They could reveal that age equal and older than 50 years old has a very high odds ratio (OR), where the incidence of kidney disease is 5 to 73 times more likely to be exposed to people that age than those without kidney disease. The results of the test performance also showed better when using Youden Index-based cut points compared to the cut points recommended by WHO/ADA. Using the same population as [12], Lee et al. [14] used the screening score for diabetes. The assessment is conducted to reveal the association between the risk factors and diabetes, measure the prevalence of high-risk groups, and evaluate the performance of the tests. Using cut points of 5 for the screening score range, the results showed that 47% of adults were classified as being at high risk for diabetes. The performance of the test also performed better compared to the WHO/ADA recommendation cut point, achieving a sensitivity of 81%, a specificity of 54%, a PPV of 6%, and an LR+ of 1.8 with an AUC of 0.73. In 2020, Mao et al. [15] measured the efficacy of the new Chinese diabetes risk score (NCDRS) in screening for undiagnosed T2D and prediabetes using a community-based cross-sectional study in eastern China. The researchers measured the characteristic scores of the participant and the performance of the proposed new Chinese diabetes risk score, which ranged from 25 to 32. Using a cut point of 25 for the NCDRS, the prevalence of high risk increased, as did the performance of the test compared with optimal Youden Index cut point utilization, with sensitivity and specificity of 84.8% and 50.1%, respectively. Finally, in 2022, Fitriyani et al. [16] analyzed the diabetes scores using nationally representative demographic data, consisting of Chinese, Japanese, Korean, Trinidadians, and PIMA Indians. The objectives of the analysis are to find out the relationship between the risk factors and diabetes, determine the optimal cut points for classification, and determine the best model for prediction. As the results show, by using diabetes assessment scores, all the objectives are achieved and concluded by various findings across all nationally representative populations.
Aside from the analysis and assessment of disease screening scores using statistical analysis, another method that is widely used for assessing the screening scores is machine learning-based analysis which has been widely and successfully used in medical informatics [17,18,19,20,21,22,23,24]. Several recent studies have analyzed disease screening and diagnosis, especially for diabetes, utilizing machine learning methods, while most of them also proposed prediction models utilizing machine learning methods [25,26,27]. One of the well-known and commonly used machine learning models for disease prediction is a multilayer perceptron (MLP). Al Bataineh and Manacek [28] proposed a heart disease prediction model using MLP combined with particle-based optimization (PSO). The proposed model is applied to the Cleveland heart disease dataset. The performance of the model showed that the MLP + PSO model outperforms all the existing models and previous studies, with the accuracy of the model being 84.60% and an AUC is 0.848. In 2022, Pal et al. [29] used MLP for predicting cardiovascular disease. The MLP algorithm was applied after feature selection in the CVD dataset. It achieved the best accuracy and AUC compared to other machine learning algorithms, with accuracy and AUC of 82.47% and 0.854, respectively. Bikku [30] proposed a health risk prediction model that utilized MLP. The proposed research focuses on supervised learning techniques and how well they may uncover hidden patterns in actual historical medical data. The goal is to anticipate future risks using the multi-layer perceptron approach with a specified degree of probability. The results of comparing the suggested approach to conventional classification methods demonstrate that the proposed method is superior to Long Short-Term Memory (LSTM) and Recurrent Neural Network (RNN), with an average accuracy of more than 95%. Sivaranjani and Yuvaraj [31] developed a model using MLP for early predicting cardiac functionalities. The proposed prediction model could achieve an accuracy as high as 97.67%. Aside from utilizing a proper machine learning model for classification and prediction, previous studies also considered utilizing a method for selecting the most important features, thus improving the performance of the prediction model. In medical research, Zhang [32] analyzes the performance of the feature selection methods, such as stepwise and best subset regression. The stepwise methods used in the analysis consisted of forward and backward methods. The results showed that the forward method effectively selected the feature with the smallest number of features. Sanchez-Pinto et al. [33] evaluated the performance of the various feature selection models when applied to any machine learning models for predicting clinical deterioration and acute kidney injury in children. Among the eight (8) feature selections used in the experiment, stepwise logistic regression-based feature selection, which selects the features with a p-value < 0.05, raised the AUC score of the model from 0.78 to 0.837. Soroush et al. developed a hybrid customer prediction system utilizing a forward stepwise logistic regression model in order to predict mobile home policy purchasers [34]. 47 out of 86 features were selected and then used for prediction. Utilizing logistic regression, the model could predict 58.3% of total purchasers and 17.4% of predicted customers. The proposed model performs better compared to other existing models. We found that several previous studies have used forward logistic regression as an effective feature selection method, which could improve the performance of the prediction model. According to this literature review results, MLP combined with a forward logistic regression-based feature selection method has not been applied by previous studies, especially for predicting diabetes. MLP was found to be a good and widely used model in the biomedical field for disease prediction due to its ability in solving complex computational problems from large sets of data with multiple variables. The capability of MLP fits the medical data and thus could be used for risk analysis and accurate classification.
Therefore, in this study, we proposed a T2D prediction model utilizing an MLP-based machine learning model combined with a forward logistic regression-based feature selection method and also aimed to analyze and assess the T2D screening scores among patients with NAFLD.

2. Materials and Methods

2.1. Data Sources and Study Population

In this study, we utilized and analyzed two clinical publicly available datasets which contain all subjects with positive NAFLD in mild and severe types, called NAFL and NASH. The analyses are conducted by measuring the T2D scores, especially in prediabetes and diabetes stages. The detailed data sources and study populations are as follows:
  • The first dataset is NAFLD in the Gifu area longitudinal analysis dataset (Gifu NAFLD). The Gifu NAFLD dataset is an investigation of medical examination program data from Murakami Memorial Hospital in Gifu, Japan, using a population-based longitudinal approach [35]. The participants consist of 15,464 in all, ranging in age from 22 to 70. In this dataset, none of the subjects have fasting blood glucose (FBG) greater than 125 mg/dL or glycated hemoglobin (HbA1c) greater than 6.5%, which is categorized as diabetes. However, the T2D cases are in the range of 100 to 125 mg/dL for FBG and 5.7 to 6.4% for HbA1c, which means that the subjects who were diagnosed with T2D in this dataset were subjects with prediabetes. In order to analyze the T2D scores among patients with NAFLD, we modified the dataset by selecting data where the patient is diagnosed with NAFLD; thus, the final data used is from 2741 patients, consisting of 2255 men and 486 women. We used all available data for the analysis, with 30 features with some classes included.
  • The second dataset is NAFLD [36] dataset which is a population-based longitudinal data collection gathered from a program for patients with NAFLD who were undergoing medical examinations. This dataset has a total of 605 participants, including 321 males and 284 women. The patients who took part in this medical examination program ranged in age from 18 to 71, and the majority of them had the severe form of NAFLD known as NASH, which affected 537 individuals, or 88.76% of the total. In this dataset, according to FBG and HbA1c data, the T2D cases are in the stage of prediabetes and diabetes stages. 62 features with some classes make up the whole dataset.

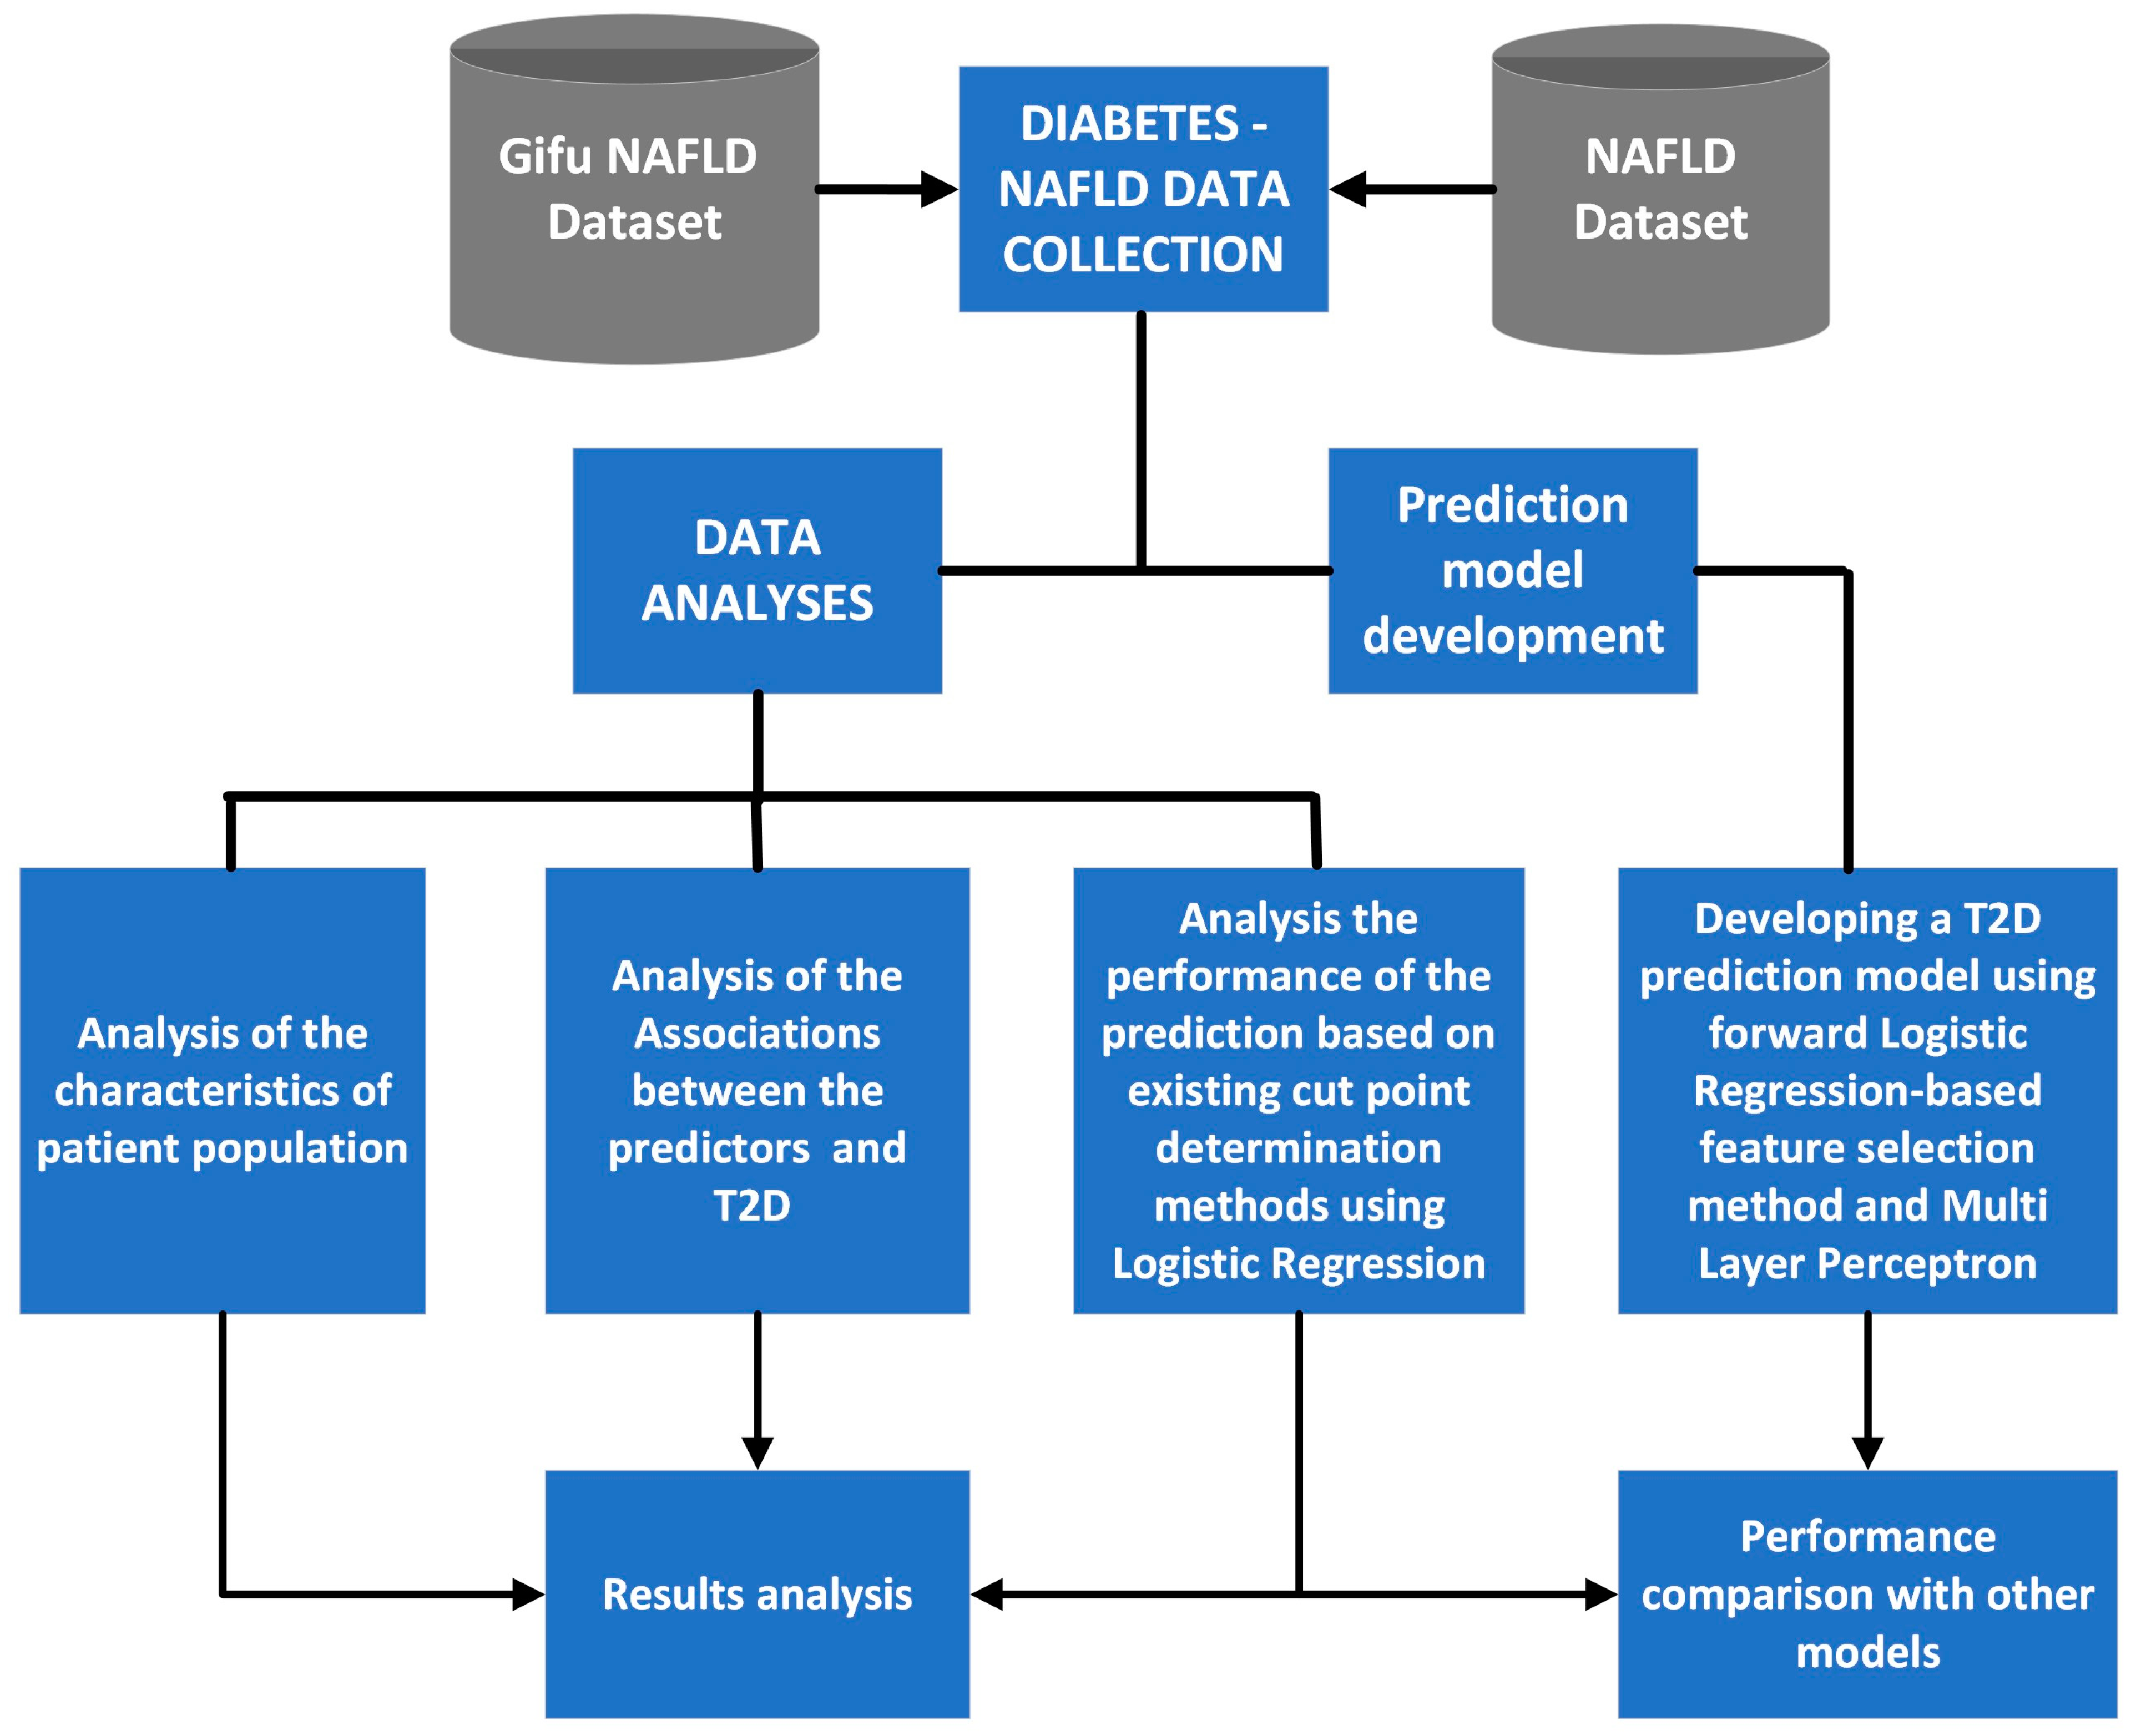
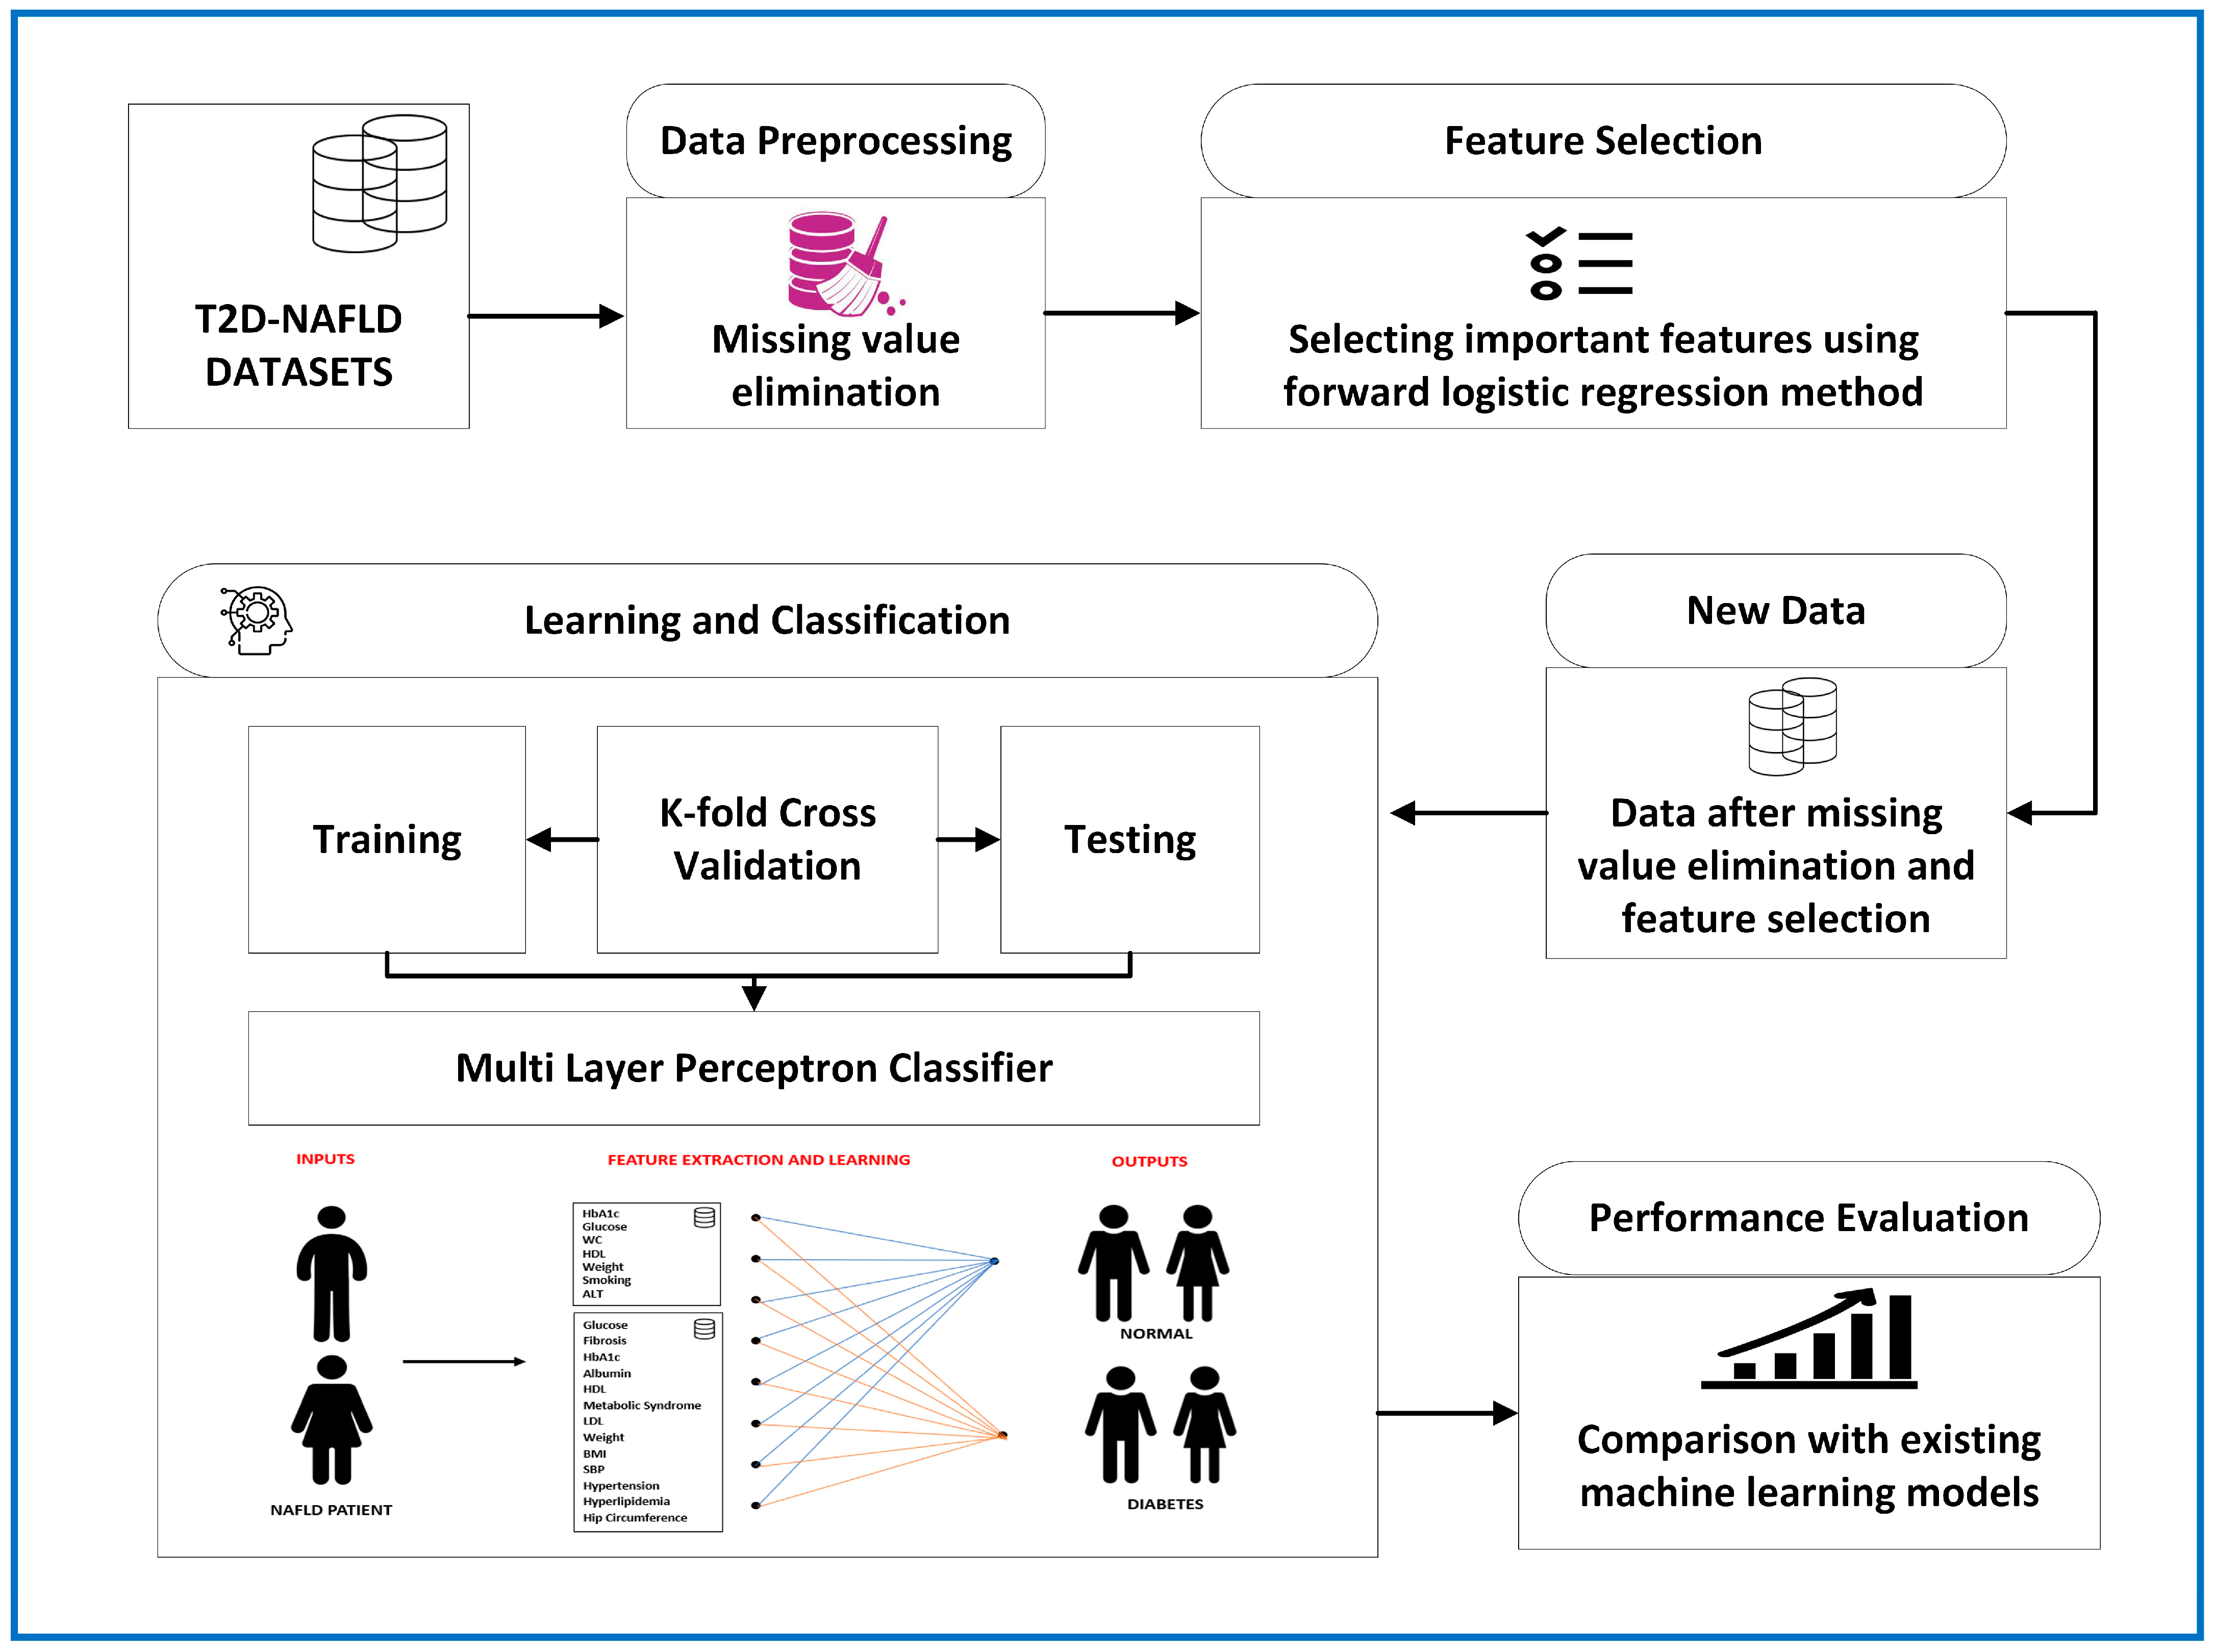
2.2. Study Design and Implementation

Our proposed study has four main objectives, shown in Figure 1. To achieve the objectives, we first collected clinical data related to T2D and NAFLD. Once T2D data are collected, we further analyze the patient characteristics to summarize representative study participants. The patient characteristics measurement is accomplished by descriptive statistics, with measurement of the mean, standard deviation (STD), and the number of samples and their percentage, n (%). After analyzing the patient characteristics, furthermore, we measured the associations between the predictors, as well as the risk factors and T2D in each stage among patients with NAFLD, in NAFL or NASH stages. The association measurement is calculated by utilizing logistic regression, to achieve odds ratio (OR), 95% confidence index (95% CI), and significance p-value with an applied chi-square test [12,14,37]. We accomplished the association analysis by following the guidelines of WHO [38,39], the CDC [40], and ADA [41], thus the predictors and risk factors could be revealed. In the next step, we analyze the performance of the T2D prediction model based on the cut-point determination methods and logistic regression using clinical variables (FBG and HbA1c) recommended by WHO, CDC, and ADA. We measure the performance of the models in terms of various performance evaluation metrics, such as sensitivity, specificity, positive predictive value (PPV), negative predictive value (NPV), likelihood ratio positive (LR+), likelihood ratio negative (LR-), accuracy, and area under the curve (AUC) along with its receiver operating characteristic (ROC) curve. Our diagnosis and classification are determined based on the optimal cut points, such as WHO/CDC/ADA recommendations, Youden Index, and product of sensitivity and specificity. For the last objective, we developed an efficient T2D prediction model for the early detection of T2D among patients with NAFLD. Our proposed T2D model utilized a forward logistic regression-based feature selection method and multi-layer perceptron. The performance of the proposed model was then evaluated by compared with other existing models, as well as with the models using clinical variables recommended by WHO/CDC/ADA.
Figure 2 shows the proposed T2D prediction model among people with NAFLD. Using collected publicly clinical diabetes-NAFLD datasets, we first preprocessed the dataset by selecting the data where the patients are diagnosed with NAFLD and then removing the missing values that existed. After data preprocessing, forward logistic regression-based feature selection is applied to select important features which have good performance, thus they could improve the accuracy of the model. After preprocessing and feature extraction, new data are created and ready to be used for learning and classification. In this stage, we employed the k-fold cross-validation technique, with k = 10, applied to all machine learning prediction models, such as logistic regression (LR), k-nearest neighbor (KNN), decision tree (DT), extreme gradient boosting (XGB), support vector machine (SVM), and our proposed model, multi-layer perceptron (MLP). The dataset is partitioned into 10 equal sections, and each classifier undergoes a 10-fold cross-validation. Nine of the sections are used for training while the remaining one is for testing. We went through that procedure ten times, switching the test set each time. The performance metrics (precision, recall, f1, and accuracy) were then selected in the final stage based on the results across iterations. The effectiveness of the prediction models used in this study was next evaluated across all of them.

2.3. Forward Logistic Regression-based Feature Selection Method

Feature selection is an important process before developing a prediction model. It is a process of reducing the number of input variables, considered as variables that have the strongest relationship with the target variable, thus significantly impacting the prediction of the model output [42]. The forward method based on logistic regression is one of the proper statistical-based feature selection methods which has been widely used, which could effectively gain the performance of the prediction model. In this study, we applied the forward method to the logistic regression model. In general, the forward feature selection method works by putting all the variables or the features into the n models and then checking the performance individually. It will then select the variable that produces the best performance, repeat the procedure while adding one variable at a time, keep the variable that produces the largest improvement, and repeat this process until there is no longer a noticeable improvement in the model’s performance. The full procedure of the forward logistic regression-based feature selection method is described in Algorithm 1.
Algorithm 1: A forward logistic regression-based feature selection method
  • Select dataset
  • Let Mo be the null model, y = ß0
    Start with a model with no variable
  • For k = 0, …, p − 1
  • Consider all p-k models that augmented the variable in Mk with one additional variable
    Add the most significant variable, thus a model with one variable is created
  • Choose the best model and call it Mk+1 based on the smallest significant p-value and best likelihood ratio of variable
  • Select the best of the best from M0, M1, …., Mp, where
    Number of model = 1 + 1 = 0 p 1 ( p k ) = 1 + p ( p + 1 ) 2
  • End loop of k
  • Return the the Mk+1

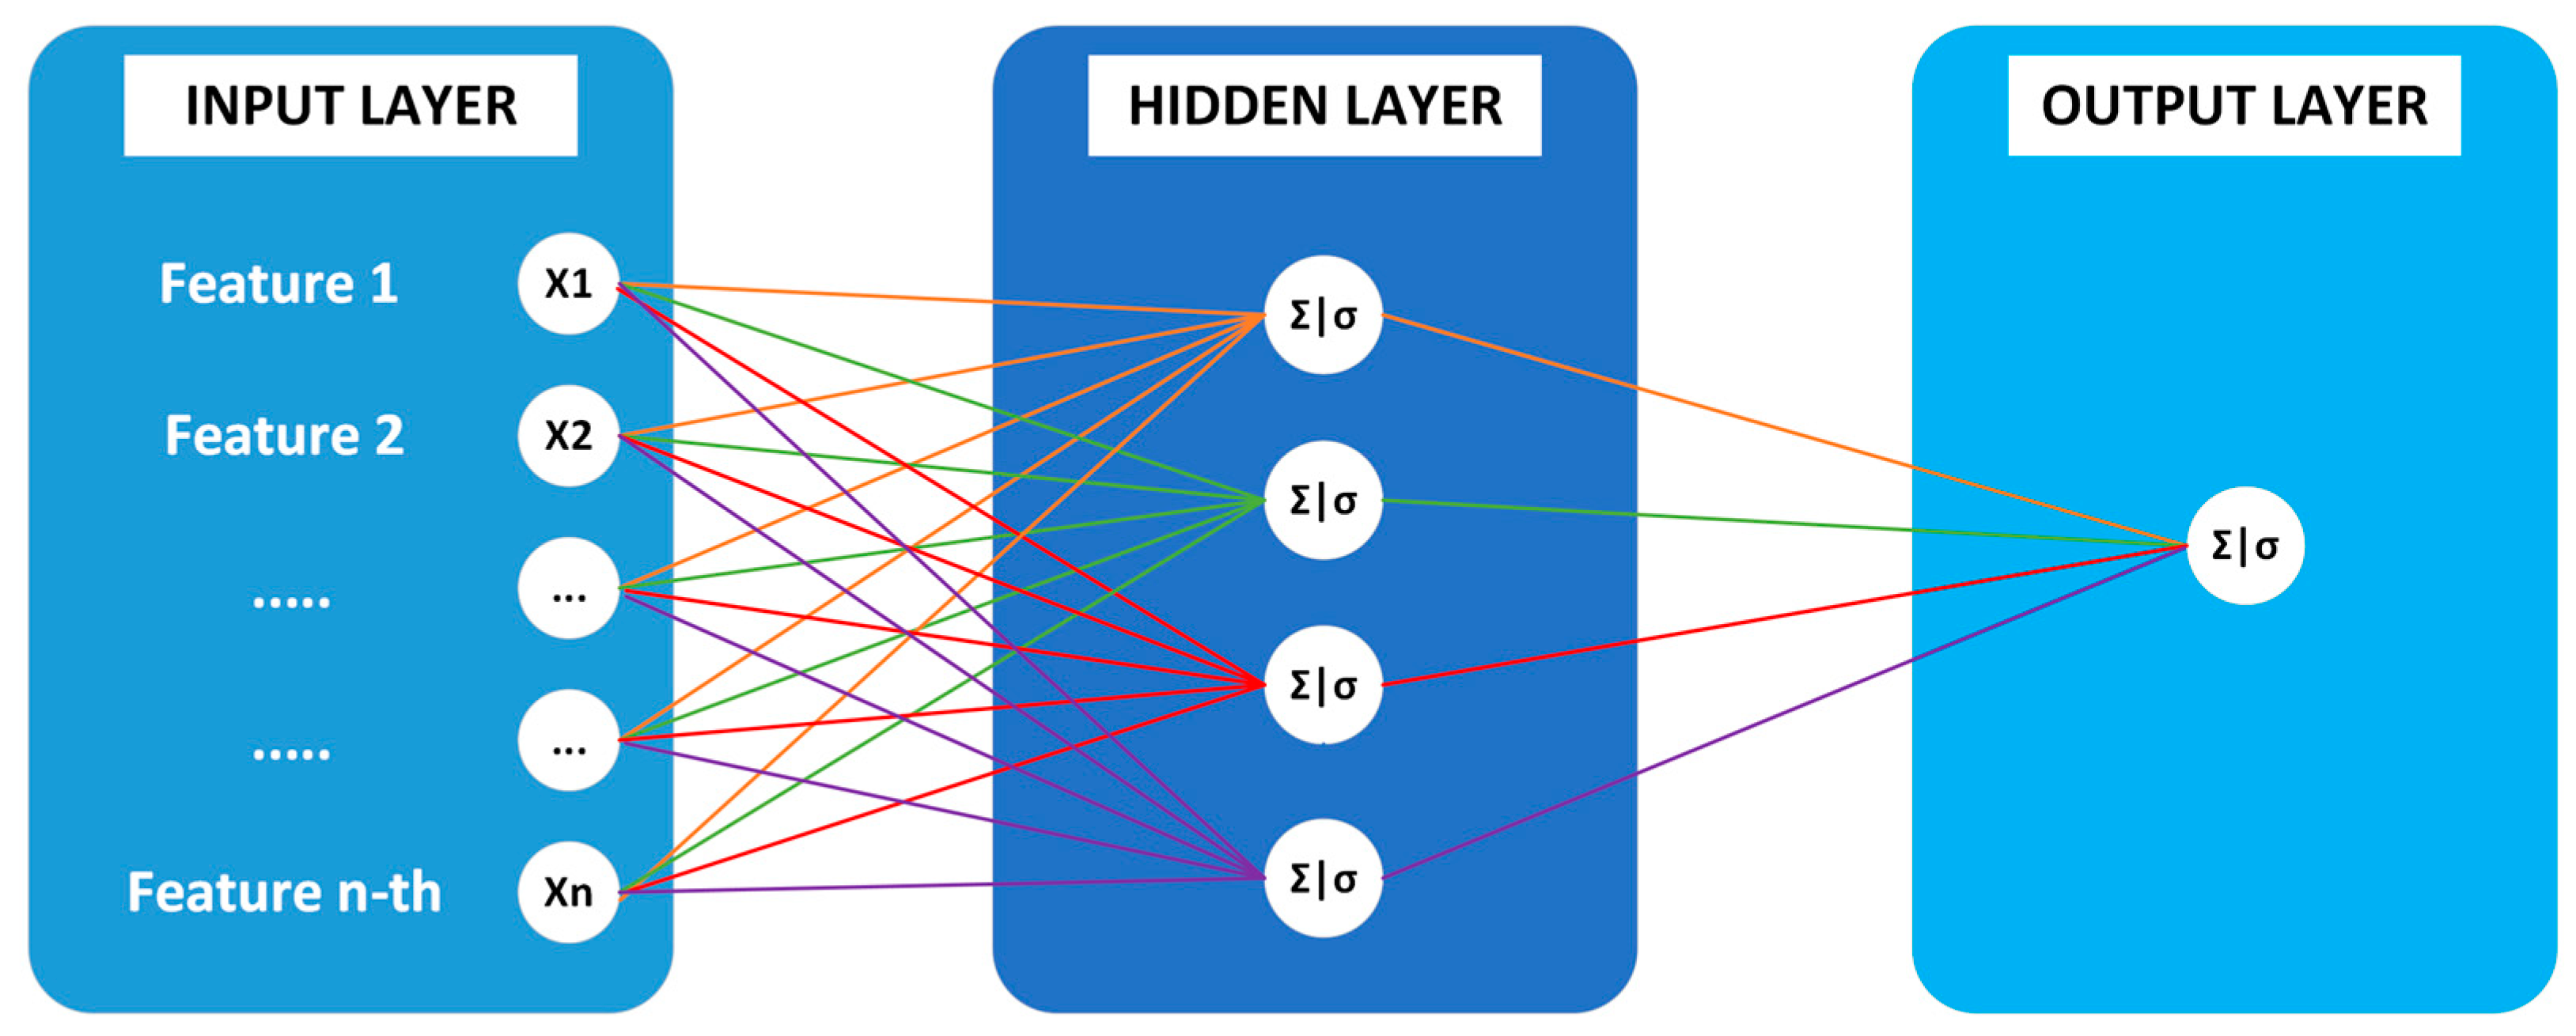
2.4. Multi-Layer Perceptron

A multilayer perceptron (MLP) model with numerous input features, a single hidden layer of numerous hidden neurons, and one output layer is developed for T2D classification among patients with NAFLD. Multilayer perceptron is a feed-forward neural network complement [30,43]. It has three different kinds of layers: an input layer, an output layer, and a hidden layer. The input layer is where the input signal for processing is received [44]. The output layer completes the necessary task, such as classification and prediction. The real computational engine of the MLP consists of an arbitrary number of hidden layers that are sandwiched between the input and output layers. Data travels from the input to the output layer of an MLP in the forward direction, much like a feed-forward network. With the help of the backpropagation learning method, the MLP’s neurons are taught. An MLP architecture is visualized in Figure 3.
The following calculations are carried out at each neuron in the hidden and output layers:
o ( x ) = G ( b 2 + W 2 h x )
h x = φ x = s ( b 1 + W 1 x )
Given the activation functions G and s , the weight matrices W ( 1 ) and W ( 2 ) , and the bias vectors b ( 1 ) and b ( 2 ) . The W ( 1 ) , b ( 1 ) , W ( 2 ) , and   b ( 2 ) are the set of parameters that need to be learned. A common option for s is the logistic sigmoid function, with sigmoid(a) = 1/(1 + e−a), or the tanh function, with tanh(a) = (ea − e−a)/(ea + e−a).

2.5. Evaluation of the Model’s Performance

To evaluate the performance of the T2D prediction models, the 2 × 2 confusion matrix is utilized. The classification of disease status was defined into two categories, they are “diabetes” and “non-diabetes”, considered as a positive event and negative event. Using two categorical classes applied to the confusion matrix, the true positives (TP), true negatives (TN), false positives (FP), and false negatives (FN) values could be generated.
In order to evaluate the performance of the models using clinical variables recommended by WHO/CDC/ADA, we used sensitivity, specificity, positive predictive value (PPV), negative predictive value (NPV), and area under the curve (AUC) along with the receiver operating characteristic (ROC) curve [45]. Using a ROC graph, the performance of the classifier may be organized, arranged, and chosen. The probability that the classifier would give a positively chosen instance a higher score than a negatively chosen instance at random is expressed as the area under the ROC curve (AUC). Furthermore, for machine learning-based prediction models and proposed model evaluation, we measure the precision or PPV, recall or sensitivity, f1, and accuracy. With regard to the models using clinical variables recommended by WHO/CDC/ADA, the performance measurements were carried out using SPSS version 25.0, while the machine learning-based prediction models and proposed model are implemented in Scikit-learn 1.1.2 and Python 3.9.7, respectively. The following equations can be used to determine sensitivity or recall, specificity, PPV or precision, NPV, f1, accuracy, and AUC [46]:
Sensitivity   or   Recall = T P T P + F N ,
Specificity = T N F P + T N ,
PPV   o r   Precision = T P T P + F P ,
NPV = T N F N + T N ,
F 1 = 2 × p r e c i s i o n × r e c a l l p r e c i s i o n + r e c a l l ,
A c c u r a c y = T P + T N T P + F N + F P + T N .

3. Results

3.1. Characteristics of Patient Population

A total of 2741 and 605 patients with NAFLD from the Gifu and NAFLD datasets are enrolled in the study population. Table 1 shows the characteristics of the study participant.

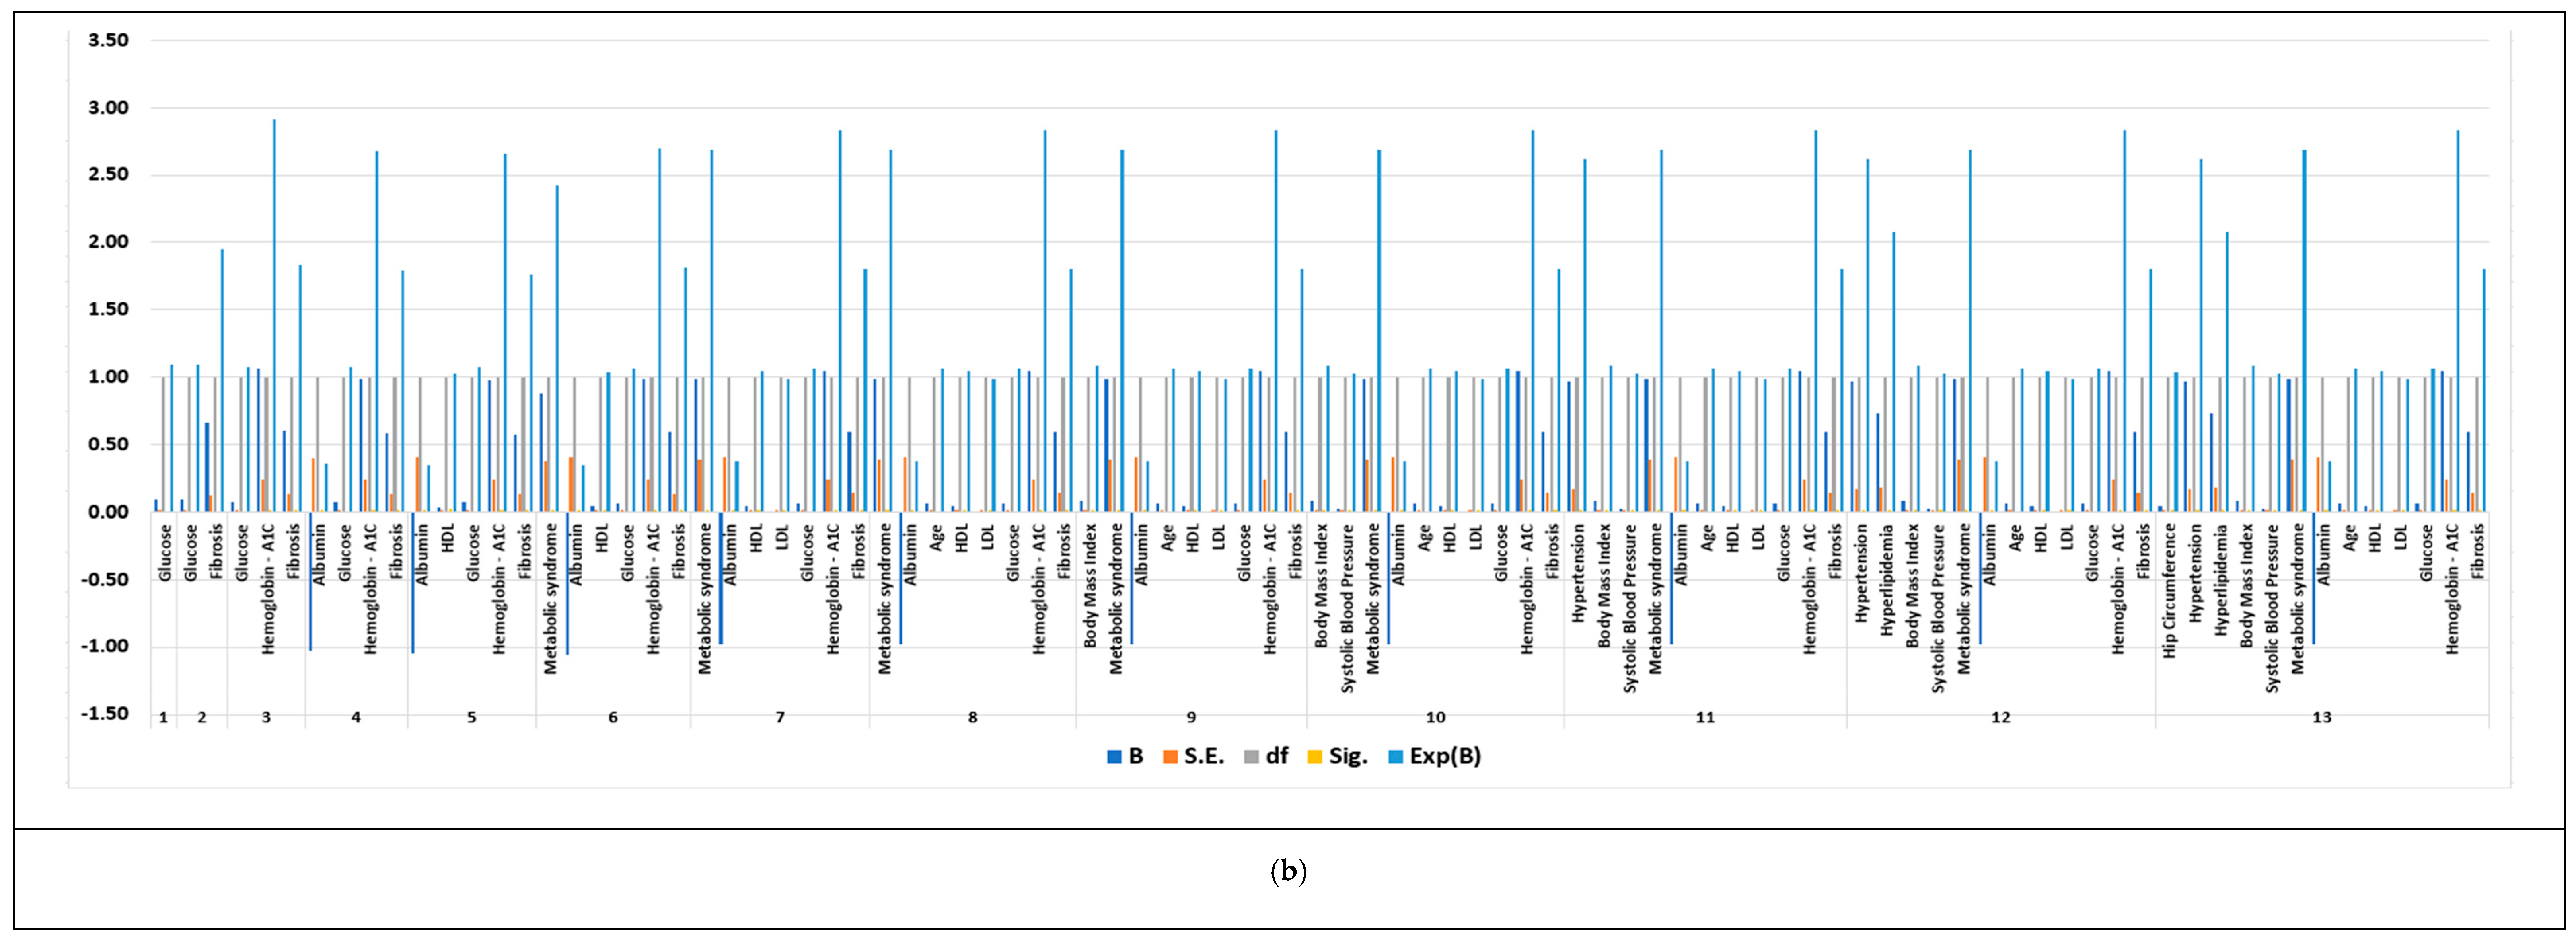
3.2. Measure of Associations

Table 2 displays the predictor and T2D association scores in NAFLD patients. According to the characteristics of the patient’s results, the Gifu T2D patients are considered to have prediabetes, while in the NAFLD dataset, the positive class of T2D patients is the patients who are considered to have diabetes.

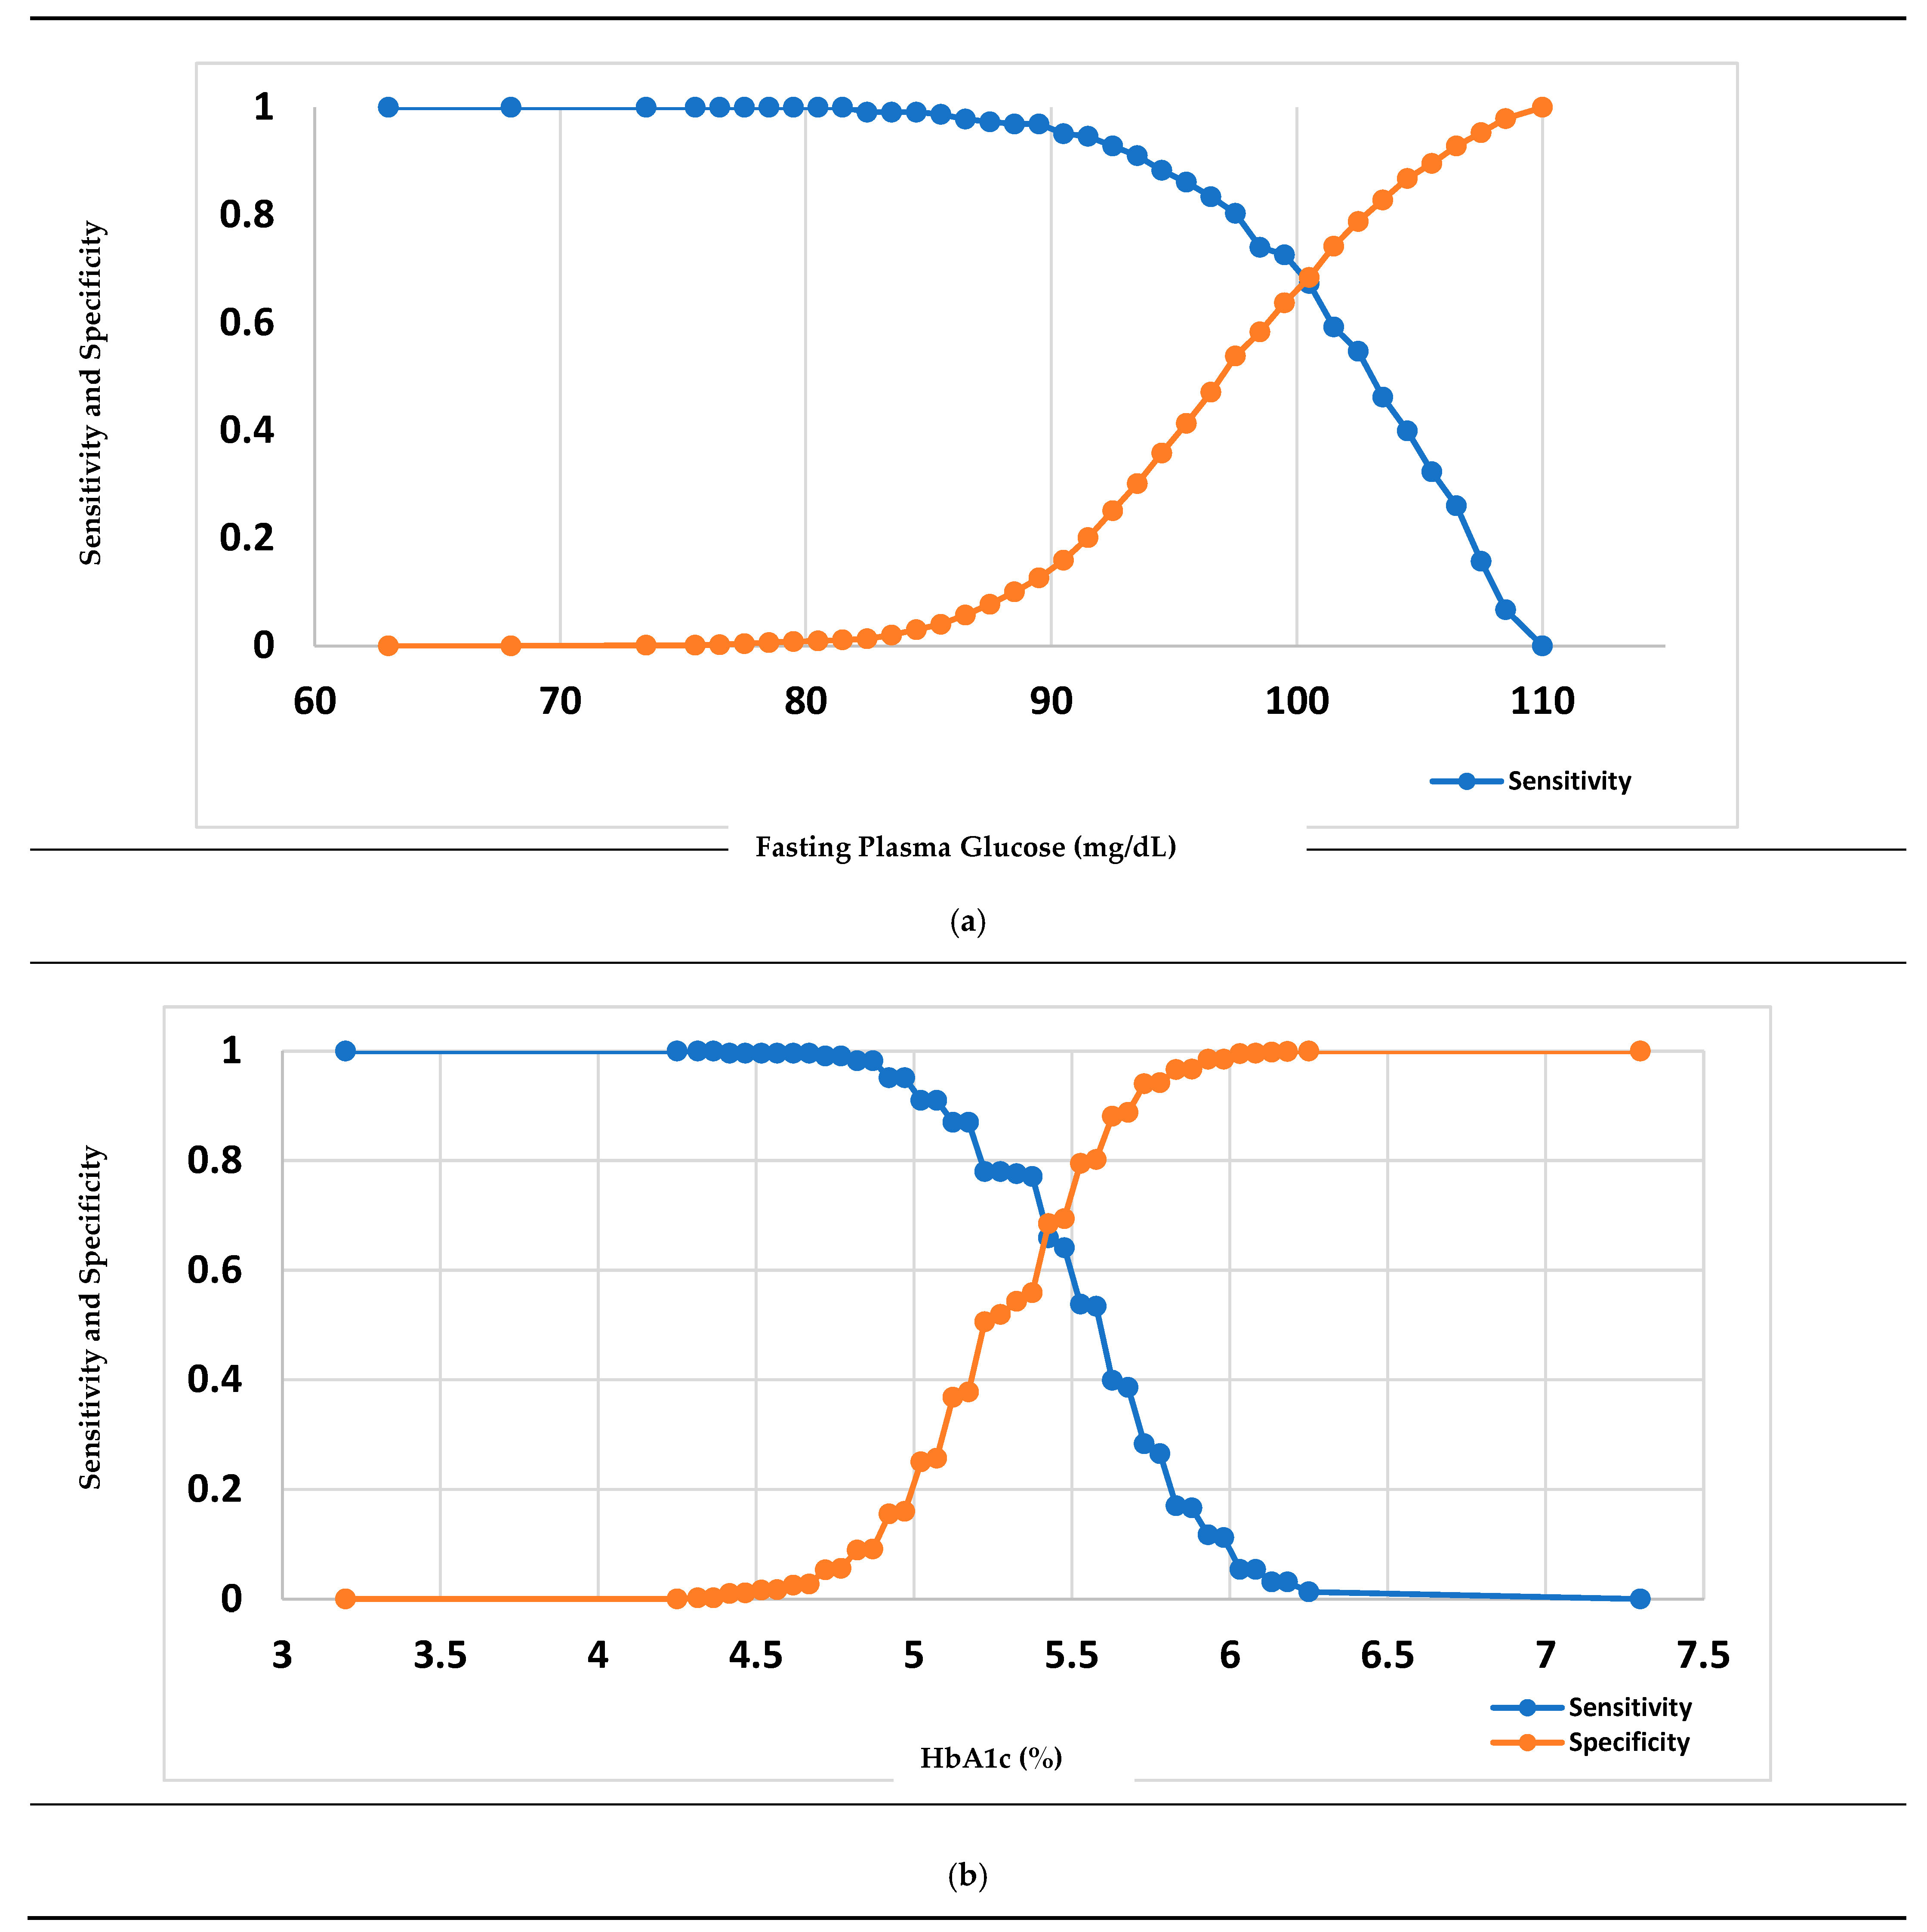
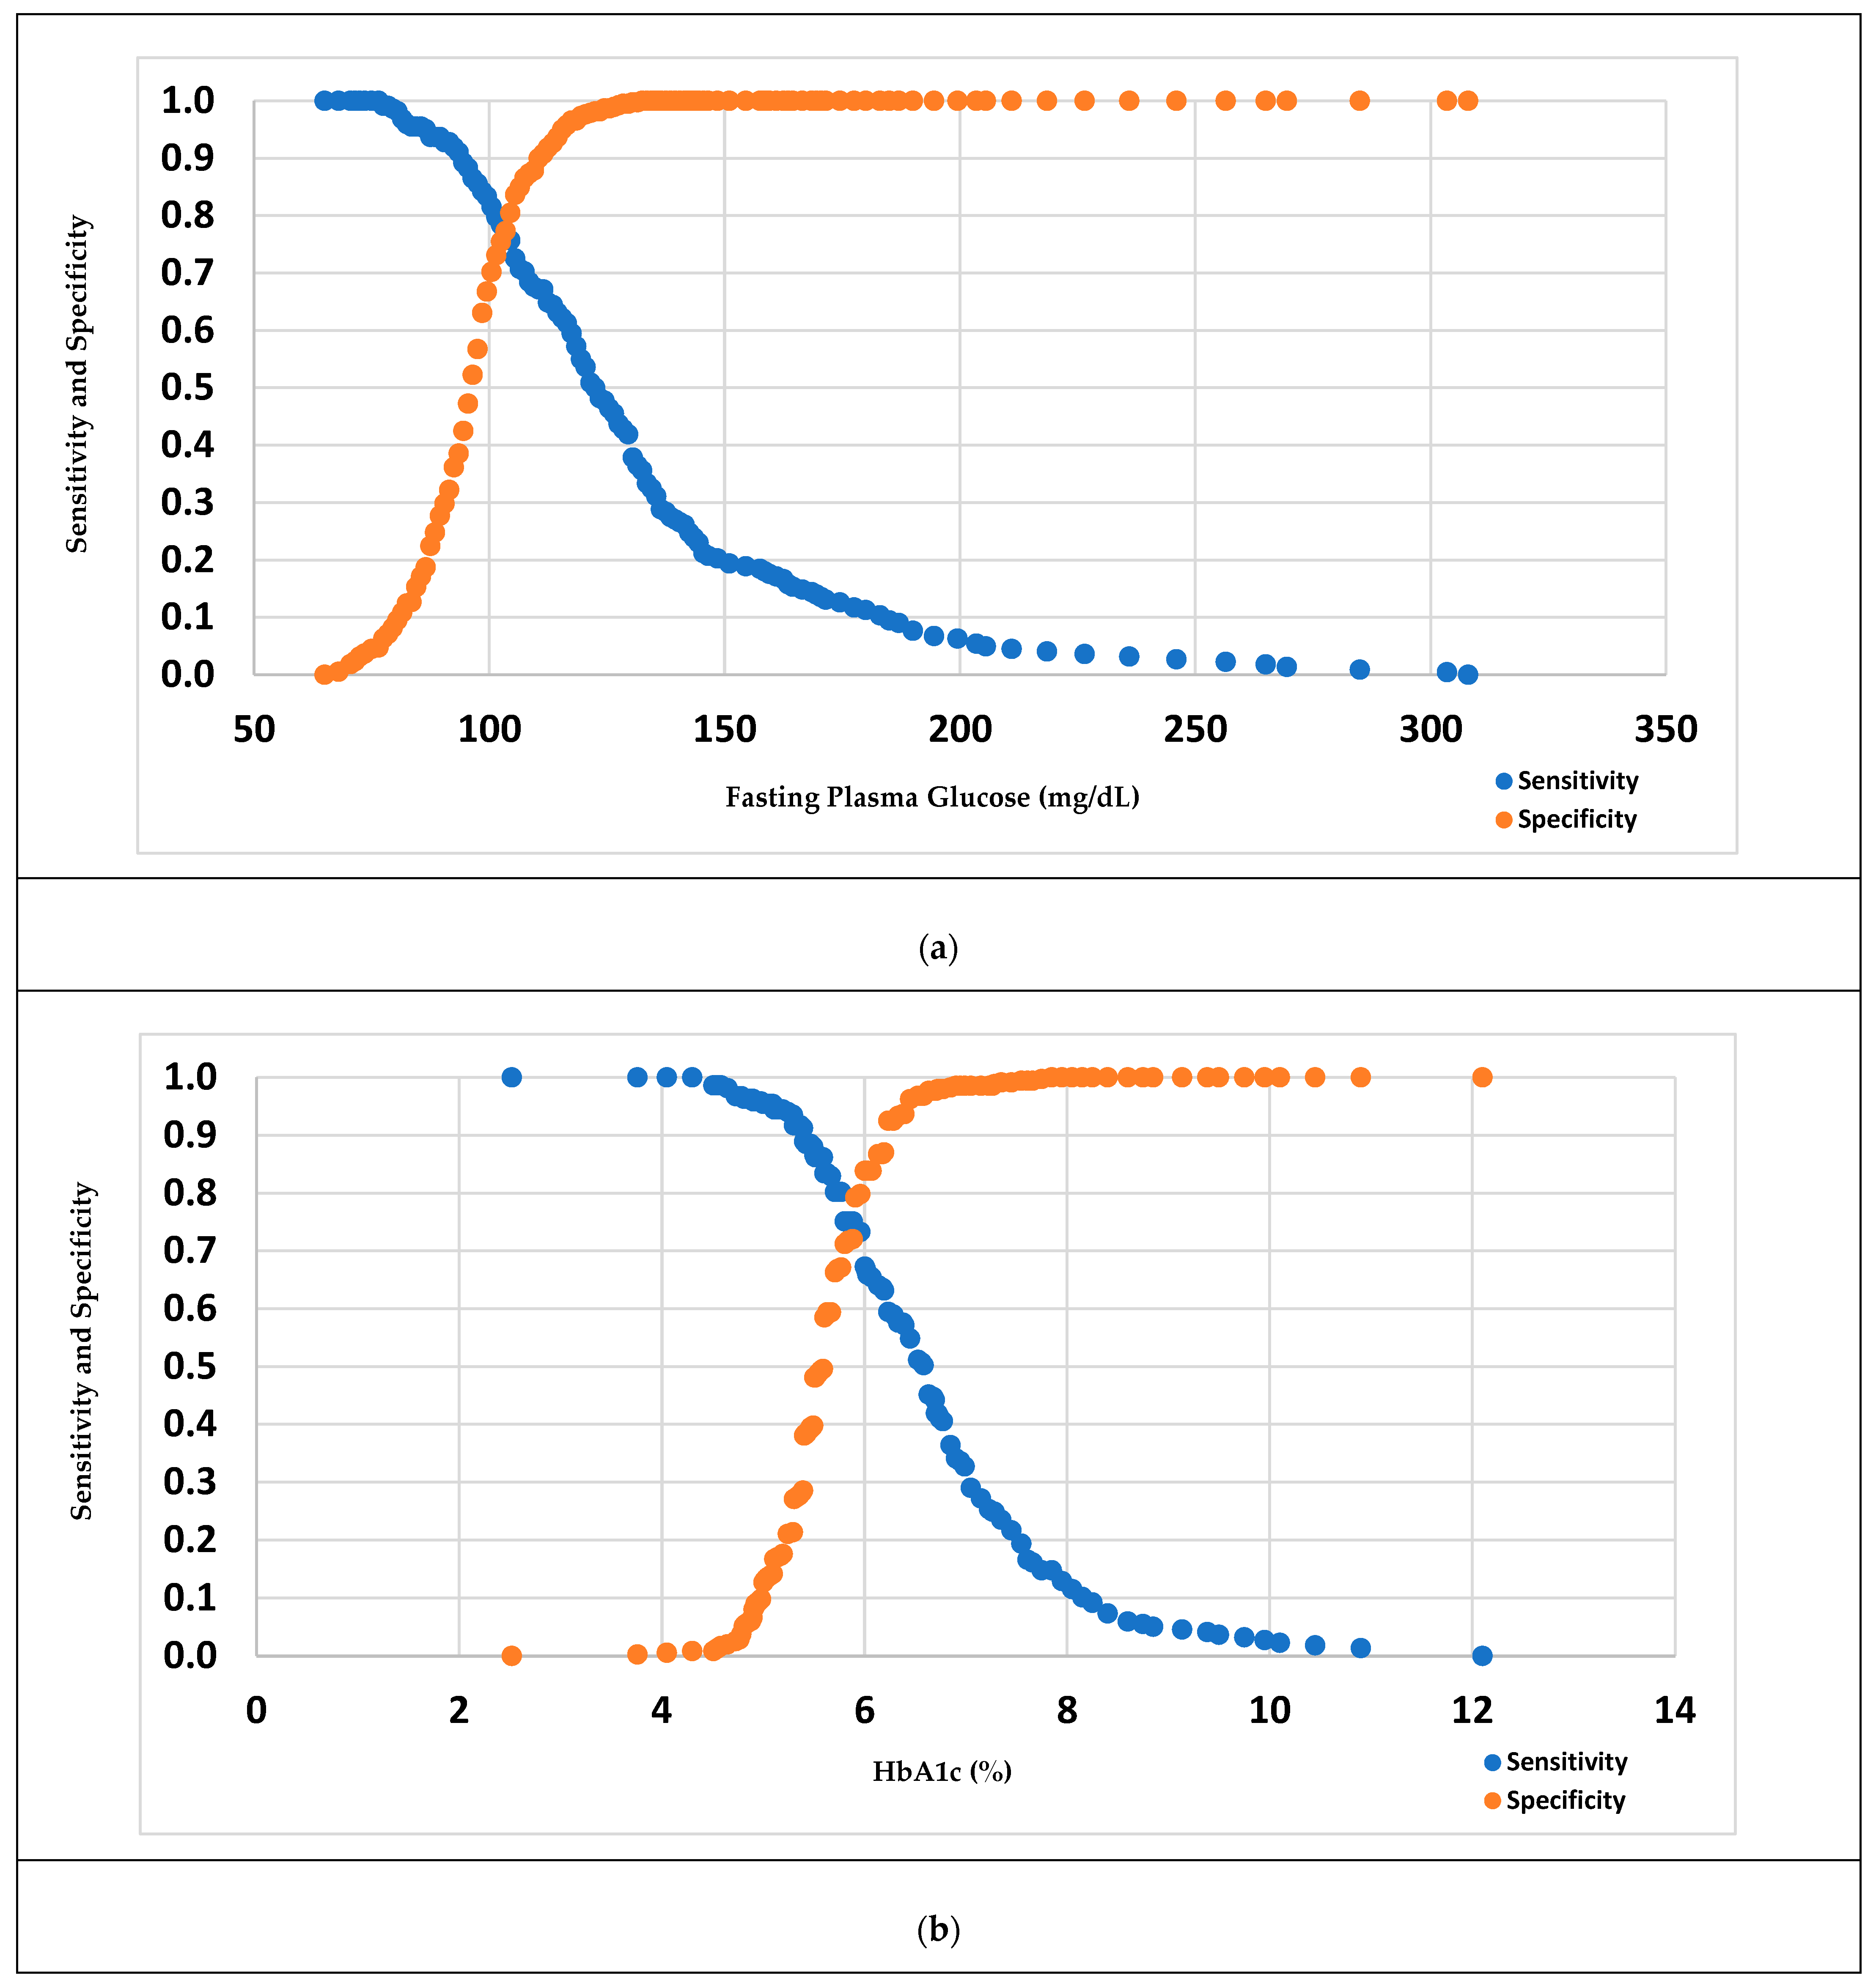
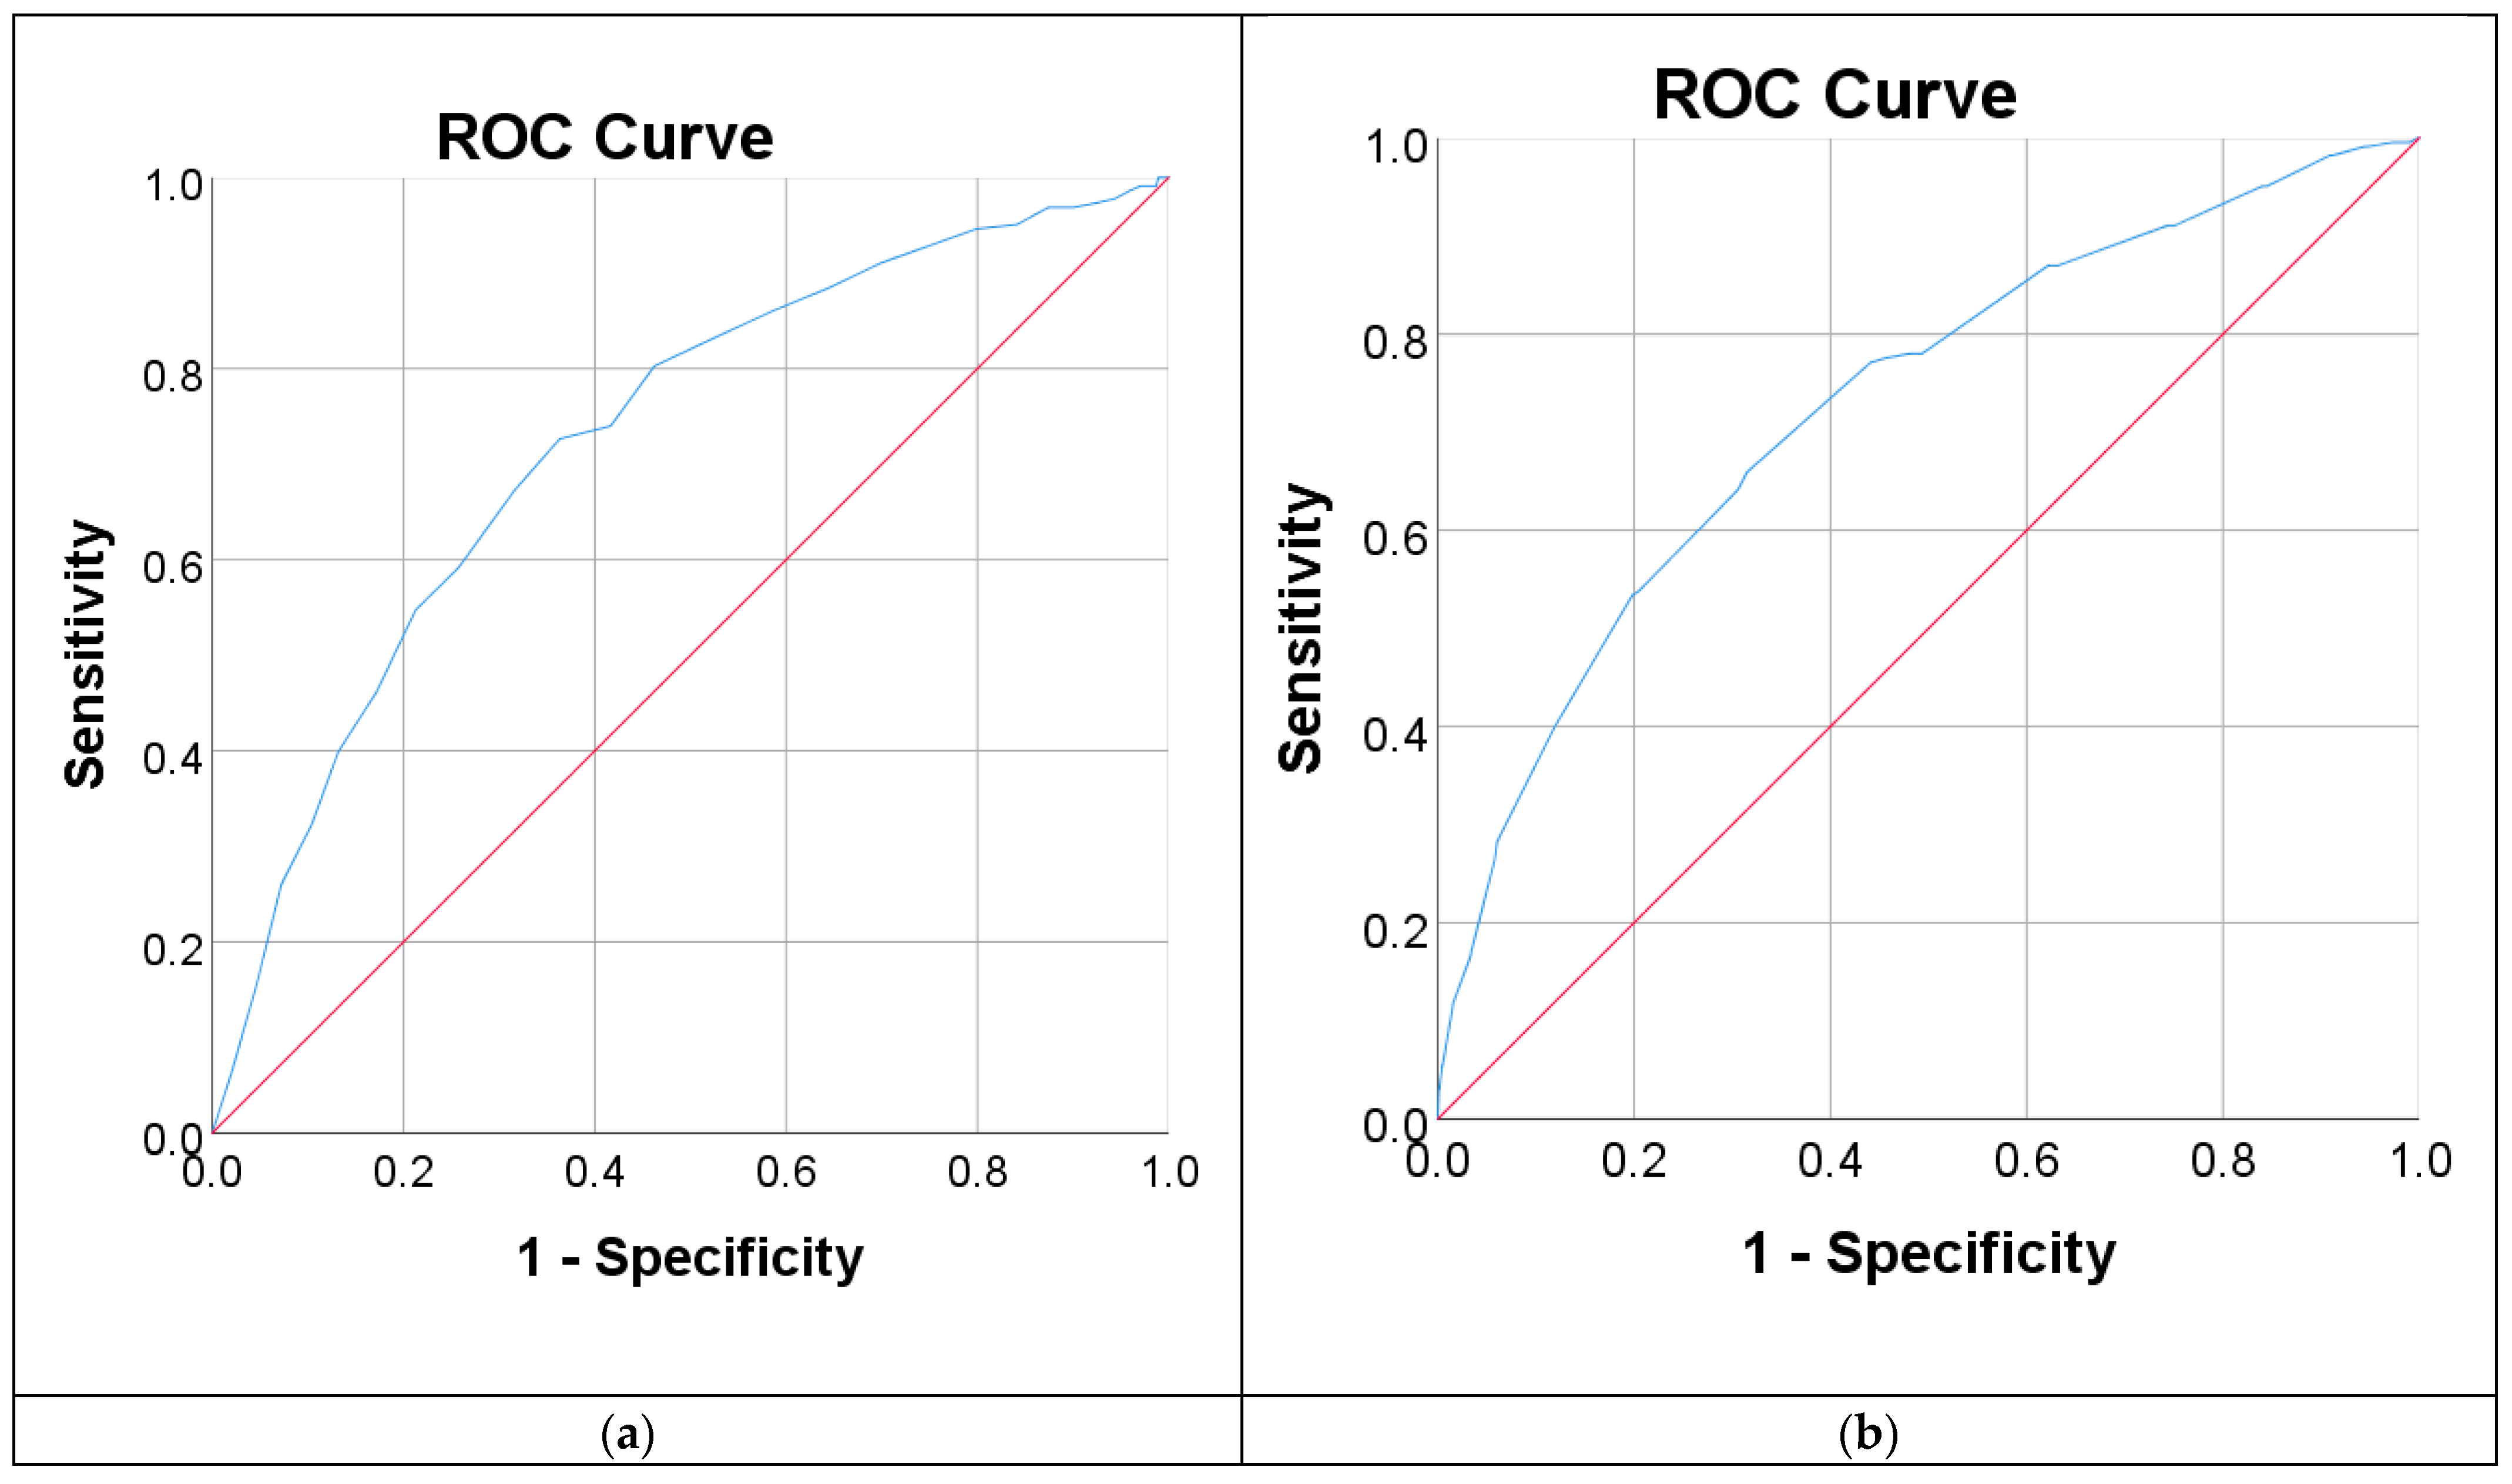
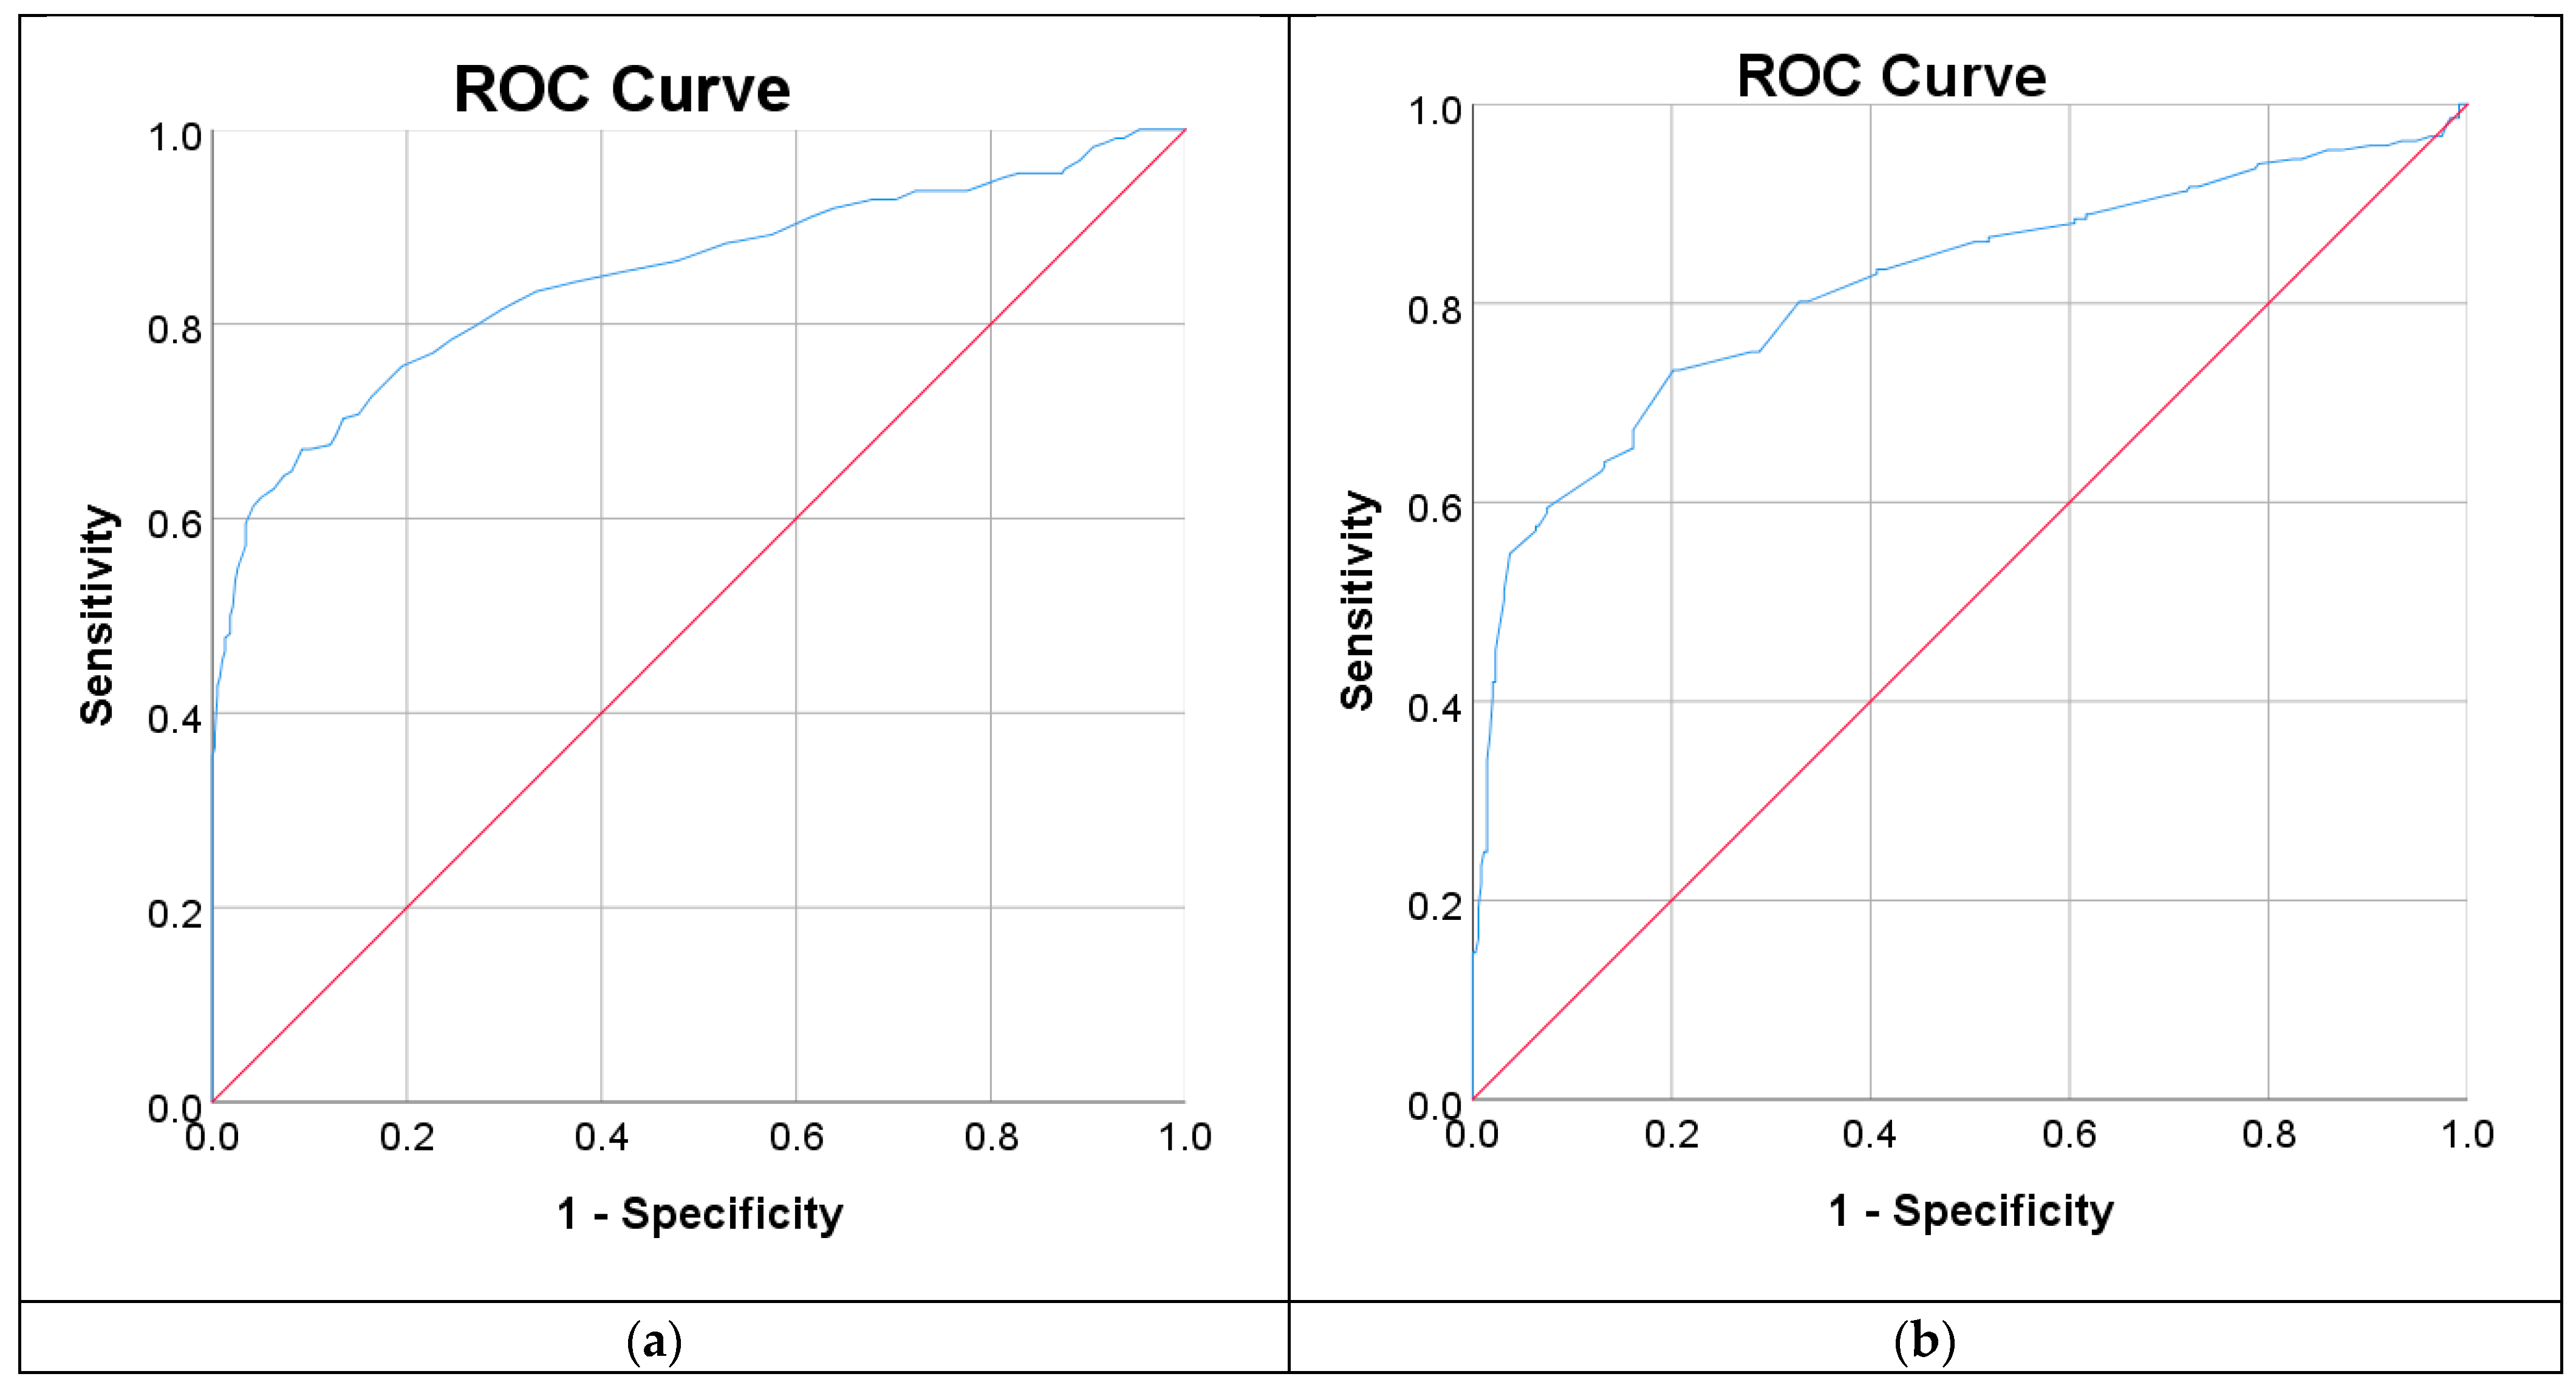
3.3. Measure of the Performance of Diabetes Diagnostic Tests

The performance of T2D diagnostic tests in patients with NAFLD is shown in Table 3. The cut-off points for FPG and HbA1c based on the sensitivity and specificity of the Gifu and NAFLD datasets are shown in Figure 4 and Figure 5. The ROC curves of FBG and HbA1c applied to the Gifu and NAFLD datasets are shown in Figure 6 and Figure 7.

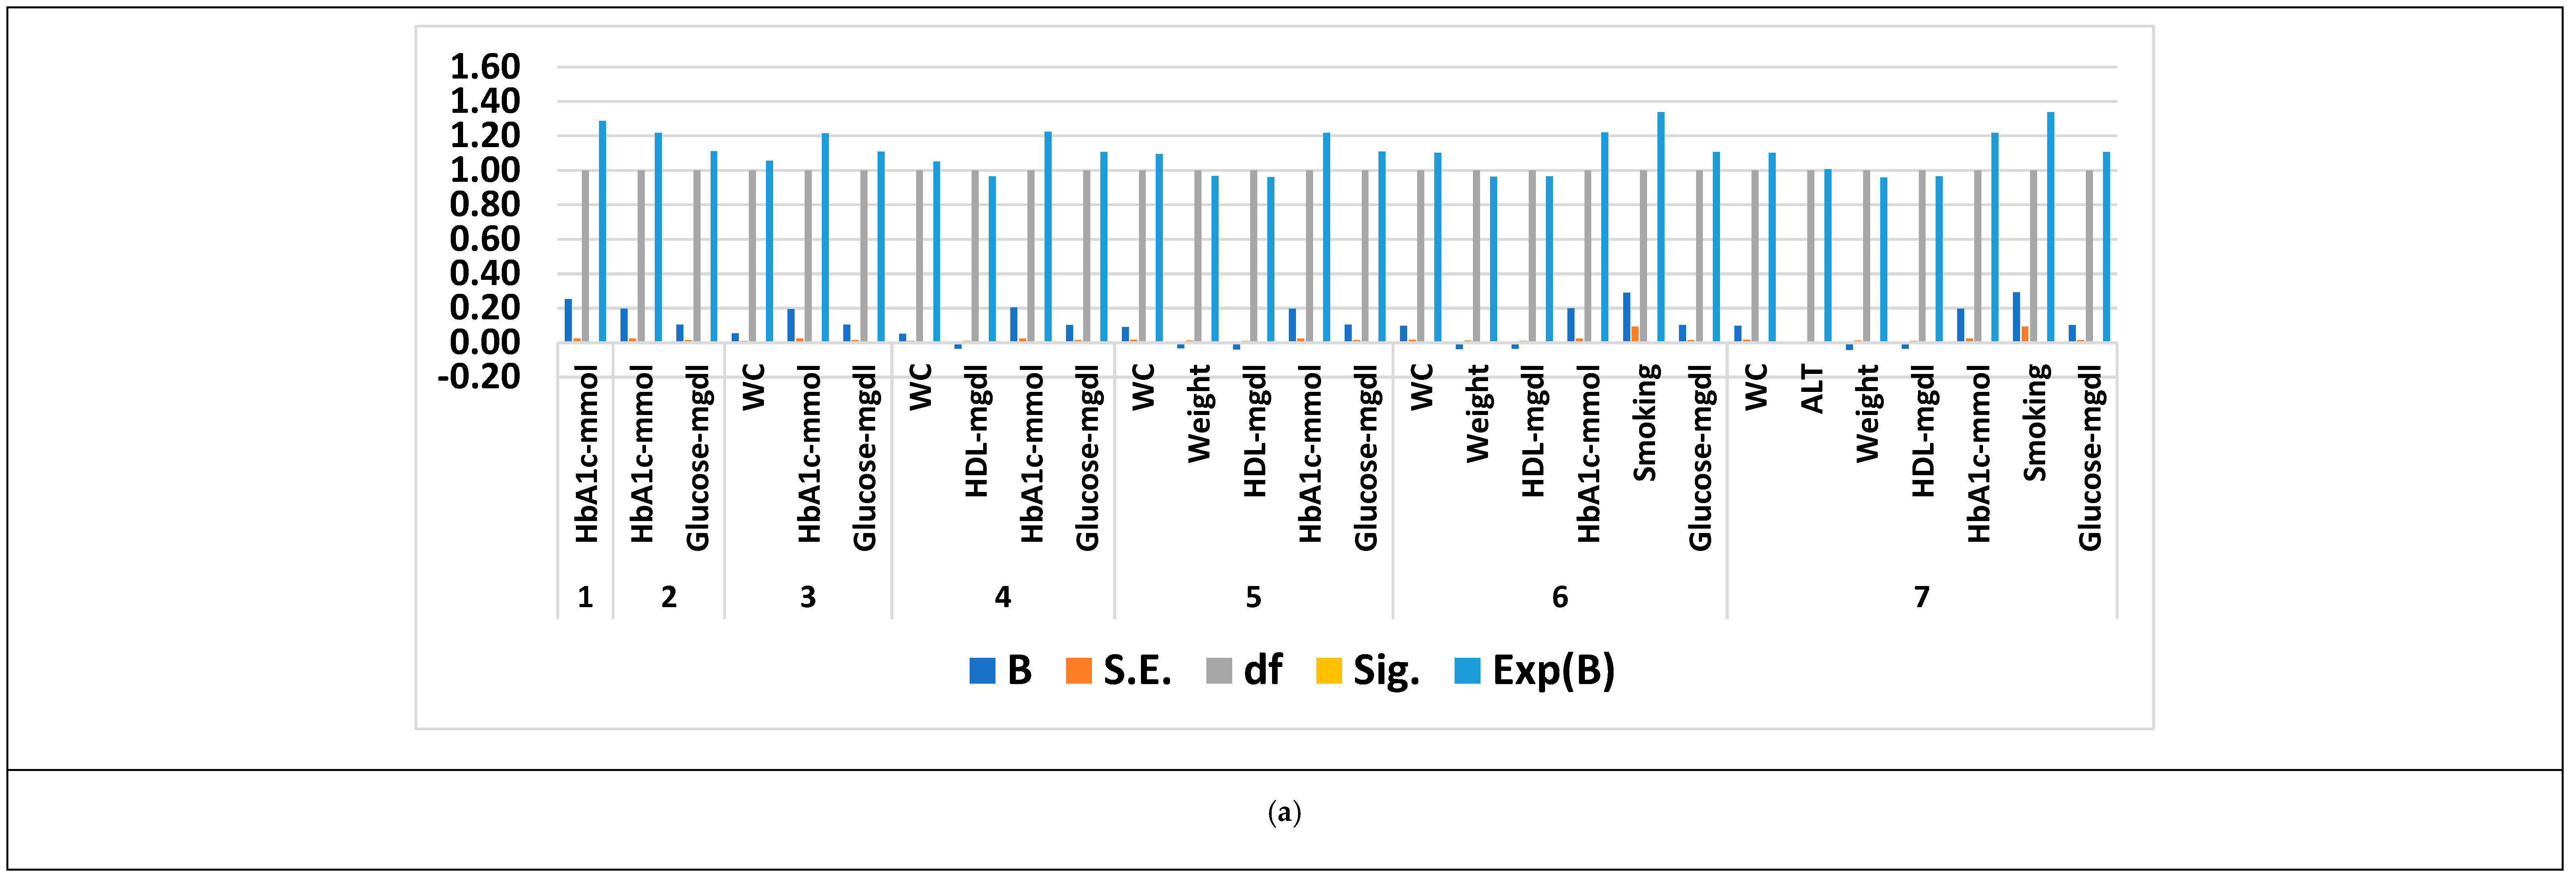
3.4. Feature Selection Results Based on Forward Logistic Regression Method

Before developing the T2D prediction model, we conducted a feature selection applied to all NAFLD datasets used in this study. Feature selection based on the forward logistic regression method is employed in the proposed model, as well as other existing machine learning models. The characteristics of the dataset can be seen in Table 4. Before applying the forward logistic regression-based feature selection method, the original datasets consisted of 30 and 62 features for the Gifu NAFLD dataset and NAFLD dataset, respectively. Figure 8 shows the results of selected features based on the forward logistic regression method in the Gifu NAFLD dataset (see Figure 8a) and NAFLD dataset (see Figure 8b).

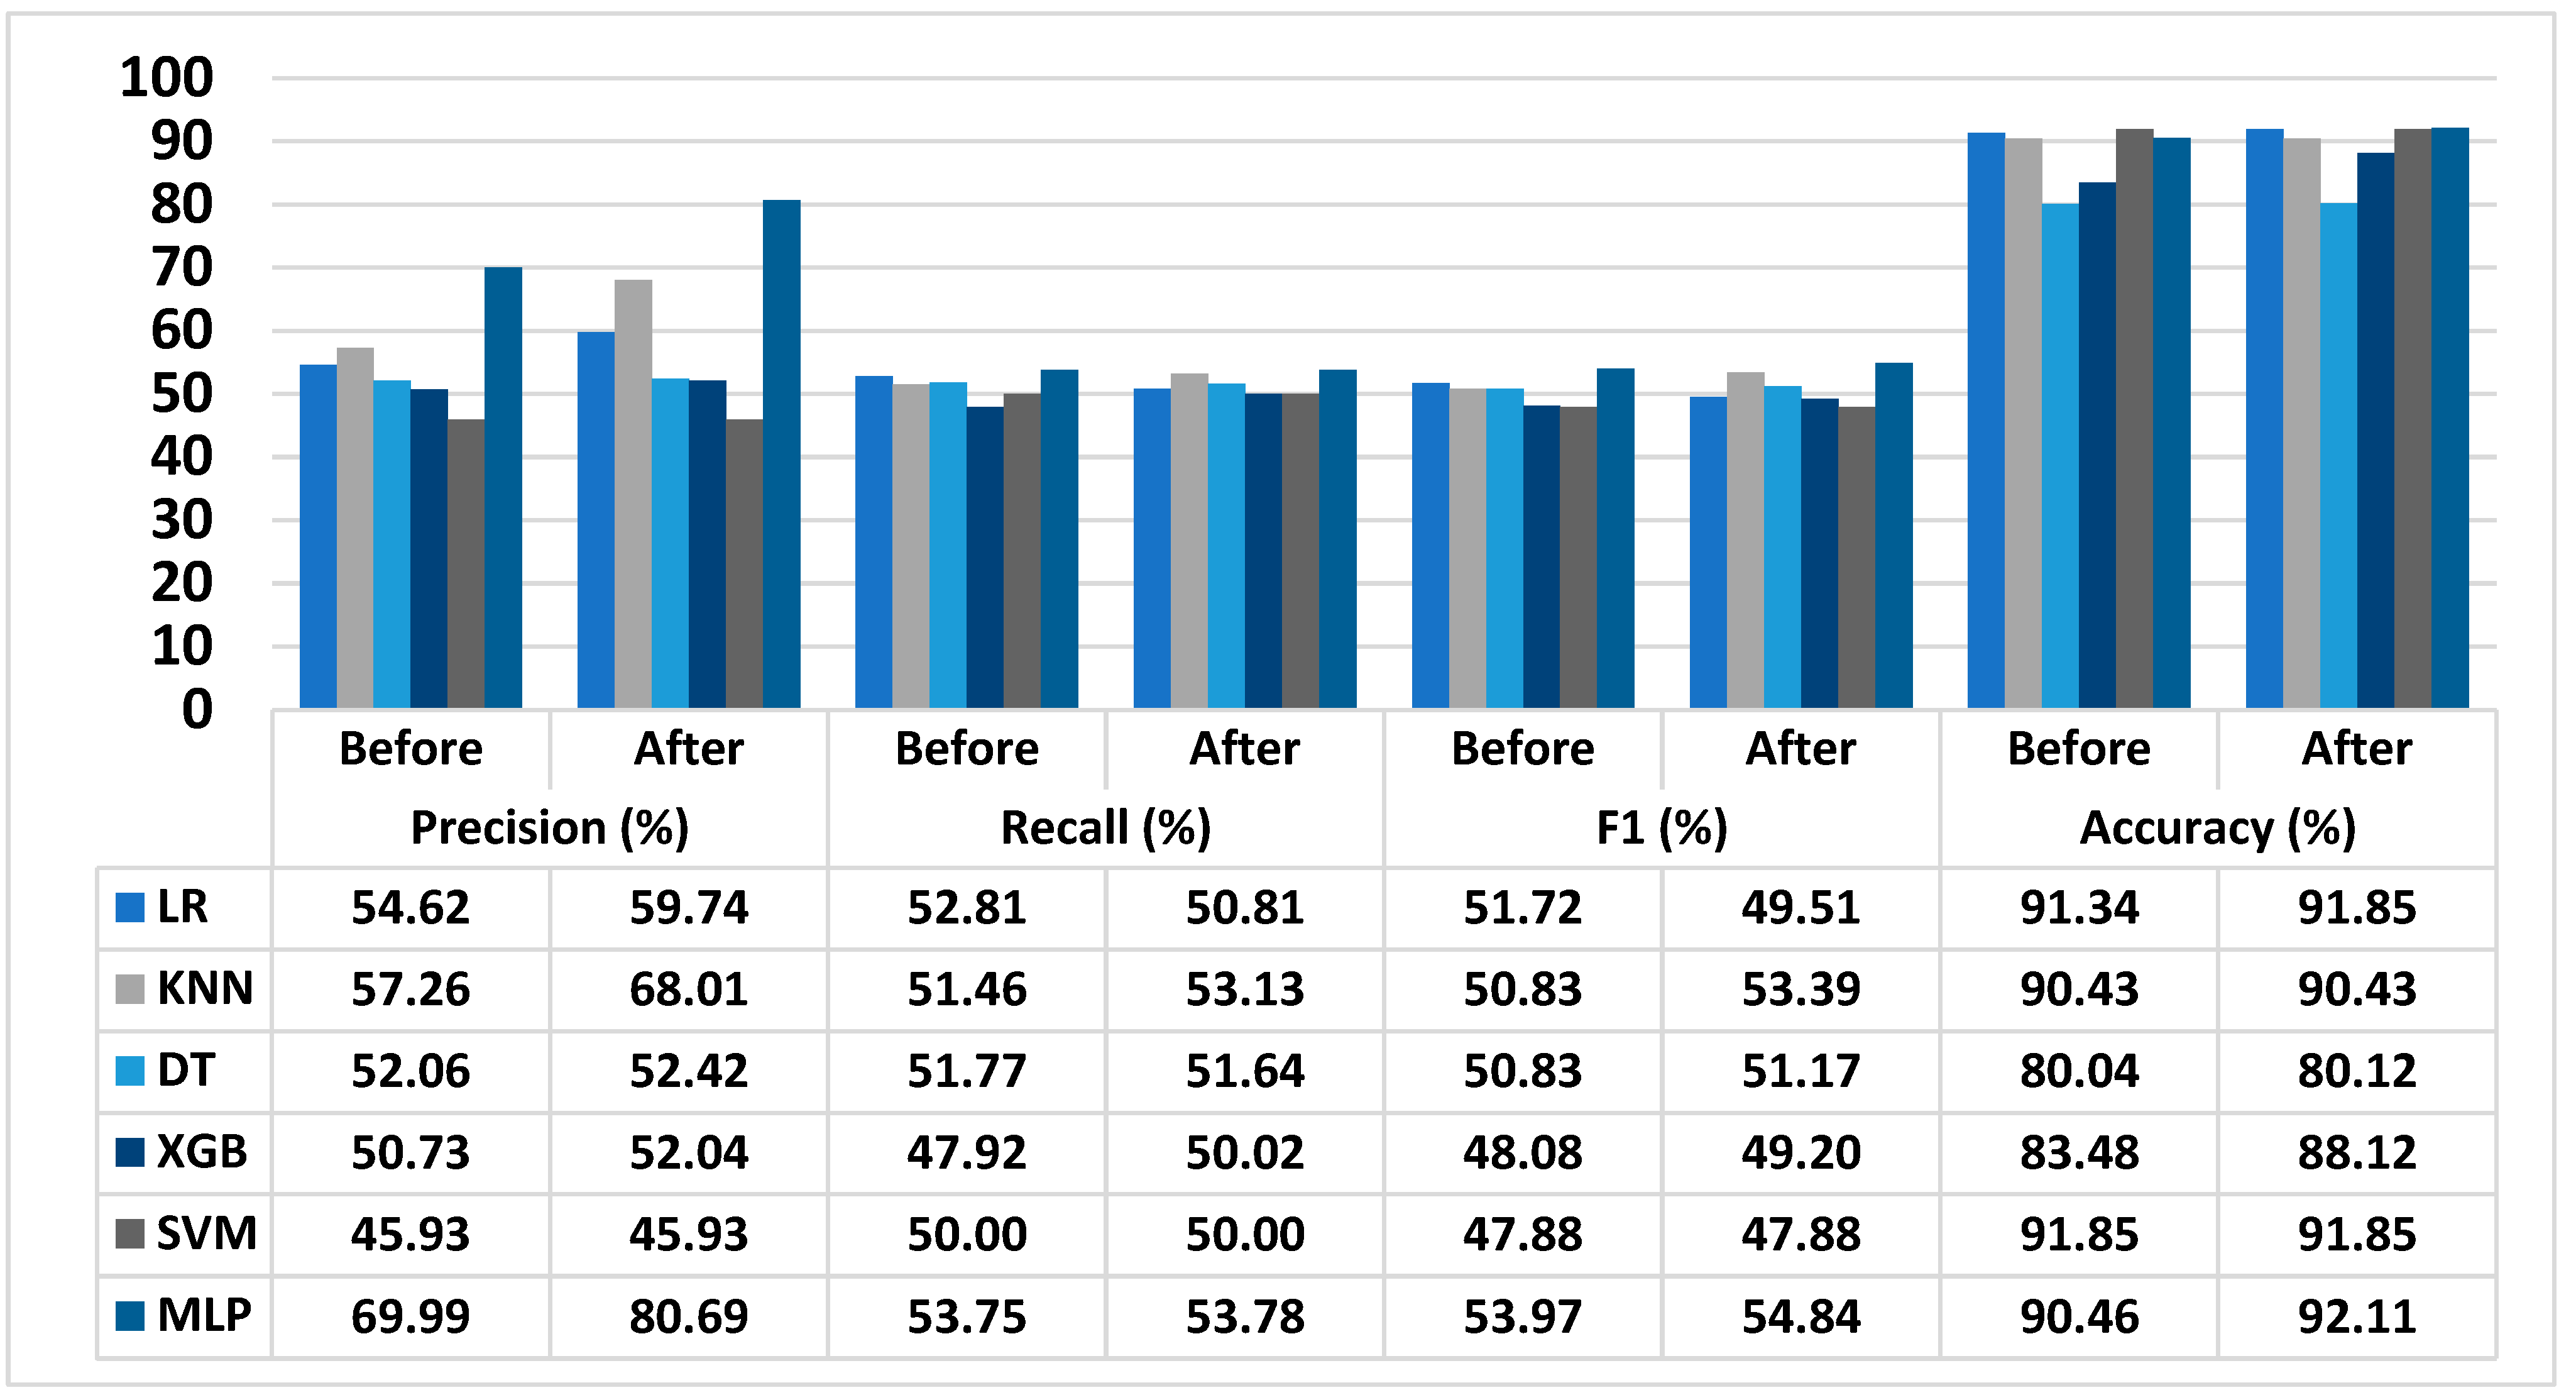
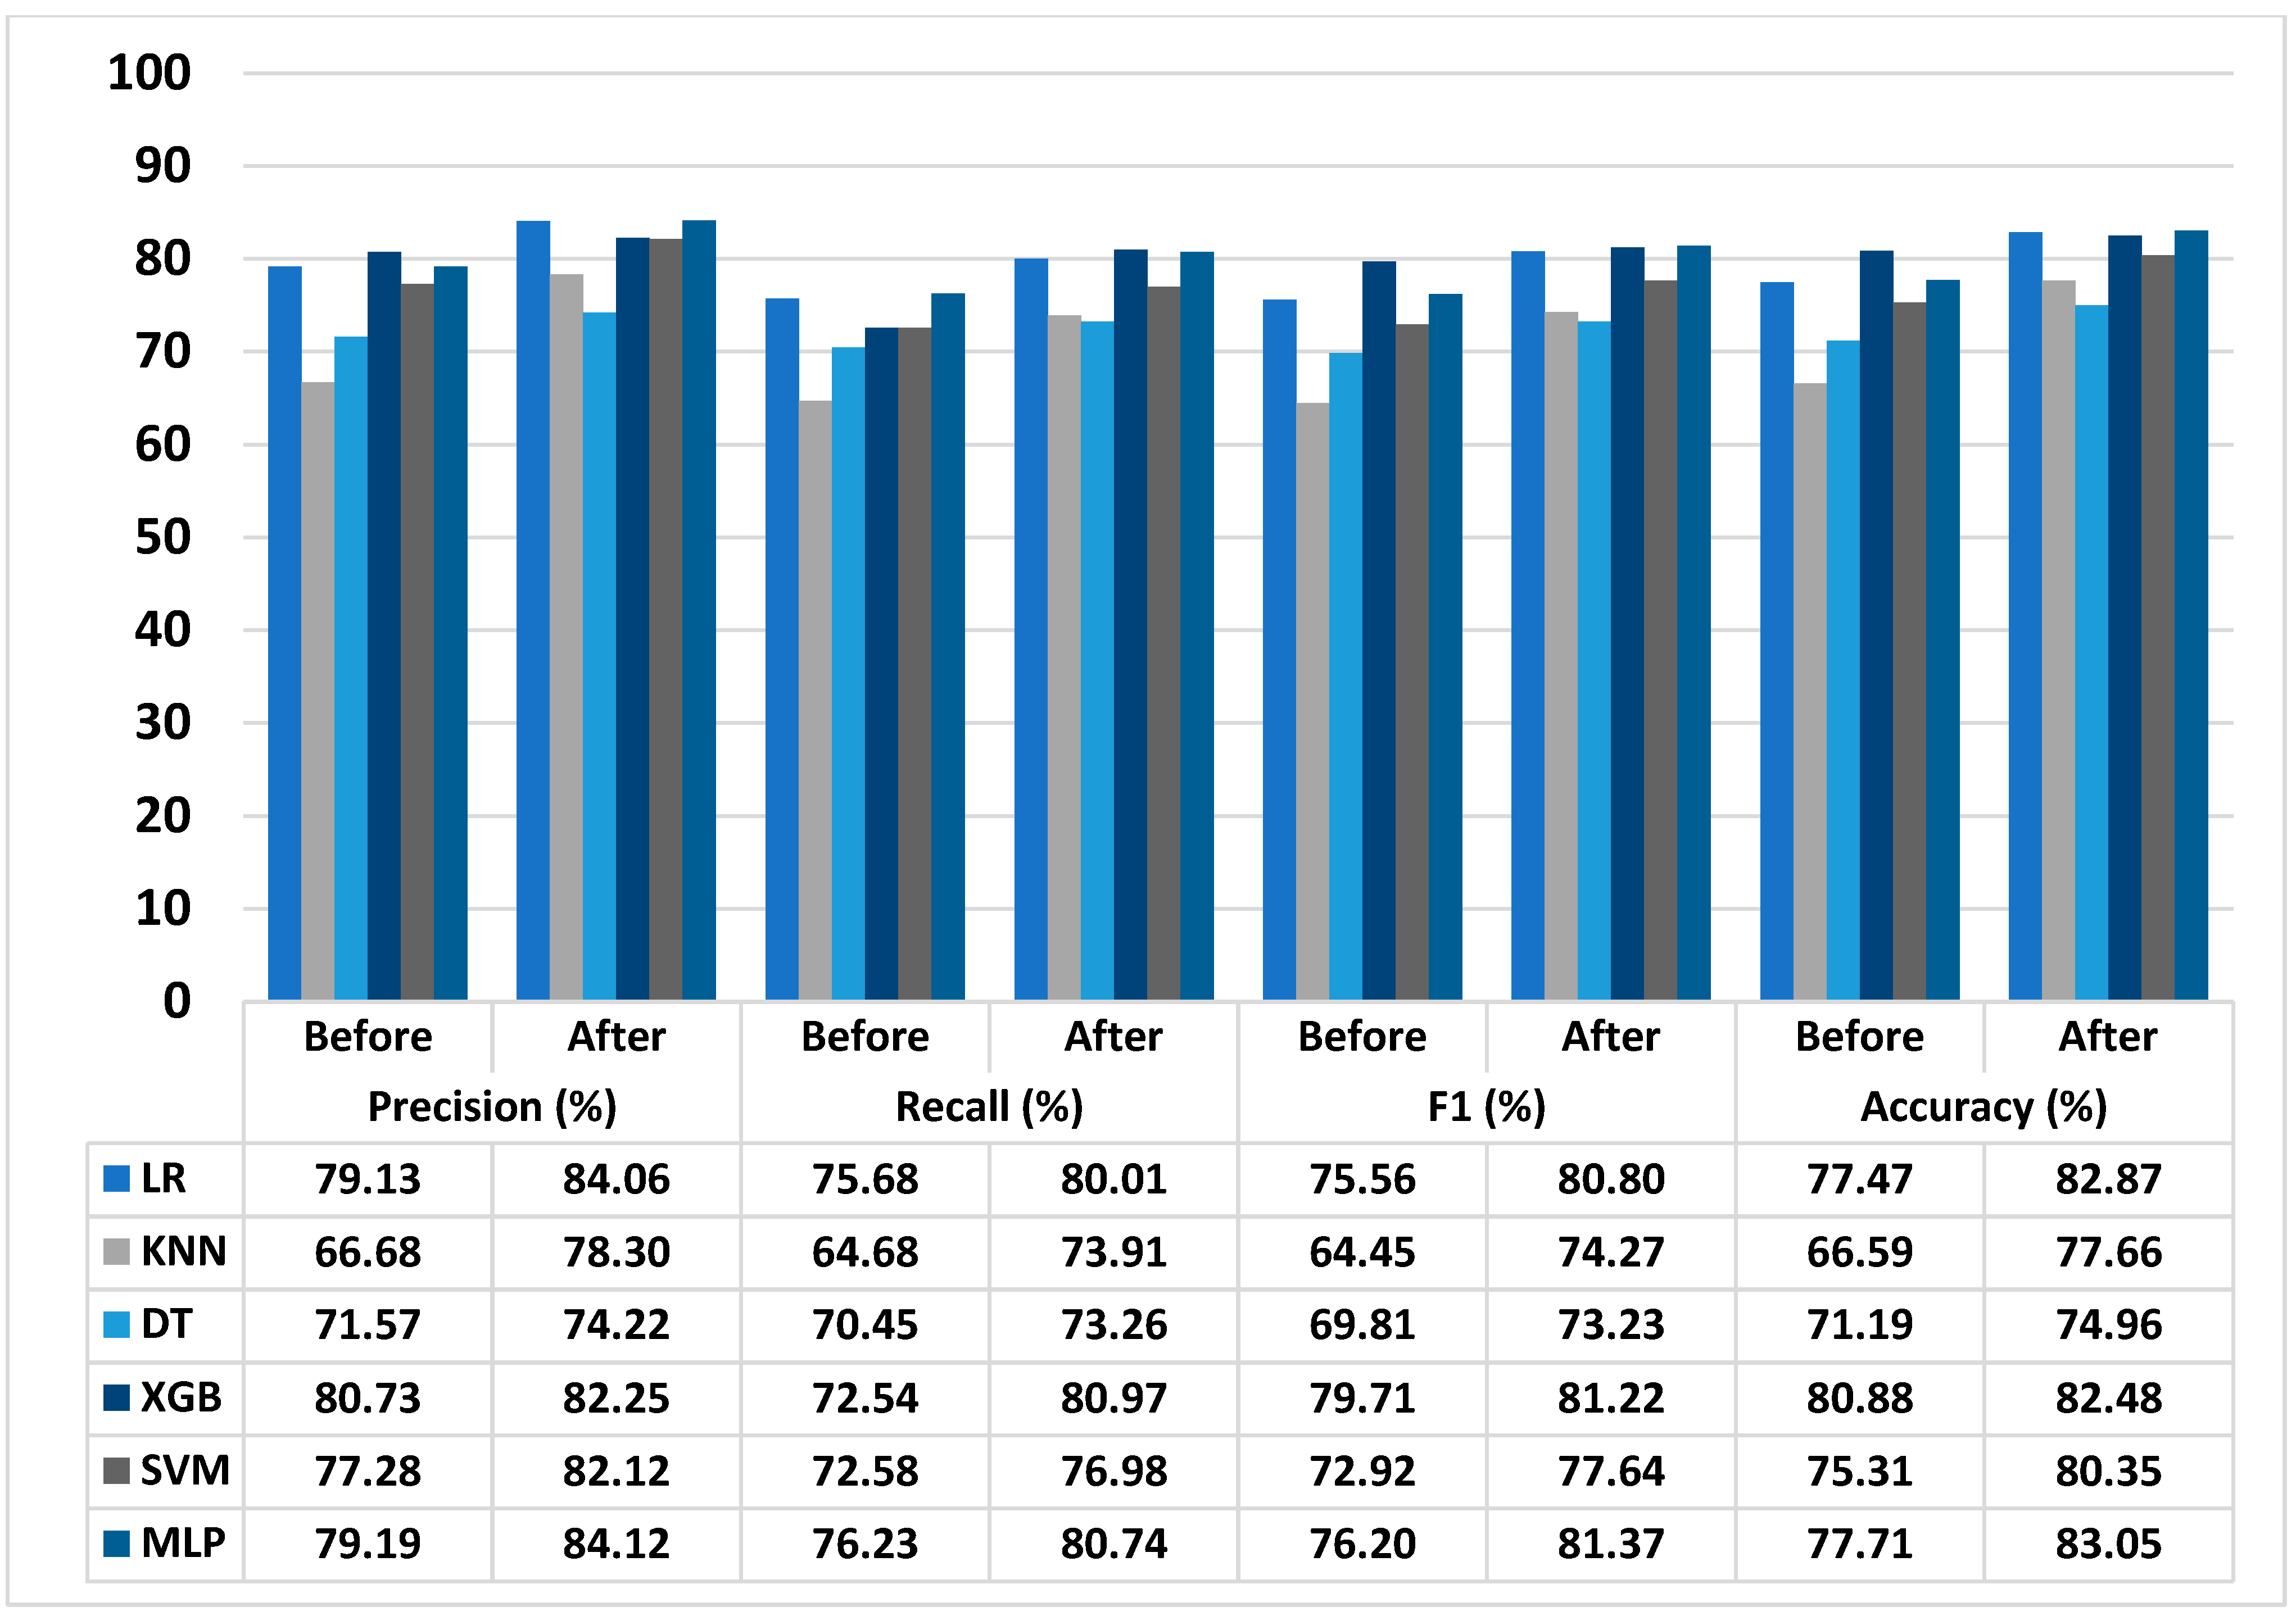
3.5. Performance of Proposed T2D Prediction Model

The last analysis conducted in this study is, we measure the performance of the T2D prediction models utilizing numerous machine learning techniques, measured by precision, recall, F1, and accuracy (see Figure 9 and Figure 10). Along with that, the 95% confidence intervals of all evaluation metrics are also measured in our study (see Table 5 and Table 6). Table 7 shows the improvement score after the forward logistic regression-based feature selection method application on the MLP model.

4. Discussion

As shown in Table 2, in the Gifu NAFLD patient population, there were no associations between sex, age, overweight, or obesity level I with T2D where the p-values were larger than 0.05 (p-value > 0.05). In contrast, the sex and age associations with T2D are statistically significant (p-value < 0.001). The significant scores of sex and age were followed by odds ratio (OR) scores, particularly in patients aged 45 to less than 60 years or older than 60 years, with OR scores of 5.58 and 14.18, respectively. The OR scores indicate that T2D is 5.58 and 14.18 times more likely to be present in NAFLD patients aged 45 to 59 and older than 60, respectively than in those without T2D. Obesity level II and a waist circumference greater than 90 cm in men were found to have significant associations with diabetes (p-value < 0.001) in the Gifu NAFLD patient population. The association scores regarding the medical test results, such as ALT, AST, ALP, and GGT, were found to be statistically significant, with p-values of < 0.001 in both the Gifu and NAFLD patient populations. The ALT, AST, ALP, and GGT are considered the important predictors for T2D among patients with NAFLD, followed by HDL, triglyceride, SBP, DBP, and smoking level 3, whereas all are significant in the Gifu population among men and women. The high OR scores in HDL and SBP are shown in NAFLD patients in Gifu. T2D in NAFLD patients is 4.55 and 5.54 times more likely to be present in patients with HDL of lower than 40 mg/dL in men and lower than 50 mg/dL in women, respectively than in those without diabetes. The SBP was also shown high, where the OR scores of elevated and high are 3.83 and 4.53. In the NAFLD population, high levels of SBP, hypertension, hyperlipidemia, and metabolic syndrome are significantly associated with T2D in patients with NAFLD. T2D was recorded as 4.38 times more likely to be present in patients with metabolic syndrome than those without T2D. According to the results using the Gifu dataset (with prediabetes), among patients with NAFLD, the risk factors for T2D based on the WHO/CDC/ADA [38,39,40,41] guidelines that have significant scores are BMI with obesity level II, tests related to hypertension (SBP and DBP), high total cholesterol, high triglyceride, smoking level 3, alcohol intake level 4, and physical inactivity. These risk factors were found to be similar to WHO/CDC/ADA guidelines and previous studies’ findings [12,13,14,15,17]. Only sex and age of ≥45 are not significant. While using the NAFLD dataset, where the case of T2D consists of prediabetes and diabetes levels, the risk factors for T2D were found to be women, the age for all ranges (starting from ≥35 years old), SBP, and hypertension. Other risk factors such as BMI, cholesterol, triglycerides, and smoking did not show to be significant due to the fact that the majority of the patients were at high levels for those risk factors, which means low variation, and thus they were not found to be statistically significant, while alcohol intake and physical inactivity values were due to unavailability in the dataset.
According to the FBG and HbA1c data, the optimal cut-off points measured by Youden Index were recorded to be optimal at 99.50 mg/dL and 5.426%, respectively in the Gifu NAFLD dataset. While in the NAFLD dataset, the Youden Index-based optimal cut-off points are 111.50 mg/dL and 5.96% for FBG and HbA1c, respectively. The optimal cut-off points produced by sensitivity and specificity were found different, where the optimal cut-off points for FBG are 100.5 mg/dL and 103.50 mg/dl, and for HbA1c are 5.426% and 5.885%, shown in Figure 4 and Figure 5 respectively. Using those various cut-off points, the results show the best performance in terms of sensitivity majority produced by cut-off points as recommended by WHO, 100 mg/dL for FBG, with sensitivity scores of 72.65%, 83.33%, and 82.95%. In terms of specificity, the best performance is recorded by the product of sensitivity and specificity cut-off point and WHO cut-off point recommendation with the specificity of 68.39% and 88.80%. Youden Index-based cut-off point produces the best sensitivity in both FBG and HbA1c in the NAFLD dataset, with a sensitivity of 83.33% and 82.95%. In terms of accuracy, the FBG test applied to the Gifu NAFLD dataset can accurately classify diabetes as much as 68.30% using a cut-off point based on sensitivity and specificity products. While the HbA1c test is capable to classify T2D as much as 84.71% based on the WHO cut-off point recommendation. In the NAFLD dataset, the FBG test is a maximum of 82.03% capable to classify diabetes using the Youden Index-based cut-off point, and the HbA1c test is 73.23% capable to classify diabetes using the product of sensitivity and specificity cut-off point. In terms of AUC, the ability of the FBG and HbA1c tests applied to the Gifu NAFLD dataset is similar (73%) and both are worthless [47], while in the NAFLD dataset, the performance is much better, whereas 82% and 83% were able to classify T2D. Furthermore, the goodness of fit test results based on the Hosmer and Lemeshow tests show a good fit for both the Gifu and NAFLD datasets, with p-values of 0.684 and 0.082, respectively. The results indicate the model adequately fits the data while utilizing FPG and HbA1c, with p-values larger than 0.05. Finally, the optimal scaling applied to glucose (FPG) and HbA1c levels for both the Gifu and NAFLD datasets using elastic-net regularization with 10-fold cross-validation displayed good scores in terms of the root mean square error (RMSE). The RMSE scores of the models utilizing glucose (FPG) and HbA1c in the Gifu NAFLD dataset are 0.998 and 0.999, respectively. In the NAFLD dataset, the RMSE scores of the models utilizing glucose (FPG) and HbA1c are 0.856 and 0.849, respectively. The RMSE scores of the models in both datasets were low, which indicates that the predictions are close to the actual values and also display small errors between the predicted and actual values [48]. In addition, we also measured the geometric means following Gerstein et al. [49]. The geometric mean of the glucose (FPG) and HbA1c variables in the Gifu NAFLD dataset are 1.89, with a standard deviation of 0.273. In the NAFLD dataset, the geometric mean for the glucose and HbA1c variables is 1.53, with a standard deviation of 0.487. Both of the geometric means showed not much difference compared to [49], which utilized the same variables. The results in Table 3 showed, using a cut point recommended by WHO, CDC, and ADA, that the accuracy of the FPG test used to diagnose T2D is 64.39% in the Gifu NAFLD dataset. In the NAFLD dataset, the accuracy of the test using HbA1c is 68.44%. Our results show that utilization of a cut point recommended by WHO/CDC/ADA is not always the best solution. The validity and reliability of these recommended tests still need to be evaluated [14]. The inconsistency in the validity of the test results could be due to several factors, such as disease progress that may change the blood glucose level of the patient over time [50] and also due to technical problems that affect the validity of the test results run by the test tool, such as a glucometer [51]. In this study, the results showed the best accuracy scores achieved by utilizing other cut points, such as those based on the Youden index and the product of sensitivity and specificity. For example, utilizing cut points based on the product of sensitivity and specificity achieved the best accuracy scores for FBG and HbA1c tests in the Gifu and NAFLD datasets, with accuracy scores of 68.30% and 73.23%, respectively. While another result found the best accuracy achieved by utilizing a cut point based on the Youden index in the NAFLD dataset, with an accuracy of 82.03% using the FPG test. Therefore, analysis of the performance of T2D diagnostic tests is suggested when conducting an assessment of T2D screening scores [12,13,14,15,16,17].
According to the results of feature selection shown in Figure 8a, the selected features after the application of the forward logistic regression-based feature selection method are WC (a value that represents a patient’s abdomen measurement in centimeters, cm), ALT (a value representing the amount of the alanine transaminase enzyme in the liver), Weight (the amount of the patient’s body weight measured in kilograms, kg), HDL-mgdl (the amount of high-density multiprotein complex particles that move all lipid molecules through the body’s water and outside of cells, measured in milligrams per deciliter, mgdL), HbA1c-mmol (the amount of blood sugar or glucose attached to a patient’s hemoglobin, measured in millimoles, mmol), Smoking (a patient’s smoking status measured in levels 1 to 3), and glucose-mgdl (a patient’s fasting blood sugar (FBS) level, measured in milligram per deciliter, mgdL) for the Gifu NAFLD dataset. For the NAFLD dataset (see Figure 8b), the selected features are hip circumference (a value that represents a patient’s hip measurement in centimeters, cm), hypertension (the high level of blood pressure measured in millimeters of mercury, mmHg), hyperlipidemia (the presence of a high amount of lipids in the patient’s blood), body mass index (an indicator of total body fat in a patient, which is measured by the patient’s weight in kilograms divided by the square of their height in meters), systolic blood pressure (the amount of pressure experienced by the arteries while the heart is beating, measured in millimeters of mercury, mmHg), metabolic syndrome (the patient’s status according to the presence of a cluster of risk factors for diabetes, hypertension, and heart disease), albumin (the amount of albumin, which is a protein in blood plasma made by the liver, measured in gram per deciliter, g/dL), age (a period of a patient’s life, measured in years), HDL (the amount of good multiprotein complex particles that move all lipid molecules through the body’s water and outside of cells, measured in milligram per deciliter, mgdL), LDL (the amount of low-density multiprotein complex particles that move all lipid molecules through the body’s water and outside of cells (measured in milligrams per deciliter, mgdL), glucose (a patient’s fasting blood sugar (FBS) level, measured in milligrams per deciliter, mgdL), Hemoglobin-A1C (the amount of blood sugar or glucose attached to a patient’s hemoglobin, measured in millimoles, mmol), and fibrosis (the estimated amount of scarring in the liver, measured in scores 0 to 4).
As shown in Figure 9 and Figure 10, before applying feature selection based on the forward logistic regression method, the performance of the models was considered to be low in both Gifu and NAFLD datasets compared to after the feature selection method application. Our proposed model outperforms in terms of all performance evaluation metrics among all the existing models, such as LR, KNN, DT, XGB, and SVM in both datasets. Using the Gifu NAFLD dataset (see Figure 9), our proposed T2D prediction model achieves a precision of 80.69%, a recall of 53.78%, an F1 score of 54.84%, and an accuracy of 92.11%. The improvement scores after the forward logistic regression-based feature selection method application recorded as much as 10.40%, 0.04%, 0.89%, and 1.65%, respectively, for precision, recall, F1, and accuracy (see Table 7). Furthermore, using the NAFLD dataset (see Figure 10), our proposed T2D prediction model achieves precision, recall, F1, and accuracy as high as 84.12%, 80.74%, 81.37%, and 83.05%, respectively, with improvement scores of 4.94%, 4.51%, 5.17%, and 5.35% (see Table 7).
Finally, we also compared our proposed T2D prediction model to the models using clinical variables (diabetes diagnostic tests) recommended by WHO and ADA (see Table 3). Based on the results, our proposed T2D prediction model produces better performance compared to the models using clinical variables (diabetes diagnostic tests) recommended by WHO and ADA when applied in both Gifu and NAFLD datasets. Utilizing the Gifu NAFLD dataset, our proposed T2D prediction model achieves better performance in terms of recall or PPV and accuracy, where the maximum score of recall or PPV of the model using clinical variables is 23.37% and accuracy is 84.71%, our proposed model achieves 80.69% and 92.11%. Followed by the results in the NAFLD dataset (see Figure 9), our proposed model also outperforms the models using clinical variables (diabetes diagnostic tests) recommended by WHO and ADA in terms of recall or PPV and accuracy, with the maximum score of the recall or PPV is 80.98% and accuracy is 82.03%, where our proposed model achieves 84.12% and 83.05% for recall or PPV and accuracy, respectively.
Based on our findings in this study, there are three clinical relevances. First, using the chi-square test, the ALT, AST, ALP, GGT, and SBP were significant predictors (p-values < 0.001) in both the Gifu and NAFLD patient populations, which means the important predictors or risk factors of T2D among patients with NAFLD. Thus, these predictors could be used or assigned as the risk factors of T2D in patients with NAFLD by clinical practitioners or organizations. The second clinical relevance is, we found that the optimal cut points with the best sensitivity to diagnose prediabetes in patients with NAFLD based on FPG and HbA1c are 99.50 mg/dL and 5.426%, respectively. The FPG cut point of 99.50 mg/dL and HbA1c cut point of 5.426% could be used to diagnose prediabetes in patients with NAFLD by clinical practitioners or organizations. The last clinical relevance is, as the best accuracy shown by our proposed T2D prediction model, it also could be used by clinical practitioners or organizations as the non-clinical alternative to diagnose T2D (prediabetes and diabetes) in patients with NAFLD.
Along with the significant improvement in performance made by our proposed T2D model, the limitations of the model should be noted. First, our proposed model could not handle the imbalance of class distribution or ratio. As shown in Figure 8, the recall or sensitivity in the Gifu NAFLD dataset showed low scores, which are around 50–53%. These low scores of recall or sensitivity are caused by the low rate of diabetes cases (called the “minority class”) compared with non-diabetes cases (called the “majority class”) [14]. Once the minority class and majority class are much different, it will produce an imbalanced class distribution or ratio, which could affect the classification results [52,53,54,55]. Utilization of the data balancing method has been proven [52,53,54,55] to increase the performance of the model. On the other side, the low score of sensitivity could also be caused by the presence of unmatched data with the cutoff point of the test criteria. Therefore, it affects the performance of the model in terms of recall or sensitivity. Based on these low recall or sensitivity scores, which reflect the limitations of our proposed model, we suggest utilizing the data balancing method for solving the imbalanced class distribution or ratio, thus improving the performance of the model in correctly classifying the positive cases. The second limitation is, due to the limitations of the T2D dataset in patients with NAFLD, our proposed T2D prediction model has not been validated by external validation datasets to test its validity in a set of new patient populations. Therefore, the utilization of more T2D-NAFLD datasets is still needed to improve the validity of the model. By utilizing more T2D-NAFLD datasets, it could also be used to reveal the variables that are important to predict T2D among patients with NAFLD. Revealing the variables for prediction could also be considered predictors or risk factors of T2D in NAFLD. Thus, we suggest the utilization of more T2D-NAFLD datasets and their investigation.

5. Conclusions

The utilization of the forward logistic regression-based feature selection method on the MLP model significantly improves the performance of the proposed T2D prediction model in terms of precision, PPV, recall, sensitivity, f1, and accuracy. Our proposed model also outperforms the existing machine learning models, such as LR, KNN, DT, XGB, and SVM. Moreover, our proposed T2D prediction model is expected to aid NAFLD patients in both preventing T2D incidents and taking proactive measures once T2D is diagnosed.

Author Contributions

Conceptualization, N.L.F., M.S., C.-K.Y. and M.A.; methodology, N.L.F., M.S., C.-K.Y. and J.R.; software, S.M.U. and G.A.; validation, S.M.U., G.A. and M.A.; formal analysis, M.S., S.L.Q. and N.L.F.; investigation, S.L.Q. and S.M.U.; resources, S.L.Q., S.M.U.; data curation, C.-K.Y., G.A. and S.L.Q.; writing—original draft preparation, N.L.F. and M.S.; writing—review and editing, C.-K.Y., J.R. and M.A.; visualization, M.S. and N.L.F.; supervision, C.-K.Y., J.R. and M.A.; project administration, G.A., C.-K.Y. and J.R.; funding acquisition, N.L.F. and M.S. All authors have read and agreed to the published version of the manuscript.

Funding

This research was funded by the Sejong University Industry-Academic Cooperation Foundation (Grant No. 20220208).

Institutional Review Board Statement

Not applicable.

Informed Consent Statement

Not applicable.

Data Availability Statement

The dataset used in the study can be found in both [35,36].

Conflicts of Interest

The authors declare no conflict of interest.

References

  1. Physical Inactivity Leading Cause of Disease and Disability, Warn WHO. Available online: https://www.who.int/news/item/04-04-2002-physical-inactivity-a-leading-cause-of-disease-and-disability-warns-who (accessed on 5 January 2023).
  2. Reddy, S.; Sethi, N.; Rajender, R.; Mahesh, G. Forecasting Diabetes Correlated Non-Alcoholic Fatty Liver Disease by Exploiting Naïve Bayes Tree. EAI Endorsed Trans. Scalable Inf. Syst. 2023, 10, e2. [Google Scholar] [CrossRef]
  3. Garg, K.; Reinicke, T.; Garg, S.K. NAFLD and NASH and Diabetes. Diabetes Technol. Ther. 2021, 23, S-198–S-205. [Google Scholar] [CrossRef] [PubMed]
  4. Liver Fat Directly Raises Risk of Type 2 Diabetes. Available online: https://www.diabetes.org.uk/about_us/news/liver-fat-risk-type-2-diabetes (accessed on 5 January 2023).
  5. Curry, A. Fatty Liver and Type 2 Diabetes. Available online: https://diabetes.ufl.edu/news-events/fatty-liver-and-type-2-diabetes/ (accessed on 5 January 2023).
  6. Dharmalingam, M.; Yamasandhi, P.G. Nonalcoholic Fatty Liver Disease and Type 2 Diabetes Mellitus. Indian J. Endocrinol. Metab. 2018, 22, 421–428. [Google Scholar] [CrossRef] [PubMed]
  7. Ng, C.H.; Chan, K.E.; Chin, Y.H.; Zeng, R.W.; Tsai, P.C.; Lim, W.H.; Tan, D.J.H.; Khoo, C.M.; Goh, L.H.; Ling, Z.J.; et al. The Effect of Diabetes and Prediabetes on the Prevalence, Complications and Mortality in Nonalcoholic Fatty Liver Disease. Clin. Mol. Hepatol. 2022, 28, 565–574. [Google Scholar] [CrossRef] [PubMed]
  8. Sun, H.; Saeedi, P.; Karuranga, S.; Pinkepank, M.; Ogurtsova, K.; Duncan, B.B.; Stein, C.; Basit, A.; Chan, J.C.N.; Mbanya, J.C.; et al. IDF Diabetes Atlas: Global, Regional and Country-Level Diabetes Prevalence Estimates for 2021 and Projections for 2045. Diabetes Res. Clin. Pract. 2022, 183, 109119. [Google Scholar] [CrossRef]
  9. Yan, Y.; Wu, T.; Zhang, M.; Li, C.; Liu, Q.; Li, F. Prevalence, Awareness and Control of Type 2 Diabetes Mellitus and Risk Factors in Chinese Elderly Population. BMC Public Health 2022, 22, 1382. [Google Scholar] [CrossRef]
  10. Younossi, Z.M. Non-Alcoholic Fatty Liver Disease—A Global Public Health Perspective. J. Hepatol. 2019, 70, 531–544. [Google Scholar] [CrossRef]
  11. Kianpour, F.; Fararouei, M.; Hassanzadeh, J.; Mohammadi, M.; Dianatinasab, M. Performance of Diabetes Screening Tests: An Evaluation Study of Iranian Diabetes Screening Program. Diabetol. Metab. Syndr. 2021, 13, 13. [Google Scholar] [CrossRef]
  12. Meng, L.; Kwon, K.-S.; Kim, D.J.; Lee, Y.; Kim, J.; Kshirsagar, A.V.; Bang, H. Performance of Diabetes and Kidney Disease Screening Scores in Contemporary United States and Korean Populations. Diabetes Metab. J. 2022, 46, 273–285. [Google Scholar] [CrossRef] [PubMed]
  13. Addressing the Specific Behavioral Health Needs of Men. Available online: https://www.ncbi.nlm.nih.gov/books/NBK144289/ (accessed on 5 January 2023).
  14. Lee, Y.; Bang, H.; Kim, H.C.; Kim, H.M.; Park, S.W.; Kim, D.J. A Simple Screening Score for Diabetes for the Korean Population. Diabetes Care 2012, 35, 1723–1730. [Google Scholar] [CrossRef]
  15. Mao, T.; Chen, J.; Guo, H.; Qu, C.; He, C.; Xu, X.; Yang, G.; Zhen, S.; Li, X. The Efficacy of New Chinese Diabetes Risk Score in Screening Undiagnosed Type 2 Diabetes and Prediabetes: A Community-Based Cross-Sectional Study in Eastern China. J. Diabetes Res. 2020, 2020, 7463082. [Google Scholar] [CrossRef] [PubMed]
  16. Fitriyani, N.L.; Syafrudin, M.; Ulyah, S.M.; Alfian, G.; Qolbiyani, S.L.; Anshari, M. A Comprehensive Analysis of Chinese, Japanese, Korean, US-PIMA Indian, and Trinidadian Screening Scores for Diabetes Risk Assessment and Prediction. Mathematics 2022, 10, 4027. [Google Scholar] [CrossRef]
  17. Lee, S.M.; Hwangbo, S.; Norwitz, E.R.; Koo, J.N.; Oh, I.H.; Choi, E.S.; Jung, Y.M.; Kim, S.M.; Kim, B.J.; Kim, S.Y.; et al. Nonalcoholic Fatty Liver Disease and Early Prediction of Gestational Diabetes Mellitus Using Machine Learning Methods. Clin. Mol. Hepatol. 2022, 28, 105–116. [Google Scholar] [CrossRef] [PubMed]
  18. Oh, T.; Kim, D.; Lee, S.; Won, C.; Kim, S.; Yang, J.; Yu, J.; Kim, B.; Lee, J. Machine Learning-Based Diagnosis and Risk Factor Analysis of Cardiocerebrovascular Disease Based on KNHANES. Sci. Rep. 2022, 12, 2250. [Google Scholar] [CrossRef]
  19. Ahsan, M.M.; Luna, S.A.; Siddique, Z. Machine-Learning-Based Disease Diagnosis: A Comprehensive Review. Healthcare 2022, 10, 541. [Google Scholar] [CrossRef] [PubMed]
  20. Alfian, G.; Syafrudin, M.; Fahrurrozi, I.; Fitriyani, N.L.; Atmaji, F.T.D.; Widodo, T.; Bahiyah, N.; Benes, F.; Rhee, J. Predicting Breast Cancer from Risk Factors Using SVM and Extra-Trees-Based Feature Selection Method. Computers 2022, 11, 136. [Google Scholar] [CrossRef]
  21. Syafrudin, M.; Alfian, G.; Fitriyani, N.L.; Hadibarata, T.; Rhee, J.; Anshari, M. Future Glycemic Events Prediction Model Based On Artificial Neural Network. In Proceedings of the 2022 International Conference on Innovation and Intelligence for Informatics, Computing, and Technologies (3ICT), Sakheer, Bahrain, 20–21 November 2022; pp. 151–155. [Google Scholar]
  22. Siddiqui, S.; Arifeen, M.; Hopgood, A.; Good, A.; Gegov, A.; Hossain, E.; Rahman, W.; Hossain, S.; Al Jannat, S.; Ferdous, R.; et al. Deep Learning Models for the Diagnosis and Screening of COVID-19: A Systematic Review. SN Comput. Sci. 2022, 3, 397. [Google Scholar] [CrossRef]
  23. Choi, S.B.; Kim, W.J.; Yoo, T.K.; Park, J.S.; Chung, J.W.; Lee, Y.; Kang, E.S.; Kim, D.W. Screening for Prediabetes Using Machine Learning Models. Comput. Math. Methods Med. 2014, 2014, 618976. [Google Scholar] [CrossRef]
  24. Prananda, A.R.; Frannita, E.L.; Hutami, A.H.T.; Maarif, M.R.; Fitriyani, N.L.; Syafrudin, M. Retinal Nerve Fiber Layer Analysis Using Deep Learning to Improve Glaucoma Detection in Eye Disease Assessment. Appl. Sci. 2022, 13, 37. [Google Scholar] [CrossRef]
  25. Dutta, A.; Hasan, M.K.; Ahmad, M.; Awal, M.A.; Islam, M.A.; Masud, M.; Meshref, H. Early Prediction of Diabetes Using an Ensemble of Machine Learning Models. Int. J. Environ. Res. Public Health 2022, 19, 12378. [Google Scholar] [CrossRef]
  26. Fitriyani, N.L.; Syafrudin, M.; Alfian, G.; Rhee, J. Development of Disease Prediction Model Based on Ensemble Learning Approach for Diabetes and Hypertension. IEEE Access 2019, 7, 144777–144789. [Google Scholar] [CrossRef]
  27. Fitriyani, N.L.; Syafrudin, M.; Alfian, G.; Yang, C.; Rhee, J.; Ulyah, S.M. Chronic Disease Prediction Model Using Integration of DBSCAN, SMOTE-ENN, and Random Forest. In Proceedings of the 2022 ASU International Conference in Emerging Technologies for Sustainability and Intelligent Systems (ICETSIS), Manama, Bahrain, 22–23 June 2022; pp. 289–294. [Google Scholar]
  28. Al Bataineh, A.; Manacek, S. MLP-PSO Hybrid Algorithm for Heart Disease Prediction. JPM 2022, 12, 1208. [Google Scholar] [CrossRef] [PubMed]
  29. Pal, M.; Parija, S.; Panda, G.; Dhama, K.; Mohapatra, R.K. Risk Prediction of Cardiovascular Disease Using Machine Learning Classifiers. Open Med. 2022, 17, 1100–1113. [Google Scholar] [CrossRef]
  30. Bikku, T. Multi-Layered Deep Learning Perceptron Approach for Health Risk Prediction. J. Big Data 2020, 7, 50. [Google Scholar] [CrossRef]
  31. Sivaranjani, R.; Yuvaraj, N. Artificial Intelligence Model for Earlier Prediction of Cardiac Functionalities Using Multilayer Perceptron. J. Phys. Conf. Ser. 2019, 1362, 012062. [Google Scholar] [CrossRef]
  32. Zhang, Z. Variable Selection with Stepwise and Best Subset Approaches. Ann. Transl. Med. 2016, 4, 136. [Google Scholar] [CrossRef]
  33. Sanchez-Pinto, L.N.; Venable, L.R.; Fahrenbach, J.; Churpek, M.M. Comparison of Variable Selection Methods for Clinical Predictive Modeling. Int. J. Med. Inform. 2018, 116, 10–17. [Google Scholar] [CrossRef]
  34. Soroush, A.; Bahreininejad, A.; van den Berg, J. A Hybrid Customer Prediction System Based on Multiple Forward Stepwise Logistic Regression Mode. IDA 2012, 16, 265–278. [Google Scholar] [CrossRef]
  35. Ectopic Fat Obesity Presents the Greatest Risk for Incident Type 2 Diabetes: A Population-Based Longitudinal Study. Available online: https://datadryad.org/stash/dataset/doi:10.5061/dryad.8q0p192 (accessed on 7 November 2022).
  36. Fatty Liver Disease Dataset. Available online: https://www.kaggle.com/datasets/tourdeglobe/fatty-liver-disease (accessed on 7 November 2022).
  37. Singhal, R.; Rana, R. Chi-Square Test and Its Application in Hypothesis Testing. J. Pract. Cardiovasc. Sci. 2015, 1, 69–71. [Google Scholar] [CrossRef]
  38. Guidelines for the Prevention, Management, and Care of Diabetes Mellitus. Available online: https://applications.emro.who.int/dsaf/dsa664.pdf (accessed on 26 August 2022).
  39. Diagnosis and Management of Type 2 Diabetes. Available online: https://apps.who.int/iris/rest/bitstreams/1274478/retrieve (accessed on 26 August 2022).
  40. Diabetes Risk Factors. Available online: https://www.cdc.gov/diabetes/basics/risk-factors.html (accessed on 26 August 2022).
  41. Classification and Diagnosis of Diabetes: Standard of Care in Diabetes-2023. Available online: https://diabetesjournals.org/care/article/46/Supplement_1/S19/148056/2-Classification-and-Diagnosis-of-Diabetes (accessed on 26 August 2022).
  42. Zhao, T.; Zheng, Y.; Wu, Z. Feature Selection-Based Machine Learning Modeling for Distributed Model Predictive Control of Nonlinear Processes. Comput. Chem. Eng. 2023, 169, 108074. [Google Scholar] [CrossRef]
  43. Abirami, S.; Chitra, P. Energy-Efficient Edge Based Real-Time Healthcare Support System. In Advances in Computers; Elsevier: Amsterdam, The Netherlands, 2020; Volume 117, pp. 339–368. ISBN 978-0-12-818756-2. [Google Scholar]
  44. Menzies, T.; Kocagüneli, E.; Minku, L.; Peters, F.; Turhan, B. Using Goals in Model-Based Reasoning. In Sharing Data and Models in Software Engineering; Elsevier: Amsterdam, The Netherlands, 2015; pp. 321–353. ISBN 978-0-12-417295-1. [Google Scholar]
  45. Trevethan, R. Sensitivity, Specificity, and Predictive Values: Foundations, Pliabilities, and Pitfalls in Research and Practice. Front. Public Health 2017, 5, 307. [Google Scholar] [CrossRef] [PubMed]
  46. Fitriyani, N.L.; Syafrudin, M.; Alfian, G.; Rhee, J. HDPM: An Effective Heart Disease Prediction Model for a Clinical Decision Support System. IEEE Access 2020, 8, 133034–133050. [Google Scholar] [CrossRef]
  47. Bolboacă, S.D. Medical Diagnostic Tests: A Review of Test Anatomy, Phases, and Statistical Treatment of Data. Comput. Math. Methods Med. 2019, 1748-670X. [Google Scholar] [CrossRef] [PubMed]
  48. Alfian, G.; Syafrudin, M.; Ijaz, M.F.; Syaekhoni, M.A.; Fitriyani, N.L.; Rhee, J. A Personalized Healthcare Monitoring System for Diabetic Patients by Utilizing BLE-Based Sensors and Real-Time Data Processing. Sensors 2018, 18, 2183. [Google Scholar] [CrossRef]
  49. Gerstein, H.C.; Ramasundarahettige, C.; Bangdiwala, S.I. Creating Composite Indices From Continuous Variables for Research: The Geometric Mean. Diabetes Care 2021, 44, e85–e86. [Google Scholar] [CrossRef]
  50. Sacks, D.B. A1C versus glucose testing: A comparison. Diabetes Care 2011, 34, 518–523. [Google Scholar] [CrossRef] [PubMed]
  51. Tonyushkina, K.; Nichols, J.H. Glucose meters: A review of technical challenges to obtaining accurate results. J. Diabetes Sci. Technol. 2009, 3, 971–980. [Google Scholar] [CrossRef] [PubMed]
  52. Fitriyani, N.L.; Syafrudin, M.; Alfian, G.; Fatwanto, A.; Qolbiyani, S.L.; Rhee, J. Prediction Model for Type 2 Diabetes Using Stacked Ensemble Classifiers. In Proceedings of the 2020 International Conference on Decision Aid Sciences and Application (DASA), Sakheer, Bahrain, 8–9 November 2020; pp. 399–402. [Google Scholar] [CrossRef]
  53. Goel, G.; Maguire, L.; Li, Y.; McLoone, S. Evaluation of sampling methods for learning from imbalanced data. Intell. Comput. Theor. 2013, 7995, 392–401. [Google Scholar] [CrossRef]
  54. Batista, G.E.A.P.A.; Prati, R.C.; Monard, M.C. A study of the behavior of several methods for balancing machine learning training data. ACM SIGKDD Explor. Newsl. 2004, 6, 20–29. [Google Scholar] [CrossRef]
  55. Deberneh, H.M.; Kim, I. Prediction of Type 2 Diabetes Based on Machine Learning Algorithm. Int. J. Environ. Res. Public Health 2021, 18, 3317. [Google Scholar] [CrossRef]
Figure 1. The proposed study design.
Mathematics 11 02266 g001
Figure 2. Proposed T2D prediction model among patients with NAFLD.
Mathematics 11 02266 g002
Figure 3. Multi-layer perceptron architecture.
Mathematics 11 02266 g003
Figure 4. Cut-off point based on sensitivity and specificity of fasting plasma glucose (a) and HbA1c (b) on the Gifu NAFLD dataset.
Mathematics 11 02266 g004
Figure 5. Cut-off point based on sensitivity and specificity of fasting plasma glucose (a) and HbA1c (b) on the NAFLD dataset.
Mathematics 11 02266 g005
Figure 6. ROC Curve of Glucose (a) and HbA1c (b) on the Gifu NAFLD dataset.
Mathematics 11 02266 g006
Figure 7. ROC Curve of Glucose (a) and HbA1c (b) on the NAFLD dataset.
Mathematics 11 02266 g007
Figure 8. Selected features based on the forward logistic regression method in the Gifu NAFLD dataset (a) and NAFLD dataset (b).
Mathematics 11 02266 g008aMathematics 11 02266 g008b
Figure 9. The performance of the proposed model compared to existing models before and after applying the forward logistic regression-based feature selection method on the Gifu NAFLD dataset.
Mathematics 11 02266 g009
Figure 10. The performance of the proposed model compared to existing models before and after applying the forward logistic regression-based feature selection method on the NAFLD dataset.
Mathematics 11 02266 g010
Table 1. Characteristics of the patient population.
CharacteristicsGifu NAFLD Dataset (n = 2741)NAFLD Dataset (n = 605)
Sex, Men/Women, n (%)2255 (82.24)/486 (17.72)321 (53.06)/284 (46.94)
Age, year44.00 ± 13.0047.00 ± 16.00
Weight, kg71.40 ± 13.9085.00 ± 16.00
BMI, kg/m225.08 ± 3.7831.21 ± 5.91
Normal (18.5 ≤ MI < 23), n (%)544 (19.84)3 (0.50)
Overweight (23 ≤ BMI < 25), n (%)789 (28.77)36 (5.95)
Obese I (25 ≤ BMI < 30), n (%)1185 (43.22)188 (31.07)
Obese II (BM ≥ 30), n (%)219 (7.99)377 (62.31)
WC, Men/Women, cm86.00 ± 9.00/82.00 ± 12.00106.00 ± 10.00/112.00 ± 16.00
HC, Men/Women, cm-104.00 ± 12.00/104.00 ± 15.75
ALT, U/L27.00 ± 19.0066.00 ± 54.00
AST, U/L21.00 ± 9.0042.00 ± 25.00
ALP, U/L-89.50 ± 46.00
GGT, U/L23.00 ± 18.0049.00 ± 43.75
LDH, U/L-215.00 ± 101.00
HDL, mg/dL44.00 ± 13.5044.00 ± 13.00
LDL, mg/dL-134.00 ± 53.00
Total Cholesterol, mg/dL210.00 ± 44.00211.00 ± 56.00
Triglyceride, mg/dL111.00 ± 83.00164.50 ± 114.25
HbA1c in general, %5.30 ± 0.405.80 ± 1.00
FBG, mg/dL97.00 ± 9.00100.00 ± 25.00
SBP, mmHg122.50 ± 19.00121.00 ± 15.00
DBP, mmHg77.50 ± 15.5080.00 ± 10.00
Ethanol, mg/dL50.89 ± 86.474-
Alcohol, n (%)
Level 12088 (76.15)-
Level 2286 (10.43)-
Level 3250 (9.12)-
Level 4117 (4.27)-
Smoking, n (%)
Level 1 (Never Smoking)1226 (44.71)267 (44.13)
Level 2 (Left Smoking)726 (26.48)206 (34.05)
Level 3 (Smoking)789 (28.77)104 (17.19)
Physical Inactive, n (%)2340 (85.38)-
Hypertension, n (%)-214 (35.37)
Hyperlipidemia, n (%)-351 (58.02)
Metabolic Syndrom, n (%)-392 (64.79)
NASH, n (%)-537 (88.76)
Diabetes and NASH, n (%)-207 (34.21)
Diabetes, n (%)223 (8.13)225 (37.19)
Note: Values are presented as mean ± standard deviation or number (%). BMI, body mass index; WC, waist circumference; HC, hip circumference; ALT, alanine aminotransferase; AST, aspartate aminotransferase, ALP, alkaline phosphatase; GGT, gamma-glutamyl transferase; LDH, lactate dehydrogenase; HDL, high-density lipoprotein; LDL, low-density lipoprotein HbA1c, glycated hemoglobin; FBG, fasting blood glucose; SBP, systolic blood pressure; DBP, diastolic blood pressure, NASH, non-alcoholic steatohepatitis.
Table 2. Association scores of predictor and T2D in NAFLD patient.
Predictor (Assigned Score)Gifu NAFLD Dataset
(T2D: Prediabetes Stage)
(T2D Cases = 223, n = 2741)
NAFLD Dataset
(T2D: Prediabetes + Diabetes Stages)
(T2D Cases = 225, n = 605)
OR (95% CI)p-ValueOR (95% CI)p-Value
Sex, Women1.05 (0.74–1.50)0.792.19 (1.57–3.07)<0.001
Age, year
35 ≤ Age < 451.68 (0.80–3.53)0.173.75 (1.84–7.62)<0.001
45 ≤ Age < 602.03 (0.97–4.23)0.065.58 (2.85–10.91)<0.001
Age ≥ 602.13 (0.83–5.48)0.1114.18 (6.23–32.26)<0.001
BMI, kg/m2
Overweight (23 ≤ BMI < 25)0.91 (0.57–1.44)0.681.15 (0.11–12.44)0.91
Obese I (25 ≤ BMI < 30)1.53 (1.03–2.29)0.031.18 (0.12–11.58)0.89
Obese II (BM ≥ 30)2.76 (1.66–4.56)<0.0012.24 (0.23–21.70)0.48
WC ≥ 90 (Men), cm2.27 (1.67–3.09)<0.0011.63 (0.18–14.76)0.66
ALT, U/L1.91 (1.31–2.78)<0.0010.50 (0.36–0.70)<0.001
AST, U/L1.50 (0.68–3.35)<0.0010.99 (0.36–1.40)<0.001
ALP, U/L- 0.77 (0.51–1.17)<0.001
GGT, U/L1.52 (0.96–2.40)<0.0011.39 (0.99–1.96)<0.001
HDL, mg/dL
Elevated in Men (40 ≤ HDL < 59)2.80 (1.01–7.72)<0.0010.78 (0.26–2.40)0.67
Low in Men (HDL < 40)4.55 (1.64–12.60)<0.0010.81 (0.26–2.55)0.72
Elevated in Women (50 ≤ HDL < 59)4.92 (1.39–17.41)<0.0010.88 (0.41–1.90)0.75
Low in women (HDL < 50)5.54 (1.60–18.52)<0.0010.71 (0.36–1.42)0.34
Total Cholesterol ≥ 240 (High), mg/dL1.65 (1.13–2.40)0.010.87 (0.57–1.32)0.51
Triglyceride ≥ 240 (High), mg/dL2.19 (1.55–3.08)<0.0011.12 (0.77–1.64)0.55
SBP ≥ 240 (High), mmHg4.53 (3.10–6.63)<0.0012.74 (1.63–4.61)<0.001
DBP ≥ 90 (High), mmHg1.41 (0.94–2.12)<0.0011.30 (0.81–2.06)0.26
Alcohol Intake
Level 21.11 (0.72–1.72)0.62--
Level 30.76 (0.45–1.29)0.31--
Level 40.93 (0.46–1.87)0.04--
Smoking
Level 21.07 (0.74–1.55)0.700.97 (0.67–1.41)0.87
Level 31.94 (1.44–2.69)<0.0010.92 (0.57–1.47)0.72
Physical Inactive1.62 (1.03–2.55)0.04--
Hypertension, n (%)--2.62 (1.85–3.70)<0.001
Hyperlipidemia, n (%)--2.08 (1.47–2.94)<0.001
Metabolic Syndrom, n (%)--4.38 (2.52–6.58)<0.001
Type of Disease = Severe Illness, n (%)--1.83 (1.00–3.38)0.05
NASH, n (%)--1.74 (0.99–3.07)0.05
Notes: Values are presented as an odd ratio, 95% confidence index, and p-value with the chi-square test. BMI, body mass index; WC, waist circumference; ALT, alanine aminotransferase; AST, aspartate aminotransferase, ALP, alkaline phosphatase; GGT, gamma-glutamyl transferase; HDL, high-density lipoprotein; TC, total cholesterol; SBP, systolic blood pressure; DBP, diastolic blood pressure; NASH, non-alcoholic steatohepatitis.
Table 3. Performance of T2D diagnostic tests in patients with NAFLD.
Model PopulationGifu NAFLD Dataset
(T2D: Prediabetes Stage)
(T2D Cases = 223, n = 2741)
NAFLD Dataset
(T2D: Prediabetes + Diabetes Stages)
(T2D Cases = 225, n = 605)
Diagnostic TestFPGHbA1cFPGHbA1c
Cut point as recommended by WHO or ADA (a)1005.71005.7
Youden Index-based optimal cut point (b)99.505.426111.505.960
Sensitivity and Specificity-based optimal cut point (c)100.505.426103.505.885
Percentage of high risk based on a/b/c5.91/5.91/5.473.14/5.36/5.3651.75/30.62/42.6756.91/40.60/46.10
Sensitivity, based on a/b/c (%)72.65/72.65/67.2638.57/65.92/65.9283.33/67.12/77.0382.95/73.27/75.12
Specificity, based on a/b/c (%)63.66/63.66/68.3988.80/68.51/68.5166.75/90.77/77.3159.37/79.83/72.05
PPV, based on a/b/c (%)15.04/15.04/15.8623.37/15.64/15.6459.49/80.98/66.5456.07/69.43/62.69
NPV, based on a/b/c (%)96.33/96.33/95.9394.23/95.78/95.7887.24/82.49/85.1784.77/82.69/82.24
LR+, based on a/b/c (%)2.00/2.00/2.133.44/2.09/2.092.51/7.27/3.392.04/3.63/2.69
LR−, based on a/b/c (%)0.43/0.43/0.480.69/0.50/0.500.25/0.36/0.300.29/0.33/0.35
Accuracy, based on a/b/c (%)64.39/64.39/68.3084.71/68.30/68.3072.88/82.03/77.2068.44/53.10/73.23
Youden Index, based on a/b/c (%)36.31/36.31/35.6527.37/34.43/34.4350.09/57.88/54.3442.32/53.10/47.16
Standard error0.0180.0180.0180.020
p-value (CST, HLT)<0.001, 0.514<0.001, 0.214<0.001, 0.000<0.001, 0.000
95% CI of AUC0.69–0.760.69–0.760.81–0.890.78–0.87
AUC0.730.730.850.82
RMSE0.9980.9990.8560.849
0.9900.806
GM ± SD1.89 ± 1.273 1.53 ± 0.487
Notes: WHO, world health organization; ADA, American diabetes association; PPV, positive predictive value; NPV, negative predictive value; LR+, likelihood ratio positive; LR−, likelihood ratio negative; 95% CI, 95% confidence index; CST, chi-square test; HST, Hosmer, and Lemeshow test; AUC, the area under the curve; RMSE, root mean standard error; GM, geometric mean; SD, standard deviation; a, cut point as recommended by WHO or ADA; b, Youden index-based optimal cut point; c, sensitivity and specificity-based optimal cut point.
Table 4. Characteristics of the dataset used in the study.
DatasetCharacteristics
SizeNumber of Original FeaturesNumber of ClassNumber of Selected Features
Gifu NAFLD dataset27413027
NAFLD dataset605621113
Table 5. The 95% confidence intervals (95% CI) of performance evaluation metrics on the Gifu NAFLD dataset before and after feature selection (FS).
Model95% CI of Precision (%)95% CI of Recall (%)95% CI of F1 (%)95% CI of Accuracy (%)
Before FSAfter FSBefore FSAfter FSBefore FSAfter FSBefore FSAfter FS
LR49.81–59.8954.38–65.6248.16–57.9146.25–55.8145.40–58.9243.35–56.5483.12–100.0083.44–100.00
KNN52.22–62.7961.91–74.7146.93–56.4348.37–58.3744.51–58.0546.75–60.9882.29–99.3782.15–99.55
DT47.48–57.0947.81–57.4847.21–56.7748.37–58.3745.40–58.9244.80–58.4472.84–87.9572.78–88.20
XGB46.26–55.6347.38–47.1743.60–52.5545–53–54.9542.20–54.7743.07–56.1975.97–91.7380.05–97.00
SVM41.89–50.3641.81–50.4545.60–54.8347.15–56.6742.03–54.5447.13–56.6783.59–100.0083.44–100.00
MLP47.38–61.4873.45–88.6449.02–58.9448.96–59.1048.14–62.4748.14–62.4782.32–99.4083.68–100.00
Table 6. The 95% confidence intervals (95% CI) of performance evaluation metrics on the NAFLD dataset before and after feature selection (FS).
Model95% CI of Precision (%)95% CI of Recall (%)95% CI of F1 (%)95% CI of Accuracy (%)
Before FSAfter FSBefore FSAfter FSBefore FSAfter FSBefore FSAfter FS
LR73.29–85.4378.02–90.5670.10–81.7179.10–83.7367.80–84.2172.72–89.7870.64–84.9675.70–90.71
KNN61.76–71.9972.68–69.8359.91–69.8368.60–79.6358.00–71.6167.02–82.7560.72–73.0371.95–85.01
DT66.29–77.2768.74–80.1365.25–76.0667.99–78.9362.64–77.8065.90–81.3764.92–78.0768.49–82.05
XGB74.77–87.1676.34–88.6167.19–78.3275.15–87.2371.52–88.8373.09–90.0273.75–88.6975.34–90.28
SVM71.58–83.4376.22–88.4767.22–88.6971.30–83.1165.43–81.2669.87–86.2768.67–82.5973.40–87.95
MLP68.37–84.9278.08–90.6370.61–82.3074.94–86.9968.37–84.9272.99–90.6570.86–85.2275.87–90.91
Table 7. The improvement score after forward logistic regression-based feature selection method application on the MLP model.
DatasetImprovement Score (%)
PrecisionRecallF1Accuracy
Gifu NAFLD dataset10.400.040.891.65
NAFLD dataset4.944.515.175.35
Disclaimer/Publisher’s Note: The statements, opinions and data contained in all publications are solely those of the individual author(s) and contributor(s) and not of MDPI and/or the editor(s). MDPI and/or the editor(s) disclaim responsibility for any injury to people or property resulting from any ideas, methods, instructions or products referred to in the content.

