Article

Numerical Investigation on a Diffuser-Augmented Horizontal Axis Tidal Stream Turbine with the Entropy Production Theory

1
College of Water Conservancy and Hydropower Engineering, Hohai University, Nanjing 210098, China
2
College of Energy and Electrical Engineering, Hohai University, Nanjing 210098, China
3
College of Harbor Coastal and Offshore Engineering, Hohai University, Nanjing 210098, China
4
Technological Institute of Merida, Technological Avenue, Merida 97118, Mexico
*
Author to whom correspondence should be addressed.
Mathematics 2023, 11(1), 116; https://doi.org/10.3390/math11010116
Submission received: 30 November 2022 / Revised: 17 December 2022 / Accepted: 21 December 2022 / Published: 27 December 2022

Abstract

:
An implication of a turbine current is the development of a wake, a reduced speed flow, thus affecting the performance of an adjoined turbine. The aim of this study is to examine the turbine wake properties to offer a basic framework for the exploration of efficient turbine arrangements through the OpenFOAM source package and the entropy production theory. The results indicate that the diffuser inlet produces the largest entropy rate; however, this dissipates quickly after the rotor plane. In terms of vorticity, the Q and λ2-criterion results are sensitive to the isosurface thresholds. In general, the Ω-Rortex method proves a convenient and accurate solution for vortex visualization and identification. For the overall mean wake structure, the velocity profile follows a tadpole-shape, whilst the velocity deficits above 100% are observed around the nacelle and throat (diffuser) and behind the tower. The concentration of maximum turbulent intensities appears behind the throat of the diffuser and at the top and bottom of the tower. Owing to the swirling effect after rotor, we proposed recommended values of b0 = 10−5 for the hydrodynamic investigation of tidal stream turbines. The present findings extend our knowledge on the flow disruption due to shrouded turbines and are particularly relevant for farm project advisors.

1. Introduction

As petroleum power phases out, researchers focus on renewable and predictable power sources to combine with energy storage systems, with the aim of restoring the ecosystem balance. A promising approach is the deployment of multiple underwater turbines at tidal stream sites with great speeds (1∼ 2 m / s [1]) and smooth profile velocities due to the negative consequences of turbulence, such as excessive response [2] and structural-induced vibration on the turbine components. Although widely considered to be a predictable resource [3], the turbine supports are exclusively for low channel depths, therefore, forbidding large rotor size, although they can produce the same power output of a standard, similar wind turbine using a smaller diameter due to larger flow density. Currently, many authors still focus on the viability of unshrouded 3-bladed horizontal axis turbines as a result of simpleness, competitive capital costs and reliability, although new designs report higher efficiencies using diffuser casings [4,5], despite using a smaller rotor size owing to a higher flow concentration along the blades. This is achieved mainly through the diffuser, owing to the increase of flow pressure in the downstream section, and reduction afterwards the rotor. As a result, the current tends to converge in the inlet section, leading to a greater energy capture per rotor area and velocity across the turbine, compared to the free-stream condition. Despite the power benefits, even at misaligned flows [6] and the possibility of harnessing sites with lower than conventional profitable current speeds; further work is required to not only justify the diffuser costs but also assess the environmental and social risks. In addition, little is known about its performance in unsteady, as well as the effects of channel blockage and water environment, such as marine fouling and cavitation.
It is widely accepted that the positioning of the turbines within the resource is influential in the project assessment, since their functioning emits a wake, a reduction of current speed compared to the upstream section. This effect appears to be linked with the operation of the turbine, configuration of the entire device (e.g., type of support [7]) and inflow characteristics, and may merge with nearby wakes, thus influencing the upstream flow of the turbines afterwards. Although theories of the wake field are abundant, it is alleged that the wake interactions may be understood better through quantifications of the patterns and mechanisms of the single turbine wake in terms of the operating flow characteristics: turbulence intensities, depth-dependent velocity, and length scale profiles [8]. Nonetheless, most experimental and theoretical studies have been focused on single unshrouded rather than shrouded tidal stream turbines operating in low turbulent and with specific wave flows [9,10]. Thereby, it is unclear to what extent the diffuser affects the inflow properties and tower and wingtip vortices, determinants of the device efficiency and wake evolution. One way to investigate the optimum position of arrays is to predict through Computational Fluid Dynamic (CFD) programs the flow induced by the front turbines to the next rows of turbines, in terms of the entropy production [11]. The increase of the turbine downstream flow entropy is known to be inevitable and associated with lower subsequent device efficiency [12], hence the measure can serve as a tool for quantifying the resource potential and determining the parameters of a shrouded turbine system for reducing the overall losses and wake lengths.
Consequently, this paper considers the entropy theory as a main subject, to predict the downstream flow and visualize the vortex structure, along with the developed turbulence intensity. It is divided into three subsequent sections. The second section deals with the methodology, as well as the parameters to measure the entropy production and the vortex identification methods. The third section shows the computational set up and validation against experimental measurements of a scaled rotor. The fourth section discusses findings and results, and the fifth the conclusions.

2. Methodology

2.1. Governing Equation

Assuming that the fluid is incompressible, based on the law of mass and momentum conservation, the continuity and momentum equation of Navier–Stokes equation are evaluated as:
· u = 0
ρ u t + ρ · u u = p + · τ + F s
where F s represents the body force which acts on the control volume. For Newtonian fluids, the shear stress tensor τ has a linear relationship with the velocity vector u :
τ = 2 μ S
where μ is the dynamic viscosity, S = 0.5 · u + u T is the rate of deformation of the isotropy fluid, and the equation can be further expressed as:
ρ u t + ρ · u u = p + · μ u + F s
Time averages the instantaneous values of the equation and omits the source term F s , and the equation becomes:
ρ U t + ρ · U U = P + · τ ¯ · τ R
According to Reynolds averaging, the instantaneous velocity can be split as u = U + u ; here, U and u are mean and fluctuating vectors. P = p ¯ is time–mean pressure. τ ¯ = μ U + U T , and τ R represents viscous and Reynolds stress, respectively. In general, Reynolds stress is much greater than the viscous stress in the turbulent core. Hence, it is crucial to model Reynolds stress.
The Boussinesq eddy viscosity assumption determined that Reynolds stress ( τ R ) conforms to the following linear relationship:
τ R = μ t U + U T
where μ t = ρ ν t is dynamic turbulent viscosity, and ν t is kinematic turbulent viscosity. Let ν eff = ν + ν t , P eff = P + 2 / 3 · ρ k and, substituting τ R into Equation (5), RANS (Reynolds averaged Navier–Stokes) equation is expressed as:
U t + · U U = 1 ρ P eff + · ν eff U

2.2. Turbulence Model

As proposed by Menter [13,14], the SST k ω model is a two-equation eddy-viscosity model whose accuracy has been widely validated. For the SST k ω model used in OpenFOAM, the turbulence kinetic energy (k) equation of incompressible fluid is:
k t + · U k · D k k = P k β * k ω + S k
The equation of specific dissipation rate ( ω ) can be expressed as:
ω t + · U ω · D ω ω = γ · min G ν t , c 1 a 1 β * max a 1 ω , b 1 F 2 S 2 β ω 2 + 1 F 1 C D k ω + S w
The kinematic eddy viscosity ( ν t ) can be calculated as:
ν t = a 1 k max α 1 ω , b 1 F 2 S 2
where S 2 = 2 · S 2 , and the auxiliary relations are defined as:
D k = B F 1 , α k 1 , α k 2 ν t + ν D ω = B F 1 , α ω 1 , α ω 2 ν t + ν β = B F 1 , β 1 , β 2 γ = B F 1 , γ 1 , γ 2 B a , b , c = a b + ( 1 a ) c
The closure Coefficients in SST k ω equations are:
P k = min G , c 1 β * k ω C D k ω = 2 α ω , 2 k · ω ω G = 2 ν t · S : U F 1 = tanh min min max k β * ω y , 500 ν ω y 2 , 4 α ω , 2 k C D k ω y 2 , 10 4 F 2 = tanh min max 2 k β * ω y , 500 ν ω y 2 , 100 2 F 3 = 1 tanh min 150 ν ω y 2 , 10
where y is the wall-distance, according to empirical value which was suggested by Menter [15], α k , 1 = 0.85 , α k , 2 = 1 , α ω , 1 = 0.5 , α ω , 2 = 0.856 , γ 1 = 5 / 9 , γ 2 = 0.44 , β 1 = 0.075 , β 2 = 0.0828 , β * = 0.09 , a 1 = 0.31 , b 1 = 1 , c 1 = 10 .

2.3. Entropy Production Analysis

To analyze the energy transfer of free shear flows, the entropy production method can be used to present the irreversibility and energy deficit of the fluid system [16]. According to the Fourier heat conduction equation, for the incompressible fluid, the entropy transport per finite control volume is:
ρ s t + u · s = · q T + Φ I T + Φ I I T 2
where s is the specific entropy, T is the thermodynamic temperature, and q represents the heat flux. Φ I and Φ I I represent the dissipation functions of the fluid. As the entropy production caused by radiation is negligible, the entropy production rate s ˙ can be expressed as:
s ˙ = Φ I T + Φ I I T 2 = s ˙ D + s ˙ T
As seen in Equation (14), the entropy production rate consists of two terms that represent viscous ( s ˙ D ) and thermal ( s ˙ T ) contribution, respectively [17]. Since the main content of this article belongs to the field of ocean hydrodynamics, it is convenient to assume that the environment temperature is constant [18,19,20,21,22], and the contribution of the temperature gradient to entropy production is negligible ( s ˙ T 0 ). To reduce computational resource requirements, the energy equation is not solved in this numerical simulation. The entropy production rate can be further calculated by:
s ˙ D = 2 ρ ν · S 2 T
where the notation represents a Frobenius norm of strain rate tensor S , which can be split as: S = S ¯ + S . The direct (time-averaged) and indirect (turbulent) entropy production rate ( s ˙ V D and s ˙ T D ) are defined by:
s ˙ V D = 2 ρ ν · S ¯ 2 T
s ˙ T D = 2 ρ ν · S 2 T
With the Reynolds Averaged Navior Stokes method, the strain rate tensor of velocity fluctuation ( S ) cannot obtained directly from existing equations. However, in high Reynolds number flows, the turbulent production and dissipation rate are considered equal [23], namely: 2 ν · S S ¯ = u i u j ¯ · S . Hence, with Boussinesq eddy viscosity assumption, the following relationship can be derived: ν · S 2 = ν t · S ¯ 2 . The entropy production rate ( s ˙ D ) per finite control volume can be further expressed as:
s ˙ D = s ˙ V D + s ˙ T D = 2 ρ ν + ν t · S ¯ 2 T = 2 ρ ν eff · S ¯ 2 T
Furthermore, the total entropy production rate S ¯ can be calculated from the volume integral of s ˙ D over the computational domain:
S ¯ = V s ˙ D d v

2.4. Vortex Identification Methods

In order to analyze the entropy production characteristics in turbine wake, the structure of the vortex must be identified and visualized. It is necessary to outline the most commonly used vortex identification in the field of ocean hydrodynamics.

2.4.1. Vorticity Method

Vorticity is the most convenient method to identify wake vortices. It can be expressed as the curl of velocity vector: ω = × u . It is common to quantity the core of the vortex by the magnitude of vorticity ( ω ) in free shear flows. However, the vorticity method cannot effectively extract the fluid swirling in the wall shear layer [24]. Thus, it is a fundamental identification method but not sufficient to identify the vortex in free shear turbulence.

2.4.2. Q and λ2-Criterion

Q and λ 2 -criteria are the most widely used vortex identification methods [25,26,27]. These methods are eigenvalue-based criteria that can be obtained from a velocity gradient tensor ( u ). As the measurement of vorticity and strain rate magnitude, the criteria Q is expressed as:
Q = 1 2 · u + Ω 2 S 2
where Ω is the rotation rate tensor defined by the skew-symmetric part of the velocity gradient tensor: Ω = 0.5 · u u T . For incompressible flows, · u 0 , which means that Q is equal to the second invariant of u [28]. It can be directly calculated with the symmetric ( S ) and skew-symmetric ( Ω ) terms of the matrix. The Q-criterion indicates the fluid region that has a positive second invariant of the velocity gradient tensor, which means that a larger rotational force component is observed.
Equation (20) indicates that the shear effect of an incompressible fluid is less than the rotational force. As another commonly used vortex identification method [29], λ 2 -criterion is defined as the second eigenvalue λ 2 of the tensor Ω 2 + S 2 . It essentially represents the vortex core region that is associated with the negative eigenvalues of the matrix [28]; given this, λ 2 < 0 . Nevertheless, for both the Q and λ 2 criteria method, it is difficult to separate the individual vortices in the multiple vortices coexisting environment.

2.4.3. Ω and Ω -Rortex Criterion

According to Liu et al. [30], the vortex identification criterion named Ω has been proposed, which could extract the rotational part from the vorticity of fluid. Ω is defined as a dimensionless scalar that is obtained by the ratio of the skew-symmetric part of the velocity gradient:
Ω = Ω 2 Ω 2 + S 2 + ε
where ε = b 0 · max Ω 2 S 2 is a positive parameter to avoid dividing by zero and obtain an extremely large Ω . b 0 is a positive constant, which is further discussed in Section 4.
As a systematical definition of the local fluid rotation based on critical point theory [31], the Rortex/Liutex method utilizes the complex conjugate eigenvalues of u to represent the swirling of the fluid [32,33,34]. The local vector r l , named the Rortex vector, represents the rotation axis of local velocity gradient tensor and is defined as: u · r l = λ r · r l , and λ r is the real eigenvalue of u . To balance the sign of the Rortex vector, the following conditions must be imposed: ω · r l > 0 , where ω is the vorticity. The explicit definition of the magnitude of Rortex vector R l has been given by Wang et al. [35] as:
R l = ω · r l ω · r l 2 4 λ c i 2
where λ c i is the imaginary part of the complex conjugate eigenvalues of u . Hence, the Rortex vector can be expressed as: R l = R l · r l .
Similar to the definition of Ω -criterion, Dong et al. [36] defined a normalized scalar Ω R , based on the Rortex vector. According to Zhao et al.’s derivation [27], it can be written as the following explicit equation:
Ω R = ω · r l 2 2 · ω · r l 2 + 2 λ c r 2 λ c i 2 + λ r 2 + ε
where λ c i and λ c r are the imaginary and real part of the complex conjugate eigenvalues of u . As the definition of Equation (21), ε here is calculated by the eigenvalues as: ε = b 0 · max 4 λ c i 2 3 λ c r 2 1.5 λ r 2 .

3. Computational Setup and Verification

3.1. Model Turbine and Numerical Method

As illustrated in Figure 1a, the diffuser-augmented horizontal-axis tidal stream turbine (DAHATT) consists of three components: rotor, diffuser, and support structure, represented here by green, dark orange, and blue, respectively. The model of turbine rotor is shown in Figure 1b. The diameter of the horizontal-axis three-bladed rotor is D = 0.2 m , and the depth of the flume is H = 0.8 m . According to the Froude similarity, the Froude number of the investigation is Fr = U 0 / g H = 0.143 . The bulk velocity U 0 is constant at 0.35 m / s with a 1:60 Froude scale, exemplifying a prototype turbine which has a rated power of 0.5 MW and an environmental incoming velocity of 3.1 m / s , consistent with our presented research [37].
The rotor follows a unique NREL S822 airfoil, with respect to rotor radius R, the chord (c), and pitch angle ( θ ) of the cross-section are indicated in Table 1. The model-scaled rotor achieves peak performance similar to the full-size turbine. The diameters of the nacelle and pile are 40 mm .
As a diffuser-augmented turbine, the tip clearance size ( ξ ) is constant at 2.5 % of the rotor diameter. The center of the diffuser support is located at 0.5 D from the rotor with a length of 42 mm . Table 2 provides the detailed specifications of the model turbine. As shown in Figure 1c, the diffuser is designed with a cubic B-spline curve, which is expressed in Equation (24):
h H o H i H o = 1 1 x m 2 · x / L 3 x / L x m 1 1 x m 2 · 1 x / L 3 x / L > x m
where L is the length of the tapering section, H i and H o are inlet and outlet radii of the diffuser, and h is the local radius with distance x from the diffuser inlet. x m is the inflection point position of the cubic B-spline curve. These parameters were determined as: L = 74.2 mm , H i = 135 mm , H o = 108 mm , and x m = 0 . To install the support structure, the diffuser has 75 mm straight section, which gives it a total length of L D = 139.2 mm .
The computations were performed using the Reynolds-Averaged Navier Stokes (RANS) model with the pimpleFoam solver of OpenFOAM. As a finite volume method based solver, pimpleFoam [38] combines the PISO [39,40] and SIMPLE [41,42] algorithms for solving N–S equations for transient incompressible Newtonian fluids. Owing to good convergence, the time and convective components are discretized with Euler and a limited linear scheme. The gradient term is discretized using a cell limited least squares method. To ensure convergence at each time step, there are a maximum of 50 corrections for the SIMPLE algorithm and a constant two iterations for the PISO loop. The time step of the calculation is set to 0.1 deg rotation angle of the rotor, which has a maximum Courant number Co < 40 . For this investigation, the rotational region is modeled with a fixed rotating speed relative to the stationary domain and SST k ω model is applied to resolve wake turbulence.

3.2. Domain and Boundary Conditions

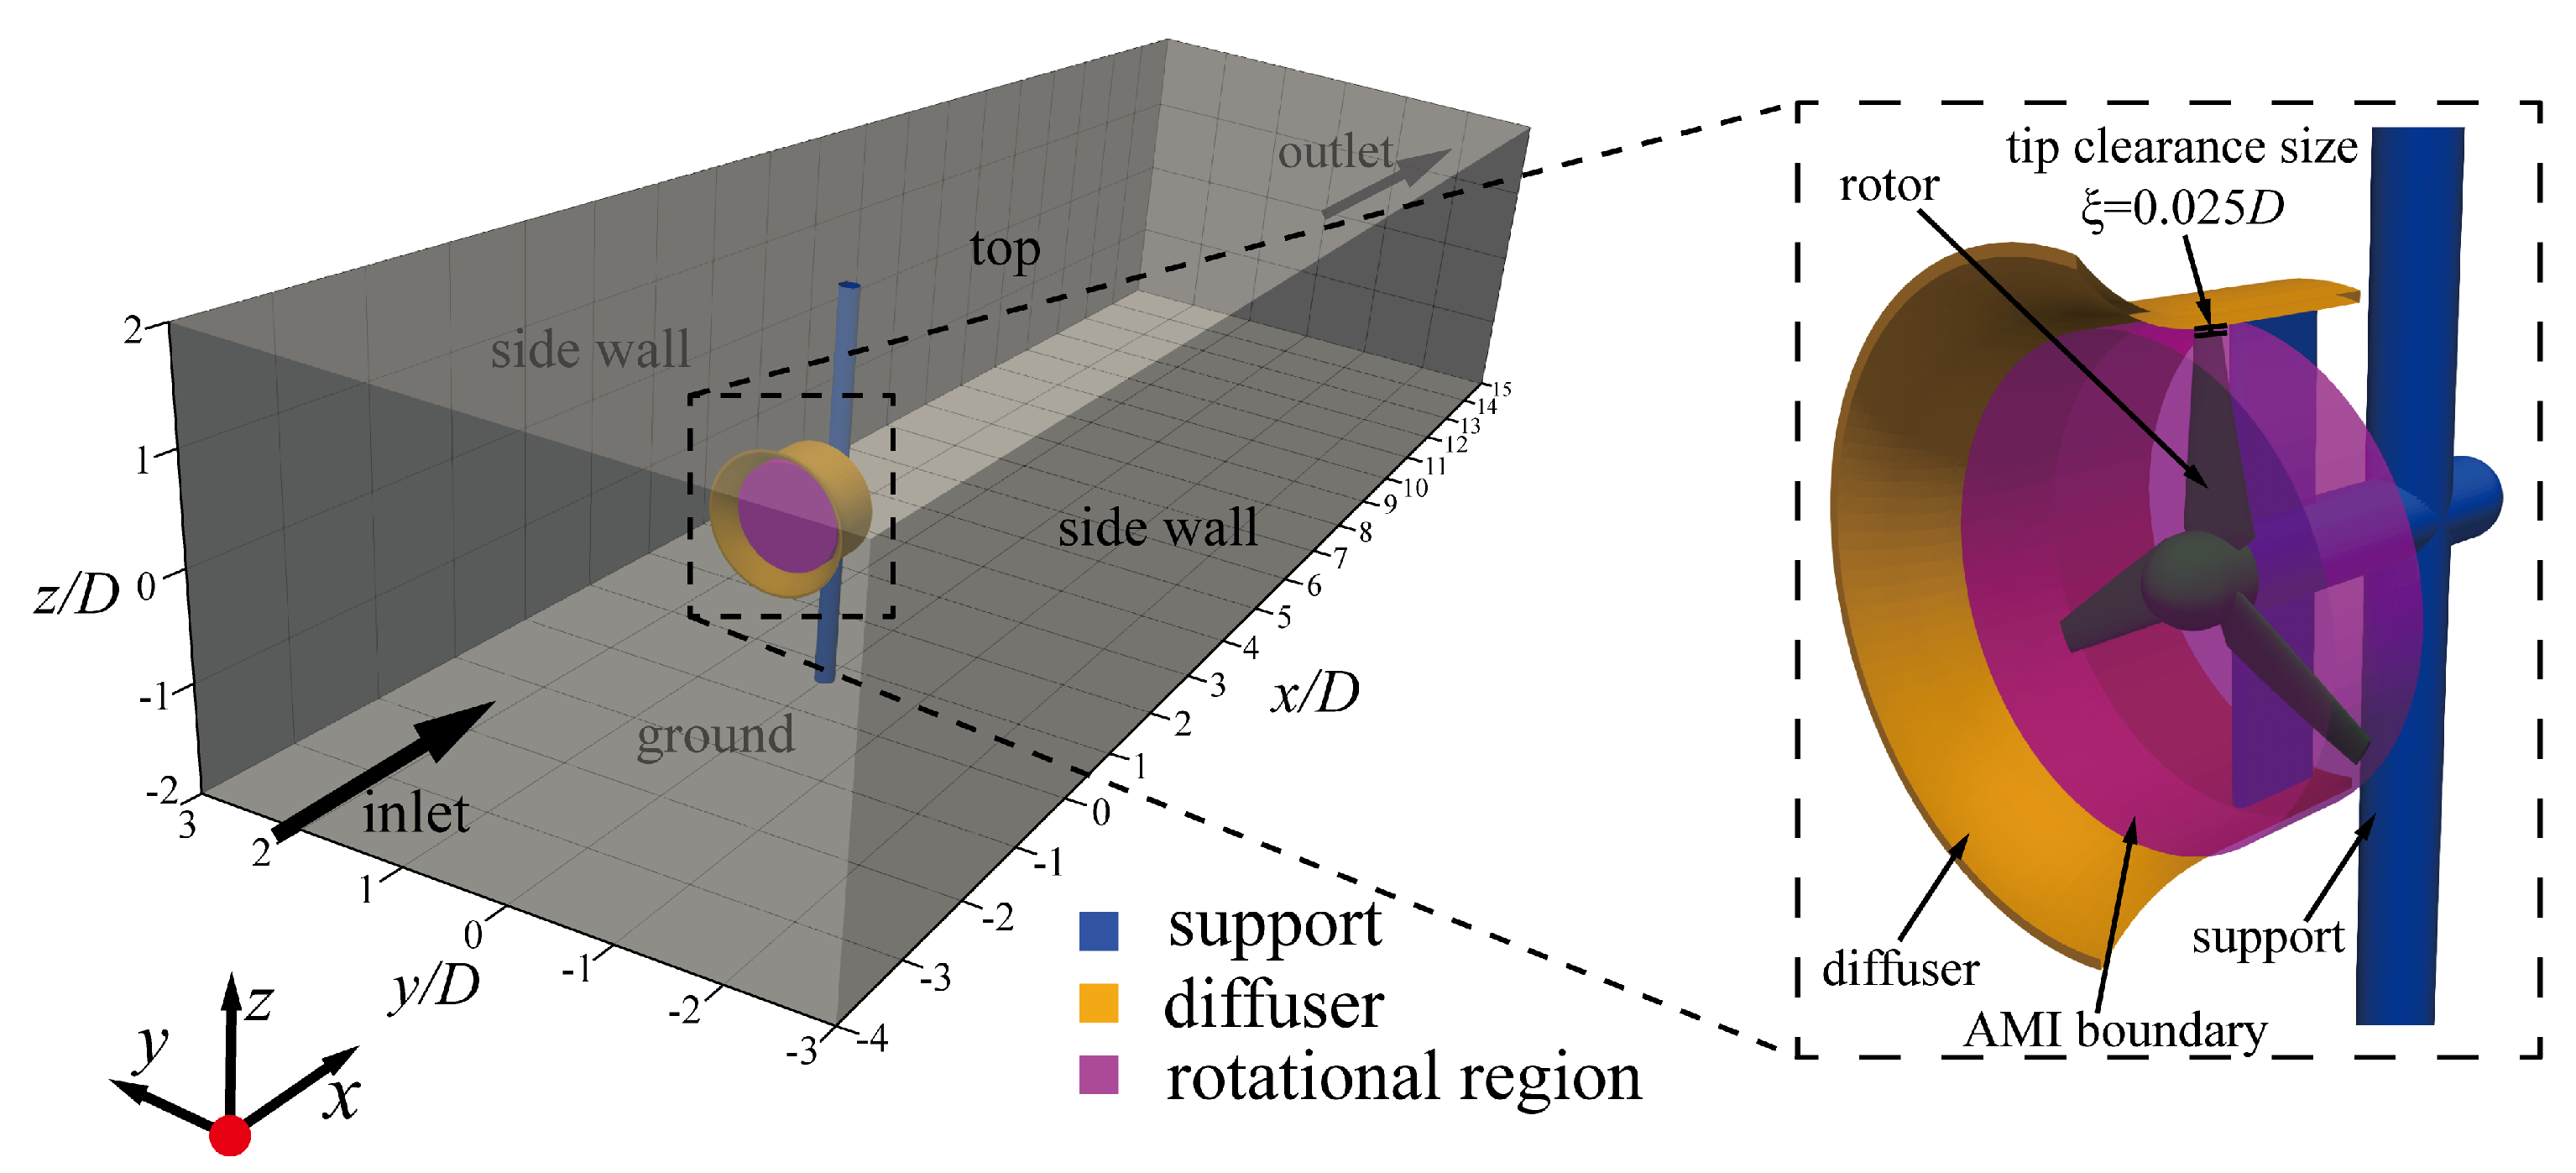
As illustrated in Figure 2, dimensions of the computational domain are 19 D × 6 D × 4 D , with 4 D from the upstream inlet and 15 D from the downstream outlet. The rotor center is set at half depth and mid plane of the computational volume which coincides with the origin of the coordinate. The computational volume can be split into two individual regions, a cylinder region containing the rotor called rotational region, and the other one including the static support and diffuser, which is called the background region. In our case, the field data are transmitted through the AMI interface of each region. To avoid possible numerical oscillation on the interface, the diameter of rotational region is set to 1.05 D .
The boundary conditions of the computational domain are presented in Table 3. The free surface patch (top) is set as a slip wall. The moving wall boundary is used for blade and hub surfaces, which is stationary relative to the rotational region. The rotational speed of the rotor ω r is varied from 8.75 rad / s to 17.5 rad / s corresponding to tip–speed ratio ( TSR = ω r R / U 0 ) from 2.5 to 5.0 .
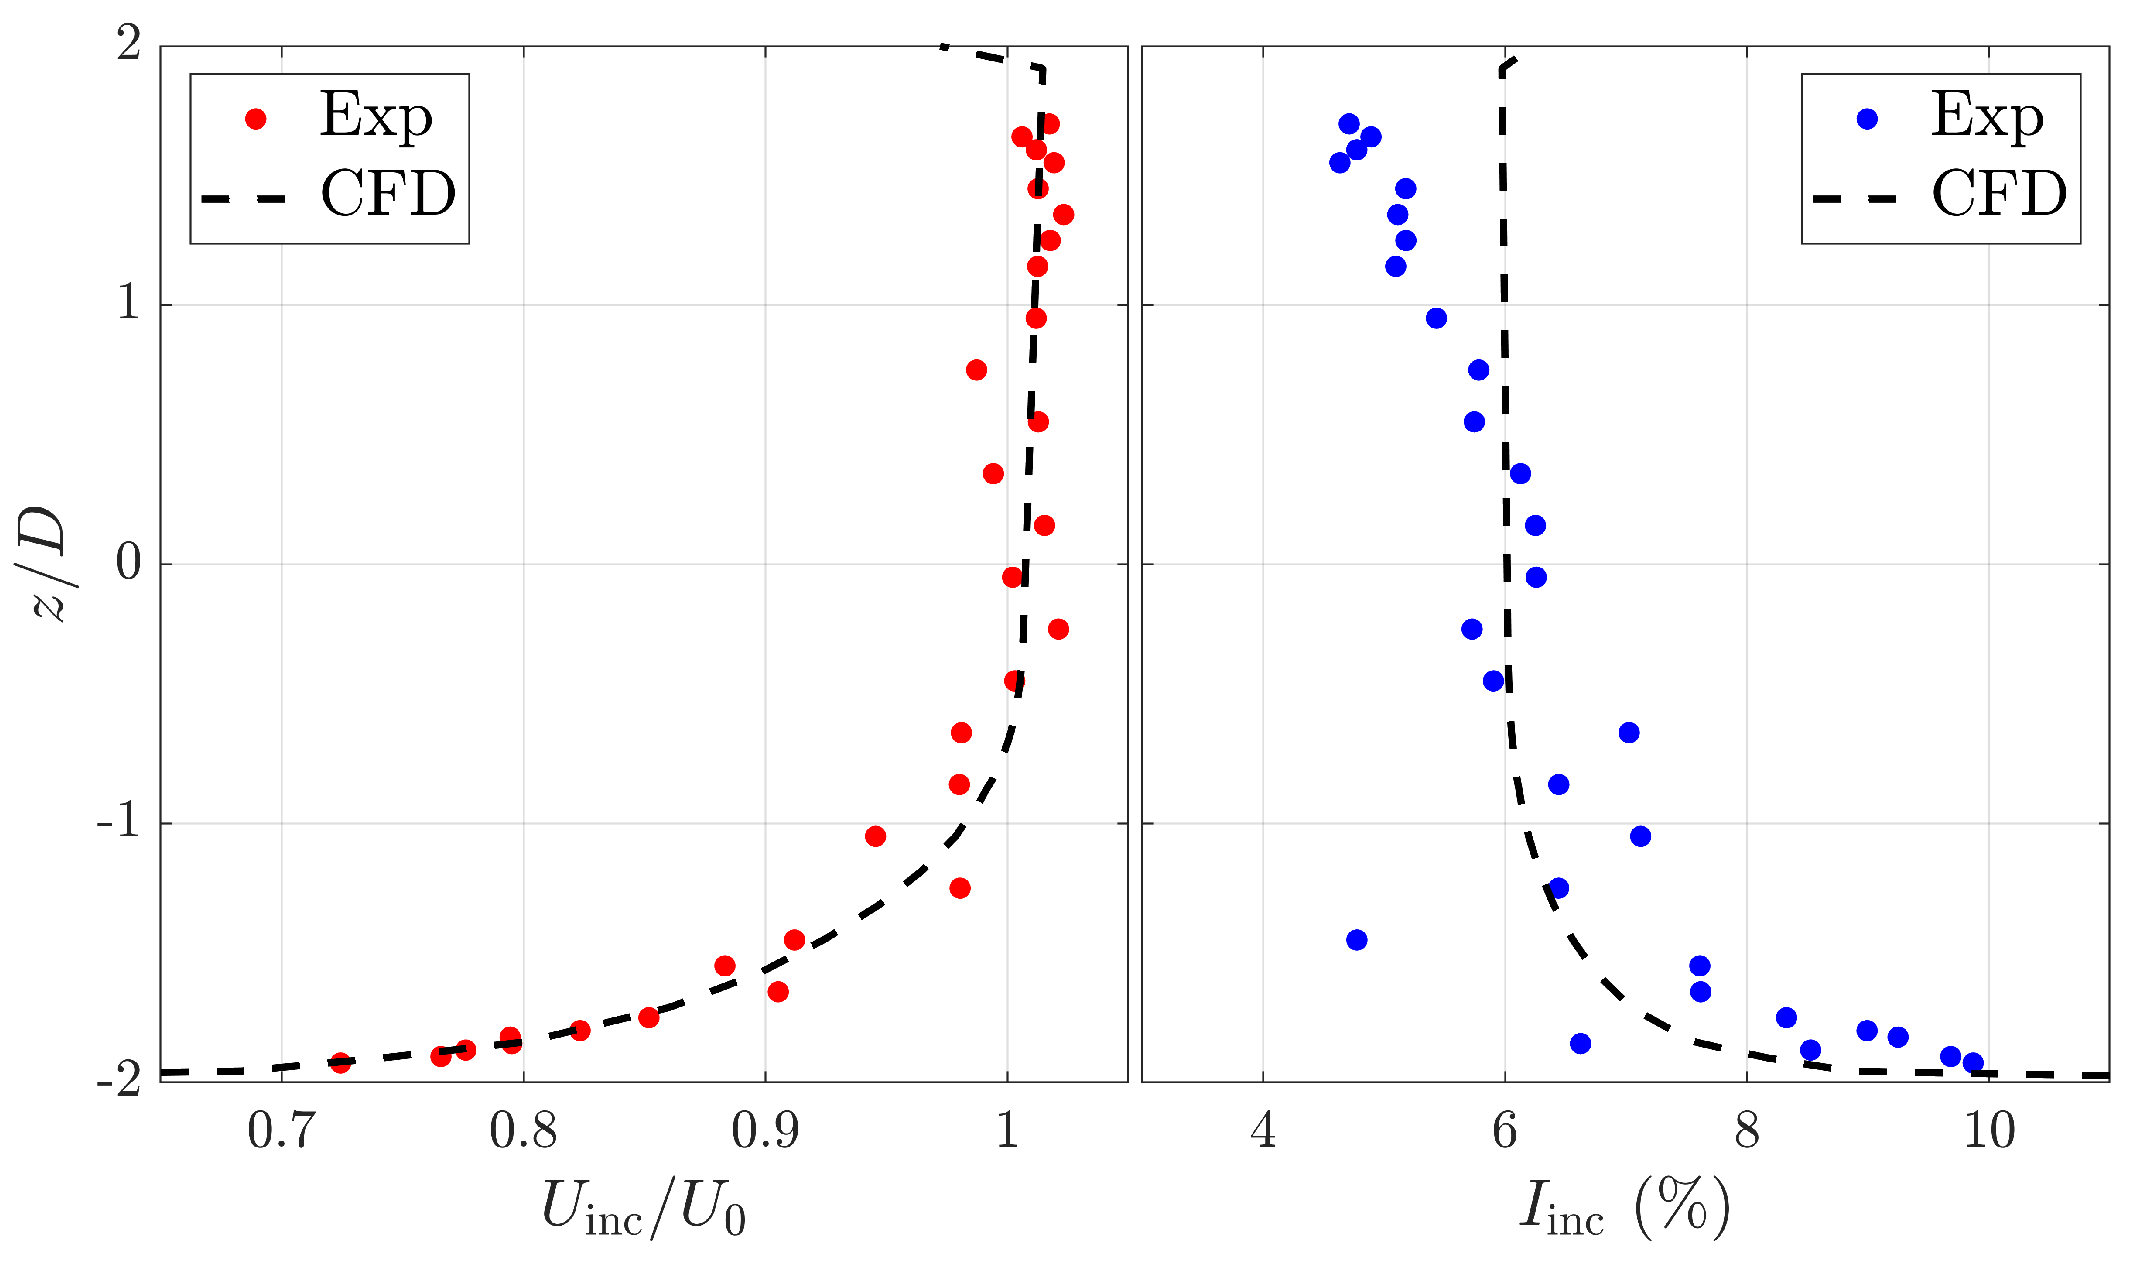
The environmental turbulence intensity ( I ) approximates 6 % . The depth-variation inflow velocity ( U inc ) follows the logarithmic law near the ground and gradually transitions to a linear distribution as the bottom distance ( d = z + 2 D ) increases. With a velocity-based inlet boundary condition, the velocity varies according to Equation (25), whereas at inlet and outlet, the relative atmospheric pressure is set to zero.
U inc = u * · 1 κ ln u * d ν + 5.0 d 0.45 D 1.6506 · d 3 1.8122 · d 2 + 0.6684 · d + 0.2696 0.45 D < d < 1.75 D 0.0065 · d + 0.3500 d 1.75 D
where u * = 0.01411 m / s denotes the estimation of friction velocity, and κ = 0.41 is the von Kármán constant. Figure 3 presents the velocity and turbulence intensity profiles along the vertical direction at x = y = 0 without the turbine installed. Here, the turbulence intensity refers to as the turbulence level. For RANS simulation, it can be defined as:
I = u ¯ U = 2 / 3 · k U
where k = 0.5 · u i 2 is the turbulent kinetic energy, and U = U i 2 is the magnitude of the local velocity vector.

3.3. Mesh and Its Independence Assessment

The hexahedral-dominated mesh of the investigation is generated by ANSYS ICEM with a maximum wall y + 16 of the rotation region. Figure 4 illustrates the overall and magnified computational mesh. The layered-grid near the rotor surface is produced to improve the overall quality of the grid with a maximum height of 0.5 mm and growth rate of 1.07 . Mixed mesh of prisms and hexahedra are used near the nose of the rotor hub. With 1.3 million grids in the rotation region and 6.1 million grids of the flume, the total number of grids is approximately 7.4 million.
A grid-independence test was performed to reduce the requirement computing resource requirements. As mentioned in Table 4, the grid number ranges from 2.9 to 11.3 million. The computations were conducted by two AMD EPYC workstations, and the end time of calculation is one rotor rotation cycle. Results indicate that, when the number of grids is ’Medium’, fewer computational resources are used with the relative error of mean power coefficient less than 1 % .

4. Results and Discussion

4.1. Performance Validation

The hydrodynamic performance of diffuser-augmented tidal stream turbine can be defined as a normalized power coefficient C P that varies with the tip–speed ratio ( TSR ) as:
C p = M ω r 0.5 ρ A U 0 3
where M is the torque of all rotation surfaces, and A = π R 2 , the swept area of the rotor.
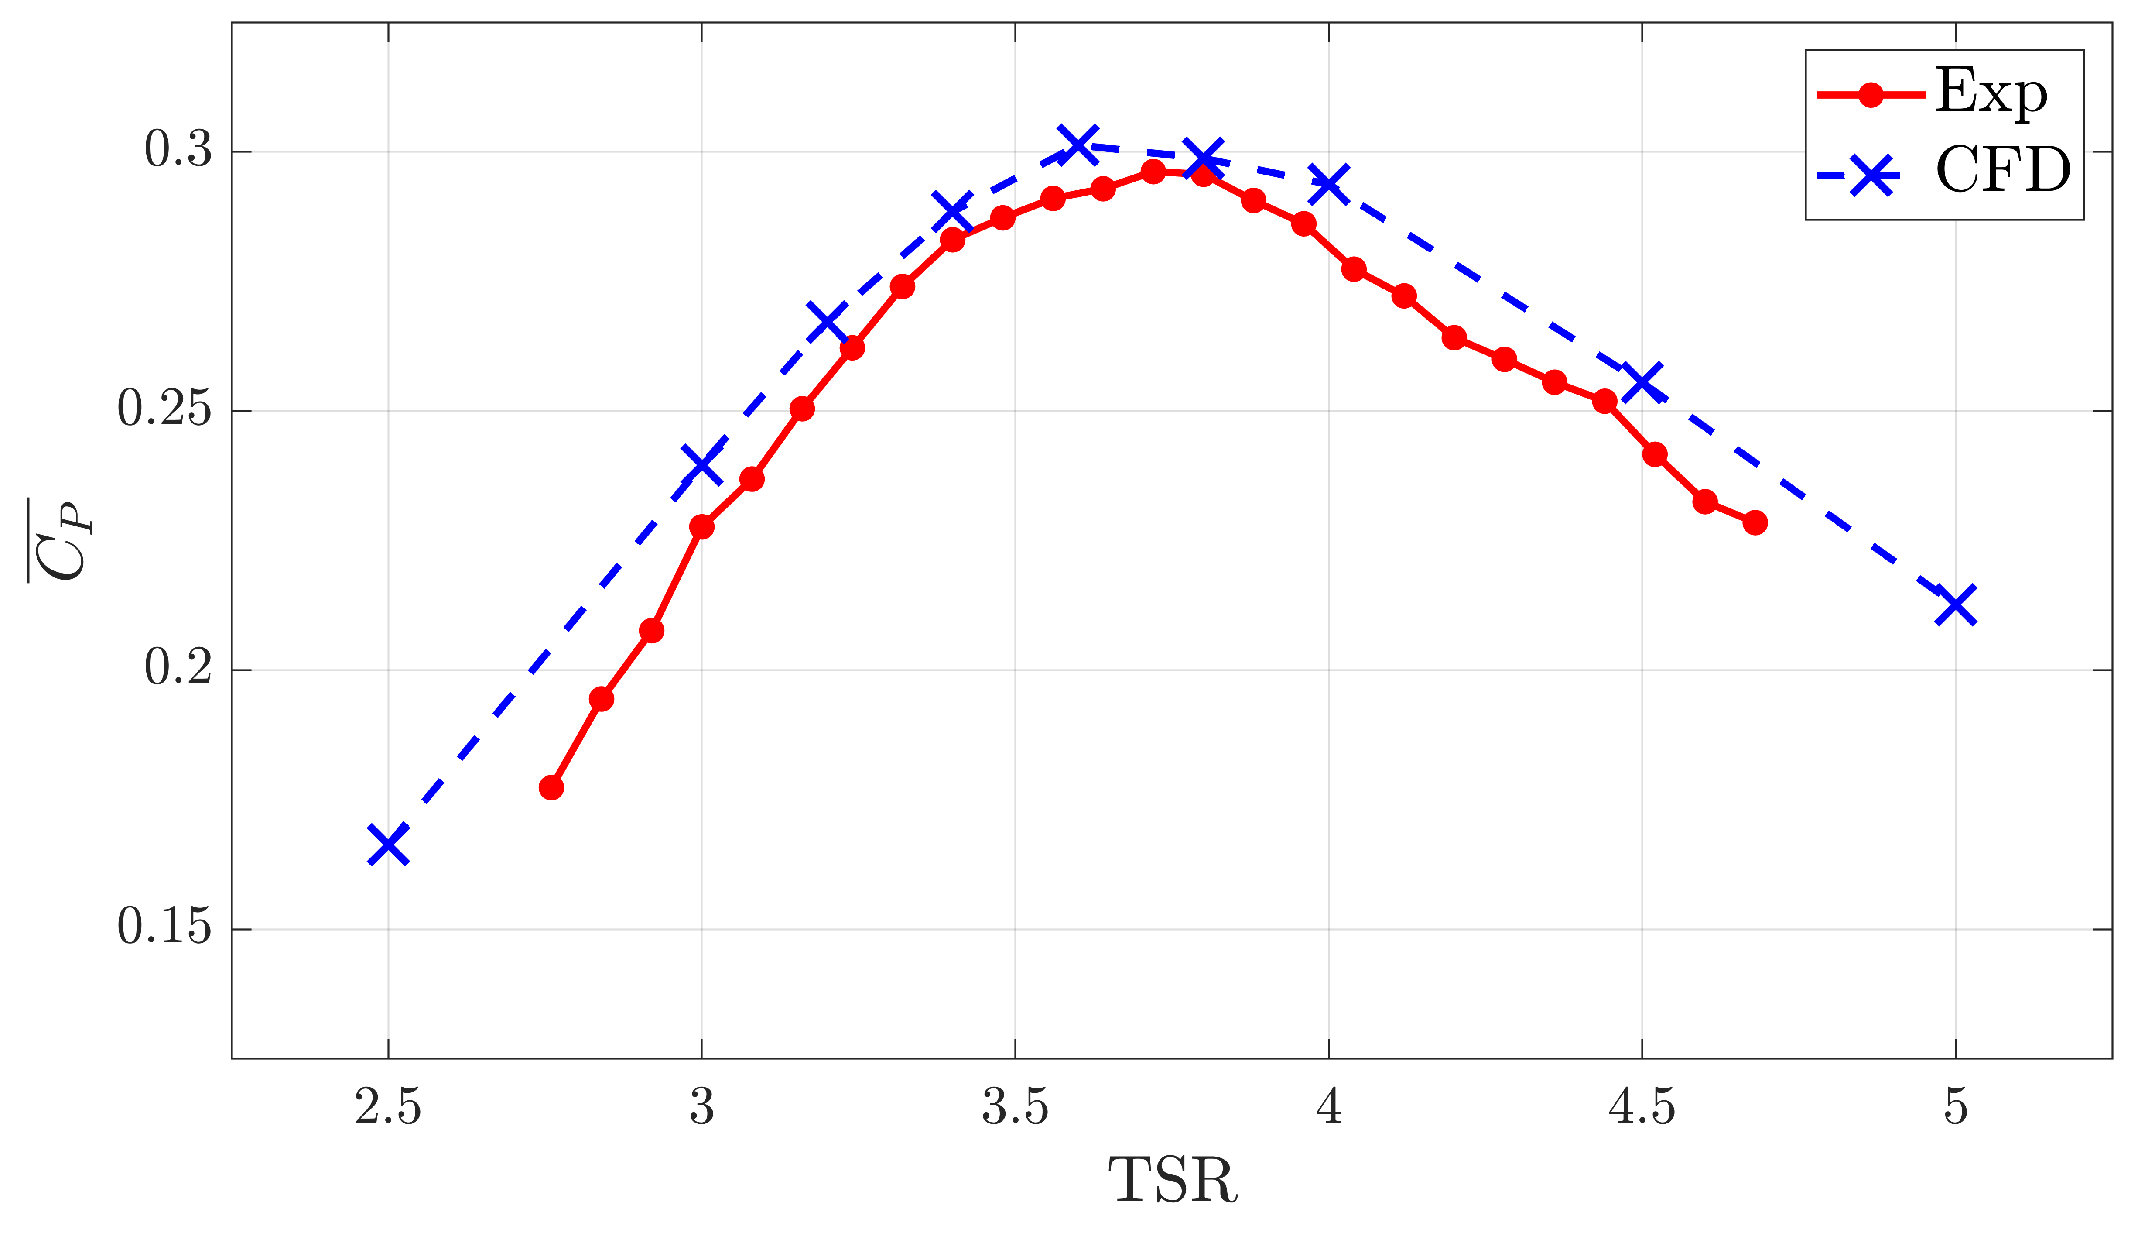
To validate the accuracy of the numerical method, the results are compared with experimental results, which are shown in Figure 5. The power coefficients follow an inverted u-shape curve with maximum C p = 0.296 at TSR 3.72 for the experiment, whilst peak C p = 0.301 at TSR 3.6 for CFD investigation. At the range of TSR = 3.4 3.8 , numerical and experimental curves experience a good agreement, whereas, it deviates more when the tip–speed ratio is out of the range. The relative error is less than 3 % for the contemplated study range, while the maximum value occurs at TSR = 2.76 . Eventually, the result provides confidence in the ability of the numerical simulation to accurately replicate hydrodynamic experimental investigation.

4.2. Near Wake Structure

4.2.1. Mean Velocity Deficit

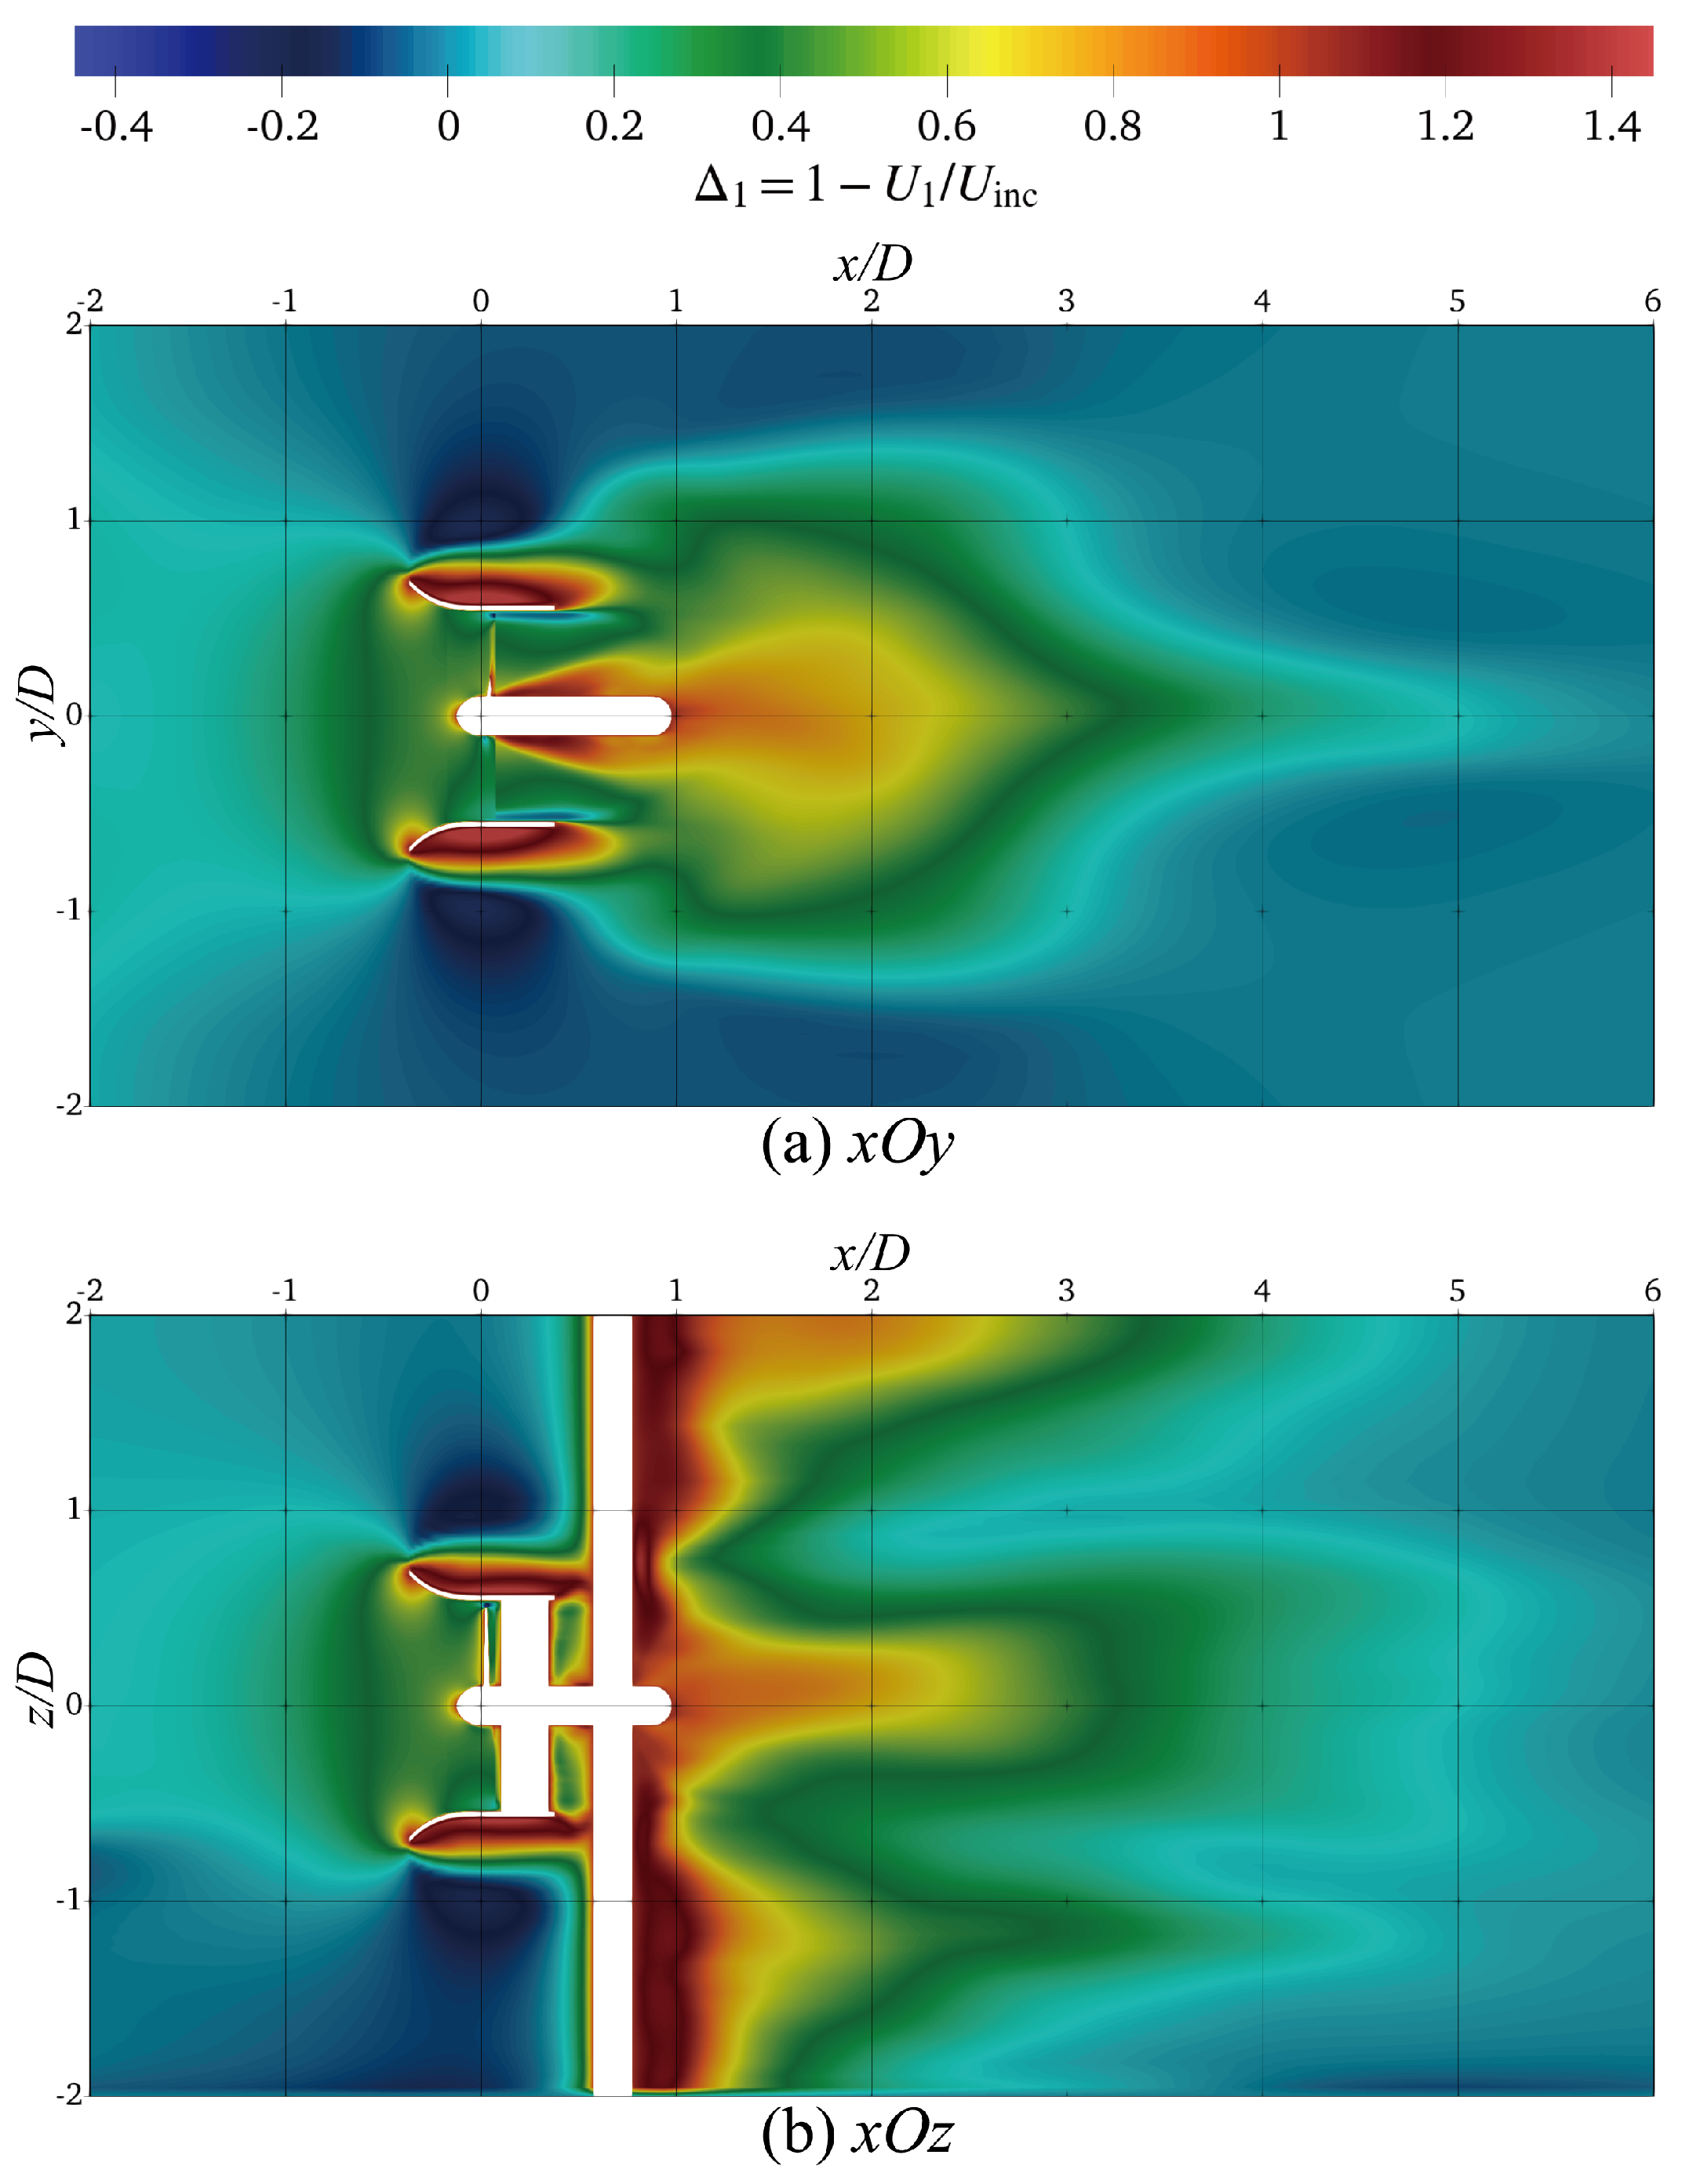
As defined as Δ 1 = 1 U 1 / U inc , the velocity deficit represents the change of time-averaged longitudinal velocity ( U 1 ) relative to the incoming velocity ( U inc ) from Equation (25). Figure 6 is the contour map of transverse ( x O y ) and the vertical ( x O z ) plane.
Over the mid-depth plane (see Figure 6a), maximum deficit ( Δ 1 1.4 ) occurs after the outer edge of the diffuser ( y / D = 0.675 ), where the reverse flow is found. In order to compensate for the rapid momentum dissipation, an increment of velocity is observed in the region of y / D = 0.8 1.2 , which presents a sharply velocity acceleration ( Δ 1 < 0 ). However, this accelerated portion does not extend more than 3 D downstream. The flow separation that occurs within this area is caused by the momentum losses induced by the diffuser inlet. As mentioned in Cresswell et al.’s research [6], owing to the tip gap jet generated by the inside wall of the diffuser, the velocity deficit remains low in a narrow region bypassing the rotor. The second large deficit zone is noticeable between rotor and the support, where an increment of the local velocity appears. This is caused by less energy losses induced by the root of the blades. Over the region of 1 x / D 6 , sub-figure (a) indicates the maximum deficit (≈0.95) at the closest center point ( x / D = 1 , y = 0 ). Overall, the wake exhibits a tadpole-shape with a width covering three rotor diameter and the inner core behind the support at the transverse plane. Furthermore, 5.5 D downstream, the time-averaged deficit is almost constant at 10 % , which reveals that it has a significantly momentum dissipation in the near wake region ( x / D 4 ).
As plotted in Figure 6b, the cloud map of the vertical velocity deficit indicates similar behavior to the transverse distribution outside of the diffuser. Due to the significant effect of the robust support, it is noticeable that the wake region with maximum Δ 1 1.3 is existing close to the support. The vertical profiles of Δ 1 exhibit a triple peak distribution in the near wake. Among z / D 1.5 , the peak tilts up towards the water surface. Before the 2 D section, the velocity deficit is slightly influenced by the bed shear layer. Owing to the combined effect of wake swirling and support shadow, the magnitude of middle plateau is lower than the other, but still remains until 5 D downstream.

4.2.2. Turbulence Characteristics

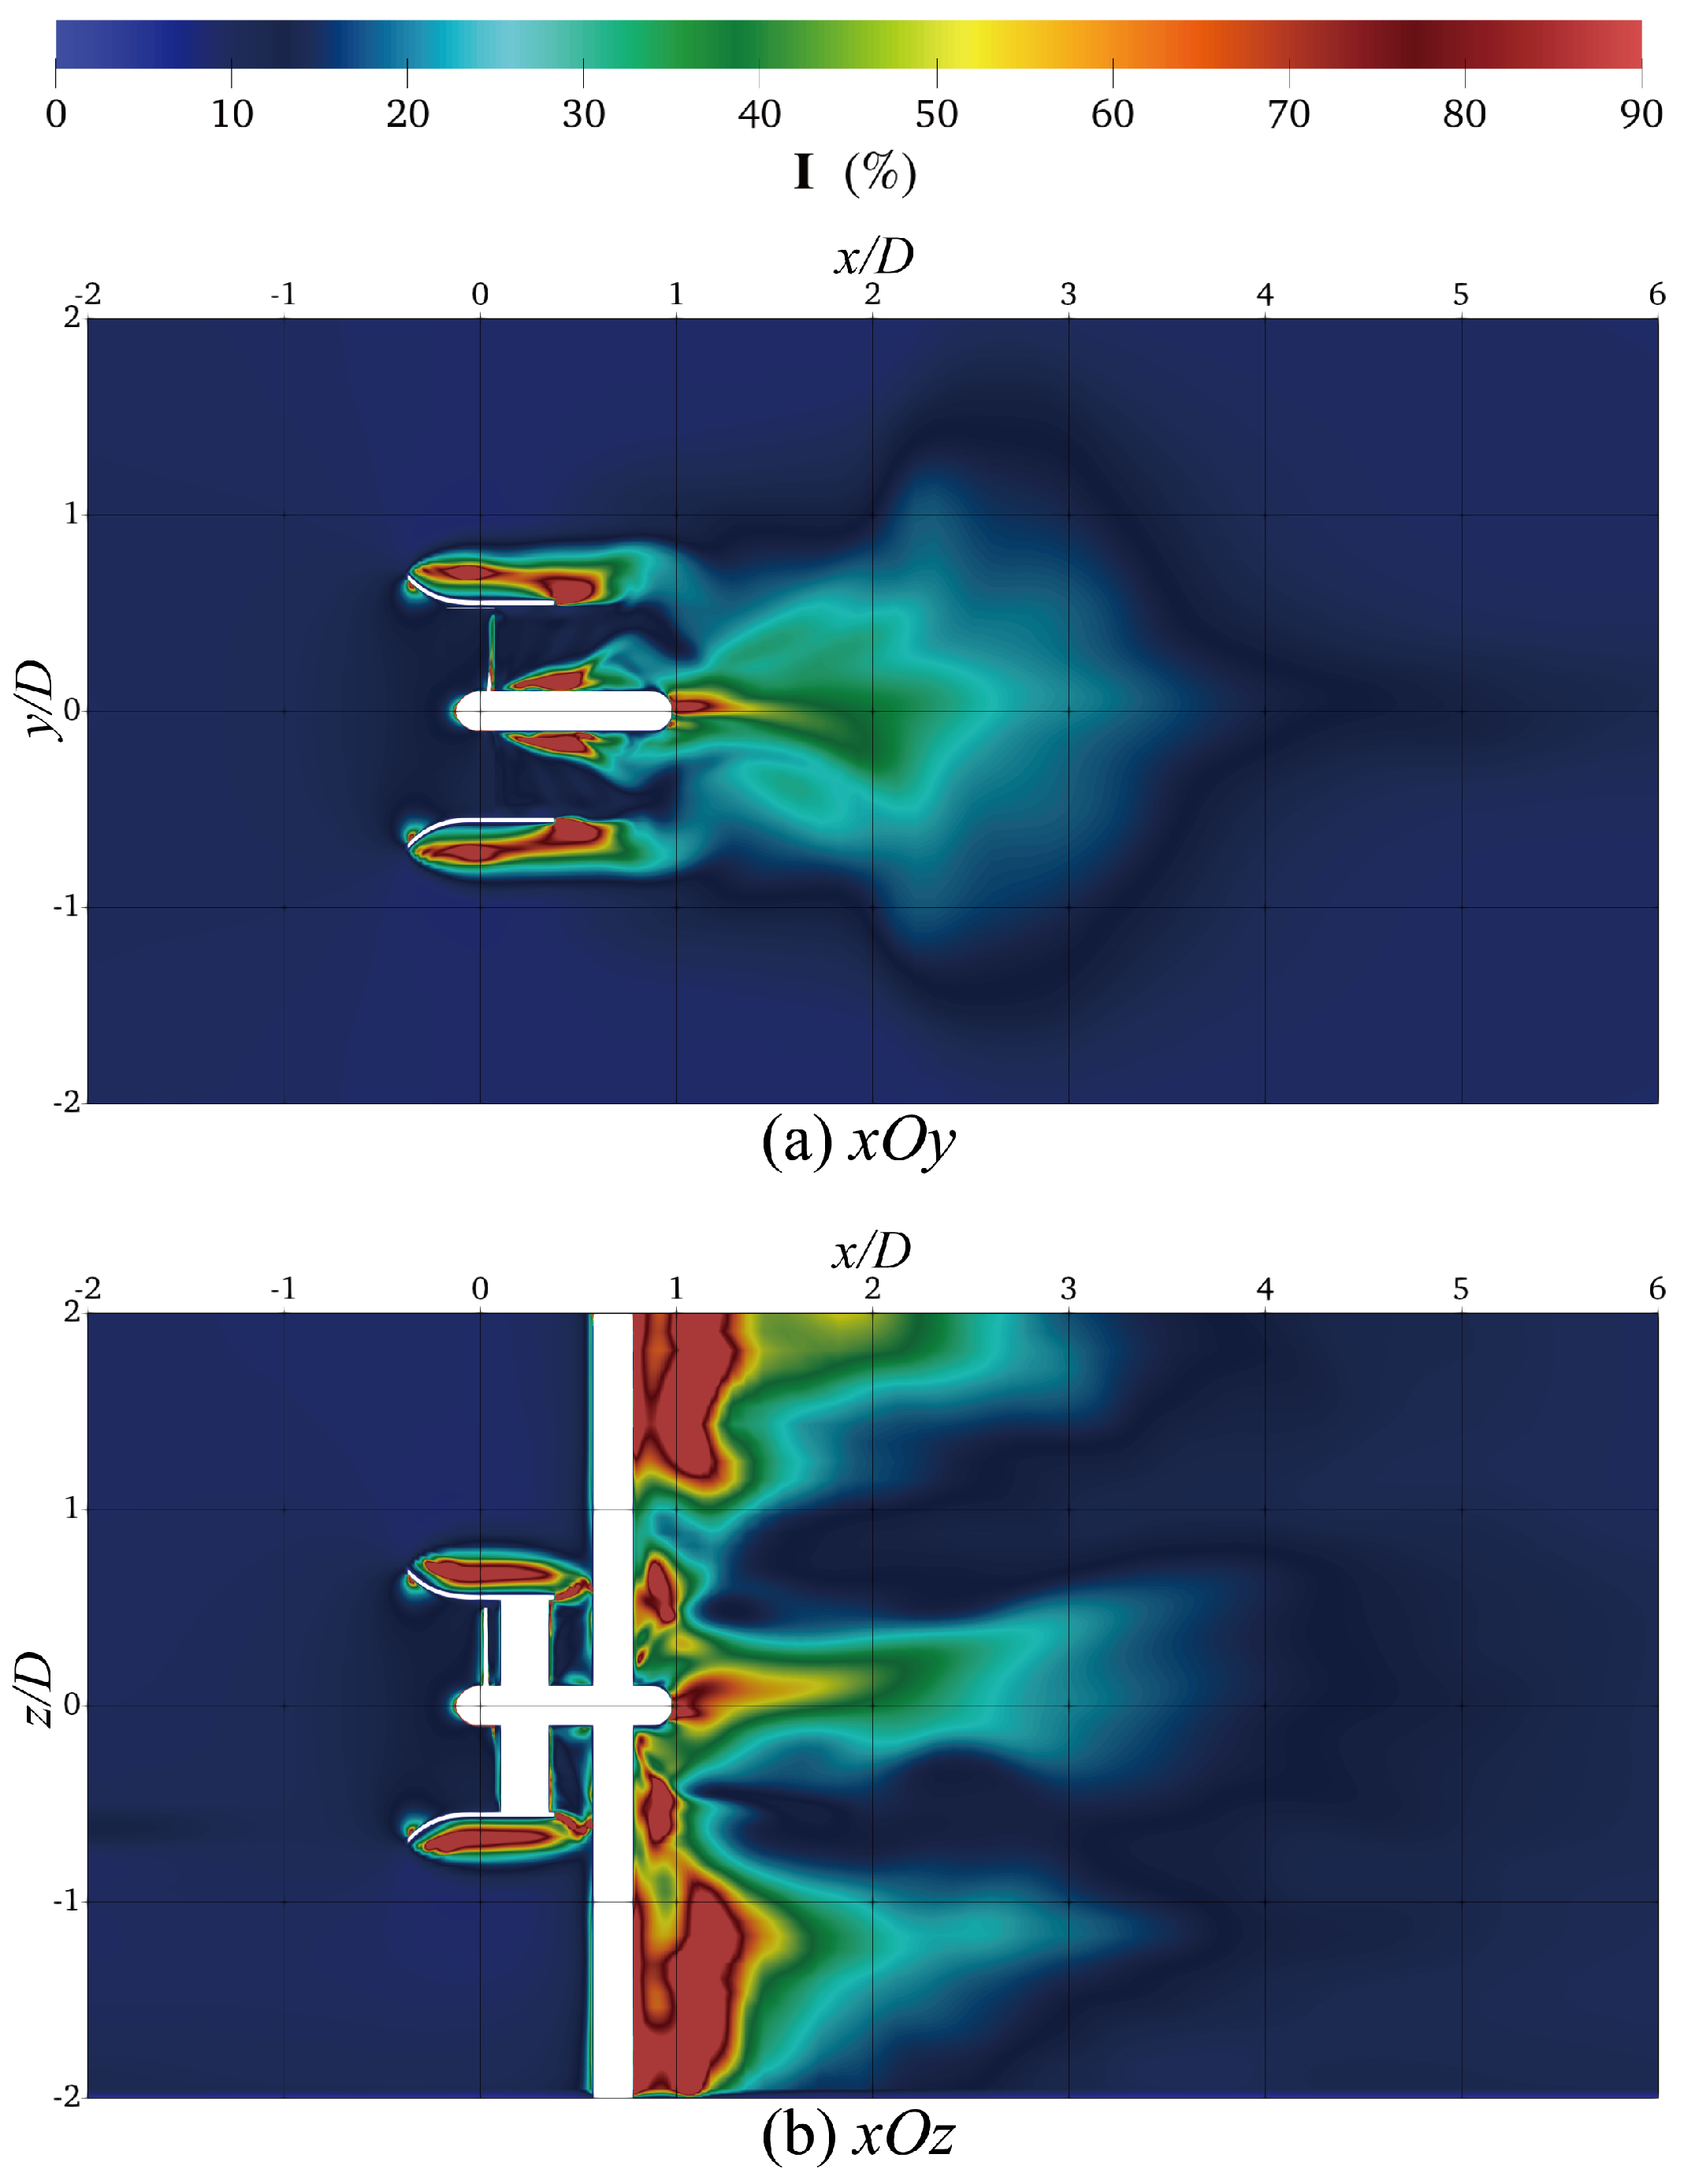
Figure 7 illustrates the contour of total turbulence intensities (Equation (26)) of the diffuser-augmented turbine. According to this figure, the high turbulence regions are close to the position behind the diffuser inlet, blade root, and support structures.
Similar to the maximum velocity gradient locations mentioned in Figure 6, the distributions of turbulence intensity, which are illustrated in Figure 7a, are almost symmetrical with respect to the rotor centerline on the horizontal plane. Among the range of x / D = 0.3 0.7 , there are three high turbulence plateaus which the turbulence intensity I > 90 % : mid plateau after the rotor hub; top and bottom plateaus outside the diffuser. Inside the diffuser, a low-turbulence core exists due to the bypass flow through rotor tip clearance. In the near wake region, the maximum turbulence intensity occurs at x / D 1 near the centerline and its U 0 ; thus, I 100 % . Three high turbulence plateaus are mixed in the range of 1.5 2 D . Further downstream, the turbulence intensity exponentially reduced and converged to around 6 % after a 4.5 D section.
On the other hand, the turbulent flow is slightly asymmetrical to the centerline on the vertical plane (Figure 7b). Similar to its distributions on the horizontal plane, turbulence intensities experience two high value zones above and below the diffuser. In the wake region, the turbulence intensity is higher behind the supporting pile due to the blockage effect. The enhancement occurs especially in the zones close to the free surface ( z / D > 1.2 ) and sea bed ( z / D < 1 ). As a similar phenomenon to the mean wake deficit, the centerline of turbulent flow tilts up towards the water surface, and it expands in a convex upward shape with the focal point at the rotor center. In the presence of the diffuser, the turbulence intensity in the near wake region is increasing, and the higher values are located close to the rotor tips and the free surface.

4.3. Entropy Production

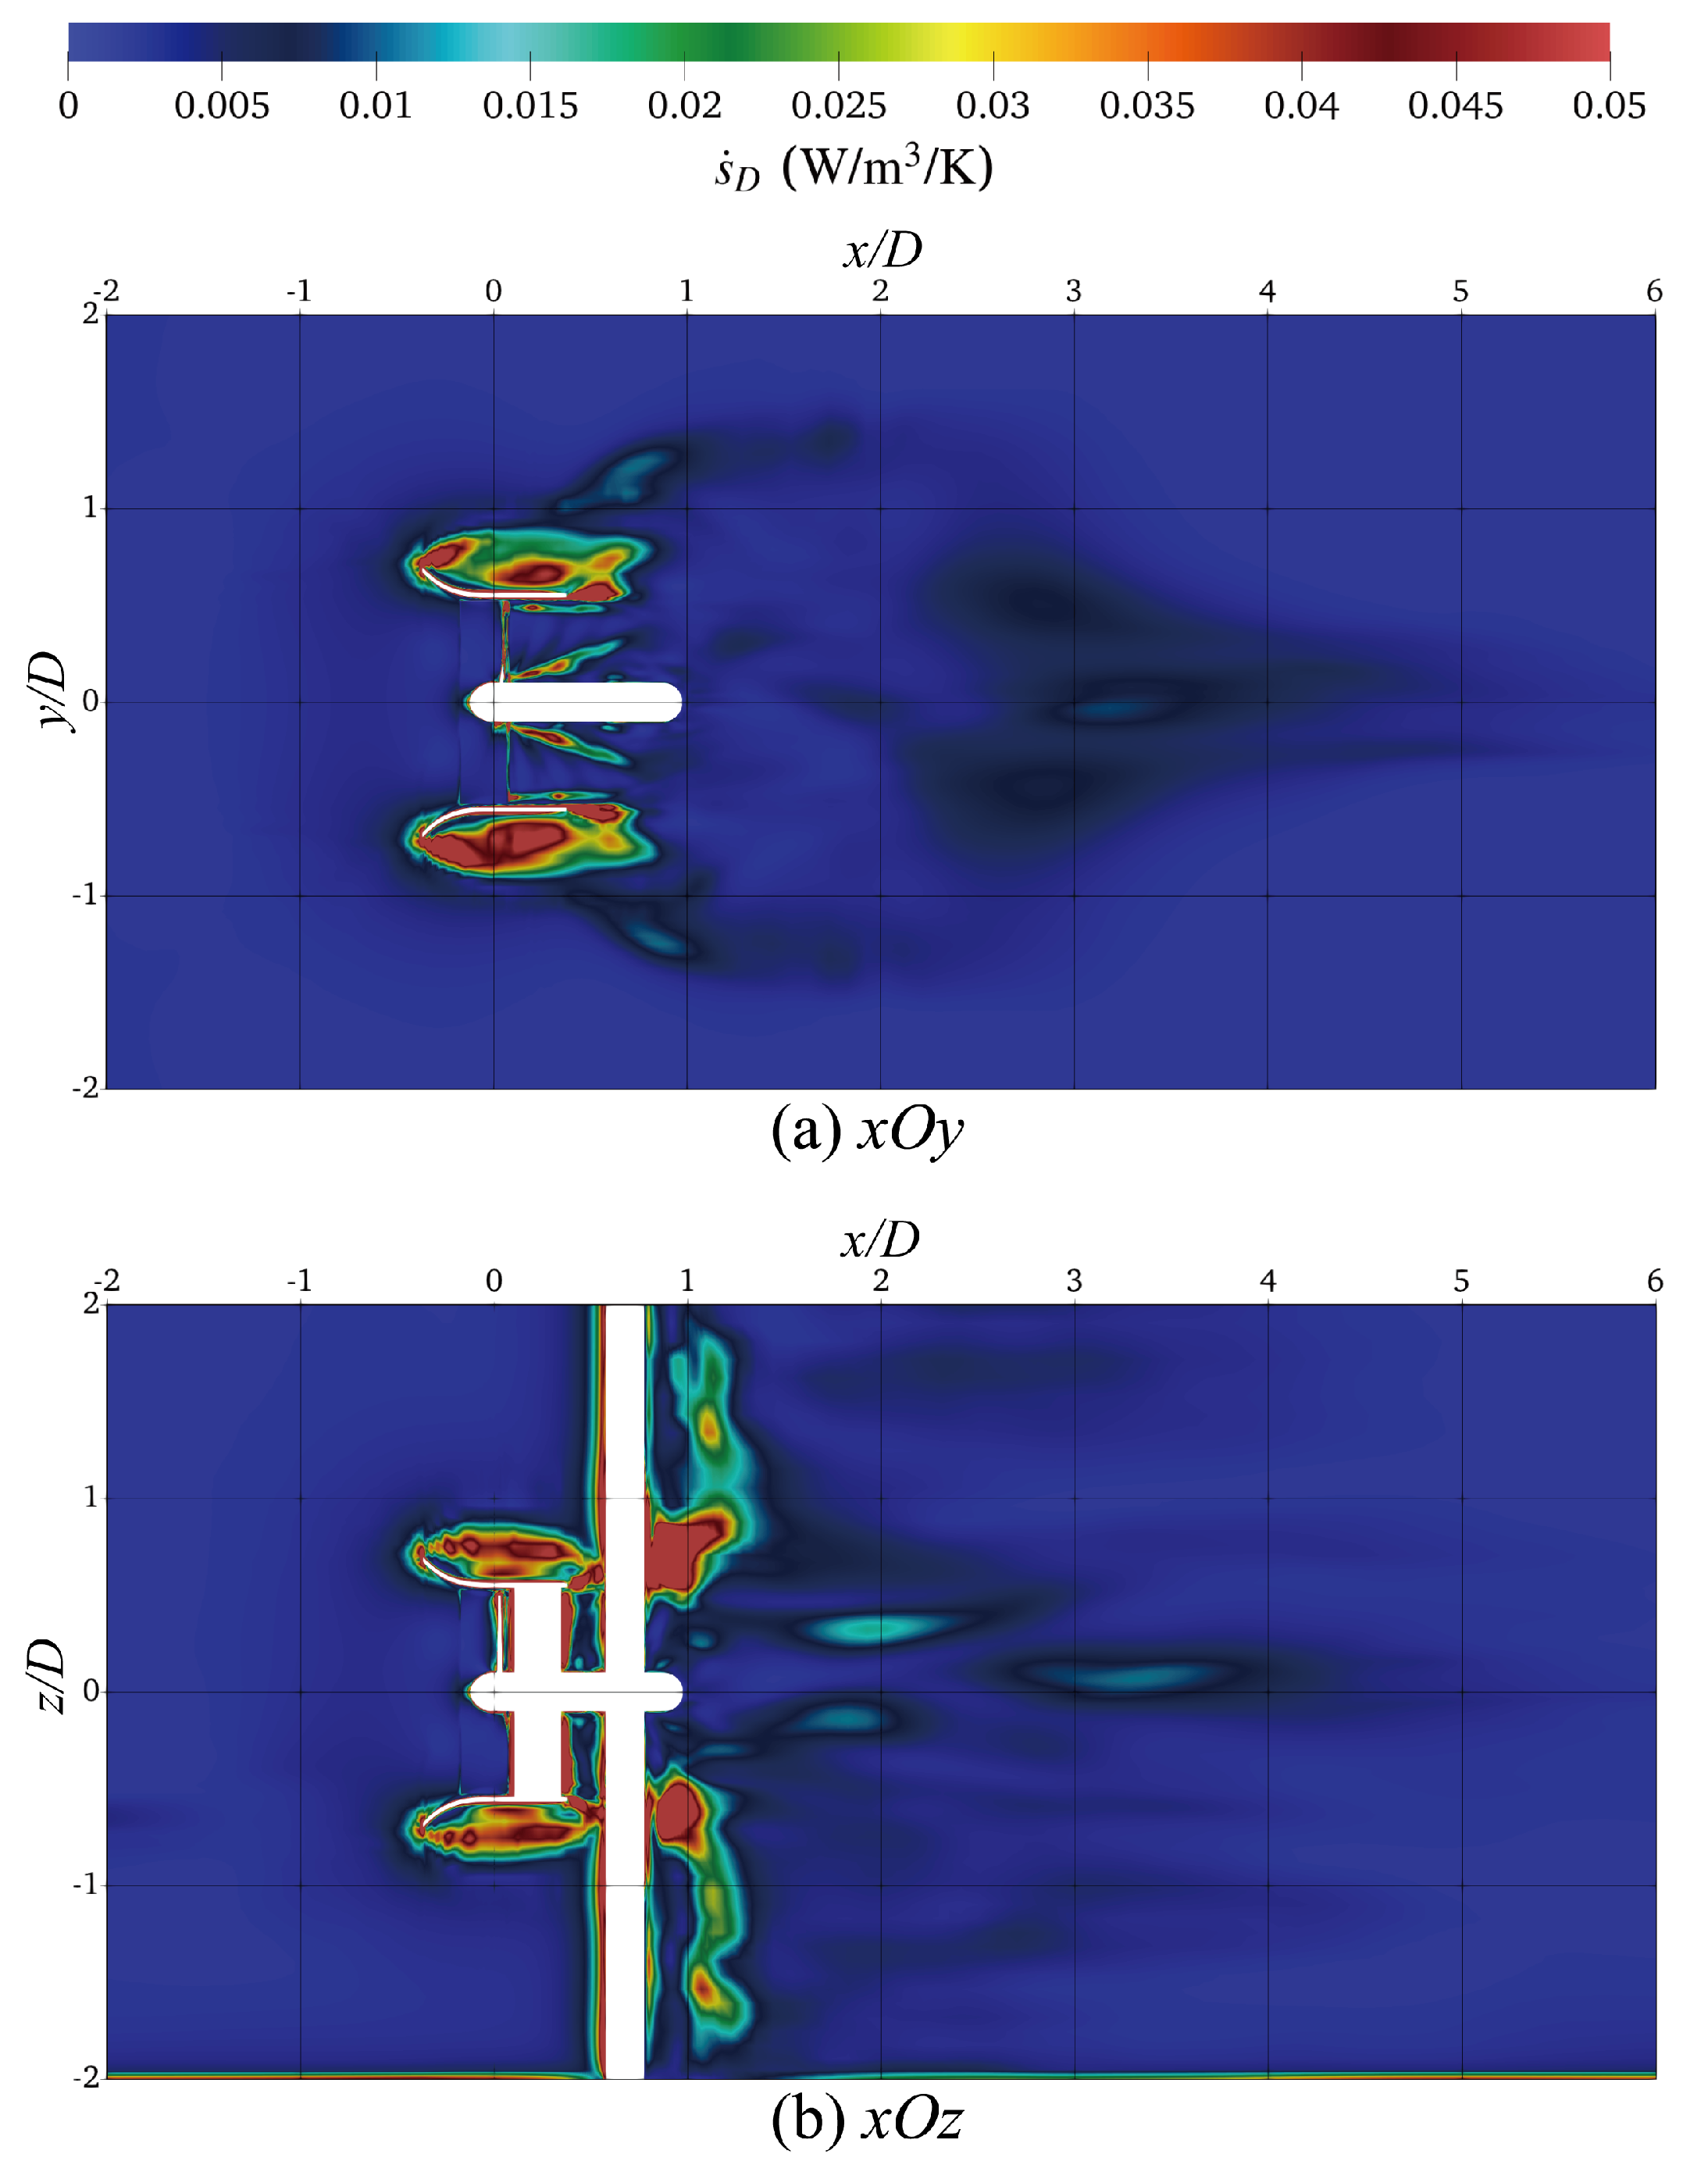
Figure 8 depicts the entropy production rate distribution (Equation (18)) with TSR = 3.6 . As a result of flow separation behind the diffuser inlet, it can be observed that higher s ˙ D is revealed at x / D = 0.3 0.7 outside the diffuser, across horizontal plane ( x O y ). Moreover, a high entropy production rate region exists behind the blade tip and hub of the turbine. This is because of the appearance of the blade vortex, which is generated by the pressure difference of blade surfaces. However, because of the vortex breakup caused by the support structure, the entropy production rate experiences a rapid dissipation before the turbulent flow enters the wake region. Due to a certain flow separation at the outlet of the diffuser, a part of the vortex falls off from the trailing edge of the duct and propagates downstream, and the outlet of the diffuser is also a region of a high entropy production rate. Owing to the large range of flow separation, most of the entropy is produced behind diffuser surfaces, which contributes to the main entropy production. Moreover, the intensity of entropy production rate in the near wake region continues to propagate downstream, but it converges to s ˙ D < 0.015 ( W / m 3 / K ) .
As shown in Figure 8b, the entropy production rate presents continuous high s ˙ D regions around the diffuser across vertical plane ( x O z ). These regions are highly consistent with the high turbulence regions that are illustrated in Figure 7b. With the presence of the diffuser, two extremely large zones ( s ˙ D > 0.1 ) appear behind the support structure at z / D = 0.4 0.9 and z / D = 0.8 0.5 . Due to the diffusion of turbulence viscosity, the distribution of entropy production rate is depicted as deflecting towards the free surface and bottom of the flume at 1 D downstream. Furthermore, as the wake develops, the entropy production presents a discontinuous characteristic with s ˙ D 0.015 , and slowly tilts up towards the free surface similar to the distribution of turbulence intensities.
Figure 9 shows the distribution of the entropy production rate at different longitudinal sections that y / D and z / D 0.7 . Sub-figure (a) is the 30 mm upstream section from the origin; (b) is the rotor plane ( x = 0 ); (c)–(e) are the specific sections inside the diffuser; (f) is the mid-section between the outlet of the diffuser and support pile; (g) is the immediately downstream plane ( x / D = 1 ) in the near wake region. It can be seen from Figure 9b,c that the energy loss of the turbulent flow is concentrated in the area attached to the rotor surfaces and especially near the tip clearance and presents anticlockwise characteristics, which is the same as the rotation direction. As illustrated in Figure 9d,e, it is obvious that the dissipation of s ˙ D is evident in the tip clearance. The radius of the center of blade-roots energy loss is gradually increasing along x / D = 0.1 0.6 . Note that, in sub-figure (f), the large magnitude of the entropy production rate is concentrated on the outlet of the diffuser and four corners, which means lower effective viscosity ( ν eff ) along horizontal and vertical directions. This phenomenon is caused by the rear support pile and nacelle, which hinders the spread of the vortex in a certain direction.
The wake structure of the diffuser-augmented turbine shows a rapidly dissipation tendency, and it can be separated into two high entropy rate regions in the near wake. Meanwhile, it can be clearly seen that the morphology of the high intensity region of s ˙ D changes from 0.15 D to 1.0 D , which relates to the diffuser and support structures of the turbine.

4.4. Vortex Identification

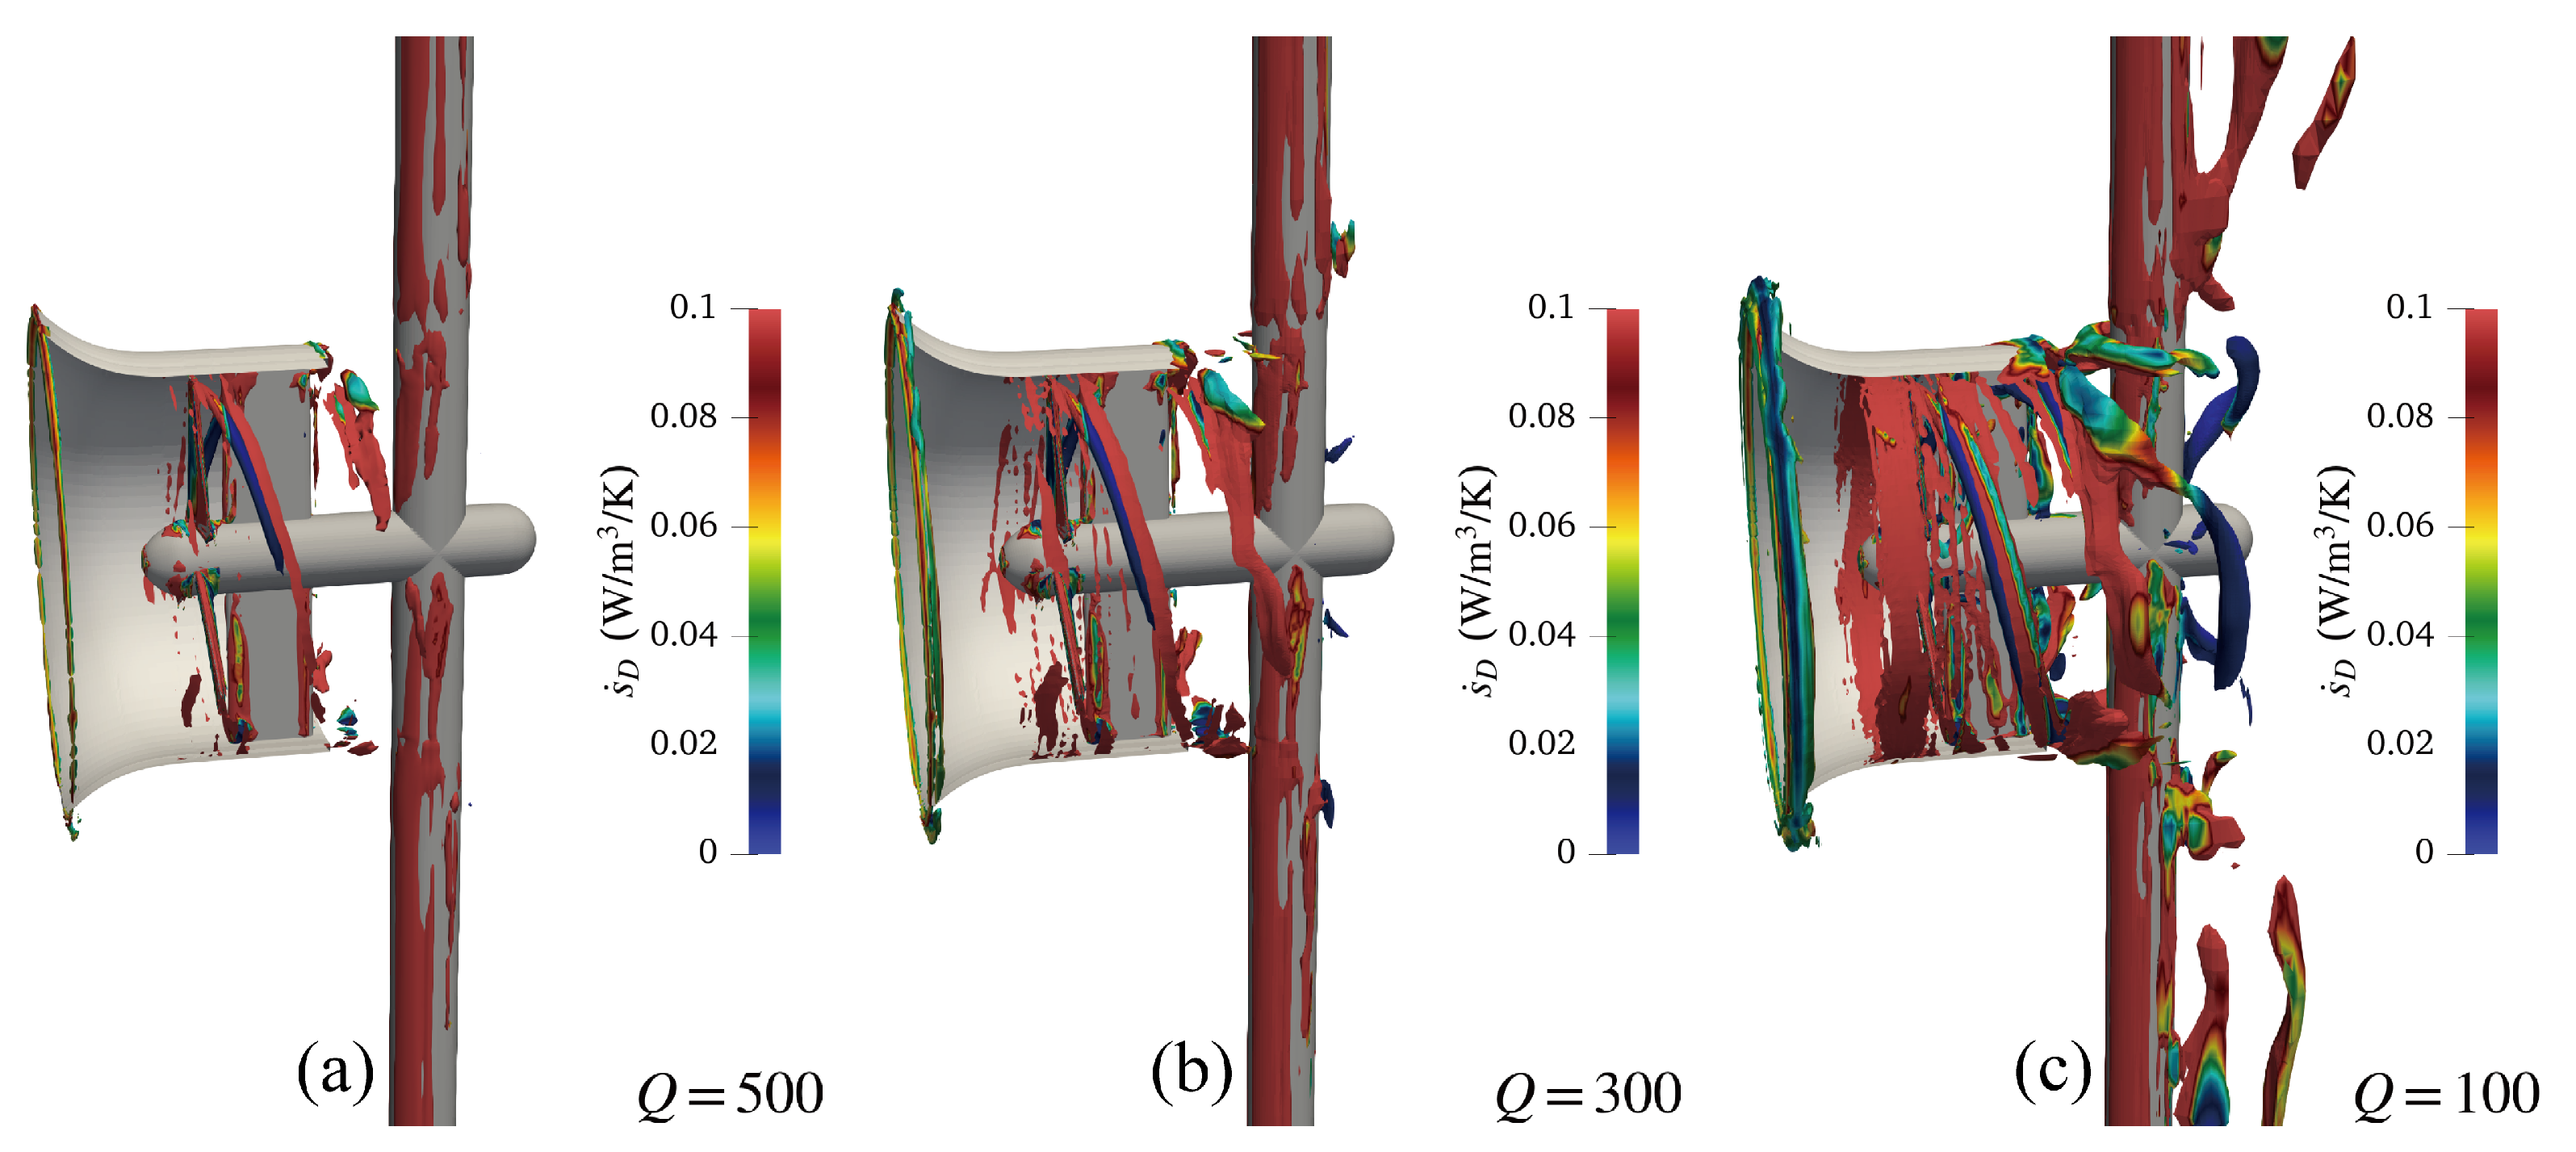
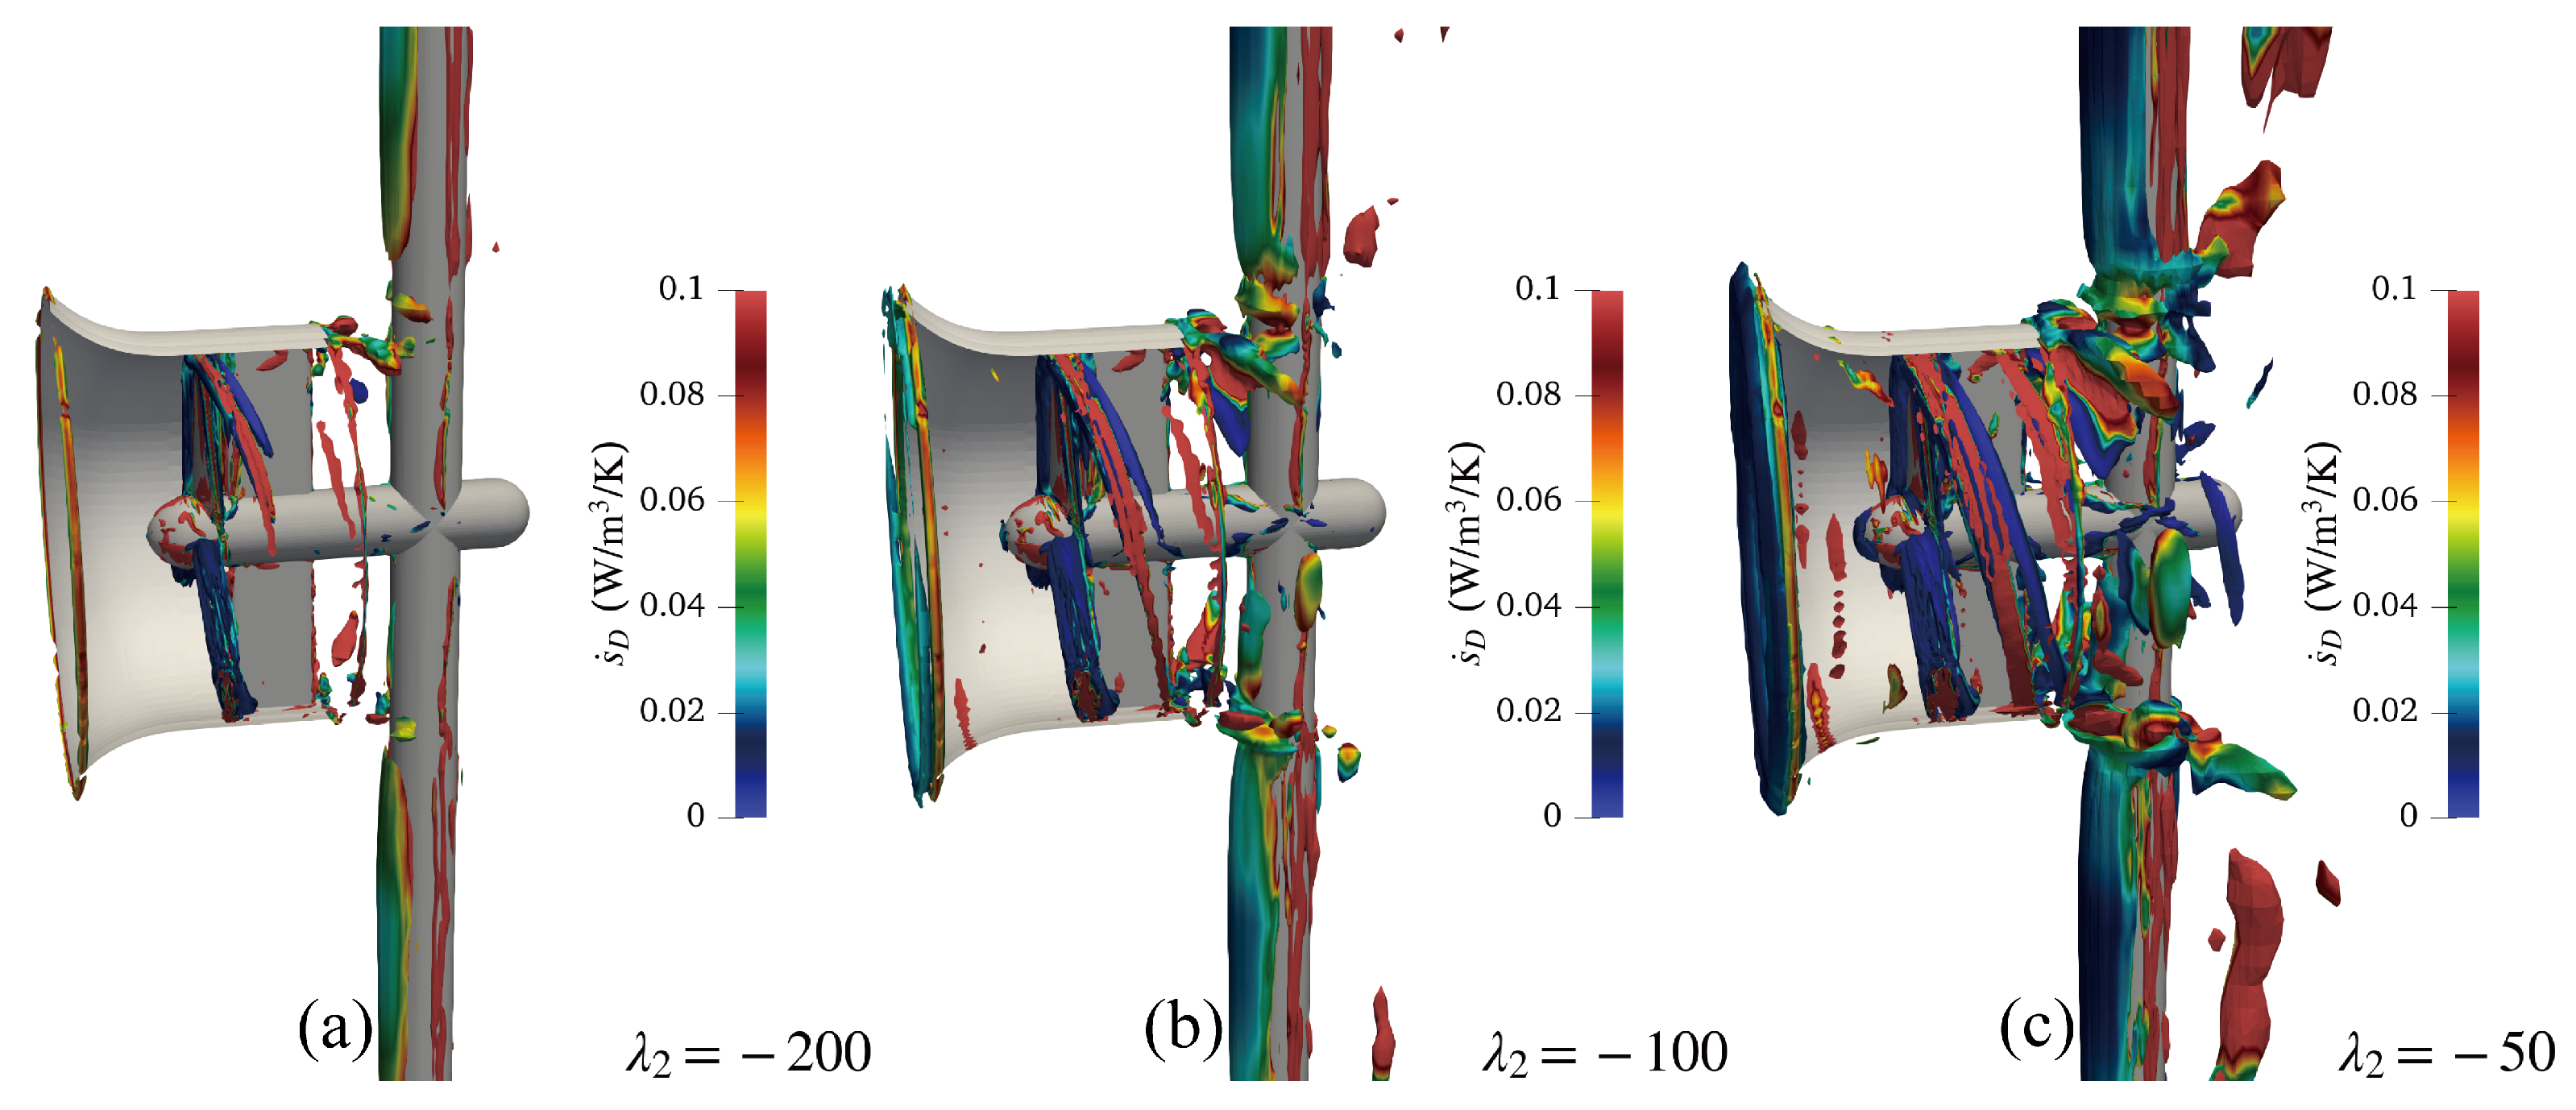
Figure 10, Figure 11 and Figure 12 depict the visualizations of the instantaneous flows for the diffuser-augmented horizontal-axis tidal stream turbine. These vortical structures are identified by different criteria with TSR = 3.6 and colored by the intensity of entropy production rate ( s ˙ D ). As illustrated in these figures, the dominant wake structures follow clockwise tip vortices, which are generated by the turbine whilst the rotor blades rotate in an anticlockwise direction.
Figure 10 presents the vortical structure of the turbine, which is resolved by the isosurfaces of different Q-criteria. As can be seen in these sub-figures, the extracted tip vortices are clearly illustrated as the value of Q decreases. However, the vortices identified by Q-criteria contain redundant motions in the wall shear layer of the diffuser. Similar to the study on the ship propeller [27], these deformations are excluded in Figure 12 when resolving the vortices by Ω -Rortex criteria.
Figure 11 shows the contours of vortical structure with different λ 2 values. Compared to the Q isosurfaces, a λ 2 -criterion cannot distinguish the vortical tubes with certain distinct boundaries. The vortex has a discontinuous intermittent structure after passing the rotor and behind the outlet of the diffuser. Notice that both Q and λ 2 criteria are sensitive to the isosurface thresholds. In general, it is different to identify the vortex structure inside the diffuser of a horizontal-axis tidal stream turbine with the vortex identification methods that are based on a velocity gradient [43].
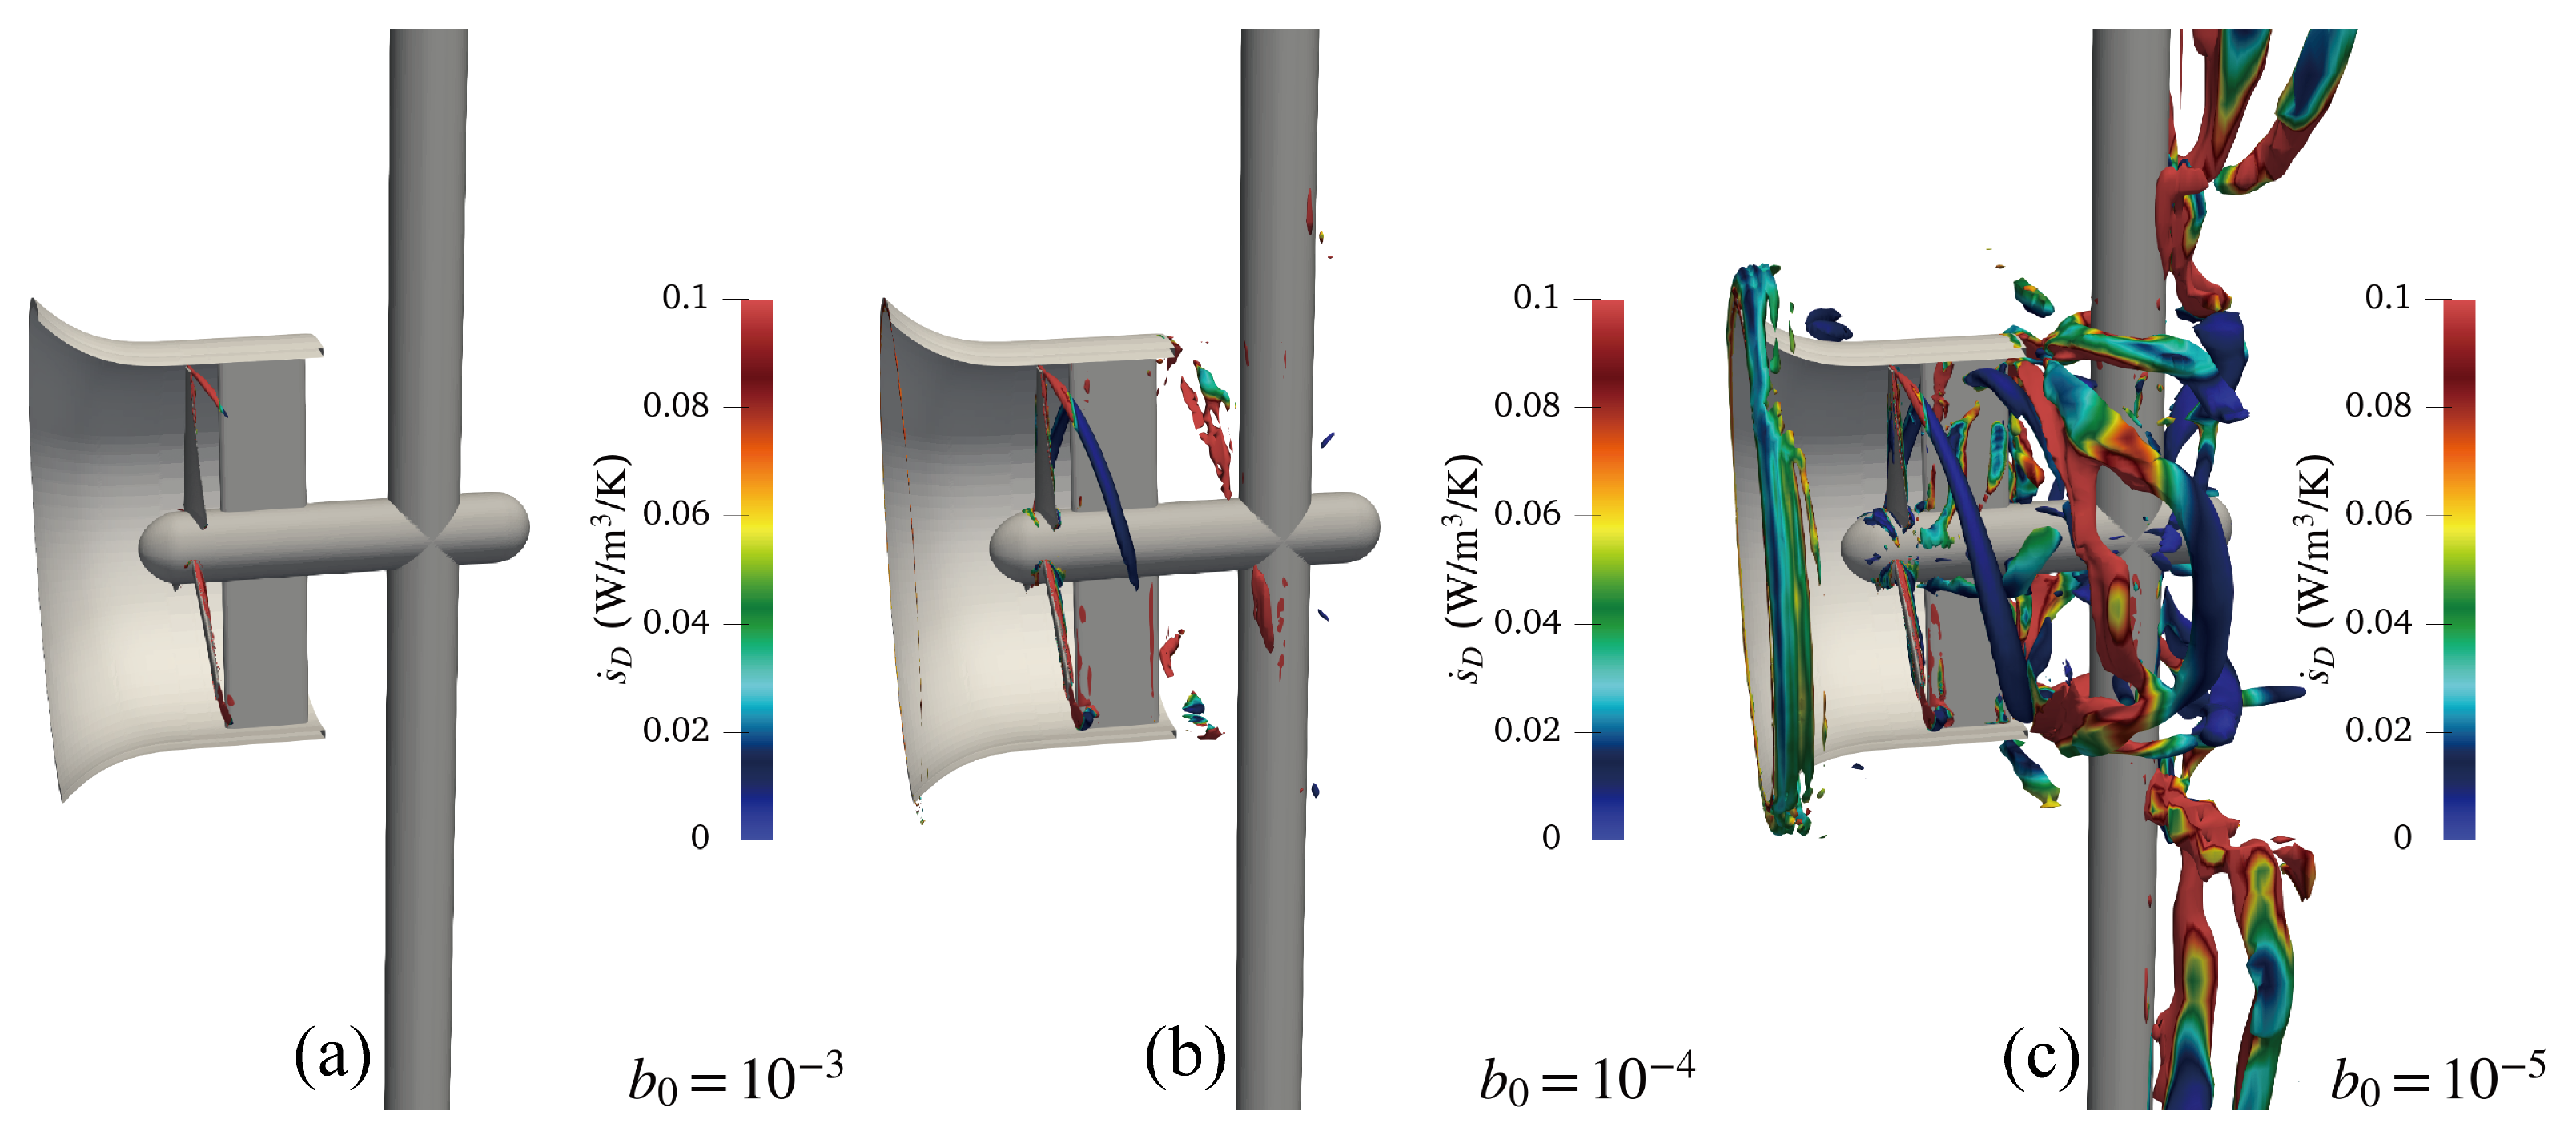
Figure 12 depicts the vortical structure of DAHATT with Ω -Rortex criteria. Owing to the clear physical meaning of Ω R defined by Liu et al. [32], Ω R = 0.52 is recommended to illustrate the rotation strength of vortices. However, when the strong swirling vortex is broken due to the presence of the supporting structure, ε (in Equation (23)) will not be large enough to identify the vortical structure even if the rotational strength is stronger than the deformation. Hence, it is crucial to study the sensitivity of b 0 for the vortex identification using the Ω -Rortex method. As mentioned in Zhao et al.’s research [27], b 0 = 10 6 is reasonable for most marine hydrodynamic investigations. According to our investigation, b 0 = 10 6 is too large, so the wrong vortical structure, which contains extra shear motion near the tip clearance, is captured. For our case, the threshold value of b 0 = 10 5 is suitable for extracting the vortices inside the diffuser and behind the support structure.

5. Conclusions

The presented investigation focused on the near wake structure, entropy production analysis, and vortex identification of diffuser-augmented horizontal-axis tidal stream turbine (DAHATT). After the detailed discussions, the following conclusions are drawn:
(1)
The overall mean wake structure follows a tadpole-shape on the horizontal plane, whilst it has the maximum velocity deficit after the outer edge of the diffuser. In the near wake, the vertical profiles exhibit a triple peak distribution and significant recovery within 6 D downstream.
(2)
On the whole, the region that is behind the tip of the diffuser inlet accounts for the greatest proportion of entropy production rate ( s ˙ D ). Inside the diffuser, entropy production rate ( s ˙ D ) experiences a rapid dissipation after passing the rotor. Moreover, in the near wake region, the distribution of s ˙ D can be depicted as deflecting towards the free surface and the bottom of the flume.
(3)
Q and λ 2 -criteria are sensitive to their isosurface thresholds. The vortices identified by Q-criteria contain redundant wall shear motions, and λ 2 -criteria cannot distinguish the vortical structure with certain distinct boundaries. Thus, the Ω -Rortex method provides reliable vortex identification results for DAHATT.
(4)
Owing to the vortex breakup of the strong swirling flows, b 0 should be a small value that distinguishes the rotational part from the overall vortical structure. For the investigation of DAHATT, we suggest that b 0 should be set to 10 5 .

Author Contributions

Methodology, X.L.; Validation, W.Z. and Y.L.; Formal analysis, E.F.-R.; Resources, Y.Z. (Yuquan Zhang); Data curation, Y.Z. (Yuquan Zhang); Writing—original draft, W.Z.; Writing—review and editing, E.F.-R.; Supervision, Y.Z. (Yuan Zheng). All authors have read and agreed to the published version of the manuscript.

Funding

The research was supported by the following funding: Graduate Research and Innovation Program of Jiangsu Province (SJKY19_0493), Fundamental Research Funds for the Central Universities (No. 2019B71714), and the National Natural Science Foundation of China (52171257).

Data Availability Statement

Not applicable.

Conflicts of Interest

The authors declare no conflict of interest.

References

  1. Vyshnavi, P.; Venkatesan, N.; Samad, A.; Avital, E. Tidal Current Energy for Indian Coastal Lines—A State Art of Review. J. Phys. Conf. Ser. 2020, 1716, 012008. [Google Scholar] [CrossRef]
  2. Fernandez-Rodriguez, E.; Stallard, T.; Stansby, P. Experimental study of extreme thrust on a tidal stream rotor due to turbulent flow and with opposing waves. J. Fluids Struct. 2014, 51, 354–361. [Google Scholar] [CrossRef]
  3. Zhou, Z.; Scuiller, F.; Charpentier, J.F.; Benbouzid, M.; Tang, T. An up-to-date review of large marine tidal current turbine technologies. In Proceedings of the 2014 International Power Electronics and Application Conference and Exposition, Shanghai, China, 5–8 November 2014; pp. 480–484. [Google Scholar]
  4. Gaden, D.L.; Bibeau, E.L. A numerical investigation into the effect of diffusers on the performance of hydro kinetic turbines using a validated momentum source turbine model. Renew. Energy 2010, 35, 1152–1158. [Google Scholar] [CrossRef]
  5. Nunes, M.M.; Mendes, R.C.; Oliveira, T.F.; Junior, A.C.B. An experimental study on the diffuser-enhanced propeller hydrokinetic turbines. Renew. Energy 2019, 133, 840–848. [Google Scholar] [CrossRef]
  6. Cresswell, N.; Ingram, G.; Dominy, R. The impact of diffuser augmentation on a tidal stream turbine. Ocean. Eng. 2015, 108, 155–163. [Google Scholar] [CrossRef] [Green Version]
  7. Zhang, Y.; Zhang, J.; Lin, X.; Wang, R.; Zhang, C.; Zhao, J. Experimental investigation into downstream field of a horizontal axis tidal stream turbine supported by a mono pile. Appl. Ocean. Res. 2020, 101, 102257. [Google Scholar] [CrossRef]
  8. Cacciali, L.; Battisti, L.; Dell’Anna, S. Free Surface Double Actuator Disc Theory and Double Multiple Streamtube Model for In-Stream Darrieus Hydrokinetic Turbines. Ocean. Eng. 2022, 260, 112017. [Google Scholar] [CrossRef]
  9. Zang, W.; Zheng, Y.; Zhang, Y.; Zhang, J.; Fernandez-Rodriguez, E. Experiments on the mean and integral characteristics of tidal turbine wake in the linear waves propagating with the current. Ocean. Eng. 2019, 173, 1–11. [Google Scholar] [CrossRef]
  10. Zhang, Y.; Zang, W.; Zheng, J.; Cappietti, L.; Zhang, J.; Zheng, Y.; Fernandez-Rodriguez, E. The influence of waves propagating with the current on the wake of a tidal stream turbine. Appl. Energy 2021, 290, 116729. [Google Scholar] [CrossRef]
  11. Wang, X.; Yan, Y.; Wang, W.Q.; Hu, Z.P. Evaluating energy loss with the entropy production theory: A case study of a micro horizontal axis river ducted turbine. Energy Convers. Manag. 2023, 276, 116553. [Google Scholar] [CrossRef]
  12. Wang, Z.; Xie, B.; Xia, X.; Yang, H.; Zuo, Q.; Liu, Z. Energy loss of radial inflow turbine for organic Rankine cycle using mixture based on entropy production method. Energy 2022, 245, 123312. [Google Scholar] [CrossRef]
  13. Menter, F. Zonal two equation kw turbulence models for aerodynamic flows. In Proceedings of the 23rd Fluid Dynamics, Plasmadynamics, and Lasers Conference, Orlando, FL, USA, 6–9 July 1993; p. 2906. [Google Scholar]
  14. Menter, F.R. Two-equation eddy-viscosity turbulence models for engineering applications. AIAA J. 1994, 32, 1598–1605. [Google Scholar] [CrossRef] [Green Version]
  15. Menter, F.R.; Kuntz, M.; Langtry, R. Ten years of industrial experience with the SST turbulence model. Turbul. Heat Mass Transf. 2003, 4, 625–632. [Google Scholar]
  16. Herwig, H.; Kock, F. Local entropy production in turbulent shear flows: A tool for evaluating heat transfer performance. J. Therm. Sci. 2006, 15, 159–167. [Google Scholar] [CrossRef]
  17. Kock, F.; Herwig, H. Local entropy production in turbulent shear flows: A high-Reynolds number model with wall functions. Int. J. Heat Mass Transf. 2004, 47, 2205–2215. [Google Scholar] [CrossRef]
  18. Li, D.; Wang, H.; Qin, Y.; Han, L.; Wei, X.; Qin, D. Entropy production analysis of hysteresis characteristic of a pump-turbine model. Energy Convers. Manag. 2017, 149, 175–191. [Google Scholar] [CrossRef]
  19. Nazeryan, M.; Lakzian, E. Detailed entropy generation analysis of a Wells turbine using the variation of the blade thickness. Energy 2018, 143, 385–405. [Google Scholar] [CrossRef]
  20. Haghighi, M.H.S.; Mirghavami, S.M.; Ghorani, M.M.; Riasi, A.; Chini, S.F. A numerical study on the performance of a superhydrophobic coated very low head (VLH) axial hydraulic turbine using entropy generation method. Renew. Energy 2020, 147, 409–422. [Google Scholar] [CrossRef]
  21. Yu, Z.F.; Wang, W.Q.; Yan, Y.; Liu, X.S. Energy loss evaluation in a Francis turbine under overall operating conditions using entropy production method. Renew. Energy 2021, 169, 982–999. [Google Scholar] [CrossRef]
  22. Cacciali, L.; Battisti, L.; Dell’Anna, S.; Soraperra, G. Case study of a cross-flow hydrokinetic turbine in a narrow prismatic canal. Ocean. Eng. 2021, 234, 109281. [Google Scholar] [CrossRef]
  23. White, F.M.; Majdalani, J. Viscous Fluid Flow; McGraw-Hill: New York, NY, USA, 2006; Volume 3. [Google Scholar]
  24. Jeong, J.; Hussain, F. On the identification of a vortex. J. Fluid Mech. 1995, 285, 69–94. [Google Scholar] [CrossRef]
  25. Xing, T.; Bhushan, S.; Stern, F. Vortical and turbulent structures for KVLCC2 at drift angle 0, 12, and 30 degrees. Ocean. Eng. 2012, 55, 23–43. [Google Scholar] [CrossRef]
  26. Wang, L.Z.; Guo, C.Y.; Su, Y.M.; Wu, T.C. A numerical study on the correlation between the evolution of propeller trailing vortex wake and skew of propellers. Int. J. Nav. Archit. Ocean. Eng. 2018, 10, 212–224. [Google Scholar] [CrossRef]
  27. Zhao, W.w.; Wang, J.h.; Wan, D.c. Vortex identification methods in marine hydrodynamics. J. Hydrodyn. 2020, 32, 286–295. [Google Scholar] [CrossRef]
  28. Haller, G. An objective definition of a vortex. J. Fluid Mech. 2005, 525, 1–26. [Google Scholar] [CrossRef] [Green Version]
  29. Fureby, C.; Anderson, B.; Clarke, D.; Erm, L.; Henbest, S.; Giacobello, M.; Jones, D.; Nguyen, M.; Johansson, M.; Jones, M.; et al. Experimental and numerical study of a generic conventional submarine at 10 yaw. Ocean. Eng. 2016, 116, 1–20. [Google Scholar] [CrossRef]
  30. Liu, C.; Wang, Y.; Yang, Y.; Duan, Z. New omega vortex identification method. Sci. China Phys. Mech. Astron. 2016, 59, 1–9. [Google Scholar] [CrossRef]
  31. Chong, M.S.; Perry, A.E.; Cantwell, B.J. A general classification of three-dimensional flow fields. Phys. Fluids A Fluid Dyn. 1990, 2, 765–777. [Google Scholar] [CrossRef]
  32. Liu, C.; Gao, Y.; Tian, S.; Dong, X. Rortex—A new vortex vector definition and vorticity tensor and vector decompositions. Phys. Fluids 2018, 30, 035103. [Google Scholar] [CrossRef] [Green Version]
  33. Gao, Y.; Liu, C. Rortex and comparison with eigenvalue-based vortex identification criteria. Phys. Fluids 2018, 30, 085107. [Google Scholar] [CrossRef] [Green Version]
  34. Gao, Y.; Liu, C. Rortex based velocity gradient tensor decomposition. Phys. Fluids 2019, 31, 011704. [Google Scholar] [CrossRef]
  35. Wang, Y.q.; Gao, Y.s.; Liu, J.m.; Liu, C. Explicit formula for the Liutex vector and physical meaning of vorticity based on the Liutex-Shear decomposition. J. Hydrodyn. 2019, 31, 464–474. [Google Scholar] [CrossRef]
  36. Dong, X.; Gao, Y.; Liu, C. New normalized Rortex/vortex identification method. Phys. Fluids 2019, 31, 011701. [Google Scholar] [CrossRef]
  37. Zhang, Z.; Zhang, Y.; Zheng, Y.; Zhang, J.; Fernandez-Rodriguez, E.; Zang, W.; Ji, R. Power fluctuation and wake characteristics of tidal stream turbine subjected to wave and current interaction. Energy 2022, 264, 126185. [Google Scholar] [CrossRef]
  38. Holzmann, T. Mathematics, Numerics, Derivations and OpenFOAM®; Holzmann CFD: Loeben, Germany, 2016; Chapter 11; pp. 99–103. [Google Scholar]
  39. Issa, R.I. Solution of the implicitly discretised fluid flow equations by operator-splitting. J. Comput. Phys. 1986, 62, 40–65. [Google Scholar] [CrossRef]
  40. Issa, R.I.; Gosman, A.; Watkins, A. The computation of compressible and incompressible recirculating flows by a non-iterative implicit scheme. J. Comput. Phys. 1986, 62, 66–82. [Google Scholar] [CrossRef]
  41. Patankar, S.V.; Spalding, D.B. A calculation procedure for heat, mass and momentum transfer in three-dimensional parabolic flows. In Numerical Prediction of Flow, Heat Transfer, Turbulence and Combustion; Elsevier: Amsterdam, The Netherlands, 1983; pp. 54–73. [Google Scholar]
  42. Ferziger, J.H.; Perić, M.; Street, R.L. Computational Methods for Fluid Dynamics; Springer: Berlin/Heidelberg, Germany, 2002; Volume 3. [Google Scholar]
  43. Bai, X.; Zhang, W.; Fang, Q.; Wang, Y.; Zheng, J.; Guo, A. The visualization of turbulent coherent structure in open channel flow. J. Hydrodyn. 2019, 31, 266–273. [Google Scholar] [CrossRef]
Figure 1. Sketch and image of the turbine and diffuser shape.
Mathematics 11 00116 g001
Figure 2. Schematic of computational domain and boundary conditions.
Mathematics 11 00116 g002
Figure 3. Vertical profile of normalized incoming velocity and turbulence intensities.
Mathematics 11 00116 g003
Figure 4. Overall and magnified computational mesh.
Mathematics 11 00116 g004
Figure 5. Vertical profile of normalized incoming velocity and turbulence intensities.
Mathematics 11 00116 g005
Figure 6. Contours of velocity deficit ( Δ 1 ) on horizontal and vertical plane ( TSR = 3.6 ) .
Mathematics 11 00116 g006
Figure 7. Contours of turbulence intensity ( I ) on horizontal and vertical plane ( TSR = 3.6 ) .
Mathematics 11 00116 g007
Figure 8. Contours of entropy production rate ( s ˙ D ) on horizontal and vertical plane ( TSR = 3.6 ) .
Mathematics 11 00116 g008
Figure 9. s ˙ D distribution of the turbine at different longitudinal positions ( TSR = 3.6 ) .
Mathematics 11 00116 g009
Figure 10. Vortical structure of the turbine. Isosurfaced by different Q, colored by s ˙ D ( TSR = 3.6 ) .
Mathematics 11 00116 g010
Figure 11. Vortical structure of the turbine, isosurfaced by different λ 2 ( TSR = 3.6 ) .
Mathematics 11 00116 g011
Figure 12. Vortical structure of the turbine, isosurfaced by Ω R = 0.52 with different b 0 ( TSR = 3.6 ) .
Mathematics 11 00116 g012
Table 1. Model turbine specifications.
No. of the Section r / R c (mm) θ (rad)
1 0.2 23.0 0.2380
2 0.3 34.4 0.2078
3 0.4 32.1 0.1775
4 0.5 27.4 0.1473
5 0.6 25.0 0.1170
6 0.7 22.7 0.0868
7 0.8 20.3 0.0565
8 0.9 18.0 0.0263
9 1.0 15.6 0.0040
Table 2. Specifications of the turbine.
Turbine Parameter Value
Number of the blades N b 3
Rotor diameterD ( mm )200
Hub ratio α H 20%
Nacelle diameter D N ( mm )40
Length of diffuser L D ( mm )149.2
Radius of diffuser inlet H i ( mm )135
Radius of diffuser outlet H o ( mm )108
Thickness of diffuser δ D ( mm )5
Tip clearance size ξ ( mm )5
Tip speed ratio TSR 2.5 4.5
Bulk velocity U 0 ( m / s )3.5
Reference temperatureT ( K )288
Table 3. The boundary conditions of each patch.
PatchVelocity ( U ) Pressure ( p ) Turbulent Kinetic Energy ( k )
inletcodedFixedValueinletOutletfixedValue
outletinletOutletzeroGradientzeroGradient
topslipzeroGradientzeroGradient
staticWallsfixedValuezeroGradientkqRWallFunction
rotationWallsmovingWallVelocityzeroGradientkqRWallFunction
Table 4. Mesh independence verification of computational domain.
CaseNo. of CellesClock Time (hour)Max Wall y + of Rotation RegionMean Power Coefficient C P ¯ Relative Error ( % )
Coarsest2,898,716 ( 2.9 M ) 15.9>700.337 11.59
Coarse3,574,652 ( 3.6 M ) 18.4≈500.331 9.60
Medium7,446,432 ( 7.4 M ) 83.1≈160.304 0.66
Fine9,847,484 ( 9.8 M ) 108.6≈130.301 0.33
Finest11,304,968 ( 11 M ) 130.3≈110.302
Disclaimer/Publisher’s Note: The statements, opinions and data contained in all publications are solely those of the individual author(s) and contributor(s) and not of MDPI and/or the editor(s). MDPI and/or the editor(s) disclaim responsibility for any injury to people or property resulting from any ideas, methods, instructions or products referred to in the content.