Abstract
The minimization of annual operating costs in radial distribution networks with the optimal selection and siting of fixed-step capacitor banks is addressed in this research by means of a two-stage optimization approach. The first stage proposes an approximated mixed-integer quadratic model to select the nodes where the capacitor banks must be installed. In the second stage, a recursive power flow method is employed to make an exhaustive evaluation of the solution space. The main contribution of this research is the use of the expected load curve to estimate the equivalent annual grid operating costs. Numerical simulations in the IEEE 33- and IEEE 69-bus systems demonstrate the effectiveness of the proposed methodology in comparison with the solution of the exact optimization model in the General Algebraic Modeling System software. Reductions of and with respect to the benchmark case are obtained with the proposed two-stage approach, with minimum investments in capacitor banks. All numerical implementations are performed in the MATLAB software using the convex tool known as CVX and the Gurobi solver. The main advantage of the proposed hybrid optimization method lies in the possibility of dealing with radial and meshed distribution system topologies without any modification on the MIQC model and the recursive power flow approach.
Keywords:
fixed-step capacitor banks; daily load variations; annual operating costs minimization; two-stage optimization approach; successive approximation power flow method MSC:
94C15; 90C27; 90C26
1. Introduction
Electrical distribution networks are constantly growing due to the requirements of commercial, industrial, and residential users in urban and rural areas [1]. Most of the investments in electrical systems are condensed into medium- and low-voltage level applications to satisfy the growing electric demand [2]. For this reason, utilities are intended to improve the quality service in their grids in order to enable the interconnection of new users with minimum investment and operating costs [3]. One of the key aspects in the construction of electrical distribution grids is their topology. These networks are typically constructed with a radial configuration to minimize the investment in electrical infrastructure (conductors, isolators, protective devices, and so on) [4], but these investment reductions are counteracted by increments in the operating costs, since radial configurations have higher power losses in comparison with meshed grid configurations [5].
To deal with the costs of energy losses distribution networks, electric distribution companies typically employ shunt power compensation, i.e., with active and reactive power sources [6,7]. In the case of active power compensation, dispersed generators and/or battery energy storage systems are typically considered [8,9]. Nevertheless, the investment costs of these devices are not compensated by a reduction in power losses, which implies that said devices are installed in the grid to minimize the total energy purchasing costs in the substation bus or to minimize the total greenhouse gases emitted into the atmosphere [10,11]. However, in some cases, with these objective functions, the energy losses can increase with respect to the benchmark case [12]. In the case of reactive power compensation, the most commonly used devices are fixed-step capacitor banks and distribution static compensators (i.e., D-STATCOMs) [13], both of which can be installed in order to reduce energy losses in distribution networks. However, capacitor banks are simple, economic, and reliable devices that require little maintenance and can continue to work for 20–25 years [14], whereas D-STATCOMs imply continuous maintenance costs and are based on power electronics, which implies that the rate of failure is higher in comparison with capacitor banks [15].
In the scientific literature, multiple approaches to locate and size fixed-step capacitor banks in distribution networks have been proposed. Some of these works are discussed below. Ref. [16] proposed the application of the tabu search algorithm to locate and size fixed-step capacitor banks including the exploration and exploitation aspects of genetic algorithms as well as simulated annealing methods. Ref. [14] presented the application of the flower pollination algorithm to locate and size fixed-step capacitor banks in distribution grids with radial structures. Numerical results in IEEE 33-, 34-, 69-, and 85-bus systems demonstrated the efficiency of this proposal when compared with different literature reports based on genetic algorithms and fuzzy logic. Ref. [17] proposed the implementation of the discrete version of the vortex search algorithm to locate and size fixed-step capacitor banks in radial distribution networks. Numerical results in the IEEE 33- and 69-bus grids showed the efficiency of said algorithm when compared with the flower pollination algorithm reported in [14]. Ref. [18] presented the application of the Chu and Beasley genetic algorithm (CBGA) with an integer codification to locate and size fixed-step capacitor banks in distribution networks considering radial and meshed configurations. Numerical results in the IEEE 33- and 69-bus systems demonstrated the efficiency of this optimization approach when compared with the exact solution reached in the General Algebraic Modeling System (GAMS) software. Ref. [19] presented the reformulation of the exact mixed-integer nonlinear programming (MINLP) model in order to locate and size fixed-step capacitor banks into a mixed-integer, second-order cone programming approach. Numerical results in the IEEE 33- and 69-bus grids demonstrated the effectiveness of this solution methodology by improving results obtained in the literature with the CBGA, the GAMS software, and the flower pollination approaches. Other optimization algorithms that can be found in the current literature to locate and size fixed-step capacitor banks are: artificial bee colony optimization [20], particle swarm optimization [21], gravitational search algorithms [22], cuckoo search algorithm [23], and modifications of genetic and tabu search algorithms [24,25], among others.
The main characteristic of the aforementioned literature reports (except for the GAMS and conic approximations) is that metaheuristic approaches work with a master–slave optimization structure, where the master stage is entrusted with selecting the optimal location and sizes of the capacitor banks and the slave stage evaluates the power losses of each configuration provided by the master stage [17]. In some cases, the master stage only provides the set of nodes where the capacitor banks will be installed, and the slave stage solves the optimal power flow problem to find their optimal sizes [26,27].
Considering the advantages of fixed-step capacitor banks and their widespread use to reduce power in distribution networks, as well as the slave optimization methods reported in the literature, this research focuses on proposing a new two-stage optimization approach to locate and size these devices in distribution networks. The main contribution of this research is the formulation of a mixed-integer quadratic convex (MIQC) model to identify the nodes where the capacitor banks will be located. The main advantage of the MIQC formulation is that it ensures the optimal global optimal solution of the relaxed model. This implies that no statistical evaluations confirm the location of the capacitors, which is necessary for metaheuristic-based optimizers. Once the location of the fixed-step capacitor banks is defined by the MIQC model, a recursive power flow solution is implemented in order to evaluate all possible sizes (i.e., exhaustive evaluation of the solution space), which allows for determining the best possible sizes for these capacitors. It is worth mentioning that the exhaustive exploration of the solution space is possible since it has a few thousand options, which are easily assessed with any personal or desktop computer.
Note that the selection of the MIQC formulation to determine the set of nodes where the fixed-step capacitor banks will be located is motivated by the convexity of the solution space for each binary variable combination, which implies that, through the combination of a Branch and Bound method with the interior point approach, it is possible to ensure that the global optimum is found [28]. Even if some metaheuristic models perform efficiently in electrical engineering problems such as the reconfiguration of distribution grids including dispersed generation [29,30], more studies are required in this research field to make metaheuristics competitive against MIQC models.
The remainder of this article is organized as follows: Section 2 presents the proposed MIQC model that defines the optimal location of the fixed-step capacitor banks. This model corresponds to a quadratic objective function with linear integer constraints. Section 3 presents the recursive power flow solution method based on the successive approximation approach to define the optimal sizes of the fixed-step capacitor banks. Section 5 shows the main characteristics of the IEEE 33- and 69-bus systems. Section 6 presents the numerical results, their analysis, and discussions, as well as the comparison between the proposed two-stage solution methodology and the literature reports. Finally, Section 7 lists the main concluding remarks derived from this research, as well as some proposals for future work.
2. Nodal Selection Strategy
To select the nodes where the fixed-step capacitor banks will be installed, a mixed-integer quadratic convex (MIQC) formulation is proposed by using the equivalent linear power flow formulation for electrical distribution networks obtained by simplifying the MINLP model for distribution system reconfiguration reported in [31]. The simplifications made to the MINLP model in order to obtain an MIQC are the following:
- i.
- All the voltage magnitudes are assumed to be known, i.e., these can be assigned as plane voltages or set as the power flow solution without capacitor banks (i.e., the benchmark case).
- ii.
- The magnitude of the currents through the distribution lines is mainly governed by the active and reactive power consumption, which implies that the effect of the second Kirchhoff law at each line is negligible in comparison with the first Kirchhoff law at each node.
By considering the aforementioned assumptions on the exact MINLP model proposed by [31], the MIQC model to define the set of nodes where the fixed-step capacitor banks will be installed is obtained (see Figure 1). This model is defined in Equations (1)–(5):
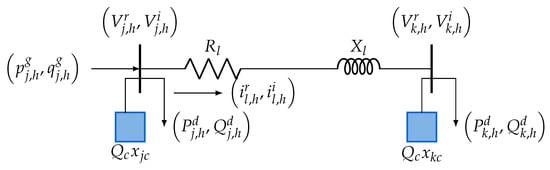
Figure 1.
Representation of a distribution branch with the main variables of the MIQC model.
Note that all the mathematical symbols, parameters, and variables are contained in the nomenclature list presented at the end of this document.
Note that the proposed MIQC formulation defined in Equations (1)–(5) has the following interpretation: Equation (1) defines the approximated annual grid operative costs of the network, which correspond to the sum of the expected costs concerning the energy losses and the installation of the fixed-step capacitor banks. Equation (2) defines the active power balance equilibrium at node j for each period of time h, which is linear when the voltages and are assumed to be known. Equation (3) defines the reactive power equilibrium at each node for each period of time. Inequality constraint (4) defines the possibility of installing as much as one fixed-step capacitor bank type at node j. Finally, inequality constraint (5) limits the maximum number of fixed-step capacitor banks that can be installed in the distribution grid.
In order to characterize the optimization model defined in Equations (1)–(5), the classification and type of variables are presented in Table 1, including the number and type of constraints. It is important to mention that, in this classification, n is the number of nodes, h represents the periods of time, c corresponds to the number of capacitor available, and l is the number of lines.

Table 1.
Characterization of the MIQC model (1)–().
Remark 1.
The solution of the MIQC model defined in Equations (1)–(5) provides the nodes where the capacitor banks will be installed along with their sizes, since it completely defines the final values for the variables . However, only the nodes where these capacitors will be installed are taken from this solution, since their sizes correspond to an approximate solution of the exact MINLP model due to the approximation introduced by the voltage magnitude simplification.
To refine the solution provided by the MIQC model regarding the sizes of the fixed-step capacitor banks, the next section presents the methodology for finding the fixed-step capacitor banks, which is based on the recursive power flow solution for each possible fixed-step capacitor size combination.
It is important to mention that the dimension of the solution space defined by the binary variables in the MIQC model in Equations (1)–(5) takes a combination form, where it depends on the number of capacitors available and the number of nodes in the distribution network. Note that, for the IEEE 33- and 69-bus grids, these dimensions are 4960 and 50,116 when three capacitors are considered for installation [32].
3. Assigning the Optimal Sizes
Once the MIQC model presented in Section 2 has been solved, the values of the variables are known. However, in the second stage of the proposed optimization methodology, the optimal sizes of the fixed-step capacitor banks are refined by fixing these capacitors in the j nodes.
Given that the optimization problem can take a maximum of to be installed in the distribution network (one fixed-step capacitor bank per node), in this stage, an integer combination is proposed to represent each fixed-step capacitor size. Note that, if the small fixed-step capacitor bank is assigned to node i with 1 and the largest fixed-step capacitor bank for the k node is set as c, then the proposed codification for the selected nodes has the following structure:
where represents the vector associated with the selected nodes j, k, and m, along with their corresponding sizes (possible solution). It is important to mention that, for each solution in Equation (6), the total costs of the fixed-step capacitors are easily determined with the second component of the objective function (1).
Remark 2.
Due to the fact that the maximum size of the capacitor bank is assigned as c and the maximum number of devices installed is , the size of the solution space for the optimal sizing problem of the fixed-step capacitor banks is . This number is for the studied set of alternatives regarding the fixed-step capacitor banks.
Considering a solution space with and , the proposed methodology to determine the optimal sizes of these capacitor banks is exhaustive, which implies that the 2774 options are evaluated in a conventional power flow formula. The proposed power flow methodology is the successive approximation power flow method reported in [33].
The general recursive power flow formula for the successive approximation method is defined in Equation (7):
where m is the iterative counter, is the vector that contains all the voltage variables in the complex domain for all the demand nodes in each period of time h, is the complex vector that contains all the power outputs in the fixed-step capacitor banks in each period of time h (note that this vector is provided for each of the 2744 size combinations), is the complex demand vector with the active and reactive power consumption in the demand nodes for each period of time, is the complex voltage output at the substation bus, is a complex square matrix that contains all the admittances among the demand nodes, and is a rectangular complex matrix that contains the admittances between the demand and the substation buses. Note that and are a matrix with all the elements of the z at its diagonal and the conjugate operator of the complex vector z, respectively.
It is important to emphasize that is 0 for the set of nodes different from j, k, and m. Regarding the example codification presented in Equation (7), these nodes are listed below:
The main characteristic of the recursive power flow Formula (7) is that its convergence to the power flow solution can be ensured by applying the Banach fixed-point theorem [34]. To determine if the power flow Formula (7) has converged, the difference between the voltage magnitudes between two consecutive iterations is used, i.e.,
where is the tolerance value, which is assigned as , as recommended in [33].
Note that, once the power flow problem is solved with Equation (7), the amount of power losses is calculated for each period of time, as presented in Equation (9):
where is the vector that contains the substation and demand voltages, ordered as ; and is the nodal admittance matrix of the distribution grid. With the power losses at each period of time, the exact operational costs of the distribution systems with fixed-step capacitor banks (i.e., ) can obtained as defined in Equation (10):
4. Summary of the Solution Methodology
The proposed solution methodology for locating and selecting fixed-step capacitor banks is summarized in Algorithm 1. Here, the problem of location is solved with a mixed-integer convex formulation, and the selection (i.e., sizing) is determined with the recursive evaluations of the power flow problem for each one of the possible combinations.
| Algorithm 1: Proposed two-stage solution methodology to select and locate fixed-step capacitor banks in distribution networks. |
 |
5. Test Feeder Information
To validate the proposed two-stage optimization methodology, two classical test feeders known as the IEEE 33- and 69-bus systems are employed. The parametric information for these grids is presented below.
5.1. IEEE 33-Bus Grid
The IEEE 33-bus grid is an electrical network operated with 12.66 kV at the substation bus located at node 1. This system has a radial structure, i.e., 33 buses and 32 lines. The electrical configuration of this test feeder is presented in Figure 2a, and its electrical parameters are listed in Table 2.
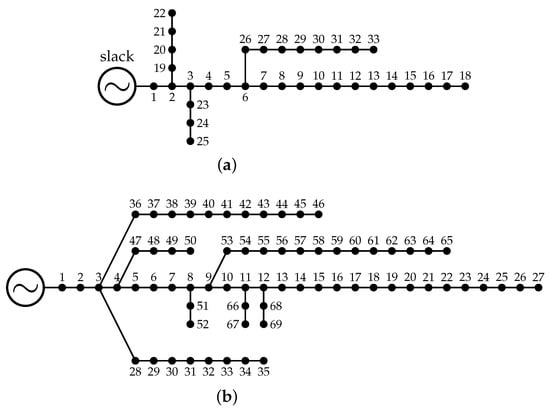
Figure 2.
Grid configuration of the test feeders: (a) IEEE 33- and (b) IEEE 69-node system.
Table 2.
Parametric information for the IEEE 33-bus system.
5.2. IEEE 69-Bus Grid
The IEEE 69-bus grid is an electrical network operated with 12.66 kV at the substation bus located at node 1. This system has a radial structure, i.e., 69 buses and 68 lines. The electrical configuration of this test feeder is presented in Figure 2b, and its electrical parameters are listed in Table 3.
Table 3.
Parametric information for the IEEE 69-bus system.
5.3. Parameters for the Economic Assessment
To determine the annual grid operating costs in the network when the fixed-step capacitor banks are installed, the information regarding sizes and costs is presented in Table 4. Note that this information was adapted from [14].
Table 4.
Costs of the capacitors per capacity.
6. Computational Implementation
The proposed two-stage optimization approach was implemented in the MATLAB software, version 2019b. The mixed-integer linear programming model was implemented using the CVX and the Gurobi solver. The recursive power flow solution was implemented with our own scripts, which used the successive approximation power flow formulation. All the simulations were run on a desktop computer with an Intel(R) Core(TM) i7-7700 2.8-GHz processor and 16.0 GB of RAM on a 64-bit version of Microsoft Windows 10 Home.
6.1. IEEE 33-Bus Grid
For this test feeder, considering that, throughout the year, the system operates under peak load conditions, as analyzed by [14], the first stage of our proposed optimization method identifies nodes 13, 24, and 30 as the optimal location for the capacitor banks.
Now, by fixing the sizes provided by the MIQC model and applying the refinement stage of our proposed optimization model, the optimal sizes for these locations are 450, 450, and 1050 kvar. Note that this solution has an expected annual operative cost of US$/year 23,747.317, with an investment of US$/year . These values imply a reduction of with respect to the annual cost of the benchmark case (i.e., US$/year 35,445.909 without capacitors). Table 5 presents a comparison with the solution of the exact MINLP model in the GAMS software and the best three solutions reported for our two-stage proposed optimization approach.
Table 5.
Optimal location, sizes, and annual expected costs for the IEEE 33-bus system under peak load conditions.
The most important result in Table 5 is that, with the proposed two-stage optimization method, it is possible to generate a list with the alternative solutions. Note that, in this list, there are three solutions with better final objective function value than the solution obtained with the GAMS software.
6.2. IEEE 69-Bus Grid
For this test feeder, considering that, throughout the year, the system operates under peak load conditions, as analyzed by [14], the first stage of our proposed optimization method identifies nodes 11, 21, and 61 as the optimal location for the capacitor banks. In addition, by fixing the sizes provided by the MIQC model and applying the refinement stage of our proposed optimization model, the optimal sizes for these locations are 450, 150, and 1200 kvar. Note that this solution has an expected annual operative cost of US$/year 24,845.246, with an investment of US$/year . These values imply a reduction of with respect to the annual cost of the benchmark case (i.e., US$/year 37,812.056 without capacitors). Table 5 presents a comparison with the solution of the exact MINLP model in the GAMS software and the best three solutions reported for our two-stage proposed optimization approach.
Note that the main result in Table 6 is that the proposed two-stage optimization method allows for identifying at least four solutions with better objective function values than the solution reached with the GAMS software.
Table 6.
Optimal location, sizes, and annual expected costs for the IEEE 69-bus system under peak load conditions.
Table 6 confirms that performing an exhaustive exploration once the nodes where the fixed-step capacitor banks will be installed have been identified enables the identification of additional solutions that cannot be found by means of commercial approaches. This situation is particularly important for utilities since additional investment alternatives can be identified prior to making the final decision regarding installation in the grids.
6.3. Numerical Results Considering Daily Load Variations
To verify the effectiveness and robustness of the proposed optimization approach, in this simulation scenario, the daily variations of the active and reactive power curve in 30-min periods were considered [35]. The active and reactive power variations are listed in Table 7.
Table 7.
Behavior of the daily active and reactive power consumption.
Considering the daily information in Table 7 for the active and reactive power demands, in the case of the IEEE 33-bus grid, the best solution provided by the proposed two-stage optimization method corresponds to locating the fixed-step capacitor banks in nodes 2, 7, and 30, with sizes of 150, 450, and 450 kvar, respectively. These capacitor banks have an investment cost of US$/year , with total annual operative costs of US$/year 12,763.112. This value corresponds to a reduction of with respect to the benchmark case (i.e., US$/year 15,555.063 without installing fixed-step capacitor banks). For the IEEE 69-bus system, the proposed methodology identifies the nodes 11, 24, and 61 and fixed-step capacitor banks with sizes of 150, 150, and 600 kvar, respectively. These capacitor banks have an investment cost of US$/year 282, with total annual operative costs of US$/year 13,141.378. This implies a reduction of with respect to the benchmark case (i.e., US$/year 16,517.383 without installing fixed-step capacitor banks).
6.4. Applicability in Meshed Distribution Networks
To demonstrate the applicability of the proposed hybrid optimization model to deal with the problem regarding the optimal placement and sizing of fixed-step capacitor banks in electrical distribution grids with meshed configurations, in this simulation scenario, the meshed configuration of the IEEE 33-bus grid was considered with all the tie-lines in the reconfiguration problem studied in [36] permanently closed. For the sake of completeness, the lines added to the IEEE 33-bus system are listed in Table 8.
Table 8.
Distribution lines added to the IEEE 33-bus grid.
For the IEEE 33-bus system, where the distribution lines in Table 8 are added to the distribution system topology presented in Figure 2a and the daily active and reactive power behavior in Table 7 is considered, the solution of the MIQC model (1)–(5) defines the location of the fixed-step capacitor banks at nodes 2, 8, and 30, respectively. In addition, by fixing these sizes in the recursive power flow solution methodology, the optimal sizes assigned for these nodes are 150, 300, and 600 kvar, respectively. When these fixed-step capacitor banks are installed, the annual grid operative costs take a value of US$/year , i.e., a reduction of with respect to the benchmark case.
Note that the most important result in the meshed scenario is as expected: the annual grid operating costs is low in comparison with the radial operative case, since the benchmark case in the radial scenario was US$/year , while, in the full meshed operation scenario, this value decreased to US$/year . This is due to the presence of meshes in the distribution network allowing for a better power flow distribution and improving voltage regulation in the network, which are directly related with the reductions in the total energy losses of the network compared to the radial topology.
7. Conclusions and Future Work
The problem regarding the optimal placement and sizing of fixed-step capacitor banks in electrical distribution networks with radial structure was addressed in this research via the application of a two-stage optimization methodology. The first stage of the proposed optimization approach dealt with selecting the nodes where the fixed-step capacitor banks would be installed through the implementation of an MIQC model. The second stage corresponded to an exhaustive assessment of the solution space by using the successive approximation power flow method for each possible size combination of the fixed-step capacitor banks on the nodes, which was provided by the MIQC model.
The numerical results in the IEEE 33- and 69-bus grids showed that the proposed two-stage optimization approach finds better objective function values than the GAMS software with its exact MINLP solvers. For the IEEE 33-bus grid, the difference between the proposed method and the GAMS software was US$/year . In addition, for this test feeder, the proposed MIQC model found two additional solutions with better objective function values when compared to the GAMS optimal solution. In the case of the IEEE 69-bus system, the proposed two-stage approach found an additional gain of US$/year . In addition, the proposed MIQC model found three alternative solutions with better objective function values in comparison with the GAMS optimal solution.
As for the reductions with respect to the benchmark case, in the scenario involving a year-long operation under peak load conditions, for the IEEE 33-bus, the annual expected improvement was about , and, for the IEEE 69-bus system, it was . However, when the daily active and reactive power consumption was considered, the expected improvement was about for the IEEE 33-bus grid, and, for the IEEE 69-bus grid, it was about . Note that these behaviors were expected in the context of this simulation, given that the daily behavior of the active and reactive power curves corresponded to a realistic operative scenario, whereas the peak load operation represented a theoretical operative scenario that only served to validate new solution methodologies with respect to literature reports.
The main limitation of the proposed optimization method is related to the possibility of evaluating the entirety of the solution space regarding the possible sizes of the fixed-step capacitor banks, since, for large test feeders where more than three capacitor banks are available, the proposed recursive solution methodology entails long processing times. Note that, for a system with an availability of 7 capacitor banks and 14 possible sizes, the dimension of the solution space is 105,413,504, i.e., more than 105 million possible solutions. Therefore, for large solution spaces, it is recommended to replace the recursive power flow evaluation method with a specialized metaheuristic optimization technique that can efficiently deal with discrete variables with reduced computational effort.
As future work, it will be possible to conduct the following studies: (i) to propose a mixed-integer conic model that allows for integrating fixed-step capacitor banks with the optimal grid reconfiguration of the network while considering daily active and reactive power variations; (ii) to extend the proposed MIQC model in order to locate and size renewable energy resources and batteries in distribution networks; and (iii) to consider more realistic models to represent capacitor banks, including energy losses and reactive power injection variability as a function of the voltage at the nodes where the banks are connected.
Author Contributions
Conceptualization, methodology, software, and writing (review and editing): O.D.M., F.D.M. and A.R. All authors have read and agreed to the published version of the manuscript.
Funding
This work was partially supported in part by the Center for Research and Scientific Development of Universidad Distrital Francisco José de Caldas, under grant 1643-12-2020 associated with the project Desarrollo de una metodología de optimización para la gestión óptima de recursos energéticos distribuidos en redes de distribución de energía eléctrica [Development of an optimization methodology for the optimal management of energy resources distributed across electrical energy distribution networks].
Institutional Review Board Statement
Not applicable.
Informed Consent Statement
Not applicable.
Data Availability Statement
No new data were created or analyzed in this study. Data sharing is not applicable to this article.
Conflicts of Interest
The authors declare no conflict of interest.
Nomenclature
| Complex vector that contains all the power outputs | |
| in the fixed-step capacitor banks for each period of time h (var). | |
| Complex vector with the active and reactive power | |
| consumption in the demand nodes for each period of time (VA). | |
| Complex vector that contains all the voltages in the | |
| demanded nodes for each period of time (V). | |
| Complex variable associated with the voltage output at the slack source (V). | |
| Nodal admittance matrix (S). | |
| Component of the nodal admittance matrix that associates | |
| demand nodes with each other (S). | |
| Component of the node-to-branch incidence matrix that associates node j with line l. | |
| Set that contains all fixed-step capacitor bank types available | |
| for installation in the distribution grid. | |
| Set that contains all hours of the operation period (typically 24 h). | |
| Set that contains all distribution lines of the network. | |
| Set that contains all the nodes of the network. | |
| Parameter associated with the maximum convergence error | |
| admissible for the power flow solution (V). | |
| Expected costs of the energy losses (US$/kWh-year). | |
| Installation cost of the fixed-step capacitor bank type c (US$/kvar). | |
| h | Subscript associated with the set . |
| Imaginary component of the current flowing through line l in the period of time h (A). | |
| Real component of the current flowing through line l in the period of time h (A). | |
| j | Subscript associated with the set . |
| l | Subscript associated with the set . |
| m | Superscript associated with the number of iterations. |
| Number of fixed-step capacitor banks available for installation. | |
| Active power losses in the distribution network for each period of time (W). | |
| Active power generation consumed at node j in period of time h (W). | |
| Active power generation injected at node j in period of time h (W). | |
| Reactive power capacity of a type c fixed-step capacitor bank (kvar). | |
| Reactive power generation consumed at node j in period of time h (var). | |
| Reactive power generation injected at node j in period of time h (var). | |
| Resistive parameter of the distribution line l (). | |
| T | Length of the planning period (days). |
| Imaginary component of the voltage magnitude at node j in the period of time h (V). | |
| Real component of the voltage magnitude at node j in the period of time h (V). | |
| Solution vector that contains the nodes where the fixed-step capacitor | |
| banks will be located along with their possible sizes. | |
| Binary variable associated with the installation () or not () | |
| of a fixed-step capacitor bank type c at node j. | |
| Approximate objective function value associated with the | |
| expected annual grid operating costs (US$). | |
| Expected annual operating costs of the network (US$). |
References
- Millar, R.; Hyvarinen, M.; Lehtonen, M.; Hamalainen, P. Urban distribution networks - some general planning observations. In Proceedings of the 20th International Conference and Exhibition on Electricity Distribution (CIRED 2009), Prague, Czech Republic, 8–11 June 2009. [Google Scholar] [CrossRef]
- Pană, A.; Băloi, A.; Molnar-Matei, F. From the Balancing Reactive Compensator to the Balancing Capacitive Compensator. Energies 2018, 11, 1979. [Google Scholar] [CrossRef]
- Qing, K.; Huang, Q.; Du, Y. Integrated Optimal Planning of Distribution Network With Geographical-Zone-Restricted Renewable Energy Sources. Front. Energy Res. 2022, 10, 864914. [Google Scholar] [CrossRef]
- Lavorato, M.; Franco, J.F.; Rider, M.J.; Romero, R. Imposing Radiality Constraints in Distribution System Optimization Problems. IEEE Trans. Power Syst. 2012, 27, 172–180. [Google Scholar] [CrossRef]
- Celli, G.; Pilo, F.; Pisano, G.; Cicoria, R.; Iaria, A. Meshed vs. radial MV distribution network in the presence of large amount of DG. In Proceedings of the IEEE PES Power Systems Conference and Exposition, 2004, New York, NY, USA, 10–13 October 2004. [Google Scholar] [CrossRef]
- Fergany, A.A.E.; Abdelaziz, A.Y. Reactive power compensation in distribution networks using cuckoo search algorithm. Int. J. Bio-Inspired Comput. 2014, 6, 230. [Google Scholar] [CrossRef]
- Xu, G.; Zhang, B.; Yang, L.; Wang, Y. Active and Reactive Power Collaborative Optimization for Active Distribution Networks Considering Bi-Directional V2G Behavior. Sustainability 2021, 13, 6489. [Google Scholar] [CrossRef]
- Valencia, A.; Hincapie, R.A.; Gallego, R.A. Optimal location, selection, and operation of battery energy storage systems and renewable distributed generation in medium–low voltage distribution networks. J. Energy Storage 2021, 34, 102158. [Google Scholar] [CrossRef]
- Home-Ortiz, J.M.; Pourakbari-Kasmaei, M.; Lehtonen, M.; Mantovani, J.R.S. Optimal location-allocation of storage devices and renewable-based DG in distribution systems. Electr. Power Syst. Res. 2019, 172, 11–21. [Google Scholar] [CrossRef]
- Luhmann, T.; Wieben, E.; Treydel, R.; Stadler, M.; Kumm, T. An Approach for Cost-Efficient Grid Integration of Distributed Renewable Energy Sources. Engineering 2015, 1, 447–452. [Google Scholar] [CrossRef][Green Version]
- Iweh, C.D.; Gyamfi, S.; Tanyi, E.; Effah-Donyina, E. Distributed Generation and Renewable Energy Integration into the Grid: Prerequisites, Push Factors, Practical Options, Issues and Merits. Energies 2021, 14, 5375. [Google Scholar] [CrossRef]
- Bocean, C.G.; Vărzaru, A.A.; Al-Floarei, A.T.; Dumitriu, S.; Diaconescu, D.L.; Barbu, M.C.R. Efficient Management of Power Losses from Renewable Sources Using Removable E.V. Batteries. Appl. Sci. 2021, 11, 6413. [Google Scholar] [CrossRef]
- Liang, L.; Luo, C. A GPU-Based Resilience Enhanced Voltage Optimization Model for Distribution Networks. Front. Energy Res. 2022, 10, 843241. [Google Scholar] [CrossRef]
- Tamilselvan, V.; Jayabarathi, T.; Raghunathan, T.; Yang, X.S. Optimal capacitor placement in radial distribution systems using flower pollination algorithm. Alex. Eng. J. 2018, 57, 2775–2786. [Google Scholar] [CrossRef]
- Sode-Yome, A.; Mithulananthan, N. Comparison of Shunt Capacitor, SVC and STATCOM in Static Voltage Stability Margin Enhancement. Int. J. Electr. Eng. Educ. 2004, 41, 158–171. [Google Scholar] [CrossRef]
- Gallego, R.; Monticelli, A.; Romero, R. Optimal capacitor placement in radial distribution networks. IEEE Trans. Power Syst. 2001, 16, 630–637. [Google Scholar] [CrossRef]
- Gil-González, W.; Montoya, O.D.; Rajagopalan, A.; Grisales-Noreña, L.F.; Hernández, J.C. Optimal Selection and Location of Fixed-Step Capacitor Banks in Distribution Networks Using a Discrete Version of the Vortex Search Algorithm. Energies 2020, 13, 4914. [Google Scholar] [CrossRef]
- Riaño, F.E.; Cruz, J.F.; Montoya, O.D.; Chamorro, H.R.; Alvarado-Barrios, L. Reduction of Losses and Operating Costs in Distribution Networks Using a Genetic Algorithm and Mathematical Optimization. Electronics 2021, 10, 419. [Google Scholar] [CrossRef]
- Montoya, O.D.; Gil-González, W.; Garcés, A. On the Conic Convex Approximation to Locate and Size Fixed-Step Capacitor Banks in Distribution Networks. Computation 2022, 10, 32. [Google Scholar] [CrossRef]
- El-Fergany, A.A.; Abdelaziz, A.Y. Capacitor placement for net saving maximization and system stability enhancement in distribution networks using artificial bee colony-based approach. Int. J. Electr. Power Energy Syst. 2014, 54, 235–243. [Google Scholar] [CrossRef]
- Prakash, K.; Sydulu, M. Particle Swarm Optimization Based Capacitor Placement on Radial Distribution Systems. In Proceedings of the 2007 IEEE Power Engineering Society General Meeting, Tampa, FL, USA, 24–28 June 2007. [Google Scholar] [CrossRef]
- Shuaib, Y.M.; Kalavathi, M.S.; Rajan, C.C.A. Optimal capacitor placement in radial distribution system using Gravitational Search Algorithm. Int. J. Electr. Power Energy Syst. 2015, 64, 384–397. [Google Scholar] [CrossRef]
- Devabalaji, K.; Yuvaraj, T.; Ravi, K. An efficient method for solving the optimal sitting and sizing problem of capacitor banks based on cuckoo search algorithm. Ain Shams Eng. J. 2018, 9, 589–597. [Google Scholar] [CrossRef]
- Ogita, Y.; Mori, H. Parallel Dual Tabu Search for Capacitor Placement in Smart Grids. Procedia Comput. Sci. 2012, 12, 307–313. [Google Scholar] [CrossRef]
- Augugliaro, A.; Dusonchet, L.; Favuzza, S.; Ippolito, M.G.; Mangione, S.; Sanseverino, E.R. A Modified Genetic Algorithm for Optimal Allocation of Capacitor Banks in MV Distribution Networks. Intell. Ind. Syst. 2015, 1, 201–212. [Google Scholar] [CrossRef]
- Cristian, D.P.; Teslovan, R.; Barbulescu, C.; Kilyeni, S.; Simo, A. PSO based OPF algorithm. In Proceedings of the Eurocon 2013, Zagreb, Croatia, 1–4 July 2013. [Google Scholar] [CrossRef]
- Cristian, D.; Barbulescu, C.; Kilyeni, S.; Popescu, V. Particle swarm optimization techniques. Power systems applications. In Proceedings of the 2013 6th International Conference on Human System Interactions (HSI), Sopot, Poland, 6–8 June 2013. [Google Scholar] [CrossRef]
- Gil-González, W.; Garces, A.; Montoya, O.D.; Hernández, J.C. A Mixed-Integer Convex Model for the Optimal Placement and Sizing of Distributed Generators in Power Distribution Networks. Appl. Sci. 2021, 11, 627. [Google Scholar] [CrossRef]
- Helmi, A.M.; Carli, R.; Dotoli, M.; Ramadan, H.S. Efficient and Sustainable Reconfiguration of Distribution Networks via Metaheuristic Optimization. IEEE Trans. Autom. Sci. Eng. 2022, 19, 82–98. [Google Scholar] [CrossRef]
- Muhammad, M.A.; Mokhlis, H.; Naidu, K.; Amin, A.; Franco, J.F.; Othman, M. Distribution Network Planning Enhancement via Network Reconfiguration and DG Integration Using Dataset Approach and Water Cycle Algorithm. J. Mod. Power Syst. Clean Energy 2020, 8, 86–93. [Google Scholar] [CrossRef]
- Montoya, O.D.; Gil-González, W.J.; Grisales-Noreña, L.F.; Giral-Ramírez, D.A.; Molina-Cabrera, A. On the optimal reconfiguration of radial AC distribution networks using an MINLP formulation: A GAMS-based approach. Ing. Investig. 2022, 42, 1–12. [Google Scholar] [CrossRef]
- Montoya, O.D. Notes on the Dimension of the Solution Space in Typical Electrical Engineering Optimization Problems. Ingeniería 2022, 27, e19310. [Google Scholar] [CrossRef]
- Montoya, O.D.; Gil-González, W. On the numerical analysis based on successive approximations for power flow problems in AC distribution systems. Electr. Power Syst. Res. 2020, 187, 106454. [Google Scholar] [CrossRef]
- Shen, T.; Li, Y.; Xiang, J. A Graph-Based Power Flow Method for Balanced Distribution Systems. Energies 2018, 11, 511. [Google Scholar] [CrossRef]
- Montoya, O.D.; Alvarado-Barrios, L.; Hernández, J.C. An Approximate Mixed-Integer Convex Model to Reduce Annual Operating Costs in Radial Distribution Networks Using STATCOMs. Electronics 2021, 10, 3102. [Google Scholar] [CrossRef]
- Vai, V.; Suk, S.; Lorm, R.; Chhlonh, C.; Eng, S.; Bun, L. Optimal Reconfiguration in Distribution Systems with Distributed Generations Based on Modified Sequential Switch Opening and Exchange. Appl. Sci. 2021, 11, 2146. [Google Scholar] [CrossRef]
Publisher’s Note: MDPI stays neutral with regard to jurisdictional claims in published maps and institutional affiliations. |
© 2022 by the authors. Licensee MDPI, Basel, Switzerland. This article is an open access article distributed under the terms and conditions of the Creative Commons Attribution (CC BY) license (https://creativecommons.org/licenses/by/4.0/).