Abstract
Motor power curves (MPCs) have received great attention for use in diagnosing the working conditions of sucker rod pumping systems (SRPSs) because of their advantages in accessibility and real-time performance. However, existing MPC-based approaches mostly need a rigorous assumption that the MPC instances of different working conditions are sufficient, which does not hold in industrial scenarios. To this end, this paper proposes an unsupervised fault diagnosis methodology to leverage readily available dynamometer cards (DCs) to diagnose collected unlabeled MPCs. Firstly, a mathematical model of the SRPS is presented to convert actual DCs to MPCs. Secondly, a novel diagnostic methodology based on adversarial domain adaptation is proposed for the problem of data distribution discrepancy across the collected and converted MPCs. Specifically, the collected unlabeled MPCs may only cover a subset of the working conditions of the abundant DCs, which will easily cause negative transfer and lead to dramatic performance degradation. This proposed methodology employs class-level and distribution-level weighting strategies so as to guide the network to focus on the instances from shared categories and down-weight the outlier ones. Validation experiments are performed to evaluate the mathematical model and the diagnostic methodology with a set of actual MPCs collected by a self-developed device. The experimental result indicates that the accuracy of the proposed algorithm can reach in diagnosing actual MPCs when only labeled DCs and unlabeled actual MPCs are used.
Keywords:
fault diagnosis; mathematical model; motor power curve; partial domain adaptation; sucker rod pump MSC:
68T07
1. Introduction
The sucker rod pump system (SRPS) is widely employed in the field of oil exploitation [1,2]. Unfortunately, due to continuous operation and harsh working environments, some components risk degradation and inevitable failure, e.g., traveling valve leakage, parting rod, etc. [3]. The common approaches to monitoring SRPSs rely on the dynamometer card (DC), which is measured by the load sensor installed on the “horse head” [4]. These DC-based methods inevitably suffer from high maintenance cost and low detection frequency, resulting in poor performance in terms of the real-time diagnosis of SRPSs.
Since the whole SPRS is driven by an electric motor, motor power curves (MPCs) show advantages in accessibility and real-time performance and have drawn increasing attention for use in the diagnosis of faults in the SPRS. The authors of [5,6] distilled features from MPCs and diagnosed faults with improved hidden conditional random fields. A condition-monitoring system based on motor power was proposed in [7]. Despite the fact that these methods have achieved outstanding performance, their successful application relies on abundant labeled data, which is an assumption that does not always hold due to the fact that MPC-based research is still in its initial stages. Some research seeks to expand MPC data by transforming the readily available DCs [8,9]. However, these approaches assume that the transformed and actual MPCs share an identical distribution, which is an assumption that does not hold due to the inevitable idealization and simplification that occurs in the transformation [10]. The distribution discrepancy, in turn, causes a serious performance degradation in the diagnosis [11]. Therefore, this paper explores how to leverage readily available DCs to achieve MPC-based diagnosis with respect to the distribution discrepancy.
Domain adaptation (DA) is famous as an efficient approach to mitigating domain discrepancy by extracting domain-invariant features [12,13,14]. Traditional DA employs the Maximum Mean Discrepancy (MMD) term as the discrepancy penalty in order to extract the domain-invariant features [15,16,17,18]. Another strand of research explores a domain discriminator to align the distributions in an adversarial manner. The authors of [19,20] used a one-dimensional convolutional neural network (1-D CNN) and a double task-specific classifier to learn domain-invariant features for fault diagnosis. A domain discriminator and MMD were exploited together via ensemble learning for feature extraction in [21,22]; they extended the adversarial network to the joint adaptation network to mitigate the distribution discrepancies in both the label and feature spaces.
In the absence of target labels, the aforementioned approaches have been demonstrated to be very effective in terms of intelligent diagnostics. Nevertheless, these methodologies restrict two domains to sharing an identical label space, which does not always hold in actual industrial applications [23]. A more general scenario is that some of the categories from the source domain do not appear in the target domain; this is referred to as partial domain adaptation (PDA) [24]. Following the objective of the standard DA methodologies, the outlier categories of the source domain are also forced to align with the target domain, which in turn causes negative transfer and misclassification [25]. A promising solution is to assign different weights to the instances that belong to different categories. The authors of [26,27] designed a multi-class adversarial loss to align instances in the shared label space. Two attention matrices were constructed to guide the model to diminish the distribution discrepancy as well as avoid negative transfer in [28]. In [29], a multi-discriminator was presented to pair the instances with the same machine conditions. The authors of [30] designed class-level and instance-level weights to alleviate the domain shift problem.
The aforementioned state-of-the-art PDA methodologies mainly focus on marginal distribution alignment in the shared label space. In this paper, we propose a conditional distribution-level weighting strategy and integrate it with the class-level weighting strategy into an adversarial approach to further mitigate the negative transfer when the categories of actual MPCs do not cover the categories of readily available DCs. The proposed weighting methodology comprehensively evaluates the weights of the samples in the source domain and seeks to further reduce the instance weight of outlier categories and highlights the instances of shared categories. Moreover, a 1-D CNN construct is conducted as the backbone of the feature generator network to extract domain-invariant features from the time-series data. The main contributions of this paper can be summarized as follows:
We construct an MPC dataset containing six categories of working conditions by conversing the DC instances with a mathematical model. The rationality of the converted MPCs is proved by comparison with the actual MPCs.
We propose to incorporate a class-level and conditional distribution-level weighting learning strategy into the adversarial domain adaptation to narrow down the discrepancies between converted and actual MPCs.
Extensive experiments are carried out on the MPCs collected by self-developed portable devices in the practical application scenario. The results demonstrate that the proposed methodology outperforms five other state-of-the-art methods in terms of diagnostic accuracy and distribution alignment.
The remaining parts of this article are organized as follows. The mathematical model for converting the DCs to MPCs is surveyed in Section 2. Section 3 describes the proposed diagnostic methodology. Section 4 shows the effectiveness of the proposed method through experimental verification. Finally, Section 5 concludes this article.
2. Conversion of the Motor Power Curves
There are insufficient fault samples for MPCs due to the fact that MPC-based research on SRPSs is in the initial stage. To address this problem, this section proposes a mechanism model that can covert the widely used DCs from different working conditions into MPCs. A typical structure of an SRPS is shown in Figure 1. When considering DCs, composed of polished load vs. movement, and MPCs, composed of power vs. time, the mathematical model implements the conversion using the following two aspects: (1) converting from movement to time by calculating the movement of the system following the order of the blue arrows in Figure 1; (2) converting from load to power by calculating the torque of the system following the order of the red arrows. A detailed discussion of the mathematical model for the SRPS is presented in this section.
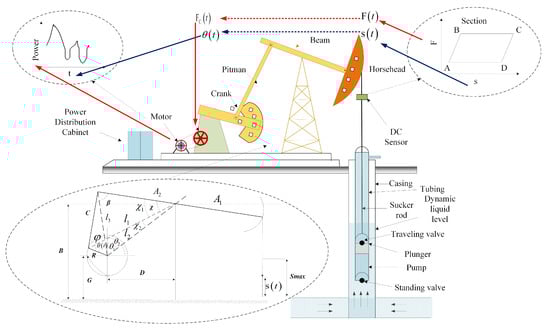
Figure 1.
Sucker rod pump system.
2.1. Movement of the System
With the help of the “four-bar” device in Figure 1, the rotational motion of the crank is converted into an up-and-down reciprocating motion of the polish rod. Based on trigonometrical considerations, the calculation of the crank angle , based on the displacement of the polished rod , can be deduced as
where and denote the angle of when the sucker rod reaches the “bottom dead point” and “top dead point”, respectively. Other variables are marked in Figure 1. By actual observation, the crank angular velocity approaches constant speed in practice. This assumption is more accurate than previous studies that treat the polished rod as a simple harmonic motion. In practical SRPS scenarios, the crank angular velocity approaches constant speed in practice. The time vs. crank angle can be calculated by
where n denotes the stroke time.
2.2. Torque Transfer of the System
The system, driven by the motor, lifts the oil from the downhole to the overground. The motor rotation torque is transmitted to the crankshaft through the gearbox and acts on the polish rod with the cooperation of the crank counterweight , the crankshaft weight , and the unbalanced weight of the travel beam . The torque of the crankshaft can be formulated as follows:
where F denotes the polished rod load, and denotes the weight radius of crankshaft. The torque factor can be obtained from mechanics as in [31]:
where and are marked in Figure 1 and expressed as
denotes the efficiency of the “four-bar” device ( when and when ).
Considering the energy loss in the gearbox and the motor, the crank toque vs. the motor power is simplified as
where denotes the motor speed, and denotes the transmission efficiency of the gearbox.
2.3. Problems in Practical Application Scenarios
With the help of the conversion mentioned above, MPCs under different working conditions are generated with abundant DCs. Nevertheless, traditional data-driven diagnostic methodologies trained with such converted curves may fail in practical application. A possible reason is that these approaches rely on a rigorous and fundamental assumption that the training and testing datasets are drawn from the same distribution with identical label spaces. This assumption does not hold in this scenario since there are many idealizations and simplifications in the above mechanistic analysis, such as constant gearbox efficiency, constant turndown rate, etc. Although these simplifications do not affect the overall performance of the converted MPCs, there are some changes in the details that result in distribution discrepancies between converted and actual MPCs.
Furthermore, since the collected MPCs are not labeled and probably do not cover all working conditions, the categories of the MPCs are likely to be a subset of the categories of the DCs with a better accumulation of historical monitoring data. An intuitive understanding of the false alignment caused by the outlier categories is shown in Figure 2. This negative effect caused by unrelated samples seriously restricts the successful application of the conventional DA-based diagnosis models.
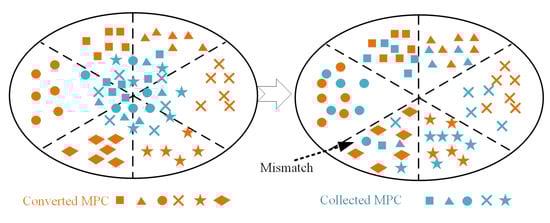
Figure 2.
Illustrations of negative transfer.
3. Diagnostic Methodology Based on Converted Motor Power Curves
To address the above dilemma, a novel partial DA-based methodology is proposed in this section to narrow down the distribution discrepancy of the converted and collected MPCs. Overall, the methodology is built upon an adversarial DA architecture. Specifically, it employs conditional distribution-level and class-level weights to prevent the negative adaptation caused by the label space mismatching.
3.1. Problem Formulation
To clearly investigate the fault diagnostic problem, several symbols and concepts are first introduced. The MPCs that are converted by labeled DCs are denoted as the source domain containing instances associated with categories of working conditions. The collected MPCs are denoted as target domain containing unlabeled samples with categories, where . can be divided into shared label space and outlier label space .
Due to the distribution discrepancy () caused by mathematical error, the diagnostic model trained on is usually not tailored for . Typical DA-based methodologies aim at exploring domain-invariant features to bridge the distribution discrepancy. Nevertheless, the negative transfer effect caused by seriously degrades performance. The goal of this section is to design a partial DA-based diagnostic methodology to discriminate and leverage the knowledge learned from to promote the diagnosis of unlabeled .
3.2. Network Architecture
The network architecture of the proposed diagnostic methodology is illustrated in Figure 3. Overall, the methodology consists of a feature generator network parameterized by , a label classifier parameterized by , a domain classifier parameterized by , a class-level attention matric , and a conditional distribution-level attention metric . To benefit from its excellent nonlinear characterization capabilities for the time-series signal, a 1-D CNN is selected as the backbone of the . Concretely, is implemented with three 1-D CNNs and one fully connected layer (FC). The and consist of one and two FCs, respectively. Moreover, batch normalization (BN) and dropout techniques are adopted to improve the generalization ability. The detailed parameters and architecture are given in Figure 4.
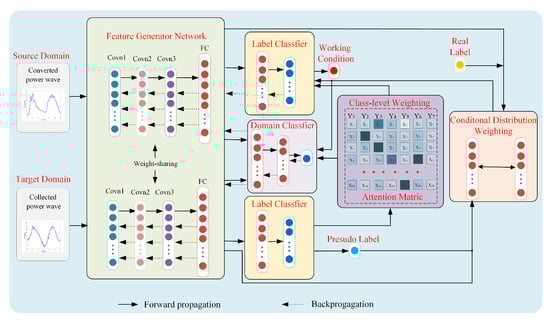
Figure 3.
The framework of the proposed approach.
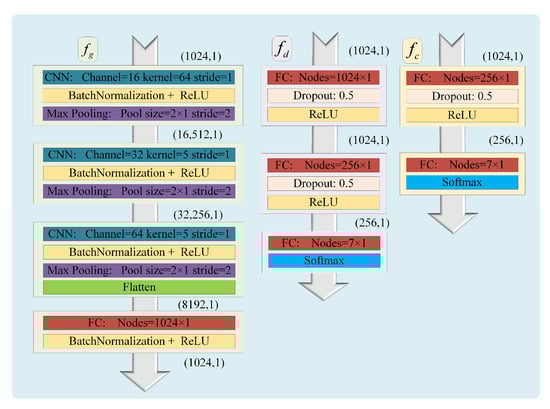
Figure 4.
The designed architecture and key parameters.
3.2.1. Domain Adversarial Learning
Inspired by GAN, DA-based methodologies bridge the gap between two domains so that the classifier trained on the source domain generalizes well to the target domain. In the traditional DA stage, is constructed to distinguish the features of the source and target domains, whereas is trained in a min-max adversarial training game to make the discriminator wrongly recognize the input of the source and target domains. The instances of and are fed into to extract the domain-invariant features. Then, the features of the source domain are sent to to ensure that it contains category information. What is more, the features of the source and target domains are contrasted with the domain classifier to avoid retaining the characteristics of domains. Training such a DA-based methodology is equivalent to calculating the following optimization formula
where denotes the cross-entropy loss function, denotes the domain label, and is a regularization parameter. As demonstrated in the first half of the optimization formula, and are updated to minimize the label loss of source samples to avoid losing label-related information during feature extraction. In the other half, is learned to maximize the domain loss so that the extracted features are as irrelevant as possible to the domain, while is trained to minimize it so that the extracted features contain more information for diagnosing class labels.
3.2.2. Weighting Learning Strategy
Theoretically, the domain shifts can be diminished by optimizing the above-mentioned objective. However, as intuitively illustrated in Figure 2, pure DA-based methods are prone to performance degeneration or even to misdiagnosis due to the outlier classes. The proposed weighting learning strategy aims to modify the above methodologies by incorporating weight metrics to indicate shared and outlier categories; this focuses on instances from and downweights instances from . The proposed weighting strategy is expected to add benefits to pure DA approaches from two perspectives: class-level weighting and conditional distribution-level weighting . Both represent the weights of source instances.
The output of can provide a category probability of the input features. Since the label space of is disjoint with , the feature values of corresponding to the categories of are relatively small. Therefore, we calculate the output probabilities of all the instance features of as follows:
where denotes the output probabilities of the ith instance in assigned to jth category. To mitigate the influence of randomness and a few mistakes, the average of the label predictions on all target data is used as the class-level weight as follows:
The class-level weight is further normalized as to demonstrate the relative importance of the classes. The weights associated with the outlier classes are expected to be much smaller than those of the shared classes, mainly because the target samples are significantly dissimilar to the samples belonging to the outlier classes.
In contrast to , is a distribution-level weight estimated by the conditional distribution discrepancy. Inspired by the index MMD that has been widely applied in transfer learning attributable to its superior capacity for characterizing distribution similarity, this paper exploits the MMD as the metric to measure the distribution discrepancy of each category as
where represents the Reproducing Kernel Hilbert Space and . It is reasonable that the corresponding to shared categories is likely to be much less than that within outlier categories. Therefore, on the basis of the MMD metrics, can be formulated as
Similar to , also needs to be normalized as .
Benefiting from and , more attention is paid to shared conditions, and the negative transfer caused by outliers will be mitigated.
3.3. Overall Objective and Training
In the training process, the proposed diagnostic methodology diminishes the distribution discrepancy of the source and target domains. Meanwhile, in order to avoid the negative transfer caused by the source outlier instances, this methodology applies the trained classifier and conditional MMD index to estimate the weight of the source data. According to Equation (7), the final objective loss function is summarized as
where and indicate loss functions of the label classifier and domain classifier, respectively. Generally, minimizing encourages the classifier to produce vectors with one dominant element denoting the label of the samples. This, in turn, enhances the performance of the feature extractor and helps to learn more transferable features for classification. Moreover, and are incorporated to highlight the importance of samples belonging to the shared classes. Meanwhile, the domain classifier is trained to minimize the to learn domain-invariant feature representations in order to confuse . What is more, a gradient reversal layer (GRL) [32] is placed before the domain classifier to receive the gradient of by multiplying a negative factor. The network is updated by employing the adaptive moment estimation optimizer (Adam) with the learning rate that is set to 0.001. The parameters , , and are updated simultaneously at each step as
4. Industrial Experiments
In this section, we validate the performance of the proposed methodology with a set of DCs and MPCs collected from wells with the same mechanical parameters. Firstly, the MPCs converted from the DCs are evaluated by mechanistic analysis in comparison with actual MPCs and some diagnostic experiments. Meanwhile, we compare the diagnostic methodology with several other popular approaches to demonstrate the effectiveness of the improvement in partial transfer scenarios.
4.1. Data Collection
The experimental platform is illustrated in Figure 5. The DCs are collected by the load and displacement sensors installed on the “horse head” over a long period of time. The voltage and current of the inverter are collected and then calculated by the chip ATT7022B to obtain the MPCs. The obtained MPCs are analyzed and stored in the intelligent automatic metrical apparatus, after which the real-time diagnostic results and historical data can be viewed through the cell phone APP.
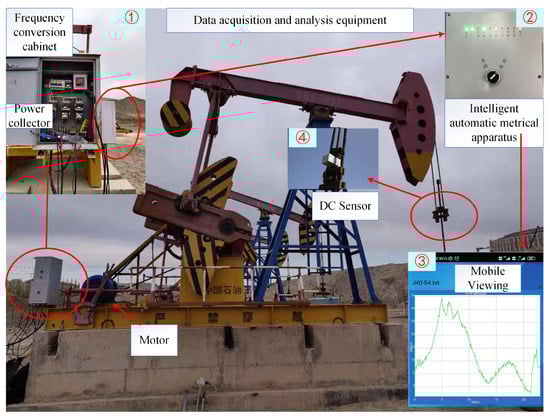
Figure 5.
Self-developed data acquisition and analysis equipment employed in the SRPS.
After long-term practice, 300 groups of MPCs are collected from seven oil wells with the same mechanical parameters, as shown in Table 1. In particular, it should be noted that these 300 instances do not contain the working condition of gas locking. However, some DCs of gas locking are collected for inverting. All simulations are implemented in the MATLAB and Pytorch frameworks and conducted on a workstation with a Core i7-9700K CPU@3.60 GHz and a GTX2080TI GPU with 11 GB memory.

Table 1.
The main parameters of the test wells.
4.2. Validation of the Converted Motor Power Curves
Employing the conversion mathematical model introduced in Section 2, the collected actual DCs, the converted MPCs, and the actual MPCs under six working conditions are listed in Figure 6, Figure 7, Figure 8, Figure 9, Figure 10 and Figure 11.
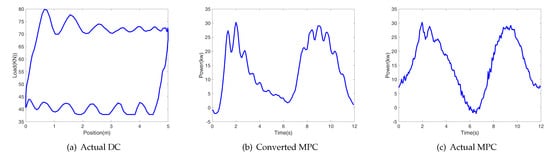
Figure 6.
Normal working state.
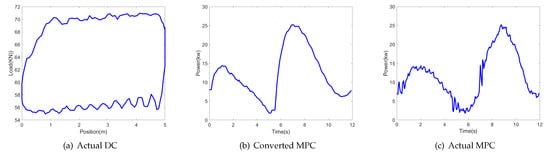
Figure 7.
Traveling valve leakage working state.
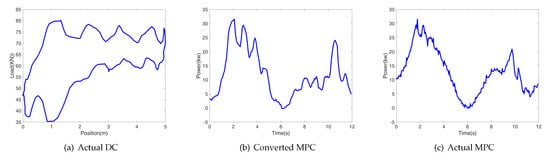
Figure 8.
Insufficient liquid supply working state.
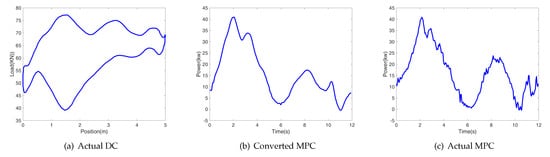
Figure 9.
Gas-affected working state.
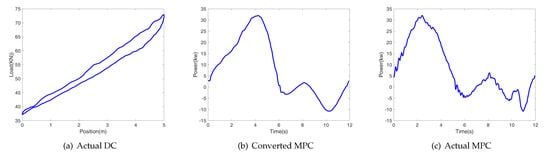
Figure 10.
Gas locking working state.
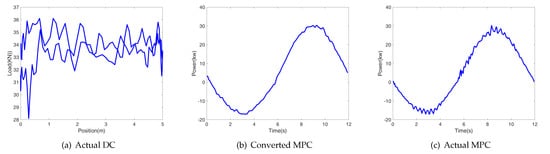
Figure 11.
Parting rod working state.
Combined with the mechanism characteristics, the analysis of the converted and actual MPCs under different working conditions is summarized as follows:
Normal working condition : Since the wells are well filled, the loads of the upstroke and downstroke are relatively balanced under the influence of the crank and unbalanced weight, resulting in similar peaks for the upstroke and the downstroke in the MPC.
Traveling valve leakage : Due to the leakage, the oil in the sucker rod leaks into the pump during the upstroke, delaying the increase of the pressure and opening the standing valve. Therefore, the power of the upstroke is less than the normal working condition, and the first peak shifts to the left.
Insufficient liquid supply : Due to the insufficient supply capacity of the oil layer, the oil cannot fill the chamber during the upstroke. During the downstroke, the oil in the sucker rod falls quickly into the chamber when the traveling valve is opened, which reduces the system load. The load increases rapidly when the plunger hits the oil interface, resulting in double peaks in the power curve. The average value of the MPC is usually lower than normal power.
Gas-affected : Similar to condition , due to the superabundant dissolving gas, the oil fills the chamber, resulting in lower average power in the downstroke. Departing from the double peaks in , the superabundant gas acts as a buffer when the traveling valve is open. Thus the power change is relatively smooth, without a rapid increase.
Gas locking : This is a special case of . The gas in the chamber makes the pressure insufficient to open the standing and traveling valves, so the oil cannot be adequately discharged. Since no oil is taken to the ground, the motor power curve has negative values during the downstroke due to the gravity of the oil in the sucker rod.
Parting rod : The motor load is mainly caused by the crank and the weight of the rod above the breakpoint. During the upstroke, the energy stored in the crank is more than the requirement to uplift the remaining rod, resulting in the apparent negative power in the MPC.
As illustrated in the above figures, the characteristics embodied in the converted MPCs under different working conditions conform to the mechanism analysis, and the converted and actual MPCs have similar trends.
In order to assure a more in-depth validity of the quantitative analysis, we select 100 samples of DCs for each working condition and convert them to the MPCs to diagnose 300 instances of actual MPCs. We conduct experiments with two different diagnostic frameworks based on CNN and 1-D CNN to verify the effectiveness of the converted MPCs from the two perspectives of time-series and image, respectively. The diagnostic results are presented in Figure 12. It can be observed that the diagnostic accuracies achieve and . It reveals that both approaches achieve overall satisfactory performance. In particular, the 1-D CNN outperforms the CNN in terms of diagnostic performance, implying that the time-series-based approach is more applicable to the MPCs than analyzing the curves as pictures. Nevertheless, these conventional diagnosis methods do not satisfy industrial demands, owing to distribution discrepancies. What is more, these methods also do not remove the interference of the outlier classes.
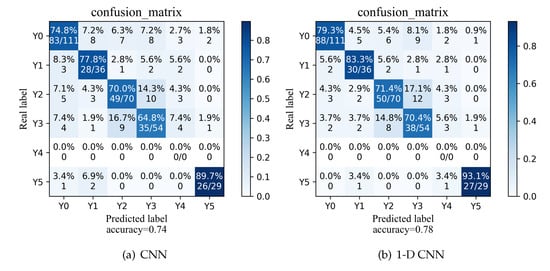
Figure 12.
The confusion matrices of diagnosis results.
4.3. Diagnosis Based on Partial Domain Adaptation
In this section, the proposed PDA-based diagnostic method is employed to minimize the distribution discrepancy across domains in practical application scenarios. Firstly, we investigate the convergence performance of the proposed method to ensure that the improved portions do not undermine its overall stability. Figure 13 plots the loss and accuracy curves with respect to training iterations. From these results, we can observe the classifier loss decreases rapidly and converges to 0. The adversarial loss oscillates reciprocally, which demonstrates that the domain classifier and the label classifier progress together and maintain relative balance. What is more, the accuracy curves ultimately approach 1, which further illustrates that the method can mitigate negative transfer efficiently and stably.
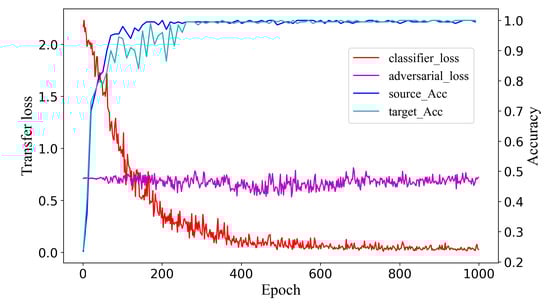
Figure 13.
The trend of training accuracy and loss for the proposed method.
Furthermore, we conduct an ablation study to examine the efficiency of each component of the weighting scheme. By reducing the weighting strategy in the model, we investigate four variants of the proposed method: the DA-based method without the weighting learning strategy, the DA-based method with class-level weighting, the DA-based method with conditional distribution-level weighting, and the proposed method containing both class-level and conditional distribution-level weighting. The results shown in Figure 14 demonstrate: (1) both the class-level weighting and conditional distribution-level weighting are essential for the good performance of the proposed method; (2) despite the fact that the conditional distribution-level weighting is inferior to class-level weighting, it can further enhance the performance of class-level weighting.
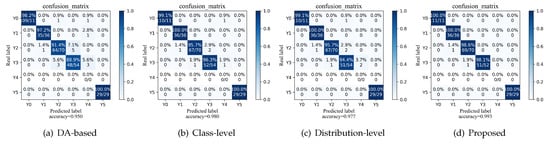
Figure 14.
Ablation study to the partial domain adaptation task.
For a more comprehensive evaluation, we compare the proposed methodology with representative DA and PDA baselines, including 1-D CNN, DANN [19], CIDA [33], WATN [26], and MWDAN [30]. We show the comparison results in Table 2 and demonstrate visual insights into the distribution discrepancy of distilled features with t-distributed stochastic neighbor embedding (t-SNE) [34] in Figure 15. In particular, the following results are the average of five rounds of experiments with random data splitting in each round. The training data and test data for each algorithm are identical.
Table 2.
Diagnosis results with different methods.
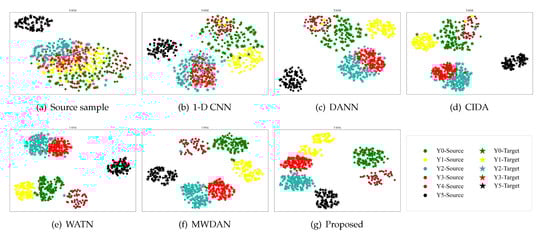
Figure 15.
T-SNE feature visualization.
From Table 2 and Figure 15, some results can be clearly determined. From Figure 15a, we observe that the source samples under various working conditions are aliased together and, thus, are difficult to distinguish. As shown in Figure 15b, the samples under different working conditions demonstrate a tendency to be gradually separable, but the aliasing phenomenon is still serious. As Figure 15c demonstrates, with the help of domain adaption, the samples from the same category are clustered, while the samples from different categories are separated. Nevertheless, we find that many target data are aligned with the source-only samples, resulting in low overall accuracy. With the help of the class-level weighting strategy in CIDA and the weighting discriminant network in WATN, the distribution alignment is improved significantly, and fewer target samples are close to the outlier category in Figure 15d,e. As shown in Figure 15f, by using both a class-level weighting strategy and a weighting discriminant network, MWDAN further separates the categories and achieves satisfactory classification performance in both the source and target domains. It shows that the superposition of these two weighting strategies can achieve better results. Comparing Figure 15f,g, we observe that the outlier classes can be better identified, and less classification confusion is obtained with the help of the proposed methodology. This reveals that the proposed conditional distribution-level weighting strategy outperforms the weighting discriminant network and can better cooperate with the class-level weighting strategy to inhibit the negative effect of irrelevant instances. Overall, these results illustrate the superior performance of the proposed methodology in handling the practical PDA problems in SRPSs.
5. Conclusions
This article proposes a PDA-based diagnostic methodology to exploit readily available DCs to implement intractable unsupervised MPC-based diagnosis in the SRPS. The proposed methodology constructs a mathematical model to convert DCs to MPCS under six working conditions. Meanwhile, a novel adversarial domain adaptation method is adopted to diminish the distribution discrepancy between converted and actual MPCs as well as to avoid negative transfer. In particular, we superpose the class-level and conditional distribution-level weights to mitigate the negative transfer caused by the inconsistent label space of MPCs and DCs. We conduct several experiments on a set of actual MPCs collected by self-developed devices for fault diagnosis. The MPCs converted by the model proposed in this paper have the same trend as the actual power, and the 1-D CNN model trained with the converted power can achieve an accuracy of in the actual MPC dataset. When leveraging the labeled converted MPCs to diagnose the actual unlabeled MPCs, the accuracy of the proposed PDA-based methodology can reach and outperform other relevant methods.
Although this diagnostic methodology achieves outstanding progress in the MPC-based diagnosis of SRPSs, there are additional works worth exploring in the future, e.g., the mathematical model of the motor and gearbox needs further refinement, the backbone of the feature generator network can be re-attempted with recurrent designs, such as RNN or LSTMs, etc. Moreover, more experiments need to be conducted on other oil wells to make the model more generalized.
Author Contributions
Conceptualization, D.H.; methodology, D.H.; software, D.H.; validation, D.H. and X.G.; formal analysis, D.H.; investigation, D.H.; resources, X.G.; data curation, D.H.; writing—original draft preparation, D.H.; writing—review and editing, D.H. and X.G.; visualization, D.H.; supervision, D.H.; project administration, X.G.; funding acquisition, X.G. All authors have read and agreed to the published version of the manuscript.
Funding
This work was supported by the National Natural Science Foundation of China (62173073).
Institutional Review Board Statement
Not applicable.
Informed Consent Statement
Not applicable.
Data Availability Statement
Not applicable.
Conflicts of Interest
The authors declare no conflict of interest.
References
- Li, K.; Han, Y.; Wang, T. A novel prediction method for down-hole working conditions of the beam pumping unit based on 8-directions chain codes and online sequential extreme learning machine. J. Pet. Sci. Eng. 2018, 160, 285–301. [Google Scholar] [CrossRef]
- Han, Y.; Li, K.; Ge, F.; Wang, Y.; Xu, W. Online fault diagnosis for sucker rod pumping well by optimized density peak clustering. ISA Trans. 2021, 120, 222–234. [Google Scholar] [CrossRef] [PubMed]
- Lv, X.; Wang, H.; Zhang, X.; Liu, Y.; Jiang, D.; Wei, B. An evolutional SVM method based on incremental algorithm and simulated indicator diagrams for fault diagnosis in sucker rod pumping systems. J. Pet. Sci. Eng. 2021, 203, 108806. [Google Scholar] [CrossRef]
- Gibbs, S. Predicting the behavior of sucker-rod pumping systems. J. Pet. Technol. 1963, 15, 769–778. [Google Scholar] [CrossRef]
- Takacs, G.; Kis, L. A new model to find optimum counterbalancing of sucker-rod pumping units including a rigorous procedure for gearbox torque calculations. J. Pet. Sci. Eng. 2021, 205, 108792. [Google Scholar] [CrossRef]
- Zheng, B.; Gao, X.; Pan, R. Sucker rod pump working state diagnosis using motor data and hidden conditional random fields. IEEE Trans. Ind. Electron. 2019, 67, 7919–7928. [Google Scholar] [CrossRef]
- Takacs, G. A critical analysis of power conditions in sucker-rod pumping systems. J. Pet. Sci. Eng. 2022, 210, 110061. [Google Scholar] [CrossRef]
- Wei, J.; Gao, X. Fault Diagnosis of Sucker Rod Pump Based on Deep-Broad Learning Using Motor Data. IEEE Access 2020, 8, 222562–222571. [Google Scholar] [CrossRef]
- Chen, L.; Gao, X.; Li, X. Using the motor power and XGBoost to diagnose working states of a sucker rod pump. J. Pet. Sci. Eng. 2021, 199, 108329. [Google Scholar] [CrossRef]
- Desbordes, J.K.; Zhang, K.; Xue, X.; Ma, X.; Luo, Q.; Huang, Z.; Hai, S.; Jun, Y. Dynamic production optimization based on transfer learning algorithms. J. Pet. Sci. Eng. 2022, 208, 109278. [Google Scholar] [CrossRef]
- Sajjad, U.; Hussain, I.; Imran, M.; Sultan, M.; Wang, C.C.; Alsubaie, A.S.; Mahmoud, K.H. Boiling Heat Transfer Evaluation in Nanoporous Surface Coatings. Nanomaterials 2021, 11, 3383. [Google Scholar] [CrossRef] [PubMed]
- Zhao, Z.; Zhang, Q.; Yu, X.; Sun, C.; Wang, S.; Yan, R.; Chen, X. Applications of Unsupervised Deep Transfer Learning to Intelligent Fault Diagnosis: A Survey and Comparative Study. IEEE Trans. Instrum. Meas. 2021, 70, 1–28. [Google Scholar] [CrossRef]
- Li, X.; Zhang, W. Deep Learning-Based Partial Domain Adaptation Method on Intelligent Machinery Fault Diagnostics. IEEE Trans. Ind. Electron. 2021, 68, 4351–4361. [Google Scholar] [CrossRef]
- Zhang, H.; Ren, H.; Mu, Y.; Han, J. Optimal Consensus Control Design for Multiagent Systems With Multiple Time Delay Using Adaptive Dynamic Programming. IEEE Trans. Cybern. 2021. [Google Scholar] [CrossRef] [PubMed]
- Wen, L.; Gao, L.; Li, X. A new deep transfer learning based on sparse auto-encoder for fault diagnosis. IEEE Trans. Syst. Man Cybern. Syst. 2017, 49, 136–144. [Google Scholar] [CrossRef]
- Li, X.; Zhang, W.; Xu, N.X.; Ding, Q. Deep learning-based machinery fault diagnostics with domain adaptation across sensors at different places. IEEE Trans. Ind. Electron. 2019, 67, 6785–6794. [Google Scholar] [CrossRef]
- Ye, Z.; Yu, J.; Mao, L. Multisource Domain Adaption for Health Degradation Monitoring of Lithium-Ion Batteries. IEEE Trans. Transp. Electrif. 2021, 7, 2279–2292. [Google Scholar] [CrossRef]
- Zhao, B.; Zhang, X.; Zhan, Z.; Wu, Q. Deep multi-scale separable convolutional network with triple attention mechanism: A novel multi-task domain adaptation method for intelligent fault diagnosis. Expert Syst. Appl. 2021, 182, 115087. [Google Scholar] [CrossRef]
- Ganin, Y.; Ustinova, E.; Ajakan, H.; Germain, P.; Larochelle, H.; Laviolette, F.; Marchand, M.; Lempitsky, V. Domain-adversarial training of neural networks. J. Mach. Learn. Res. 2016, 17, 2030–2096. [Google Scholar]
- Jiao, J.; Zhao, M.; Lin, J. Unsupervised adversarial adaptation network for intelligent fault diagnosis. IEEE Trans. Ind. Electron. 2019, 67, 9904–9913. [Google Scholar] [CrossRef]
- Li, Y.; Song, Y.; Jia, L.; Gao, S.; Li, Q.; Qiu, M. Intelligent fault diagnosis by fusing domain adversarial training and maximum mean discrepancy via ensemble learning. IEEE Trans. Ind. Inform. 2020, 17, 2833–2841. [Google Scholar] [CrossRef]
- Liu, Y.; Zhong, L.; Qiu, J.; Lu, J.; Wang, W. Unsupervised Domain Adaptation for Nonintrusive Load Monitoring Via Adversarial and Joint Adaptation Network. IEEE Trans. Ind. Inform. 2022, 18, 266–277. [Google Scholar] [CrossRef]
- Huang, T.W.; Bhat, S.A.; Huang, N.F.; Chang, C.Y.; Chan, P.C.; Elepano, A.R. Artificial Intelligence-Based Real-Time Pineapple Quality Classification Using Acoustic Spectroscopy. Agriculture 2022, 12, 129. [Google Scholar] [CrossRef]
- Yang, C.; Cheung, Y.M.; Ding, J.; Tan, K.C.; Xue, B.; Zhang, M. Contrastive Learning Assisted-Alignment for Partial Domain Adaptation. IEEE Trans. Neural Netw. Learn. Syst. 2022, 1–14. [Google Scholar] [CrossRef]
- Zhang, W.; Li, X.; Ma, H.; Luo, Z.; Li, X. Universal domain adaptation in fault diagnostics with hybrid weighted deep adversarial learning. IEEE Trans. Ind. Inform. 2021, 17, 7957–7967. [Google Scholar] [CrossRef]
- Li, W.; Chen, Z.; He, G. A Novel Weighted Adversarial Transfer Network for Partial Domain Fault Diagnosis of Machinery. IEEE Trans. Ind. Inform. 2021, 17, 1753–1762. [Google Scholar] [CrossRef]
- Kheirandishfard, M.; Zohrizadeh, F.; Kamangar, F. Class Conditional Alignment for Partial Domain Adaptation. In Proceedings of the 2020 25th International Conference on Pattern Recognition (ICPR), Milan, Italy, 10–15 January 2021; IEEE: Piscataway, NJ, USA, 2021; pp. 811–818. [Google Scholar]
- Deng, Y.; Huang, D.; Du, S.; Li, G.; Zhao, C.; Lv, J. A double-layer attention based adversarial network for partial transfer learning in machinery fault diagnosis. Comput. Ind. 2021, 127, 103399. [Google Scholar] [CrossRef]
- Han, T.; Liu, C.; Wu, R.; Jiang, D. Deep transfer learning with limited data for machinery fault diagnosis. Appl. Soft Comput. 2021, 103, 107150. [Google Scholar] [CrossRef]
- Jiao, J.; Zhao, M.; Lin, J. Multi-Weight Domain Adversarial Network for Partial-Set Transfer Diagnosis. IEEE Trans. Ind. Electron. 2022, 69, 4275–4284. [Google Scholar] [CrossRef]
- Zheng, B.; Gao, X.; Li, X. Fault detection for sucker rod pump based on motor power. Control Eng. Pract. 2019, 86, 37–47. [Google Scholar] [CrossRef]
- Ganin, Y.; Lempitsky, V. Unsupervised domain adaptation by backpropagation. In Proceedings of the International Conference on Machine Learning (PMLR), Lille, France, 7–9 July 2015; pp. 1180–1189. [Google Scholar]
- Jiao, J.; Zhao, M.; Lin, J.; Ding, C. Classifier inconsistency-based domain adaptation network for partial transfer intelligent diagnosis. IEEE Trans. Ind. Inform. 2019, 16, 5965–5974. [Google Scholar] [CrossRef]
- Van der Maaten, L.; Hinton, G. Visualizing data using t-SNE. J. Mach. Learn. Res. 2008, 9, 2579–2605. [Google Scholar]
Publisher’s Note: MDPI stays neutral with regard to jurisdictional claims in published maps and institutional affiliations. |
© 2022 by the authors. Licensee MDPI, Basel, Switzerland. This article is an open access article distributed under the terms and conditions of the Creative Commons Attribution (CC BY) license (https://creativecommons.org/licenses/by/4.0/).