Article

Machinery Lean Manufacturing Tools for Improved Sustainability: The Mexican Maquiladora Industry Experience

by
Jorge Luis García Alcaraz
1,*,
Adrián Salvador Morales García
2,
José Roberto Díaz Reza
2,
Julio Blanco Fernández
3,
Emilio Jiménez Macías
4,* and
Rita Puig i Vidal
5,*
1
Department of Industrial Engineering, Autonomous University of Ciudad Juárez, Ciudad Juárez 32310, Mexico
2
Department of Electrical Engineering and Computer Sciences, Autonomous University of Ciudad Juárez, Ciudad Juárez 32310, Mexico
3
Department of Mechanical Engineering, University of La Rioja, 26004 Logroño, Spain
4
Department of Electric Engineering, University of La Rioja, 26006 Logroño, Spain
5
Department of Computer Science and Industrial Engineering, University of Lleida, 08700 Igualada, Spain
*
Authors to whom correspondence should be addressed.
Mathematics 2022, 10(9), 1468; https://doi.org/10.3390/math10091468
Submission received: 7 March 2022 / Revised: 12 April 2022 / Accepted: 19 April 2022 / Published: 27 April 2022

Abstract

:
This paper reports a structural equation model (SEM) to quantify the relationship between Lean Manufacturing (LM) tools associated with machinery and sustainability. The LM tools are independent variables and include Total Productive Maintenance (TPM), Jidoka, and overall equipment effectiveness (OEE), whereas dependent sustainability variables comprise environmental, social, and economic sustainability. The SEM proposes ten hypotheses, tested statistically using information from 239 responses to a questionnaire applied to the Mexican maquiladora industry and the Partial Least Squares (PLS) technique for quantifying relationships among variables. Additionally, we discuss conditional probabilities to explain how low and high levels of TPM, Jidoka, and OEE impact sustainability. Findings reveal that TPM, Jidoka, and OEE directly impact social, environmental, and economic sustainability, thus indicating that safe workplaces improve employee commitment, safety, delivery time, and morale.
MSC:
62J05; 00A71; 90-10; 62H25

1. Introduction

Economic globalization forces companies to be geographically closer to their customers, and a common strategy is to establish subsidiary companies in other countries. In Mexico, these subsidiary manufacturing companies, also known as maquiladoras, play a key economic role. These maquiladoras are usually located on the northern borderlines of Mexican territory, which makes them particularly close to the US, the most prominent world market. Additionally, the current trade agreement among Mexico, the US, and Canada allows the Mexican maquiladora industry to take advantage of the low regional labor costs and tariff rates for importing raw materials from these countries and exporting final products.
The importance of the Mexican maquiladora industry can be explained in numbers. From January to November 2020, Mexican maquiladora imports totaled USD 217,053 million, whereas exports totaled USD 235,493 million. Specifically, Chihuahua state was responsible for 12% of these nationwide values (USD 26,046 and USD 28,259 million in imports and exports, respectively) thanks to the remarkable industrial activity of Ciudad Juárez, its borderline city, which generated 75% of the total imports and exports of the state and 9% of the nationwide values (USD 19,535 and USD 21,194 million in imports and exports, respectively) [1].
Moreover, the Mexican maquiladora industry has an important social impact. In December 2020, it provided 2,695,964 direct jobs nationwide: 498,598 were offered in Chihuahua state (18.04% of the nationwide total) and 323,391 in Ciudad Juárez (66.46% of statewide total and 12% of nationwide) [1,2]. These direct jobs were offered by 5153 companies across the country, 495 of which were located in Chihuahua state (9.6% of the nationwide total), with 332 of these in Ciudad Juárez (6.44% nationwide and 67.07% statewide) [3].
Maquiladora production systems have high technology and optimizing production methodologies, such as Lean Manufacturing (LM). LM is defined as a set of tools focused on minimizing waste generation and activities that do not add value to products [4]. In this sense, some Lean Manufacturing Tools (LMTs), such as Total Productive Maintenance (TPM), Jidoka (JID), and Overall Equipment Efficiency (OEE) [5], have been specifically designed to keep manufacturing machines and equipment in optimal operating condition.
Over the years, LM has been studied from various sustainability standpoints across countries and industries, but not in the Mexican maquiladora sector. For instance, in their literature review of LM, six sigma (SS), and sustainability integration, Cherrafi et al. [6] report that only six papers have sought to link these production strategies with sustainability in countries such as the UK, Spain, New Zealand, and Sweden. Younus et al. [7] also studied the effects of LM, SS, and sustainability in small and medium companies in Pakistan using the Spearman coefficient, indicating a significant relationship among these variables. Additionally, Palange and Dhatrak [8] found that LM is a vital methodology for increasing India’s economic sustainability and productivity in manufacturing systems.
However, LM comprises a wide set of tools, such as Just in Time (JIT) [9,10] and kaizen [11], and some research generalizes its concept. In terms of sustainability, the role of certain LMTs is vastly studied around the world. For instance, Green et al. [12] conducted research on the effect of JIT and Total Quality Management (TQM) on environmental sustainability, whereas Sahoo [13] related JIT and TQM to operational and economic performance. Similarly, Jahangir et al. [14] analyzed the effects of TPM and human resources on organizational sustainability, generalizing the concept of LM.
Moreover, Samadhiya and Agrawal [15] highlighted TPM as a critical tool for guaranteeing material flow and sustainability, while Chen et al. [16] found that TPM is vital for economic and environmental sustainability; however, they did not analyze social sustainability. Gungor and Evans [17] identified TPM as a vital metric for economic sustainability. Yazdi et al. [18] linked OEE to operational sustainability and considered it essential for migration to industry 4.0. Cercós et al. [19] linked OEE to CO2 emissions, and Romero et al. [20] found that Jidoka and automation strategies in machinery help to avoid human errors, thus favoring sustainability by minimizing the reprocessing of faulty products.
Despite the importance of the maquiladora industry in Mexico, few studies have analyzed its environmental impact, and Velázquez et al. [21] were the first to explore maquiladora sustainability from an economic point of view. Years later, Velazquez et al. [22] analyzed the ability of electrical and electronic maquiladoras to generate clean production and prevent pollutant emissions. From a similar perspective, Díaz-Reza et al. [23] examined the Single Minute Exchange of Die methodology (SMED) and the benefits obtained by maquiladoras from implementing it, reporting economic and operational sustainability as the most important.
More recently, Arredondo-Soto et al. [24] analyzed how machinery and equipment calibration can reduce costs and increase economic sustainability. Recently, García-Alcaraz et al. [25] reported the relationship between improvement techniques such as kaizen, Gemba, and some visual LM tools with economic sustainability in maquiladoras established in Ciudad Juarez (Mexico). In conclusion, there is evidence that LMTs are related to sustainability, but the experience of Mexican maquiladora is not reported in depth.
TPM, Jidoka, and OEE as LM tools are ignored in several reports from Mexican maquiladora, but they have been proven to support the production process and make it more sustainable. Frequently, they are analyzed from economic and productivity perspectives. However, many studies consider sustainability as a global construct in the industry and with three dimensions—environmental, economic, and social [26]—and this means that several analyses and literature reports may be reductionist and incomplete.
Despite the social and economic importance of the maquiladora industry in Mexico, no formal studies have yet been conducted to report the link between LMTs for machinery and the sustainable benefits gained. To address this gap, we report a structural equation model to quantify the relationships between three LMTs—TPM, JID, and OEE—and sustainability across its three dimensions: environmental sustainability (EnS), social sustainability (SoS), and economic sustainability (ECs). Our model integrates the three LMTs as the independent variables, whereas the dependent variables refer to the three sustainability dimensions. The main goal is to quantify and test the relationships between those LMTs associated with machinery management and sustainability, testing it statistically with real information obtained from the Mexican maquiladora industrial sector.
The main contribution of this paper is that it interrelates three LMTs and analyzes sustainability in its dimensions (social, environmental, and economic). Additionally, we report conditional probabilities to analyze how low and high TPM, JID, and OEE implementation enables or hinders sustainability, and this kind of analysis has never been reported for these variables. Additionally, our results will support managerial decisions for better resource allocation when using specific LM tools associated with machinery management and depending on an enterprise’s objectives.
The remainder of this paper is structured as follows. Section 2 introduces a literature review on LMTs and sustainability, identifies gaps in previous reports, and justifies this research. Then, Section 3 describes each LMT studied in terms of independent variables and sustainability dimensions and explains the hypotheses to be tested. Next, Section 4 describes the methodology, Section 5 reports findings, and Section 6 introduces the conclusions from the model and the conditional probability analysis. Finally, Section 7 lists some research limitations and suggests directions for future work.

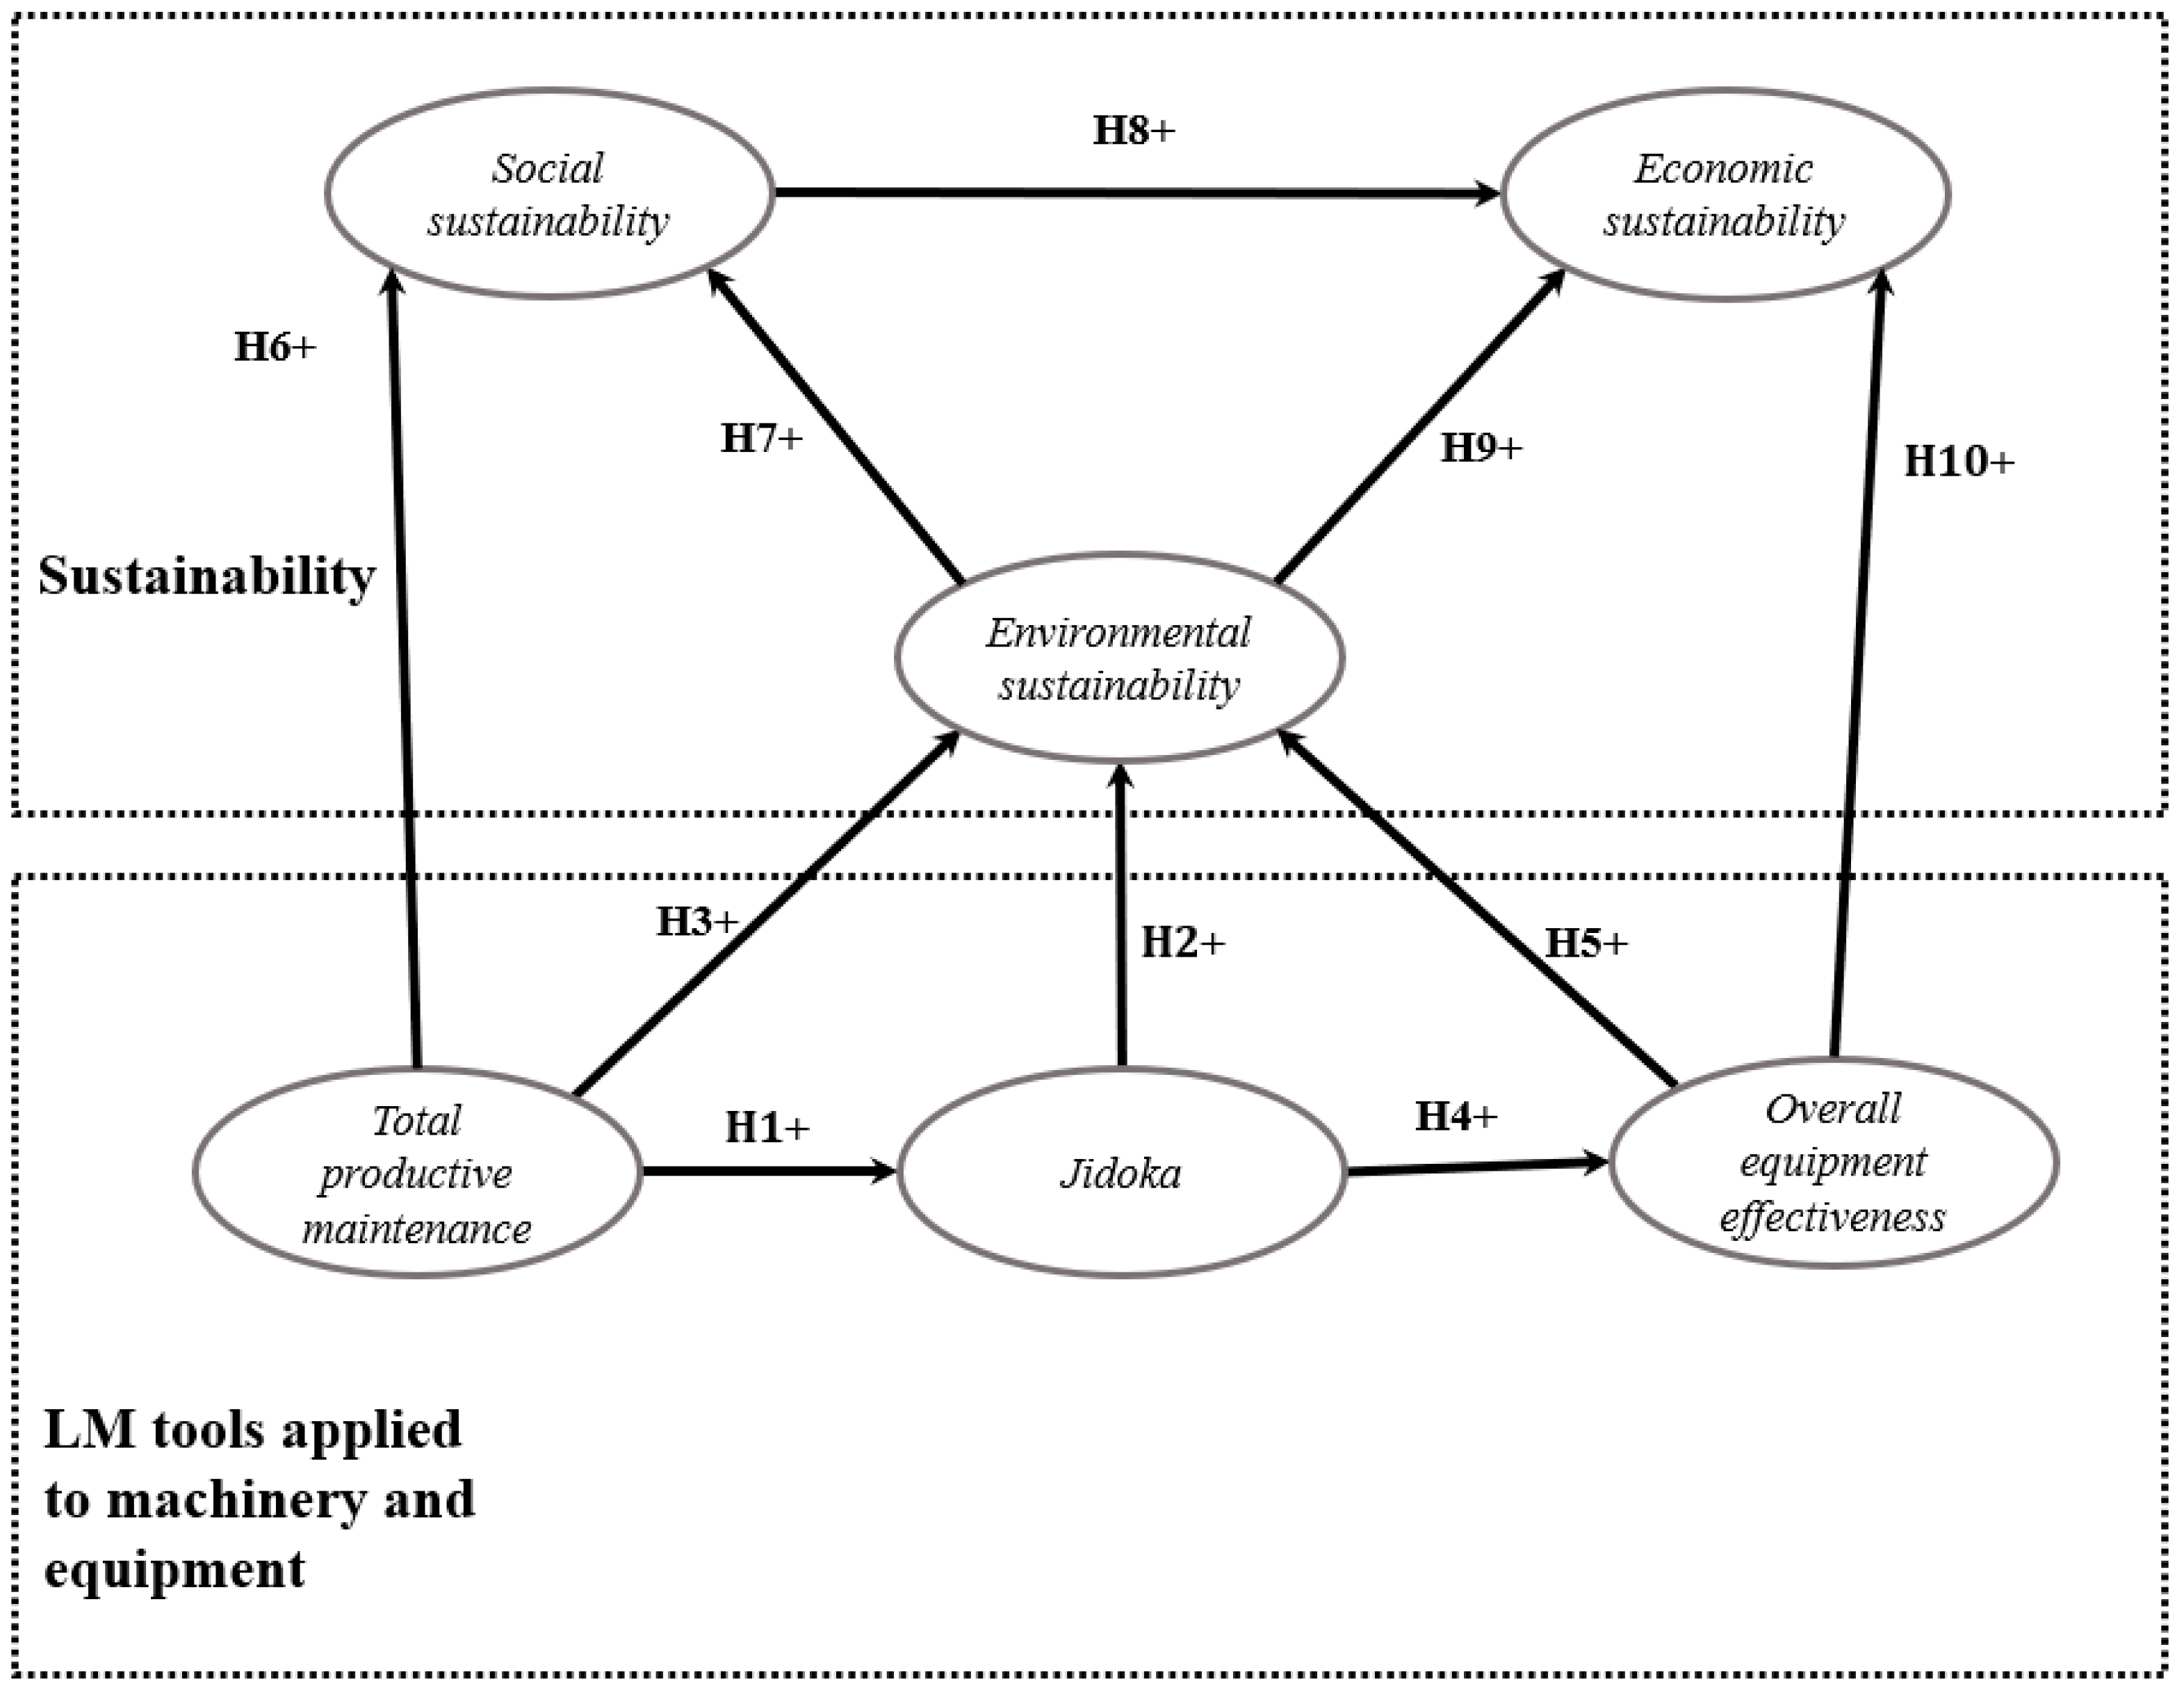
2. Latent Variables and Hypotheses

2.1. Total Productive Maintenance (TPM)

TPM is an LMT aimed at keeping machinery and tools continuously operational to prevent production flow disruptions that may arise from a lack of calibration and product defects, thus reducing downtimes and minimizing occupational accidents [27]. Kaczmarek [28] and Samadhiya and Agrawal [15] have discussed the TPM integration into green production benefits and EnS, concluding that companies achieve high sustainability levels and productivity rates when it is implemented. To measure TPM implementation in maquiladoras, we considered the following aspects: machine availability, frequency of inspections by operators and maintenance staff, and workplace cleanliness.

2.2. Jidoka (JID)

JID focuses on checking that production processes are self-monitored and indicates when product specifications are not met. Thus, JID helps to prevent manufacturing products without the required quality. However, production stoppages are also a common problem, and JID uses another LMT to solve it: Root Cause Analysis (RCA) [20]. Moreover, JID implementation is usually measured by five aspects: (1) whether JID machinery identifies errors, (2) whether it flags when a product does not meet quality requirements and (3) stops production, (4) whether automation levels enable a single operator to control two or more machines, and (5) whether machinery works autonomously, and it is only supervised by operators.
It is assumed that TPM in machines directly affects their ability to detect errors. As Arredondo-Soto, Cruz-Castillo, Carrillo-Gutierrez, Solis-Quinteros, and Avila-Lopez [24] indicate, machinery calibration helps to reduce failures and high operating costs and prevents faulty products. Similarly, Schindlerová, Šajdlerová, Michalčík, Nevima, and Krejčí [27] consider TPM as a pillar for increasing overall efficiency since daily cleaning operations ensure the reliability of industrial machinery. From this discussion, we propose our first research hypothesis as follows:
Hypothesis 1 (H1).
In the maquiladora industry, Total Productive Maintenance has a positive and direct effect on Jidoka.

2.3. Environmental Sustainability (EnS)

EnS refers to the responsible management of resources in production processes to not compromise the needs of future generations [29]. Maquiladora industries contribute to EnS by investing in solid, liquid, and gas waste management programs. They also analyze energy wasted in production and manage their use of hazardous materials [30].
JID supports the EnS of production systems, especially to avoid the costs and waste from reprocessing faulty products [31]. Defective products affect the reputation of world-class companies [32] since they are responsible for the costs incurred in warranty issues, customer service, transportation, repairs, and returns to customers [33].
Since maquiladoras generally export their products, the environmental impact of products returned to the manufacturer in globalized supply chains is very high. This negative impact can be mitigated by implementing JID to avoid sending defective products to the final customer, who finally needs to return them from long distances or apply for warranties (usually in other countries because maquiladora exports all products). Thus, our second research hypothesis is as follows:
Hypothesis 2 (H2).
In the maquiladora industry, Jidoka has a positive direct effect on Environmental Sustainability.
The maquiladora industry recognizes that product quality stems from plans and programs, and that people, machinery, and process improvement is the way to achieve it. When one of these elements fails, quality is compromised. For example, poorly calibrated machines generate products that do not meet technical specifications [12] and must be reprocessed, adding costs in labor and energy power. Additionally, sometimes, it is necessary to discard product components without recycling parts, which become scrap [34], being wasted directly and sent to landfill. In this sense, Durán and Durán [35] highlight the need to prioritize TPM programs to ensure sustainability, and Samadhiya and Agrawal [15] consider comprehensive TPM programs as a required source for EnS. From this discussion, the third research hypothesis is as follows:
Hypothesis 3 (H3).
In the maquiladora industry, Total Productive Maintenance has a positive direct effect on Environmental Sustainability.

2.4. Overall Equipment Effectiveness (OEE)

In the LM context, OEE provides a metric that integrates machinery availability and efficiency with product quality [36]. OEE implementation in the maquiladora industry can be measured by considering factors such as production output, machine stoppages due to breakdowns, and the time required to solve them [23]. Additionally, as a metric, OEE is affected by other LMTs in production lines, such as SMED and JID. If machine breakdown stoppages are avoided or minimized, machinery availability consequently increases. Moreover, when off-spec products are detected and removed from the production line, the product level increases with availability [37]. From this perspective, the fourth research hypothesis is proposed as follows:
Hypothesis 4 (H4).
In the maquiladora industry, Jidoka has a positive direct effect on Overall Equipment Effectiveness.
High machine availability usually implies a good level of TPM, and high effectiveness and performance of quality parts increase OEE. However, if products fail to meet the required quality, they are likely to be returned by customers. In this sense, reverse logistics carries its environmental impact [18] and costs, especially from reprocessing and energy consumption [33]. Thus, the following research hypothesis is proposed below:
Hypothesis 5 (H5).
In the maquiladora industry, Overall Equipment Efficiency has a positive direct effect on Environmental Sustainability.

2.5. Social Sustainability (SoS)

SoS promotes employee well-being while simultaneously supporting the ability of future generations to maintain a healthy community [38]. Additionally, SoS is linked to other types of sustainability, such as EnS and EcS [39], especially as a background for financial performance [40]. In this study, we measure the presence of SoS in the maquiladora industry by analyzing labor conditions, perceived workplace safety, health services, employee morale and motivation, performance, and sense of belonging [41].
According to Marhavilas et al. [42] and Evangelinos et al. [43], employee health and safety are linked to SoS levels in international companies. In 2020, the maquiladora industry in Ciudad Juárez spent USD 423.4 million in employee benefits and paid a similar amount in health insurance. TPM contributes to SoS in many forms; first, it helps companies to ensure that machines and tools operate in optimal conditions, thus reducing the risks of accidents and increasing safety and motivation [44,45]. Additionally, according to Lingappa et al. [46], adequate employee training increases employee motivation. From this discussion, the sixth research hypothesis is as follows:
Hypothesis 6 (H6).
In the maquiladora industry, Total Productive Maintenance has a positive direct effect on Social Sustainability.
This research assumes that environmental and social indicators influence economic indicators. According to Sarkar et al. [47], employee motivation and sense of belonging increase when employees feel that their company is concerned about their safety and well-being (especially under hazardous circumstances) and that it strives to reduce its environmental footprint (e.g., through appropriate waste management programs) [48]. Additionally, Alsayegh, Rahman, and Homayoun [39] and ul Haq and Boz [49] used the Spearman coefficient to demonstrate that SoS and EnS are interrelated in the manufacturing and tea industries, respectively, and Malak-Rawlikowska et al. [50] also conducted a similar study in food supply chains. Following this discussion, our seventh research hypothesis is proposed below:
Hypothesis 7 (H7).
In the maquiladora industry, Environmental Sustainability has a positive direct effect on Social Sustainability.

2.6. Economic Sustainability (EcS)
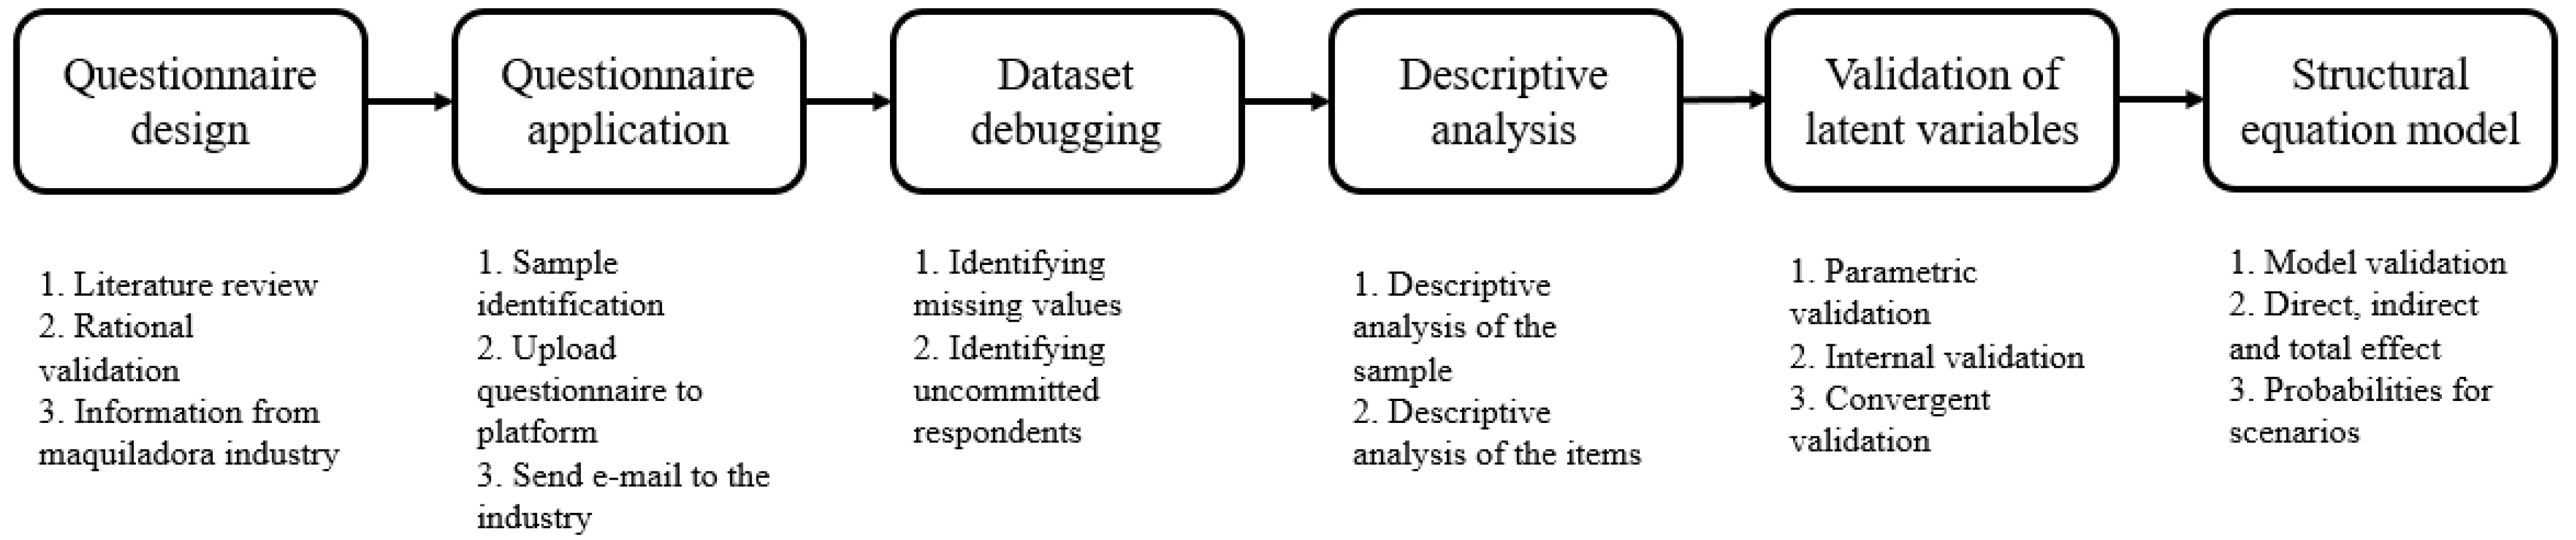
EcS is defined as a set of strategies for optimally using, safeguarding, and maintaining human and material resources to create a responsible, and preferably indefinite, balance in the long term [51]. The importance of EcS lies in the fact that it is the basis for company permanence in the market; hence, organizations traditionally focus on reducing production costs, new product development, energy consumption, inventory management, and waste treatment [52].
Several corporate factors support EcS indicators. Sarkar, Azim, Asif, Qian, and Peau [47] claim that SoS is one of the most important factors, whereas Tomšič et al. [53] particularly emphasize corporate sustainability. In other words, investing in human resources to ensure the welfare of personnel is tantamount to indirectly investing in the company itself [54]. In this sense, Dhahri et al. [55] indicate that the behavior of leaders and employees must be pushed toward achieving EcS goals, and the best way to accomplish this is by motivating them with achievement bonuses and rewards for compliance and punctuality. Reward schemes contribute to healthy work environments, where employees feel comfortable and more productive [56], make good use of resources, propose improvements, and operate machines responsibly. It reduces waste, reprocessing, and energy costs [57]. However, it is worth noting that to guarantee EcS, employees must be given education and training [58]. Based on the above, the next research hypothesis is proposed:
Hypothesis 8 (H8).
In the maquiladora industry, Social Sustainability has a positive direct effect on Economic Sustainability.
Another pillar of EcS is corporate compliance with government regulations, which prevents companies from enduring administrative and financial penalties [29] and thus incurring unnecessary costs because their solid, liquid, and gaseous pollutant emissions harm the environment. Such environmental aspects must always be assessed from an economic point of view, as indicated by Malik et al. [59], given the high costs for their treatment. In conclusion, companies that do not minimize their pollutants will consequently increase waste treatment costs and possibly government fees. From this discussion, the ninth proposed research hypothesis is as follows:
Hypothesis 9 (H9).
In the maquiladora industry, Environmental Sustainability has a positive direct effect on Economic Sustainability.
OEE has three main components—equipment availability, efficiency, and quality—directly affecting EcS [36]. If machines are unavailable when required, companies lose production orders or have insufficient output and excessive machinery downtime. In such cases, return on investment could never be fast. Additionally, if product quality is not sufficient, there will be a significant amount of reprocessing and waste, with the subsequent expense in human resources and energy [18]. For Badiger and Gandhinathan [60], low OEE affects the production capacity of any company and, from this perspective, the tenth and last research hypothesis is as follows:
Hypothesis 10 (H10).
In the maquiladora industry, Overall Equipment Efficiency has a positive direct effect on Economic Sustainability.
Figure 1 shows the model of the hypotheses previously discussed.

3. Methodology

The methodology used to achieve our research goal comprises six main stages, as illustrated in Figure 2 and defined below.

3.1. Survey Design

To test the hypotheses in Figure 1, we designed a survey based on a literature review of LMTs and sustainability in the manufacturing/maquiladora industry and it represented the rational validation of the survey, because items are based on previous research studies [61]. However, we also sought to adapt these items to the geographical and industrial context to be studied: the maquiladora industry in Mexico.
Once the first draft of the survey was devised based on the literature review, it was reviewed by 14 matter experts (i.e., six academics and eight engineers working in the maquiladora industry) to validate the survey. These peers assessed the clarity, congruence, and wording to ensure that the survey was clear, coherent, and understandable to the respondents. After two rounds of peer review, the final version of the survey was built, containing three sections. The demographic data section gathered information on respondent gender, years of work experience, company industrial sub-sector, and company size. The LMT section sought to examine the actions taken by the surveyed companies when implementing TPM (seven items), JID (five items), and OEE (five items). Finally, the sustainability section comprised questions seeking to explore the extent to which companies take sustainability actions in three aspects: EnS (six items), SoS (six items), and EcS (eight items).
The second and third sections of the survey were answered using a five-point Likert scale similar to that proposed by Morales García et al. [62]. The scale reads as follows: 1 = this action is never taken; 2 = this action is rarely taken; 3 = this action is sometimes taken; 4 = this action is frequently taken; and 5 = this action is always taken.

3.2. Survey Administration

Due to the global confinement caused by the COVID-19 pandemic crisis, we administered the survey electronically via a specialized platform (i.e., SurveyMonkey) from 15 May to 15 August 2020. We set all the survey questions or items as mandatory to avoid missing values. We defined the research sample with support from the Manufacturing, Maquiladora, and Export Services Industry agency (IMMEX, by its Spanish acronym). The sample comprised managers from manufacturing, production, maintenance, and supply chain departments from Mexican maquiladoras. We emailed these potential respondents to invite them to participate in the study. The emailed invitation included a brief explanation of our research purpose and the link to the electronic survey. If any potential respondent failed to answer after 15 days of the first invitation, we emailed them another invitation. We discarded the case if they still did not respond within 15 days of the second invitation. Regarding the sample inclusion characteristics, the respondents were required to have at least two years of experience in their current managerial position, although they were optionally asked to indicate their immediate previous position and cumulative years of experience.

3.3. Database Screening

Once the survey administration period ended, we downloaded the electronic database containing the collected survey data from the SurveyMonkey platform. We debugged on SPSS v.25 the database in two steps [63]:
  • Identify extreme values or outliers. We standardized each item from survey Section 2 and Section 3. Absolute values higher than 4 were considered outliers and replaced by the median.
  • Identify uncommitted respondents. We calculated the standard deviation of each case for Section 2 and Section 3 of the survey. Values lower than 0.5 indicated little commitment from respondents, which were removed from further analysis.

3.4. Descriptive Analysis of the Sample and the Data

We built cross-tables with the screened database to describe the sample more easily. As for the univariate descriptive analysis (i.e., data from survey Section 2 and Section 3), we reported the median of each item as a measure of central tendency since the data were obtained from a Likert scale. High median values indicated that, on average, and according to the respondents, a given LMT or sustainability action was always taken in their companies; meanwhile, low median values indicated that, on average, and according to the respondents, a given LMT or sustainability action was never taken in their companies. We calculated the interquartile range (difference between the third and first quartiles) of each survey item as a distribution measure. High values were interpreted as a lack of consensus among the respondents concerning the mean value of a given item. Conversely, low values denoted a high degree of consensus among the respondents concerning the mean value of a given item.

3.5. Validation of Latent Variables

Our model comprised six latent variables: three related to LMTs (i.e., TPM, JD, OEE) and three associated with sustainability (i.e., SoS, EnS, and EcS). We validated these six variables using the following indices [64]:
  • R squared (R2) and Adjusted R2. Determine the parametric predictive validity of each latent dependent variable. Only values higher than 0.02 are accepted.
  • Composite reliability index and Cronbach’s alpha. Measure the internal validity of all latent variables. Only values higher than 0.7 are accepted.
  • Average Variance Extracted (AVE). Determines convergent validity. Values higher than 0.5 are desired.
  • Variance Inflation Factors (VIF). Measure collinearity among latent variables. Only values lower than 3.3 are accepted.
  • Q squared (Q2). Measures the non-parametric predictive validity of dependent variables. Only values higher than 0 and similar to their corresponding R2 values are accepted.
In some cases, to obtain the Cronbach’s alpha index’s desired value, we used several iterations to remove certain items from the latent variables or constructs. This is why not all the items in the survey appear in the structural equation model, i.e., some were removed during the construct validation process.

3.6. Structural Equation Model

We applied the Partial Least Squares in Structural Equation Modeling (PLS-SEM) technique to test the research hypotheses proposed in Figure 1. Kock [65] recommends this technique when (1) analyzing data with small samples, (2) the items do not have a normal distribution, and (3) the data are obtained on a Likert scale. Additionally, Hair et al. [66] state that PLS-SEM does not require rigorous adherence to parametric statistical assumptions and can be used in exploratory analyses. PLS-SEM has been accepted and reported in several studies; for example, Garcia-Alcaraz et al. [67] use it to analyze the impact of information technologies on economic supply chain performance, and it has also been used to obtain the benefits offered by JIT [9].
We assessed the structural equation model (SEM) with WarpPLS v.7 software. We chose it to report a regression coefficient β between the related variables (i.e., dependent, and independent). Moreover, the model as a construct was tested at a 95% confidence level and using the following efficiency indexes [68]:
  • Average Path Coefficient (APC) measures the average efficiency of the regression values in the model. Its associated p-value must be lower than 0.05.
  • Average R2 (ARS) and Average Adjusted R2 (AARS) measure the model’s predictive validity, and their associated p-values must be lower than 0.05.
  • Average block VIF (AVIF) and average full collinearity VIF (AFVIF) measure collinearity between latent variables and the common method bias (CMB) estimator [69], and associated values must be lower than 3.3.
  • Tenenhaus GoF (GoF) measures the fit between the data and the model. The associated value must be higher than 0.36.
Usually, if an SEM shows collinearity problems or the model reliability levels are not met, iterations are performed until the desired index values are achieved. In such cases, conflictive items are thus eliminated from the latent variables. We also calculated additional validation indices, including critical T ratios for path coefficients and their confidence intervals; loadings, their T ratios, and confidence intervals; PLSc reliabilities (Dijkstra’s rho) and additional rates (indicator correlation matrix fit); additional reliability coefficients and correlations between latent variables with square roots of AVEs; and HTMT ratios for discriminant validity. For further information on these additional indices, refer to the Supplementary Materials.

3.6.1. Hypothesis Validation

Once we successfully tested and validated the latent variables and the model, we interpreted the direct effects of each model hypothesis. Each of these direct effects is associated with standardized regression coefficient β to test the null hypothesis (H0 β = 0) against the alternative hypothesis (H1: β ≠ 0) [68]. If β = 0, it indicates that, statistically, there is no direct relationship between the latent variables involved in each relationship. Conversely, β ≠ 0 (regardless of the sign) indicates a relationship (either positive or negative) between the latent variables involved in each relationship. The value of β indicates the intensity of change between these latent variables and is expressed in standard deviations (SD). Similarly, each effect is associated with an effect size (ES) to measure the percentage of variance in the latent dependent variable explained by the latent independent variable. We tested all the direct effects at a 95% confidence level.

3.6.2. Sum of Indirect Effects and Total Effects

Two latent variables may be related indirectly through additional latent variables, known as mediators. This study reports the sum of indirect effects for each relationship between latent variables. Once more, we tested the null hypothesis (H0: β = 0) against the alternative hypothesis (H1: β ≠ 0). All the relationships were tested at a 95% confidence level and were thus associated with a p-value [68]. In these relationships, we also reported the effect sizes (ES). Finally, we calculated and tested the total effects in each relationship. These total effects are simply the sum of those direct and indirect effects.

3.6.3. Probabilities of Low and High LM Implementation

WarpPLS v.7 analyzes standardized values for items and parameters, allowing us to estimate probabilities for specific scenarios. In this study, we calculated the probability for a variable to occur independently, jointly, or conditionally. As for the scenarios in which these variables may occur, we discuss high implementation scenarios if P(Z > 1) and low implementation scenarios if P(Z < 1) [68].
On the one hand, joint probabilities are represented by “&,” and the following scenarios were estimated: P(Zi > 1) ∩ P(Zd > 1), P(Zi > 1) ∩ P(Zd < −1), P(Zi < −1) ∩ P(Zd > 1), and P(Zi < −1) ∩ P(Zd < −1). On the other hand, for conditional probabilities, we estimated scenarios P(Zd > 1)/P(Zi > 1), P(Zd > 1)/P(Zi < −1), P(Zd < −1)/P(Zi > 1), and P(Zd < −1)/P(Zi < −1), where Zi represents a standardized independent variable and Zd stands for a standardized dependent variable. Finally, we granted particular attention to conditional probabilities in which the high implementation scenario of a given variable can consequently affect other scenarios. This information is particularly useful to managers and other decision-makers to be aware of the risks that can potentially occur in terms of sustainability under adverse scenarios.

4. Results

4.1. Descriptive Analysis of the Sample and the Items

We collected 257 surveys from the maquiladora industry, but 18 were identified as uncommitted responses and eliminated. Following our analysis of the 239 reliable surveys, we found out that our sample comprised 89 female respondents and 150 male respondents. For the final file containing the complete dataset, consult Morales García and García-Alcaraz [70]. Regarding corporate information, 74.47% of the respondents claimed to work in companies with more than 300 employees and hold managerial/engineering positions in maintenance (47.69%) and production (52.31%) departments. From these data, we concluded that the respondents knew sufficiently about the production machinery and equipment used in their companies. Table 1 summarizes the demographic findings in terms of employee position and company size.
Regarding the surveyed industrial sectors and employee experience in Table 2, findings indicate that most surveyed persons worked in the automotive industry (i.e., 137 respondents, 57.32%) and had 2–5 years of work experience in their current position (i.e., 169 respondents, 70.71%). Additionally, 212 respondents indicated that they had previous managerial experience in other departments, including quality control and supply chain management. From this information, it was concluded that these respondents had enough expertise in the three LMTs analyzed, i.e., TPM, JD, and OEE.
Due to space restrictions in this manuscript, our analysis of the survey items is relegated to the Supplementary Materials.

4.2. Validation of Latent Variables

Table 3 summarizes the latent variable validation process. The second row indicates the number of survey items belonging to each latent variable before and after validation. As previously mentioned, the validation process was conducted to either remove collinearity problems between latent variables or increase their reliability. Refer to the survey sample in the Supplementary Materials for further information on the removed items.
According to the values of R2 and Adjusted R2—all higher than 0.02—the model has sufficient parametric predictive validity. Likewise, we concluded that all the latent variables had sufficient internal validity since their corresponding composite reliability and Cronbach’s alpha values were higher than 0.7. Similarly, the AVE values (all higher than 0.5) indicated enough convergent validity. As for VIF values, all lower than 3.3, we concluded that the latent variables were free from collinearity problems. Our analysis also revealed enough non-parametric validity since all the Q2 values were similar to their corresponding R2 values. Data skewness was determined based on the sign of each value, i.e., all variables had a negative bias. Kurtosis indicated the level of bracing; EcS and SOS showed positive values, but all the rest were negative. Finally, the Jarque–Bera (JB) normality test showed that none of the variables had a normal distribution. In conclusion, the PLS-SEM analysis was justified.

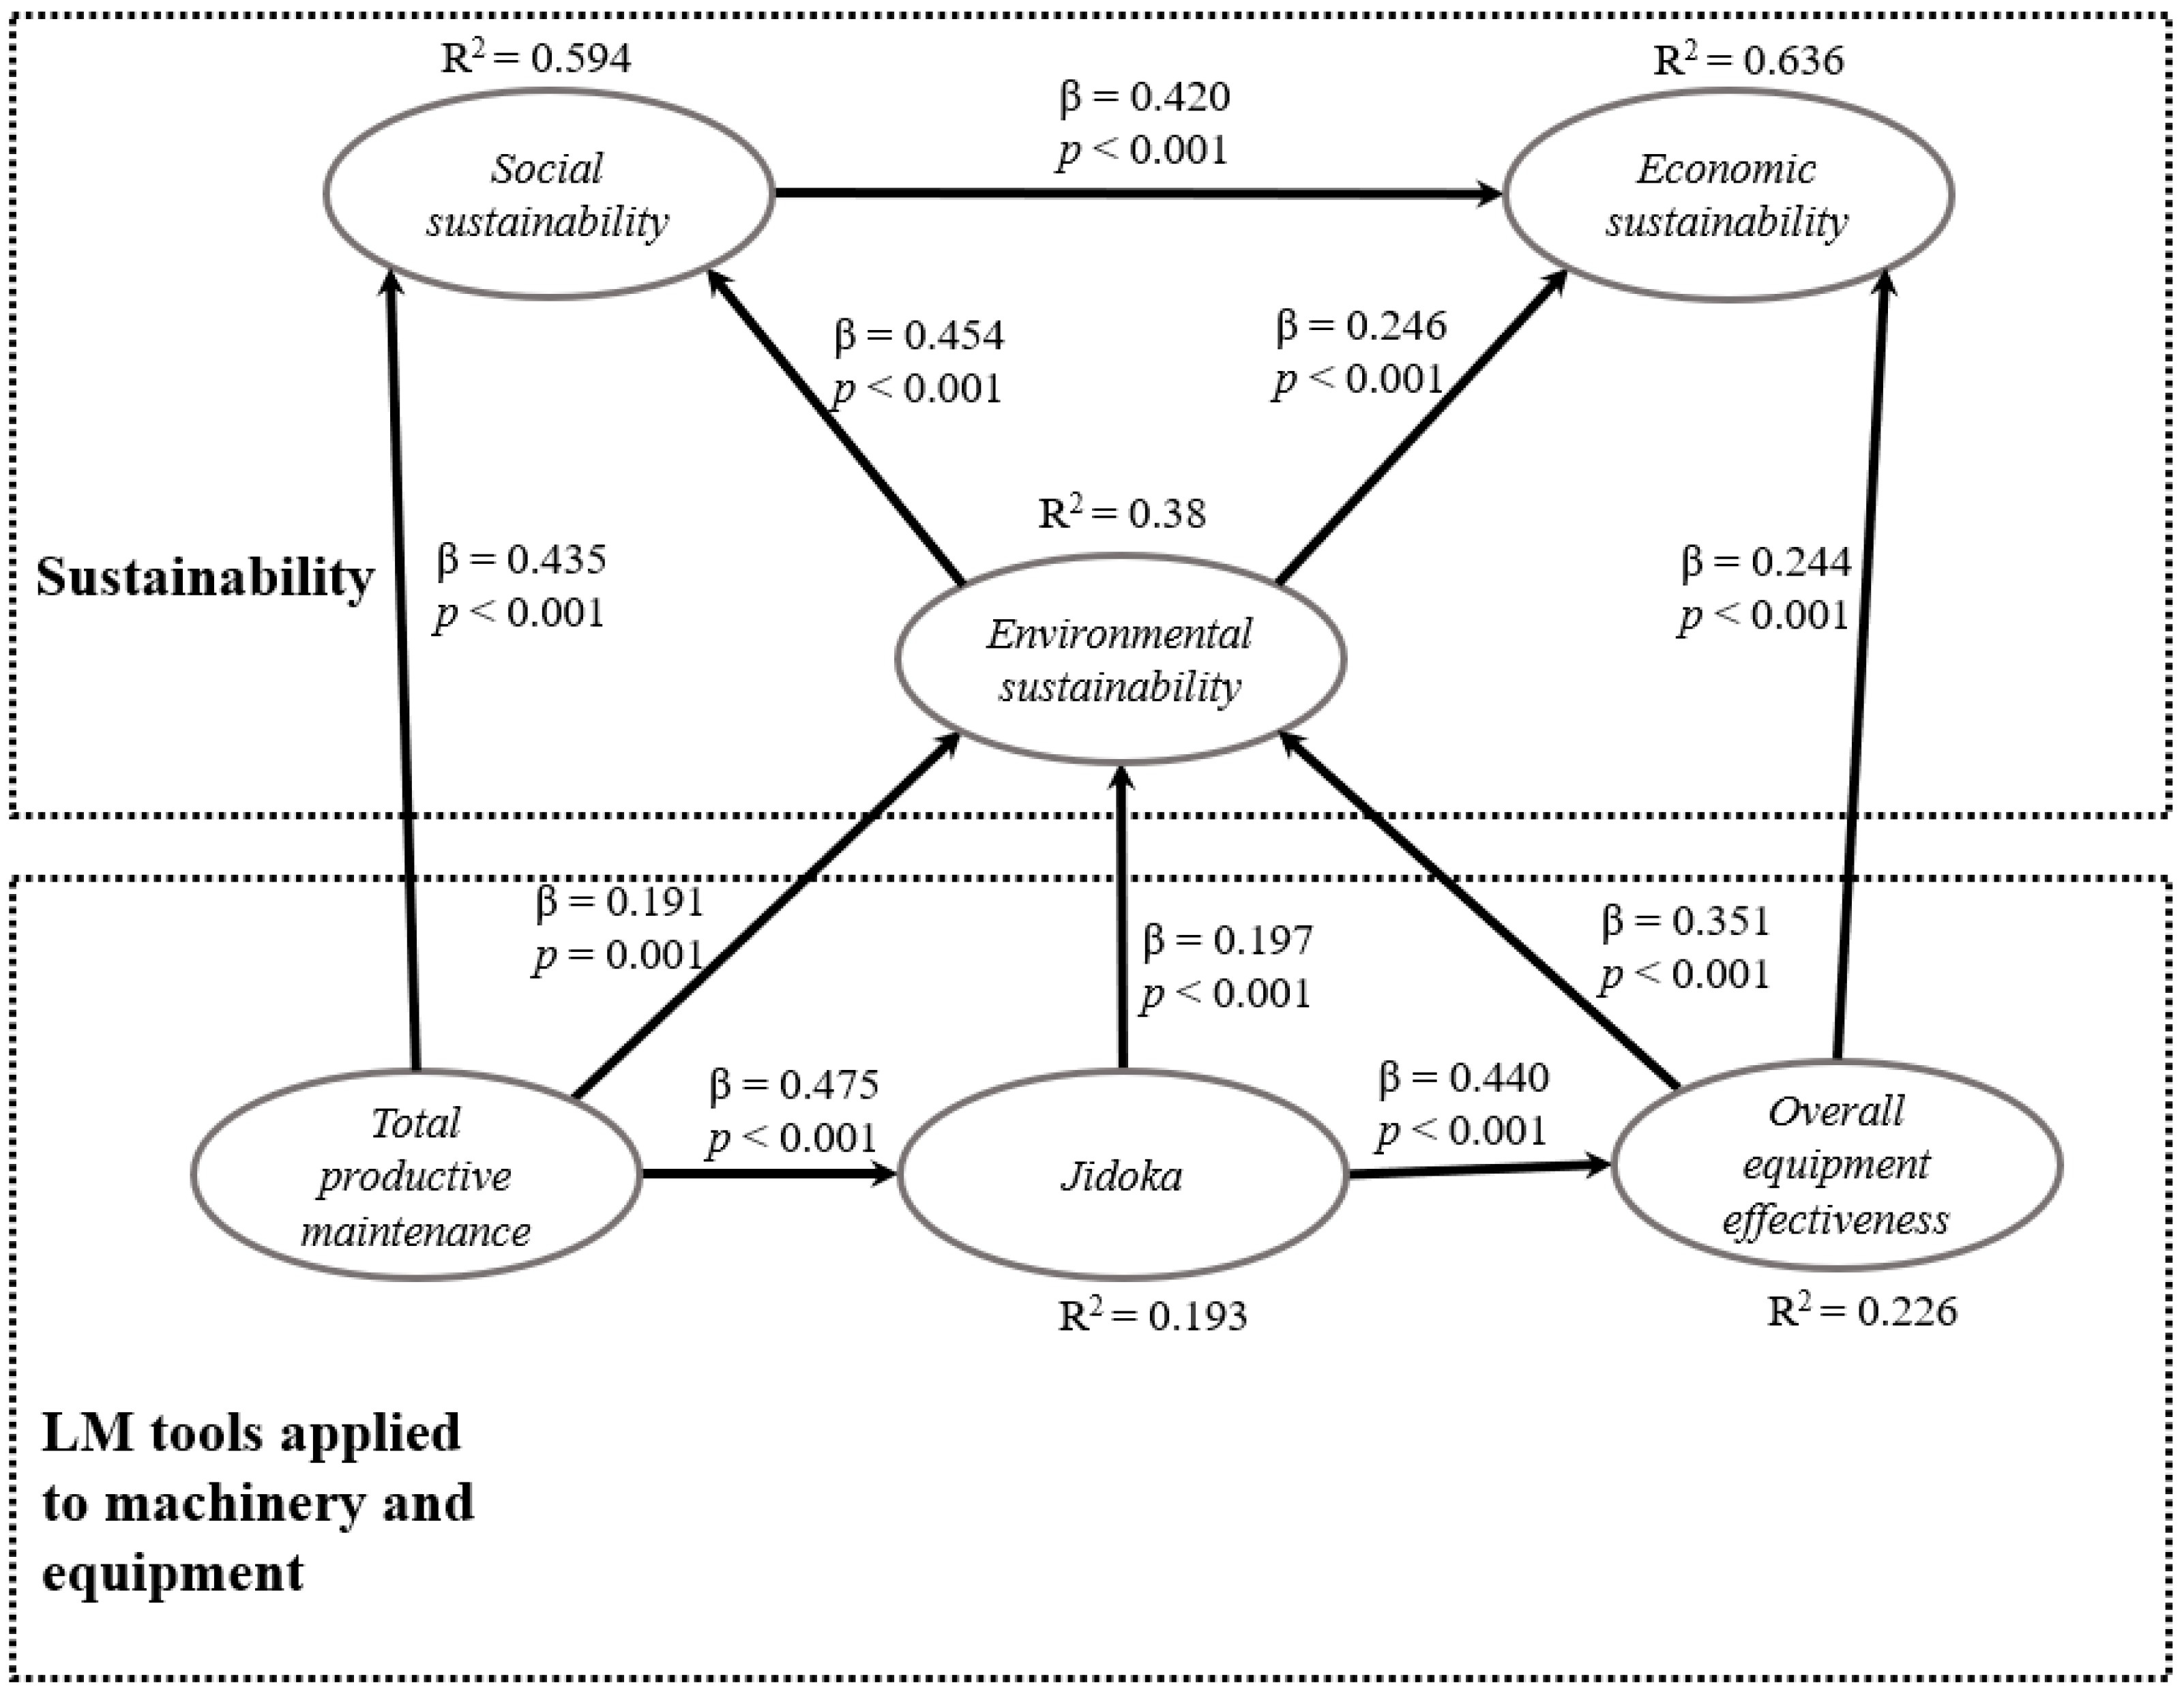
4.3. Structural Equation Model

Since the latent variables were successfully validated, they were all integrated into the SEM. The SEM efficiency rates were APC = 0.345 (p < 0.001), ARS = 0.406 (p < 0.001), AARS = 0.401 (p < 0.001), AVIF = 1.689 (ideally ≤3.3), AFVIF = 2.298 (ideally ≤3.3), and Tenenhaus GoF (GoF) = 0.553 (large if ≥0.36). These values indicated that the SEM had sufficient predictive validity, had no collinearity problems, and was a good fit for the data. Figure 3 shows the tested model, in which a standardized β-value and a p-value are associated with each hypothesis. Similarly, each latent dependent variable displays an R2 value as a measure of explained variance.
According to the p-value associated with each β-value, all the hypotheses in Figure 1 can be accepted into the model. All ten direct effects between the latent variables were statistically significant at a 95% confidence level. Table 4 lists the effect sizes estimated in each relationship and shows how these effect sizes explain the R2 values in the dependent variables (the sum of the many effect sizes in a dependent variable equals the value of its R2). As can be observed, EcS can be 63.6% explained by SoS (31.3%), EnS (16.3%), and OEE (16.0%). Such results reveal that SoS is the most critical variable enabling EcS, which indicates that safety improvement, employee health, employee morale, and employee motivation best explain reductions in production process costs.
Moreover, observe that SoS is explained in 59.4% by TPM in 28.9 and EnS in 30.5, indicating that safety in production processes and environmental risk are highly appreciated by workers in the maquiladora industrial sector.

4.4. Sum of Indirect Effects and Total Effects

Table 5 shows a standardized β-value for each sum of indirect effects and the total effects in each, along with an associated p-value and effect size. The results of this analysis deserve particular attention, as they show those effects occurring between variables that are not directly related through a research hypothesis. All the effects reported in Table 5 are statistically significant at a 95% confidence level, and many independent variables exhibit explanatory power over the dependent variables. For instance, TPM and JID affect EcS, and the values of such effects are the highest in the SEM.

4.5. Probability Scenarios

Table 6 summarizes results from the sensitivity analysis for each of the direct effects, established as research hypotheses between latent variables. High implementation levels P(Z > 1) of a given LM tool are marked with a plus sign (+), whereas low implementation levels P(Z < −1) are marked with a minus sign (−). The probability of isolated occurrence in each latent variable is reported in the “Probability” row/column. The probability of two variables co-occurring in a scenario simultaneously is marked by “&”, and the probability of a dependent variable occurring as a consequence of the occurrence of an independent variable is marked with “If”. For instance, the probability of TPM+ occurring in isolation is 0.188, and 0.142 for TPM-. However, the probability of EcS+ and TPM+ occurring together is 0.084. Similarly, the probability of EcS+ occurring due to TPM+ is 0.444. Such results demonstrate that TPM is conducive to EcS in the maquiladora industry if it is implemented as a production tool. Moreover, reassuringly for managers, there is a null probability that EcS- will occur when they have MPR+. However, if TPM- occurs, there is a probability of 0.471 that EcS- will occur, which is a risk for managers.

5. Discussion of Results and Managerial Implications

Findings are discussed in two sections, according to the managerial and practical implications.

5.1. Structural Equation Model

Following our study and the testing of the ten research hypotheses, we concluded that good TPM practices in the maquiladora industry foster JID (H1) in 0.475 standard deviations (SDs). Such results indicate that if machines are in good working condition due to TPM being used as a production strategy, production errors and quality failures will be detected before faulty products reach consumers. Moreover, administrative procedures and order returns will be avoided. Likewise, with JID implementation, OEE (H4) increases up to 0.440 SDs, thus enabling production systems to be run efficiently and fulfill production orders without delay. Moreover, a high OEE indicates that equipment is always calibrated and readily available, as stated by Silva et al. [71].
Our findings also reveal that TPM is a forerunner of EnS (H3) by 0.191 SDs. In other words, production processes with periodically inspected and calibrated machines make for lower emissions of liquids, solids, and gases into the environment and less reprocessing of faulty parts, thus lowering energy costs and waste production. However, negative environmental impacts can also be reduced with adequate JID (H2) and OEE (H5) by identifying faulty parts before they reach the market, thus avoiding returned orders and the environmental impact caused by order return logistics. These findings are similar to those reported by Sahoo [72] in Indian companies.
We also found that SoS is an essential variable in the integral sustainability for maquiladoras since it is directly affected by TPM (H6) in 0.435 SDs. In other words, workers feel safer when operating machines compliant with maintenance programs that do not pose health or accident risks. This feeling of safety in the workplace increases employee motivation, which is reinforced by EnS (H7) in 0.454 SDs. If maquiladora systems reduce pollutants and the use of hazardous materials, employees will be in much safer workplaces. Such findings are consistent with those reported by Longoni and Cagliano [73], demonstrating that EnS is a priority in the production process.
Finally, EcS is affected by SoS (H8) in 0.420 SDs, in 0.246 by EnS (H9), and 0.244 by OEE (H10). Such results indicate that SoS is the variable with the most explanatory power over EcS beyond operational aspects. This suggests a need for workplace environments that make operators feel safe and risk-free. In other words, maquiladoras that want an EcS based on lower production costs, product development, energy consumption, inventories, and fewer production order rejections should focus on the well-being of their personnel to ensure that there are no health risks in the workplace.

5.2. Probability Analysis

Findings from the sensitivity analysis revealed that maquiladoras should ensure TPM+ since it favors CSs+ to a degree of 0.444, SoS+ to a degree of 0.533, EnS to a degree of 0.311, OEE+ to a degree of 0.467, and JID+ to a degree of 0.356. In other words, optimal machinery maintenance is conducive to both sustainability (especially SoS) and the implementation of other LMTs in production systems. Findings also indicate that investing in TPM+ is never or rarely associated with EcS-, SoS-, EnS-, OEE-, or JID-. However, TPM- poses a risk for managers, since it may lead to EcS- (0.471), SoS (0.647), EnS- (0.471), OEE- (0.618), and JID- (0.471).
Similarly, JID+ and machine automation systems are conducive to EcS+, SoS+, EnS+, and OEE+, since the associated conditional probabilities are 0.333, 0.347, 0.316, and 0.378, respectively, with particular emphasis in OEE and SoS. This means that error detection through automation systems enhances the sustainability of maquiladoras, preventing the production of faulty products. Moreover, the fact that JID+ occurs means that the probability of finding EcS-, EnS-, and OEE- is very low. Thus, managers can be confident that investing in automation systems will positively impact the production process. However, there is also a risk of having scenarios with JID- because the conditional probabilities for EcS-, SoS-, EnS-, and OEE- are 0.326, 0.372, 0.372, and 0.349, respectively. These values indicate that JID- does not favor maquiladoras with the timely detection of defects in commercially released products, thus incurring unnecessary costs for reprocessing and transportation logistics. Moreover, the corporate reputation may decrease.
OEE is seen as a productivity rate, but its relationship with sustainability has not been studied thoroughly and this article shows its quantitative importance in statistical and empirical terms. For instance, OEE+ is conducive to EcS+, SoS+, and EnS+, since the conditional probabilities are 0.422, 0.533, and 0.311, respectively. Thus, managers at maquiladoras that invest in OEE+ will always obtain sustainability, especially SoS. Furthermore, OEE+ is not associated with EcS-, SoS-, or EnS-, since the probability is zero or almost zero. However, there is a risk of OEE- generating ECS-, SoS-, and EnS-, as the conditional probabilities are 0.514, 0.600, and 0.486, respectively.
EnS+ is vital in obtaining EcS+ and SoS+ since the conditional probabilities are 0.526 and 0.526, respectively. This indicates that managers investing in EnS will see lower production costs, higher employee morale, and workplace safety. Findings also revealed that EnS+ is unrelated to EcS- and SoS-, since the conditional probabilities are zero. However, EnS- can generate EcS- and SoS- with conditional probabilities of 0.500 and 0.611, respectively, posing a risk for managers.
Finally, it is observed that SoS+ is a precursor for EcS+ since the conditional probability is 0.429 and it is not associated with EcS-. Conversely, SoS- is conducive to EcS- with a probability of 0.526 and is not associated with EcS+, indicating the importance of managers striving to ensure a workplace where operators feel safe and motivated and where morale is high.

6. Conclusions

The EcS in maquiladoras is generally the main factor traditionally analyzed, and to achieve it, managers have several LMTs at their disposal. Specifically, based on the findings of this study, it is concluded that TPM, JID, and OEE associated with machines and equipment are of vital importance, and managers should pay special attention to them.
In the same way, TPM, JID, and OEE are sources of SoS and EnS, since they can offer safety in the workplace and make workers feel free of occupational hazards and risks. In addition, by avoiding the generation of defective parts, there is an environmental impact, reducing product reprocessing, saving on labor, and avoiding waste going to landfills.
In conclusion, to achieve an SoS, maquiladoras must efficiently use their resources through the different LMTs but focus on having an SoS in their workers and improving the SoS of the environment in which they are established.

7. Limitations and Future Research

LM is a set of tools applied to production systems, and this study reports on just three of them. Future research will analyze the impact of other LMTs associated with the continuous flow of materials to guarantee quality in products and continuous improvement. It is also worth noting that the three sustainability categories analyzed (environmental, social, and economic) were not 100% explained by the independent variables. Such findings mean that other variables not analyzed in this study must help to explain them. Hence, future similar studies could integrate other variables such as regional culture, supply chain infrastructure, support services, and local government regulations.

Supplementary Materials

The following supporting information can be downloaded at: https://www.mdpi.com/article/10.3390/math10091468/s1.

Author Contributions

Conceptualization, J.L.G.A. and J.B.F.; methodology, E.J.M. and J.B.F.; software, J.L.G.A.; validation, J.R.D.R. and A.S.M.G.; formal analysis, R.P.i.V.; investigation, A.S.M.G.; resources, J.R.D.R.; data curation, J.L.G.A. and R.P.i.V.; writing—Original draft preparation, J.L.G.A.; writing—Review and editing, E.J.M. and R.P.i.V.; visualization, J.B.F. and A.S.M.G.; supervision, J.L.G.A. All authors have read and agreed to the published version of the manuscript.

Funding

This research was funded by Consejo Nacional de Ciencia y Tecnología (CONACyT) from Mexico, grant number 858463.

Institutional Review Board Statement

The study was conducted in accordance with the Declaration of Helsinki; however, according to rules from the Autonomous University of Ciudad Juárez, no approval was necessary from the Institutional Review Board.

Informed Consent Statement

Informed consent was obtained from all subjects involved in the study in first question from the survey.

Data Availability Statement

The survey applied in this research and dataset obtained can be reviewed in a scientific repository at: https://doi.org/10.6084/m9.figshare.14462163 (survey) and https://doi.org/10.6084/m9.figshare.14462214.v1 (data). Accessed at 16 March 2022.

Acknowledgments

The authors appreciate all comments and time given by the managers, engineers, and persons who responded to our questionnaire. We hope that our findings support them in their daily job decision support problems.

Conflicts of Interest

The authors declare no conflict of interest.

References

  1. IMMEX. Monthly Statistical Information-Maquiladora Imports and Exports; Maquiladora Association A.C.: Ciudad Juárez, Mexico, 2021; p. 4. [Google Scholar]
  2. IMMEX. Monthly Statistical Information-Employment; Maquiladora Association A.C.: Ciudad Juárez, Mexico, 2021; p. 4. [Google Scholar]
  3. IMMEX. Monthly Statistical Information; Maquiladora Association: Ciudad Juárez, Mexico, 2020; p. 3. [Google Scholar]
  4. Henao, R.; Sarache, W.; Gómez, I. Lean Manufacturing and Sustainable Performance: Trends and Future Challenges. J. Clean. Prod. 2019, 208, 99–116. [Google Scholar] [CrossRef]
  5. Velmurugan, V.; Karthik, S.; Thanikaikarasan, S. Investigation and implementation of new methods in machine tool production using lean manufacturing system. Mater. Today Proc. 2020, 33, 3080–3084. [Google Scholar] [CrossRef]
  6. Cherrafi, A.; Elfezazi, S.; Chiarini, A.; Mokhlis, A.; Benhida, K. The integration of lean manufacturing, Six Sigma and sustainability: A literature review and future research directions for developing a specific model. J. Clean. Prod. 2016, 139, 828–846. [Google Scholar] [CrossRef]
  7. Younus, A.; Pervez, H.; Ali, Y.; Khan, A.U. Impact of Lean, Six Sigma and environmental sustainability on the performance of SMEs. Int. J. Product. Perform. Manag. 2020, 70, 2294–2318. [Google Scholar] [CrossRef]
  8. Palange, A.; Dhatrak, P. Lean manufacturing a vital tool to enhance productivity in manufacturing. Mater. Today: Proc. 2021, 46, 729–736. [Google Scholar] [CrossRef]
  9. García-Alcaraz, J.L.; Macías, A.A.M.; Luevano, D.J.P.; Fernández, J.B.; López, A.J.G.; Macías, E.J. Main benefits obtained from a successful JIT implementation. Int. J. Adv. Manuf. Technol. 2016, 86, 2711–2722. [Google Scholar] [CrossRef]
  10. García, J.L.; Rivera, L.; Blanco, J.; Jiménez, E.; Martínez, E. Structural equations modelling for relational analysis of JIT performance in maquiladora sector. Int. J. Prod. Res. 2014, 52, 4931–4949. [Google Scholar] [CrossRef]
  11. Farris, J.A.; Van Aken, E.M.; Doolen, T.L.; Worley, J. Critical success factors for human resource outcomes in Kaizen events: An empirical study. Int. J. Prod. Econ. 2009, 117, 42–65. [Google Scholar] [CrossRef]
  12. Green, K.W.; Sower, V.E.; Zelbst, P.J.; Inman, R.A. Impact of JIT, TQM and green supply chain practices on environmental sustainability. J. Manuf. Technol. Manag. 2019, 30, 26–47. [Google Scholar] [CrossRef]
  13. Sahoo, S. Assessment of TPM and TQM practices on business performance: A multi-sector analysis. J. Qual. Maint. Eng. 2019, 25, 412–434. [Google Scholar] [CrossRef]
  14. Jahangir, N.; Hasin, A.A.; Bashar, A. Linkage between TPM, people management and organizational performance. J. Qual. Maint. Eng. 2020, 28, 350–366. [Google Scholar] [CrossRef]
  15. Samadhiya, A.; Agrawal, R. Achieving sustainability through holistic maintenance-key for competitiveness. In Proceedings of the International Conference on Industrial Engineering and Operations Management, Dubai, United Arab Emirates, 10–12 March 2020; pp. 400–408. [Google Scholar]
  16. Chen, P.K.; Fortuny-Santos, J.; Lujan, I.; Ruiz-de-Arbulo-López, P. Sustainable manufacturing: Exploring antecedents and influence of Total Productive Maintenance and lean manufacturing. Adv. Mech. Eng. 2019, 11, 1687814019889736. [Google Scholar] [CrossRef] [Green Version]
  17. Gungor, Z.E.; Evans, S. Addressing environmental and economic impacts of changeover operations through manufacturing strategies. In Proceedings of the 2015 International Conference on Industrial Engineering and Systems Management, Seville, Spain, 21–23 October 2015; pp. 781–787. [Google Scholar]
  18. Yazdi, P.G.; Azizi, A.; Hashemipour, M. An empirical investigation of the relationship between overall equipment efficiency (OEE) and manufacturing sustainability in industry 4.0 with time study approach. Sustainability 2018, 10, 3031. [Google Scholar] [CrossRef] [Green Version]
  19. Cercós, M.P.; Calvo, L.M.; Domingo, R. An exploratory study on the relationship of overall equipment effectiveness (OEE) variables and CO2 emissions. Procedia Manuf. 2019, 41, 224–232. [Google Scholar] [CrossRef]
  20. Romero, D.; Gaiardelli, P.; Powell, D.; Wuest, T.; Thürer, M. Rethinking jidoka systems under automation & learning perspectives in the digital lean manufacturing world. IFAC-Pap. 2019, 52, 899–903. [Google Scholar] [CrossRef]
  21. Velázquez, L.; Munguía, N.; De Los Ángeles Navarrete, M.; Zavala, A. An overview of sustainability practices at the maquiladora industry in Mexico. Manag. Environ. Qual. Int. J. 2006, 17, 478–489. [Google Scholar] [CrossRef]
  22. Velazquez, L.; Munguia, N.; Zavala, A.; Esquer, J.; Will, M.; Delakowitz, B. Cleaner production and pollution prevention at the electronic and electric Mexican maquiladora. Manag. Environ. Qual. Int. J. 2014, 25, 600–614. [Google Scholar] [CrossRef]
  23. Díaz-Reza, J.R.; García-Alcaraz, J.L.; Martínez-Loya, V.; Blanco-Fernández, J.; Jiménez-Macías, E.; Avelar-Sosa, L. The effect of SMED on benefits gained in maquiladora industry. Sustainability 2016, 8, 1237. [Google Scholar] [CrossRef] [Green Version]
  24. Arredondo-Soto, K.C.; Cruz-Castillo, M.S.; Carrillo-Gutierrez, T.; Solis-Quinteros, M.; Avila-Lopez, L.A. Calibration system for cost reduction: A case study in the Maquiladora industry. In Proceedings of the International Conference on Industrial Engineering and Operations Management, Bandung, Indonesia, 6–8 March 2018. [Google Scholar]
  25. García-Alcaraz, J.L.; Morales García, A.S.; Díaz-Reza, J.R.; Jiménez Macías, E.; Javierre Lardies, C.; Blanco Fernández, J. Effect of lean manufacturing tools on sustainability: The case of Mexican maquiladoras. Environ. Sci. Pollut. Res. 2022; in press. [Google Scholar] [CrossRef]
  26. Jenkins, B.R. From mitigation to sustainability: The evolution of incorporating environmental factors into development decisions in Australasia. Int. J. Sustain. Dev. Plan. 2016, 11, 920–929. [Google Scholar] [CrossRef]
  27. Schindlerová, V.; Šajdlerová, I.; Michalčík, V.; Nevima, J.; Krejčí, L. Potential of using TPM to increase the efficiency of production processes. Teh. Vjesn. 2020, 27, 737–743. [Google Scholar] [CrossRef]
  28. Kaczmarek, M.J. Integrating Lean and Green Paradigms in Maintenance Management. IFAC Proc. Vol. 2014, 47, 4471–4476. [Google Scholar] [CrossRef]
  29. Sajeev, A.; Kaur, S. Environmental sustainability, trade and economic growth in India: Implications for public policy. Int. Trade Politics Dev. 2020, 4, 141–160. [Google Scholar] [CrossRef]
  30. Bagire, V.; Sendawula, K.; Mbidde, C.I.; Turyakira, P. Environmental commitment and environmental sustainability practices of manufacturing small and medium enterprises in Uganda. J. Enterprising Communities People Places Glob. Econ. 2020, 15, 588–607. [Google Scholar] [CrossRef]
  31. Saxena, L.K.; Jain, P.K.; Sharma, A.K. Tactical supply chain planning for tyre remanufacturing considering carbon tax policy. Int. J. Adv. Manuf. Technol. 2018, 97, 1505–1528. [Google Scholar] [CrossRef]
  32. Arredondo-Soto, K.C.; Sanchez-Leal, J.; Reyes-Martinez, R.M.; Salazar-Ruíz, E.; Maldonado-Macias, A.A. World class remanufacturing productions systems: An analysis of Mexican maquiladoras. Adv. Intell. Syst. Comput. 2018, 606, 153–161. [Google Scholar] [CrossRef]
  33. Ullah, M.; Asghar, I.; Zahid, M.; Omair, M.; AlArjani, A.; Sarkar, B. Ramification of remanufacturing in a sustainable three-echelon closed-loop supply chain management for returnable products. J. Clean. Prod. 2021, 290, 125609. [Google Scholar] [CrossRef]
  34. Liu, C.; Cai, W.; Dinolov, O.; Zhang, C.; Rao, W.; Jia, S.; Li, L.; Chan, F.T.S. Emergy based sustainability evaluation of remanufacturing machining systems. Energy 2018, 150, 670–680. [Google Scholar] [CrossRef]
  35. Durán, O.; Durán, P.A. Prioritization of physical assets for maintenance and production sustainability. Sustainability 2019, 11, 4269. [Google Scholar] [CrossRef] [Green Version]
  36. Singh, S.; Khamba, J.S.; Singh, D. Analysis and directions of OEE and its integration with different strategic tools. Proc. Inst. Mech. Eng. Part E J. Process Mech. Eng. 2020, 235, 594–605. [Google Scholar] [CrossRef]
  37. da Silva, I.B.; Godinho Filho, M. Single-minute exchange of die (SMED): A state-of-the-art literature review. Int. J. Adv. Manuf. Technol. 2019, 102, 4289–4307. [Google Scholar] [CrossRef]
  38. Arslan, M. Corporate social sustainability in supply chain management: A literature review. J. Glob. Responsib. 2020, 11, 233–255. [Google Scholar] [CrossRef]
  39. Alsayegh, M.F.; Rahman, R.A.; Homayoun, S. Corporate economic, environmental, and social sustainability performance transformation through ESG disclosure. Sustainability 2020, 12, 3910. [Google Scholar] [CrossRef]
  40. Schönborn, G.; Berlin, C.; Pinzone, M.; Hanisch, C.; Georgoulias, K.; Lanz, M. Why social sustainability counts: The impact of corporate social sustainability culture on financial success. Sustain. Prod. Consum. 2019, 17, 1–10. [Google Scholar] [CrossRef]
  41. Tortorella, G.; Cómbita-Niño, J.; Monsalvo-Buelvas, J.; Vidal-Pacheco, L.; Herrera-Fontalvo, Z. Design of a methodology to incorporate Lean Manufacturing tools in risk management, to reduce work accidents at service companies. Procedia Comput. Sci. 2020, 177, 276–283. [Google Scholar] [CrossRef]
  42. Marhavilas, P.; Koulouriotis, D.; Nikolaou, I.; Tsotoulidou, S. International occupational health and safety management-systems standards as a frame for the sustainability: Mapping the territory. Sustainability 2018, 10, 3663. [Google Scholar] [CrossRef] [Green Version]
  43. Evangelinos, K.; Fotiadis, S.; Skouloudis, A.; Khan, N.; Konstandakopoulou, F.; Nikolaou, I.; Lundy, S. Occupational health and safety disclosures in sustainability reports: An overview of trends among corporate leaders. Corp. Soc. Responsib. Environ. Manag. 2018, 25, 961–970. [Google Scholar] [CrossRef]
  44. Masuin, R.; Latief, Y.; Yuri Zagloel, T. Development of integration risk on integrated management system in order to increase organisational performance of construction company. Int. J. Proj. Organ. Manag. 2020, 12, 164–177. [Google Scholar] [CrossRef]
  45. Macchi, M.; Mazza, A.; Savino, M.M. Investigating the impact of social sustainability within maintenance operations. J. Qual. Maint. Eng. 2015, 21, 310–331. [Google Scholar] [CrossRef]
  46. Lingappa, A.K.; Kiran, K.K.; Oommen Mathew, A. Safety training transfer in chemical manufacturing: The role of personality traits and learning motivation. Cogent Bus. Manag. 2020, 7, 1835335. [Google Scholar] [CrossRef]
  47. Sarkar, A.; Azim, J.A.; Asif, A.A.; Qian, L.; Peau, A.K. Structural equation modeling for indicators of sustainable agriculture: Prospective of a developing country’s agriculture. Land Use Policy 2021, 109, 105638. [Google Scholar] [CrossRef]
  48. Coppola, A.; Ianuario, S. Environmental and social sustainability in Producer Organizations’ strategies. Br. Food J. 2017, 119, 1732–1747. [Google Scholar] [CrossRef]
  49. ul Haq, S.; Boz, I. Measuring environmental, economic, and social sustainability index of tea farms in Rize Province, Turkey. Environ. Dev. Sustain. 2020, 22, 2545–2567. [Google Scholar] [CrossRef]
  50. Malak-Rawlikowska, A.; Majewski, E.; Was, A.; Borgen, S.O.; Csillag, P.; Donati, M.; Freeman, R.; Hoàng, V.; Lecoeur, J.L.; Mancini, M.C.; et al. Measuring the economic, environmental, and social sustainability of short food supply chains. Sustainability 2019, 11, 4004. [Google Scholar] [CrossRef] [Green Version]
  51. Lehner, O.M.; Harrer, T. Accounting for economic sustainability: Environmental, social and governance perspectives. J. Appl. Account. Res. 2019, 20, 365–371. [Google Scholar] [CrossRef]
  52. Arya, P.; Jaiswal, M.P.; Srivastava, M.K. Modelling environmental and economic sustainability of logistics. Asia-Pac. J. Bus. Adm. 2019, 12, 73–94. [Google Scholar] [CrossRef]
  53. Tomšič, N.; Bojnec, Š.; Simčič, B. Corporate sustainability and economic performance in small and medium sized enterprises. J. Clean. Prod. 2015, 108, 603–612. [Google Scholar] [CrossRef]
  54. Papetti, A.; Gregori, F.; Pandolfi, M.; Peruzzini, M.; Germani, M. A method to improve workers’ well-being toward human-centered connected factories. J. Comput. Des. Eng. 2021, 7, 630–643. [Google Scholar] [CrossRef]
  55. Dhahri, S.; Slimani, S.; Omri, A. Behavioral entrepreneurship for achieving the sustainable development goals. Technol. Forecast. Soc. Change 2021, 165, 120561. [Google Scholar] [CrossRef]
  56. Gallo, Ó.; Gonzales–Miranda, D.R.; Roman-Calderon, J.P.; García, G.A. Decent work and healthy employment: A qualitative case study about Colombian millennials. Int. J. Workplace Health Manag. 2020, 13, 477–495. [Google Scholar] [CrossRef]
  57. Hald, K.S. Social influence and safe behavior in manufacturing. Saf. Sci. 2018, 109, 1–11. [Google Scholar] [CrossRef]
  58. García-Alcaraz, J.L.; Flor-Montalvo, F.J.; Avelar-Sosa, L.; Sánchez-Ramírez, C.; Jiménez-Macías, E. Human resource abilities and skills in TQM for sustainable enterprises. Sustainability 2019, 11, 6488. [Google Scholar] [CrossRef] [Green Version]
  59. Malik, A.; Egan, M.; du Plessis, M.; Lenzen, M. Managing sustainability using financial accounting data: The value of input-output analysis. J. Clean. Prod. 2021, 293, 126128. [Google Scholar] [CrossRef]
  60. Badiger, A.S.; Gandhinathan, R. A proposal: Evaluation of OEE and impact of six big losses on equipment earning capacity. Int. J. Process Manag. Benchmarking 2008, 2, 234–248. [Google Scholar] [CrossRef]
  61. García-Alcaraz, J.; Maldonado, A.; Alvarado Iniesta, A.; Cortes Robles, G.; Alor Hernández, G. A systematic review/survey for JIT implementation: Mexican maquiladoras as case study. Comput. Ind. 2014, 65, 761–773. [Google Scholar] [CrossRef]
  62. Morales García, A.; García Alcaraz, J.; Díaz Reza, J. Survey: Effect of Lean Manufacturing Tools on the Company’s Environmental Performance; Autonomous University of Ciudad Juarez: Ciudad Juarez, Mexico, 2021. [Google Scholar] [CrossRef]
  63. Li, H.; Wang, B.; Xie, X. An improved content-based outlier detection method for ICS intrusion detection. EURASIP J. Wirel. Commun. Netw. 2020, 2020, 103. [Google Scholar] [CrossRef]
  64. Kock, N. Factor-based structural equation modeling with WarpPLS. Australas. Mark. J. 2019, 27, 57–63. [Google Scholar] [CrossRef]
  65. Kock, N. From composites to factors: Bridging the gap between PLS and covariance-based structural equation modelling. Inf. Syst. J. 2019, 29, 674–706. [Google Scholar] [CrossRef]
  66. Hair, J.; Hult, G.; Ringle, C.; Sarstedt, M. A Primer on Partial Least Square Structural Equation Modeling (PLS-SEM), 2nd ed.; Sage: Thousand Oaks, CA, USA, 2017; Volume 2. [Google Scholar]
  67. Garcia-Alcaraz, J.L.; Maldonado-Macias, A.A.; Alor-Hernandez, G.; Sanchez-Ramirez, C. The impact of information and communication technologies (ICT) on agility, operating, and economical performance of supply chain. Adv. Prod. Eng. Manag. 2017, 12, 29–40. [Google Scholar] [CrossRef] [Green Version]
  68. Kock, N. WarpPLS© User Manual: Version 7.0; ScriptWarp Systems TM: Laredo, TX, USA, 2020; p. 141. [Google Scholar]
  69. Kock, N. Common Method Bias in PLS-SEM: A Full Collinearity Assessment Approach. Int. J. e-Collaboration (IJeC) 2015, 11, 10. [Google Scholar] [CrossRef] [Green Version]
  70. Morales García, A.; García-Alcaraz, J. Dataset for Paper: Machinery-Associated Lean Manufacturing Tools and Their Effect on Sustainability: The Case of Mexican Maquiladoras; Autonomous University of Ciudad Juarez: Ciudad Juarez, Mexico, 2021. [Google Scholar] [CrossRef]
  71. Silva, S.; Sá, J.C.; Silva, F.J.G.; Ferreira, L.P.; Santos, G. Lean Green—The Importance of Integrating Environment into Lean Philosophy—A Case Study. Lect. Notes Netw. Syst. 2020, 122, 211–219. [Google Scholar] [CrossRef]
  72. Sahoo, S. Exploring the effectiveness of maintenance and quality management strategies in Indian manufacturing enterprises. Benchmarking 2020, 27, 1399–1431. [Google Scholar] [CrossRef]
  73. Longoni, A.; Cagliano, R. Cross-functional executive involvement and worker involvement in lean manufacturing and sustainability alignment. Int. J. Oper. Prod. Manag. 2015, 35, 1332–1358. [Google Scholar] [CrossRef]
Figure 1. Proposed model of the relationships between LM tools and sustainability.
Mathematics 10 01468 g001
Figure 2. Research methodology.
Mathematics 10 01468 g002
Figure 3. The tested model of the relationships between LMTs and sustainability.
Mathematics 10 01468 g003
Table 1. Respondent corporate position vs. company size.
PositionNumber of EmployeesTotal
<5050 to <300300 to <10001000 to <50005000 to<10,000+10,000
Maintenance manager131213326480
Production manager101728471013125
Maintenance engineer54893534
Total283349881922239
Table 2. Surveyed industrial sectors vs. employee work experience.
SectorYears of Experience in the PositionTotal
2–55–10+10
Automotive922322137
Electronic213327
Electrical211224
Medical112720
Aeronautics94114
Mechanical90211
Logistics6006
Total1693337239
Table 3. Latent variable validation coefficients.
IndexBestTPMEcSSoSEnSJIDOEE
Value If
Items (Before/after) 748564645453
R2>0.02 0.6350.5940.380.2260.193
Adjusted R2>0.02 0.630.5910.3720.2220.19
Composite reliability>0.70.8910.9380.9480.9480.8760.904
Cronbach’s alpha>0.70.8170.9170.9270.9270.8110.841
AVE>0.50.7320.750.8210.8210.6390.759
Full collinearity VIF<3.32.2272.863.0062.1291.4062.162
Q2>0.02 0.6360.5930.3830.2280.195
Skewness −0.713−0.522−0.828−0.554−0.441−0.632
Kurtosis −0.0080.0010.123−0.279−0.459−0.037
JB normality NoNoNoNoNoNo
Table 4. Effect sizes for direct effects.
Dependent
Variable
Independent VariableR2
TPMSoSEnSJIDOEE
EcS 0.3130.163 0.1600.636
SoS0.289 0.305 0.594
EnS0.096 0.0880.1960.380
JID0.226 0.226
OEE 0.193 0.193
Table 5. Sum of indirect and total effects.
Sum of Indirect Effects
Dependent
Variables
Independent Variables
TPMSoSEnSJIDOEE
EcS0.390 (p < 0.001)
ES = 0.253
0.191 (p < 0.001)
ES = 0.126
0.261 (p < 0.001)
ES = 0.104
0.153 (p < 0.001)
ES = 0.100
SoS0.163 (p < 0.001)
ES = 0.108
0.160 (p < 0.001)
ES = 0.069
0.159 (p < 0.001)
ES = 0.105
EnS0.143 (p < 0.001)
ES = 0.084
0.154 (p < 0.001)
ES = 0.069
OEE0.209 (p < 0.001)
ES = 0.130
Total Effects
EcS0.390 (p < 0.001)
ES = 0.253
0.420 (p < 0.001)
ES = 0.313
0.437 (p < 0.001)
ES = 0.289
0.261 (p < 0.001)
ES = 0.104
0.397 (p < 0.001)
ES = 0.260
SoS0.597 (p < 0.001)
ES = 0.397
0.454 (p < 0.001)
ES = 0.305
0.160 (p < 0.001)
ES = 0.069
0.159 (p < 0.001)
ES = 0.105
EnS0.358 (p < 0.001)
ES = 0.181
0.352 (p < 0.001)
ES = 0.156
0.351 (p < 0.001)
ES = 0.196
JID0.475 (p < 0.001)
ES = 0.226
OEE0.209 (p < 0.001)
ES = 0.130
0.400 (p < 0.001)
ES = 0.193
Table 6. Probability of low and high LM implementation.
Level TPM+TPM−JID+JID−OEE+OEE−EnS+EnS−SoS+SoS−
Probability0.1880.1420.1720.1800.1880.1460.1590.1510.2050.159
EcS+0.151& = 0.084
If = 0.444
& = 0.004
If = 0.029
& = 0.050
If = 0.333
& = 0.000
If = 0.000
& = 0.079
If = 0.422
& = 0.008
If = 0.570
& = 0.084
If = 0.526
& = 0.004
If = 0.028
& = 0.088
If = 0.429
& = 0.000
If = 0.000
EcS−0.138& = 0.004& = 0.067& = 0.008
If = 0.061
& = 0.059
If = 0.424
& = 0.000
If = 0.000
& = 0.075
If = 0.514
& = 0.004
If = 0.026
& = 0.075
If = 0.500
& = 0.000
If = 0.000
& = 0.084
If = 0.526
If = 0.029If = 0.471
SoS+0.205& = 0.100
If = 0.533
& = 0.008
If = 0.059
& = 0.071
If = 0.347
& = 0.021
If = 0.102
& = 0.100
If = 0.533
& = 0.008
If = 0.057
& = 0.084
If = 0.526
& = 0.008
If = 0.056
SoS−0.159& = 0.000
If = 0.000
& = 0.092
If = 0.647
& = 0.008
If = 0.053
& = 0.067
If = 0.421
& = 0.004
If = 0.022
& = 0.088
If = 0.600
& = 0.000
If = 0.000
& = 0.092
If = 0.611
EnS+0.159& = 0.059
If = 0.311
& = 0.013
If = 0.088
& = 0.050
If = 0.316
& = 0.017
If = 0.105
& = 0.059
If = 0.311
& = 0.013
If = 0.086
EnS−0.151& = 0.008
If = 0.044
& = 0.067
If = 0.471
& = 0.004
If = 0.028
& = 0.067
If = 0.444
& = 0.000
If = 0.000
& = 0.071
If = 0.486
OEE+0.188& = 0.088
If = 0.467
& = 0.08
If = 0.059
& = 0.071
If = 0.378
& = 0.021
If = 0.111
OEE−0.146& = 0.008
If = 0.044
& = 0.088
If = 0.618
& = 0.017
If = 0.114
& = 0.063
If = 0.429
JID+0.172& = 0.067
If = 0.356
& = 0.004
If = 0.029
JID−0.180& = 0.013
If = 0.067
& = 0.067
If = 0.471
Publisher’s Note: MDPI stays neutral with regard to jurisdictional claims in published maps and institutional affiliations.

