
Stacking Machine Learning Model for the Assessment of R&D Product’s Readiness and Method for Its Cost Estimation


 , and
, and 
Abstract
1. Introduction
- communication studies between R&D spending and the market price of Thai corporate common share [14];
- to explore the strategic entanglements of financial models for managing R&D and building a firm’s competitiveness [15];
- to investigate the relationship between manufacturing–R&D integration and organizational culture in improving quality and product development performance [16];
- to obtain fitter decisions concerning risk reduction and further assist them in reaching higher performances in R&D partnership risk management [17].
- the relationship between the cost of product R&D and such essential elements as the level of its technological readiness (TRL), analytical readiness (ARL), consumer readiness (CRL), and patent readiness (PRL);
- creation of a basis for the development of R&D of the product’s commercialization scenarios under different conditions of its readiness and transfer options;
- development of an intellectualized approach to product R&D evaluation, which can take into account both product features and the specifics of the market environment.
- we have collected the dataset of R&D products and their parameters based on the expert survey, which provided the opportunity to apply machine learning methodology to reduce time and resources during the assessment of readiness and cost estimation of R&D products;
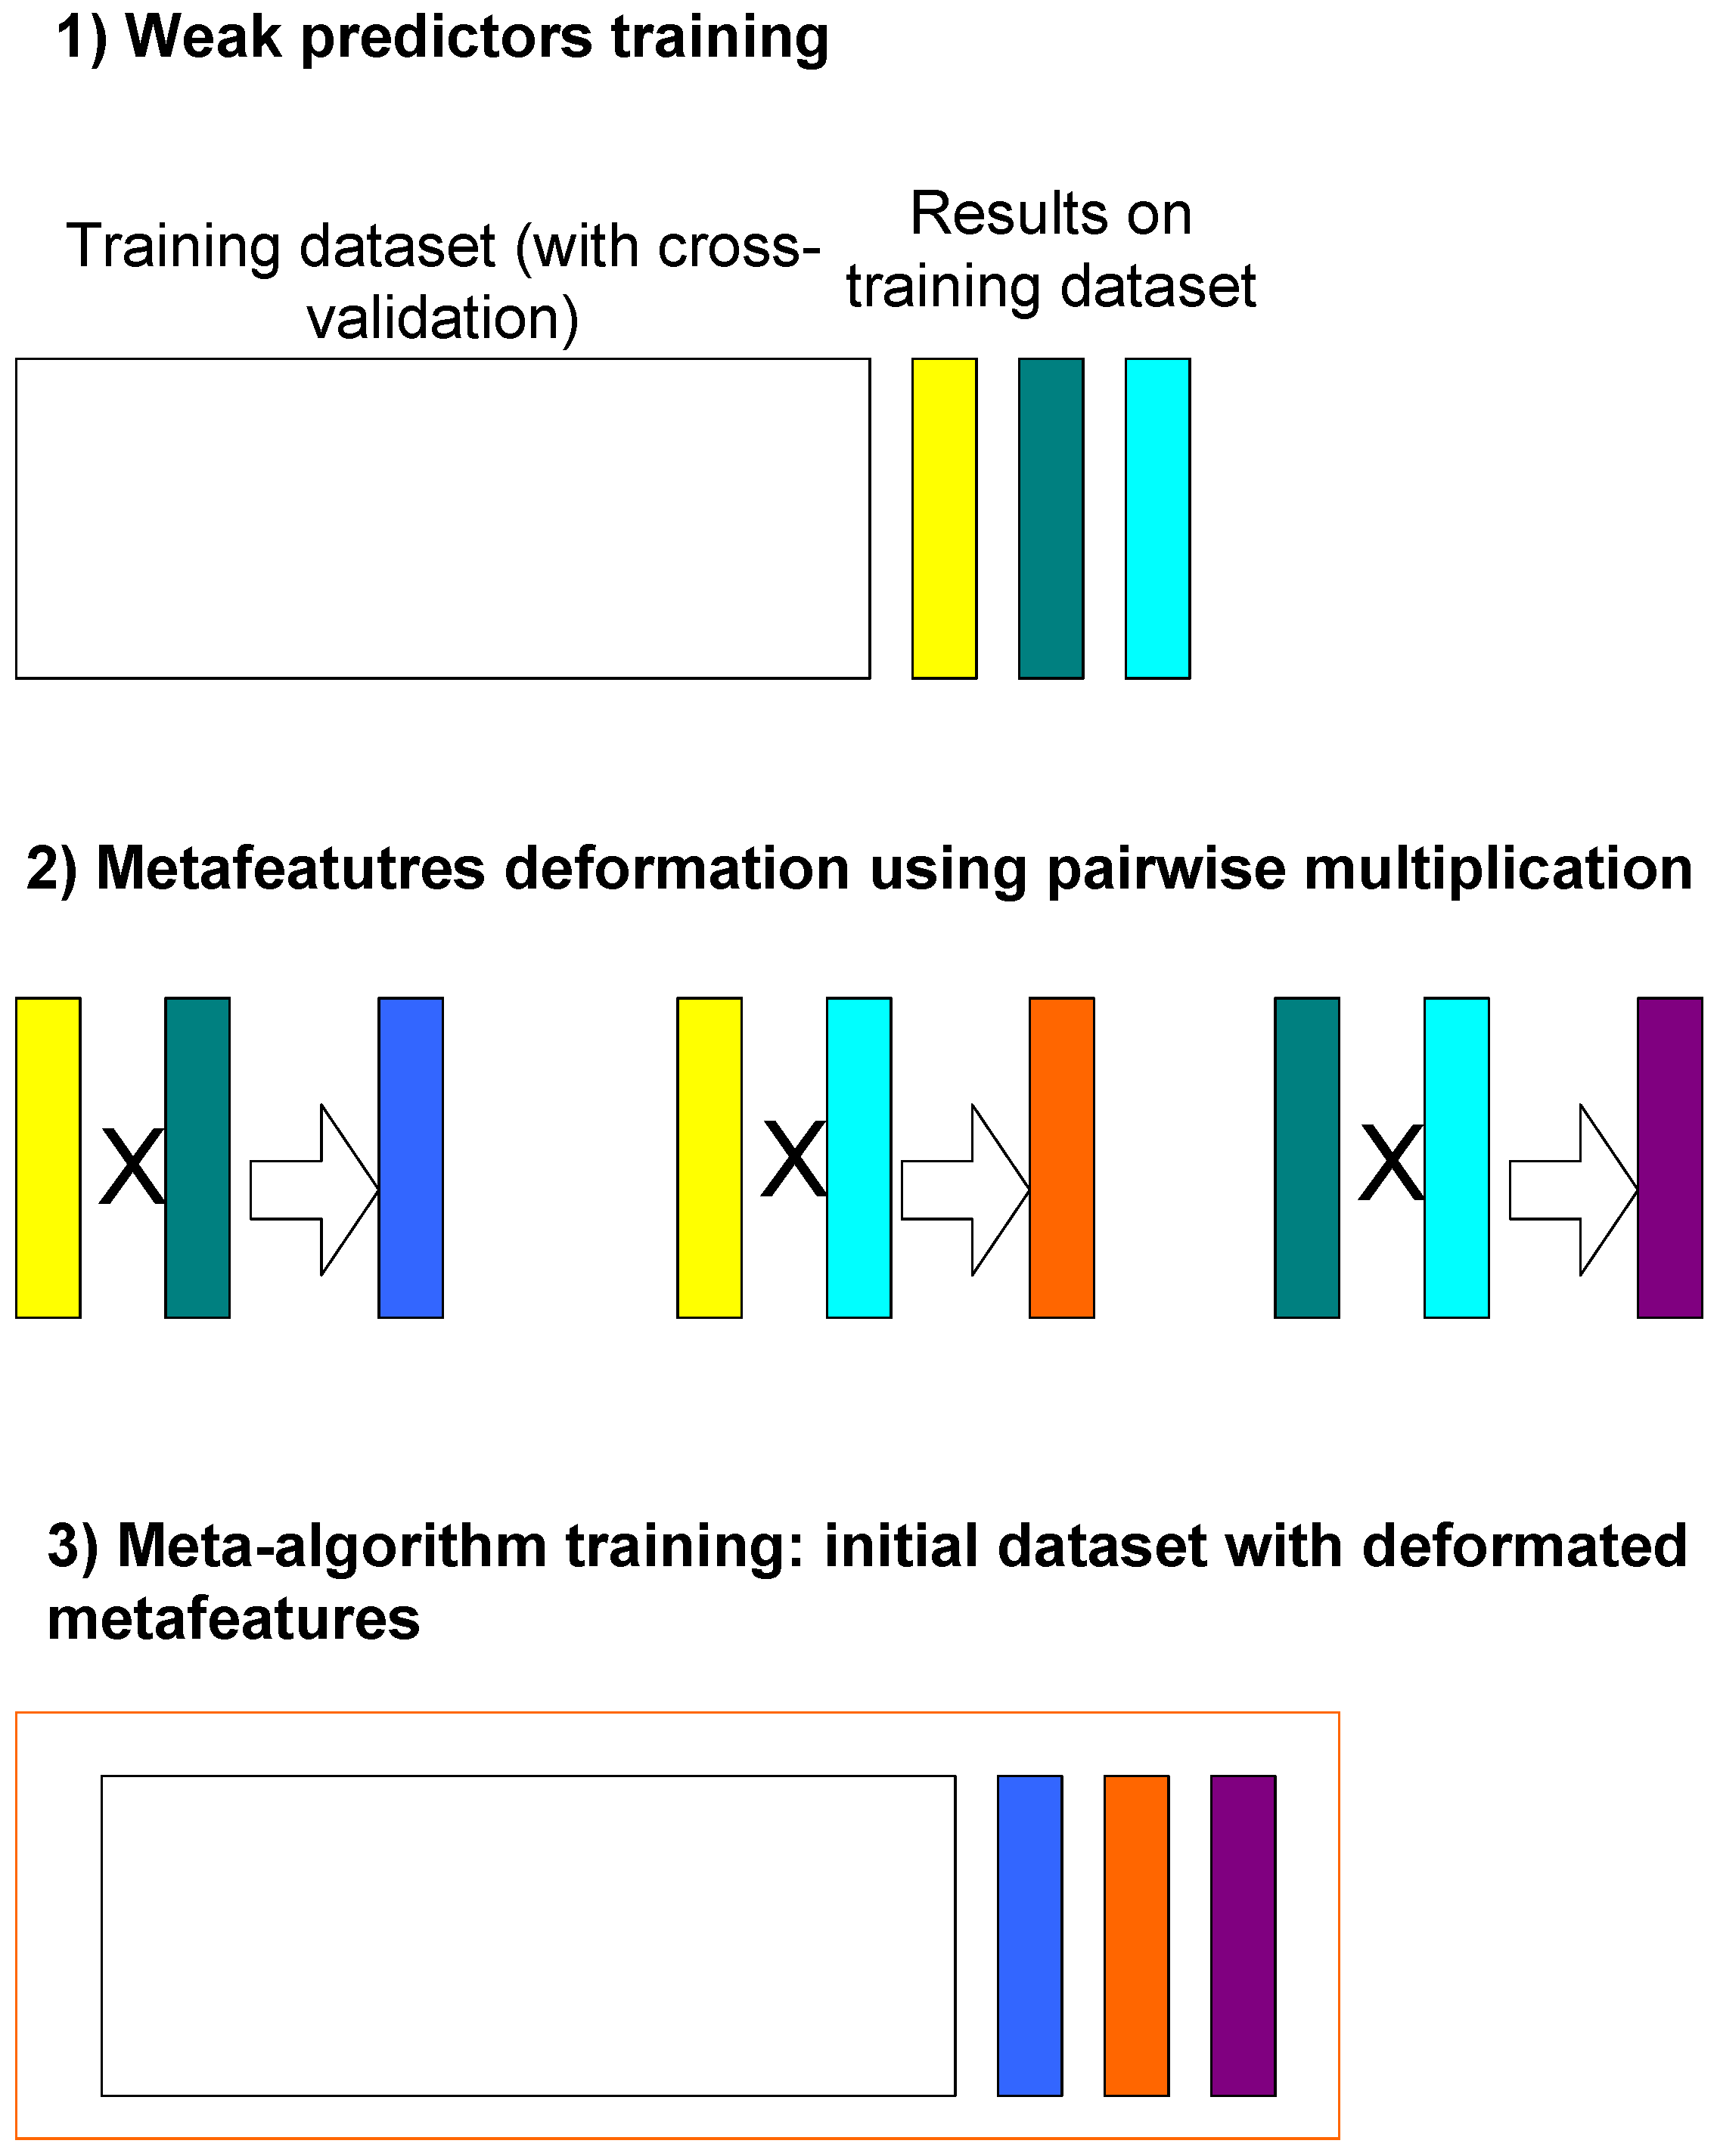
- we have designed a new machine learning-based model for the readiness assessment of R&D products, which is based on the principle of “wisdom of the crowd” through the use of a stacking strategy with the ensembling machine learning methods that provides an opportunity to improve the accuracy for significantly solving the stated task;
- we have designed a comprehensive method for R&D products’ cost estimation, which, by taking into account the results of the model for the readiness assessment of R&D products, as well as the availability of analogs on the market, allows us to increase the accuracy and reliability of the evaluation results through combinations of cost, revenue, and competition pricing approaches;
- we have developed intelligent information technology that provides an automatic assessment of the readiness and cost estimation of R&D products through the implementation of the above model and method, which allows for forming effective scenarios for the commercialization of such products.
- dataset collection;
- R&D level assessment model development for readiness level;
- cost estimation method development;
- results evaluation;
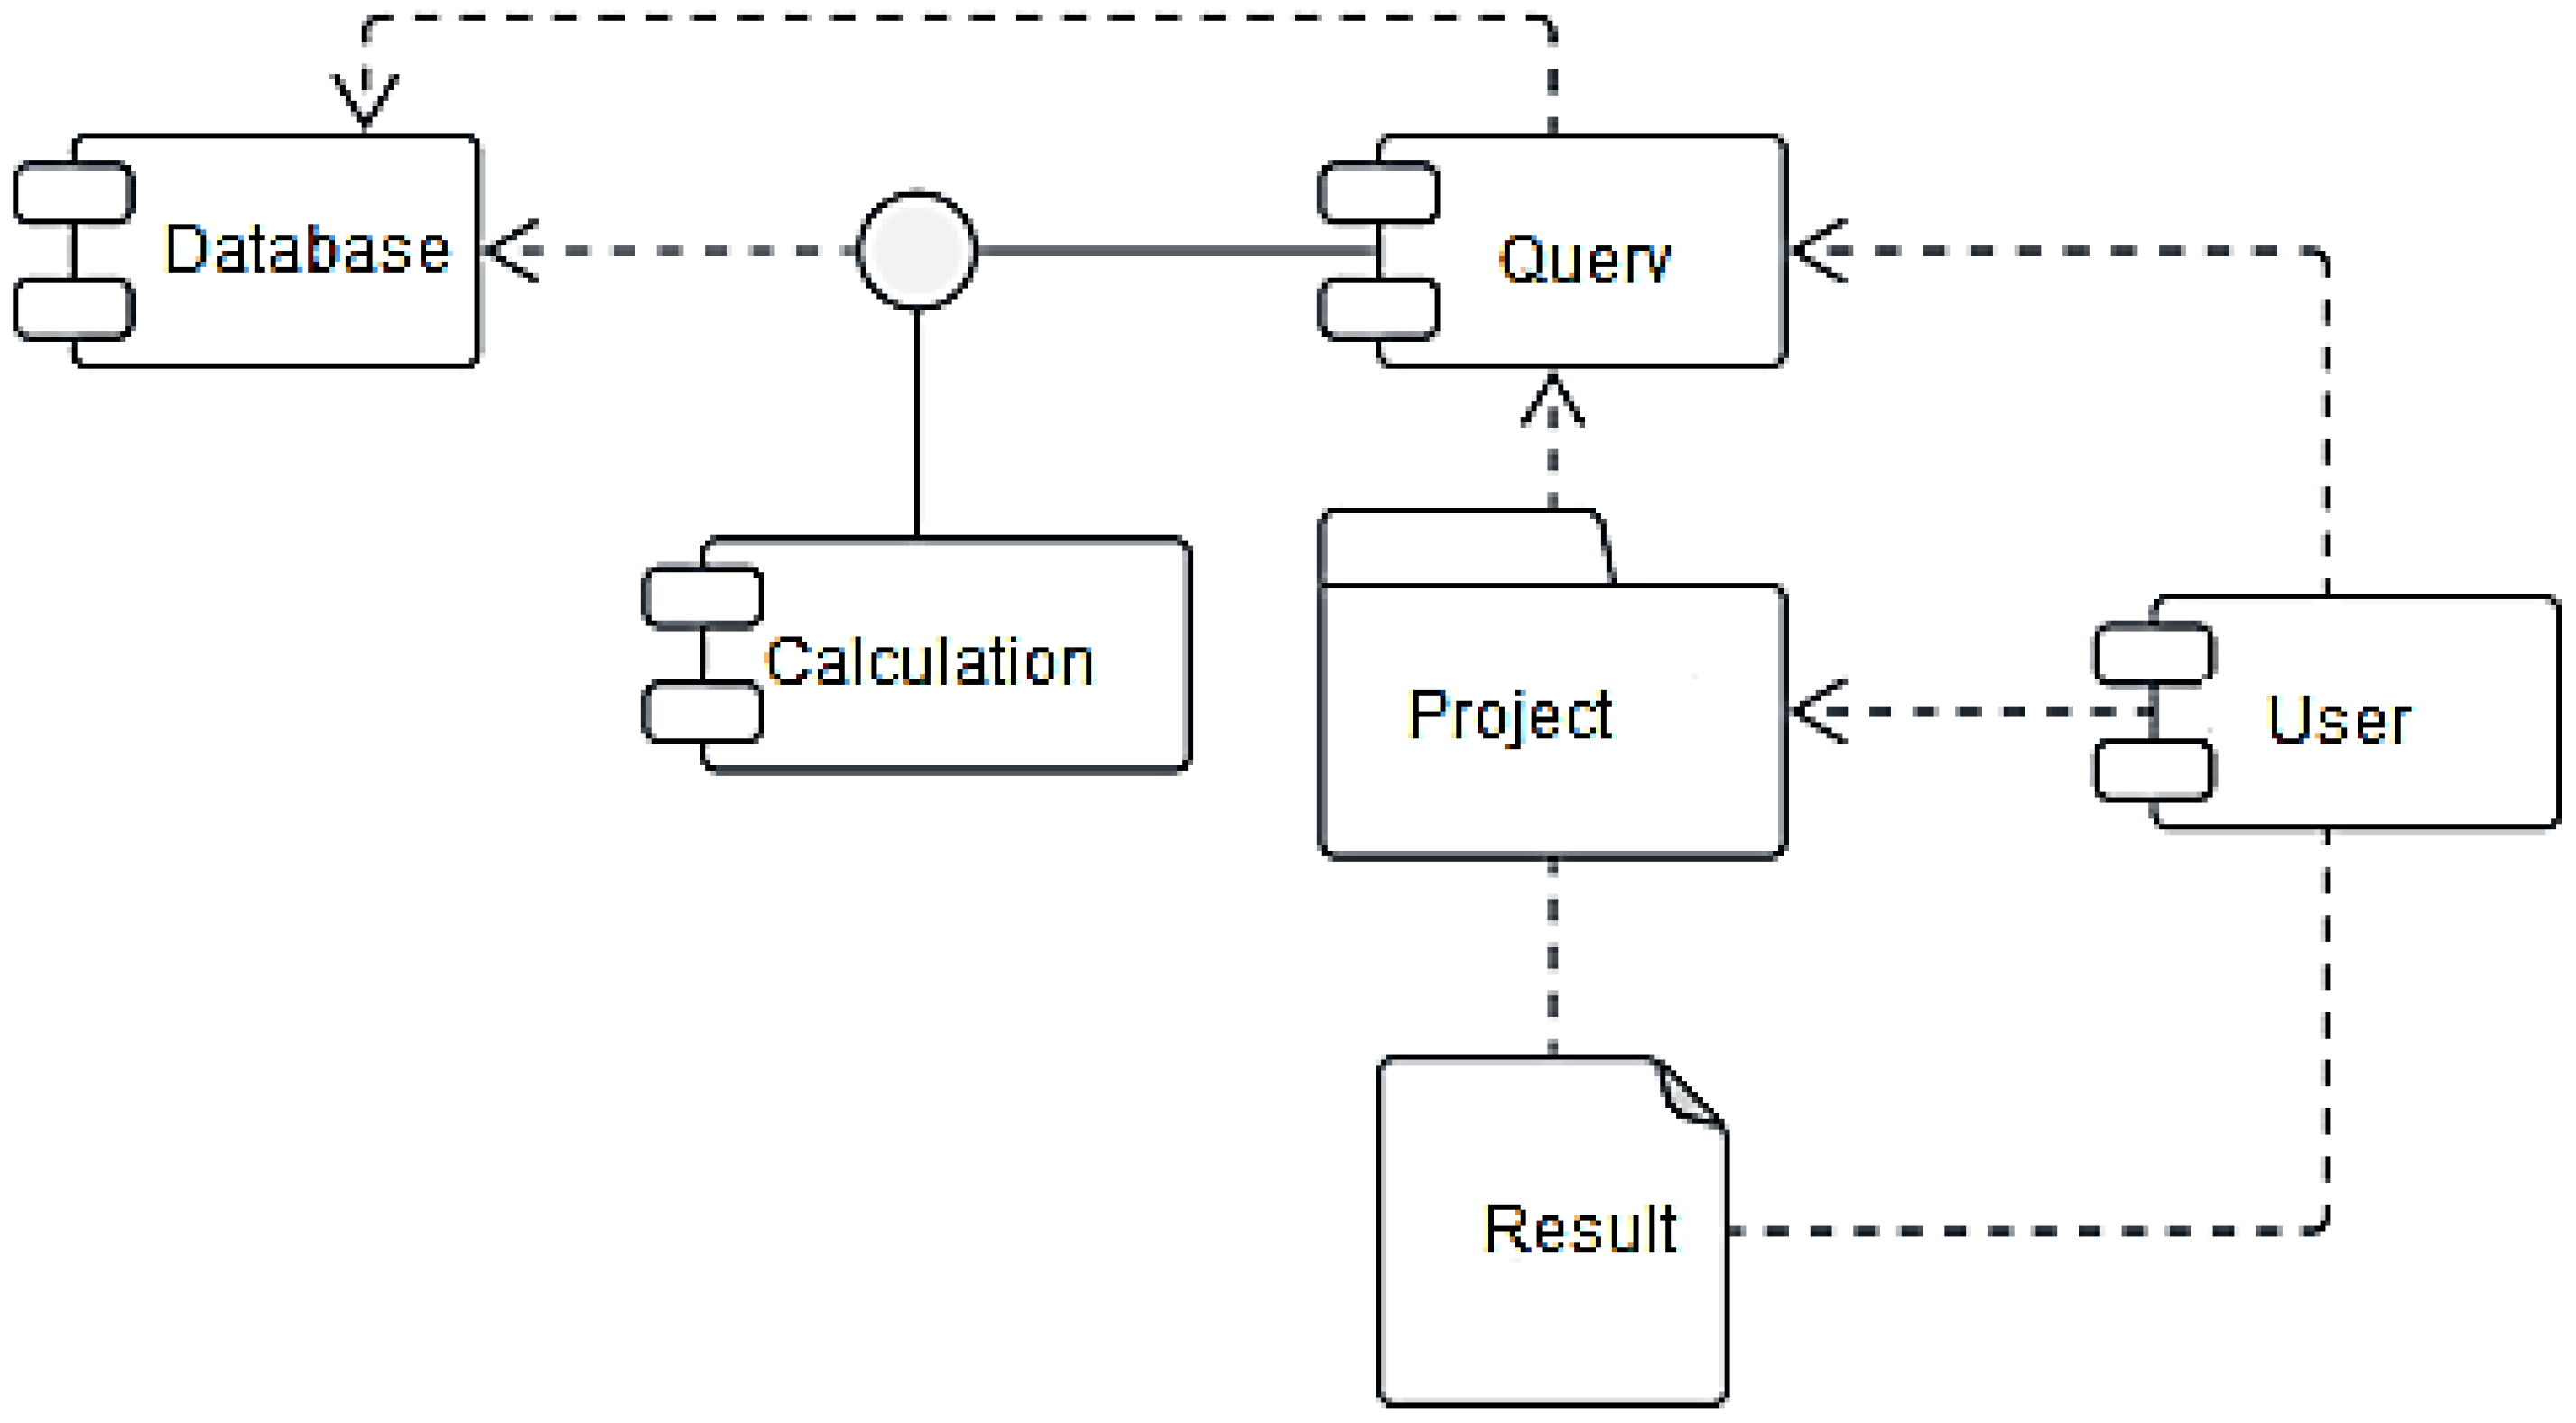
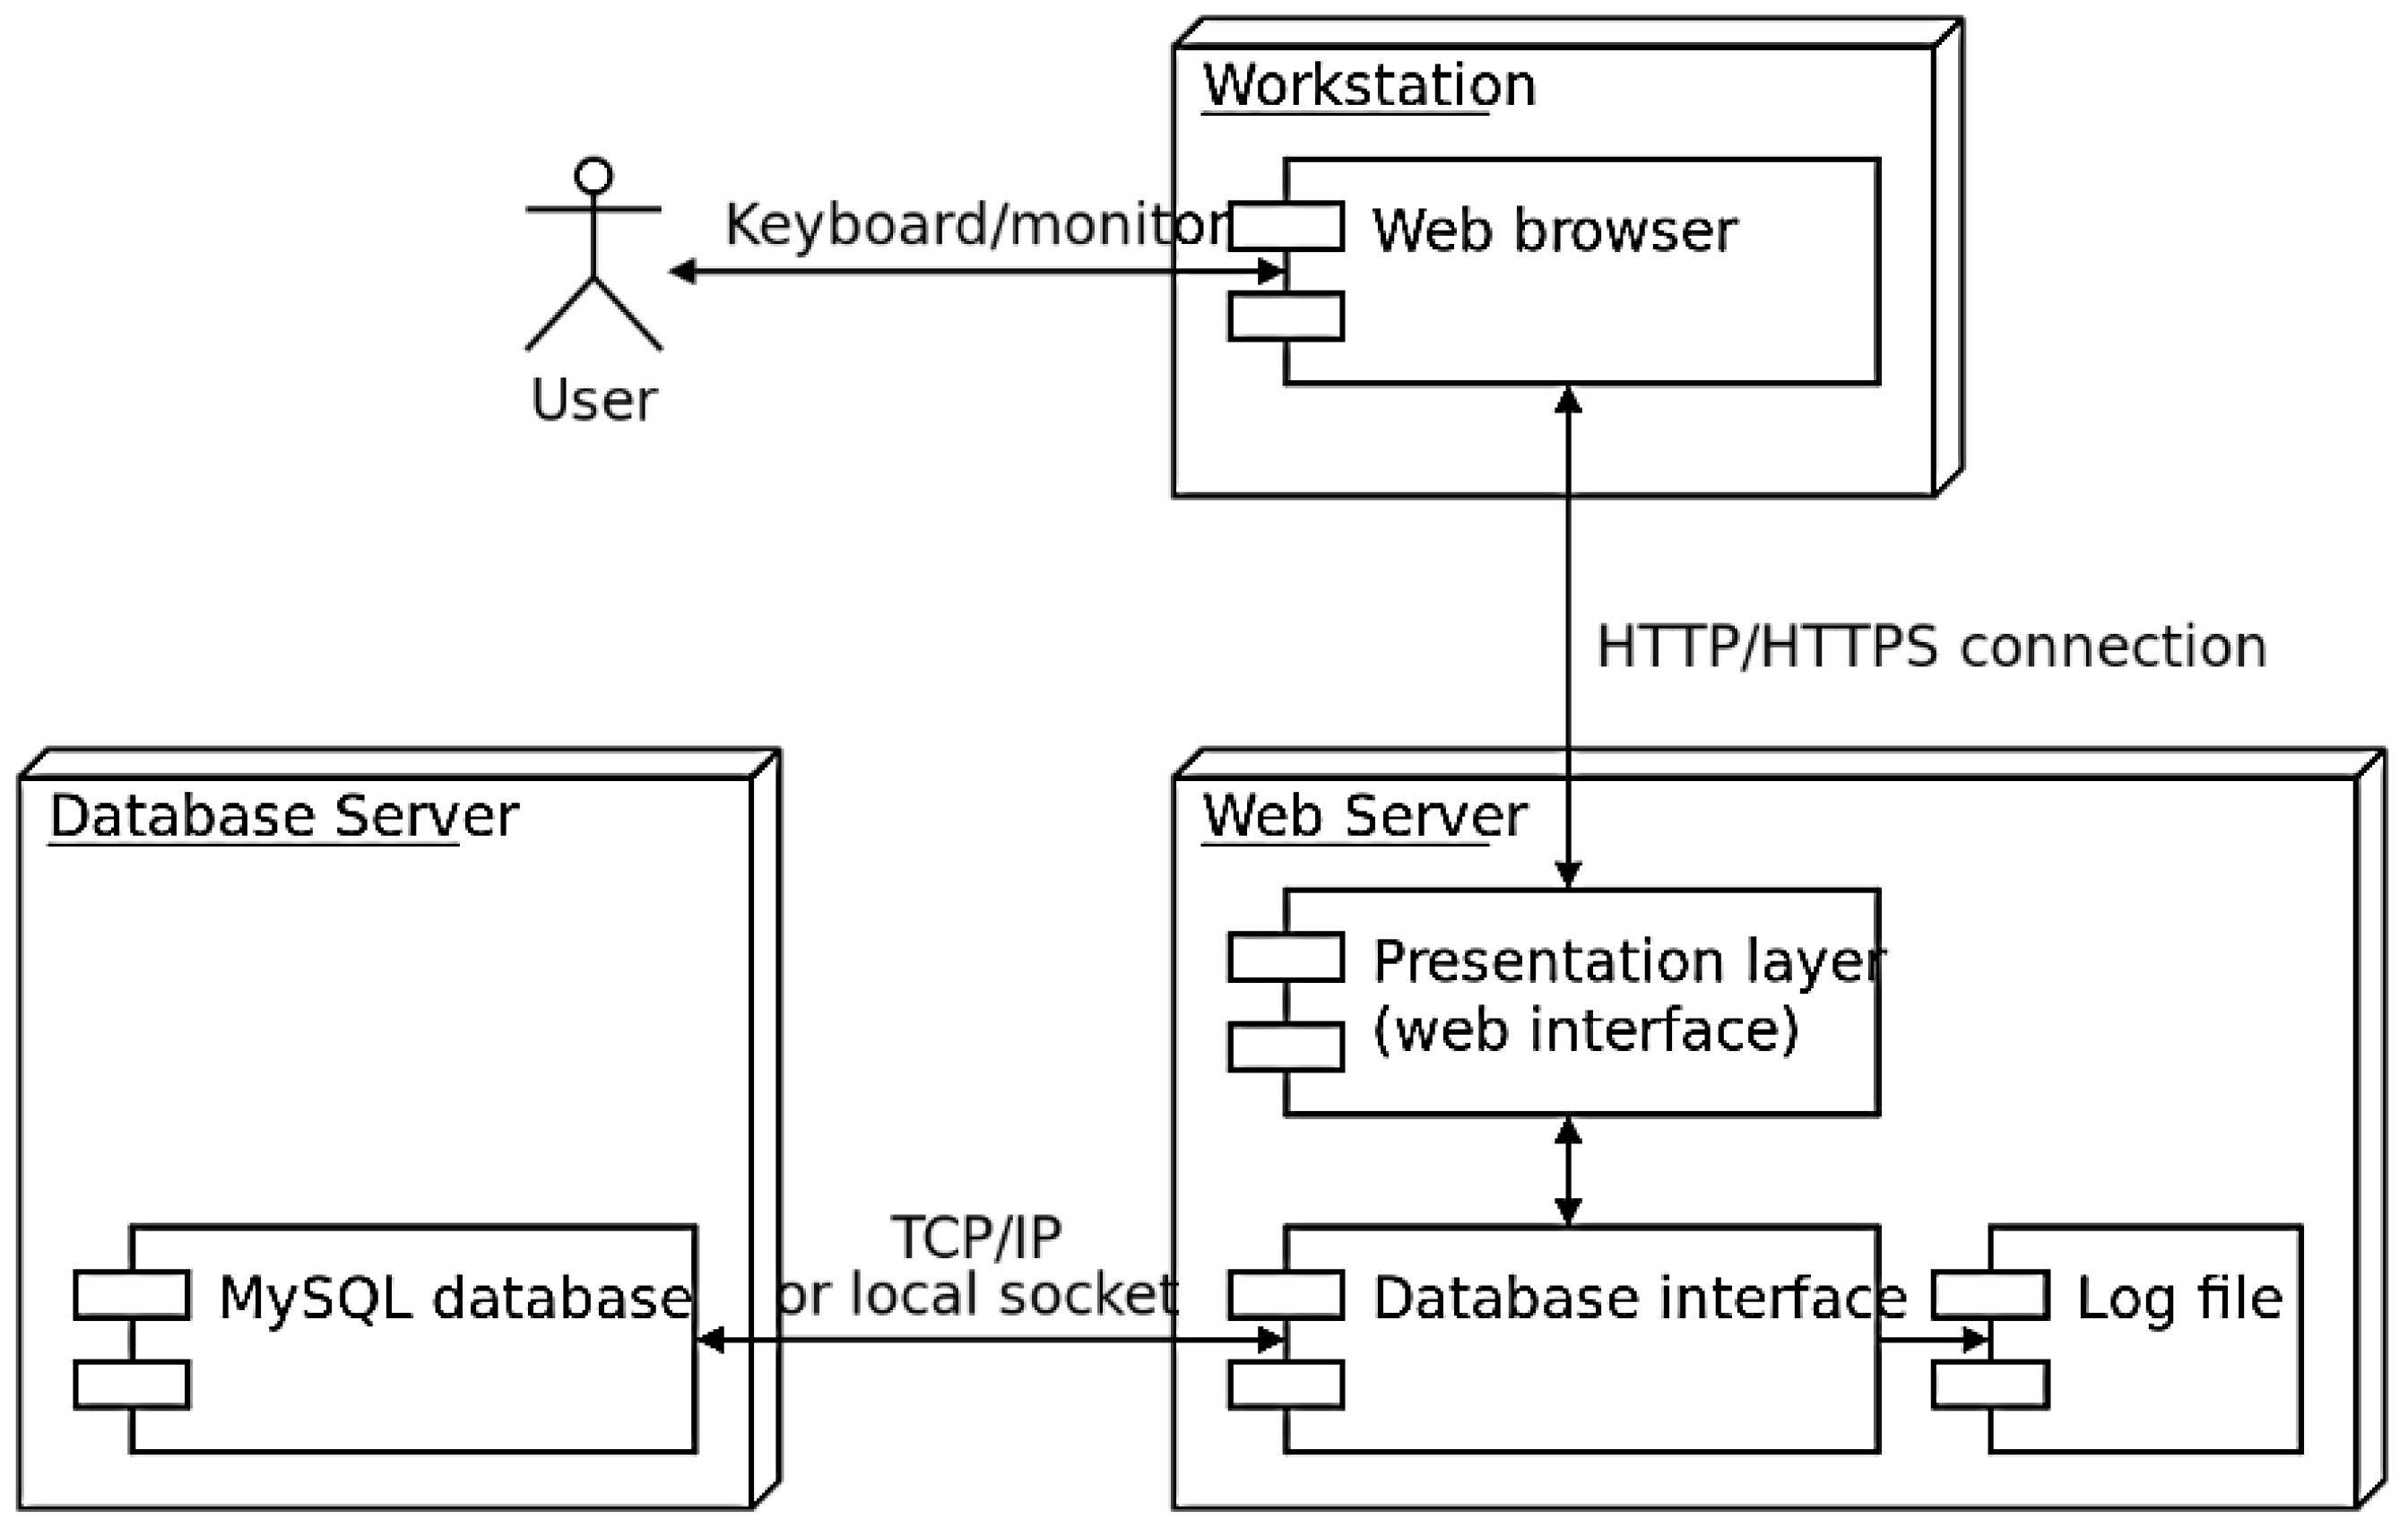
- system architecture development;
- system development and testing.
- they provide an opportunity for university structures involved in the transfer of R&D products (technology transfer centers, science parks, startup schools, and other innovation entities) to assess the economic feasibility of the product in the early stages of its readiness, which will help reduce the level of risks in the transfer and commercialization of products;
- they apply the author’s development in the educational processes of various specialties and educational and scientific programs of educational institutions;
- they promote sound pricing of R&D products based on a variety of product impact factors;
- they substantiate the strategy of transferring R&D products from universities to the business environment, strategies for their commercialization, etc.
2. Materials and Methods
2.1. Dataset Collection
2.2. Assessment Model Development
- number of variables randomly sampled as candidates at each split mtry = floor(sqrt(ncol(x))) = 16,
- number of trees ntree = 500.
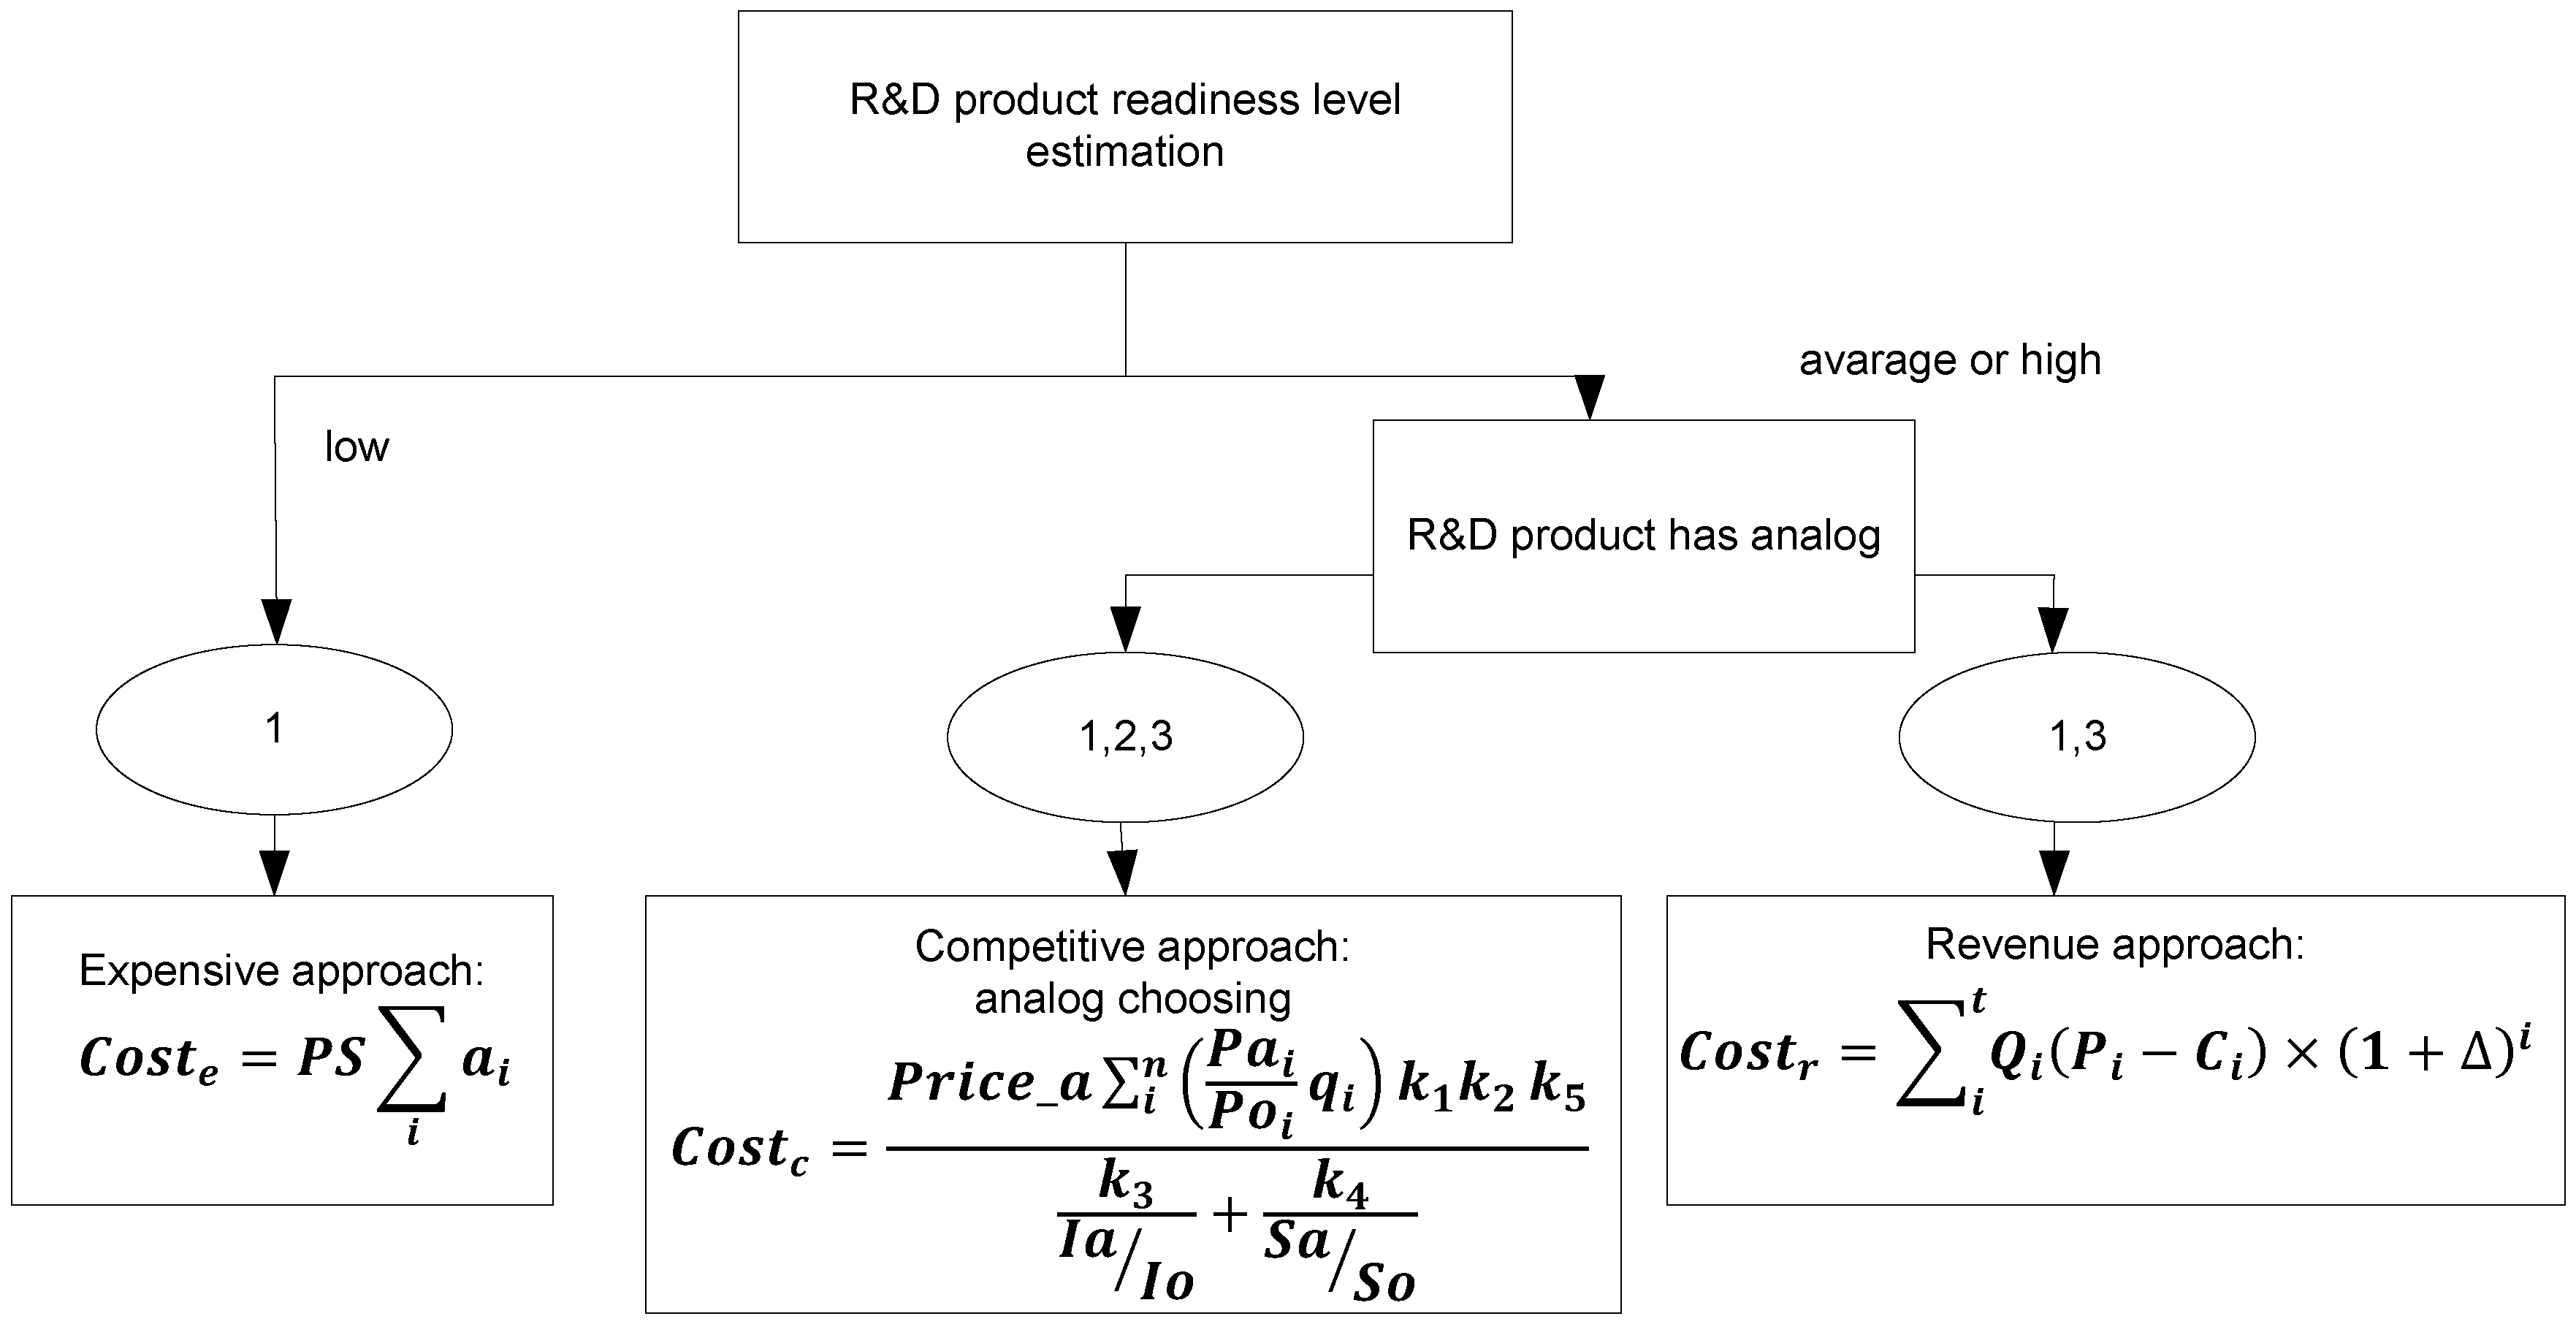
2.3. The Method for Cost Estimation of R&D Product
- The choosing of the evaluation method.
- The price estimation based on the chosen method or combination of methods. If more than one method is used, the possible price range is returned.
3. Results
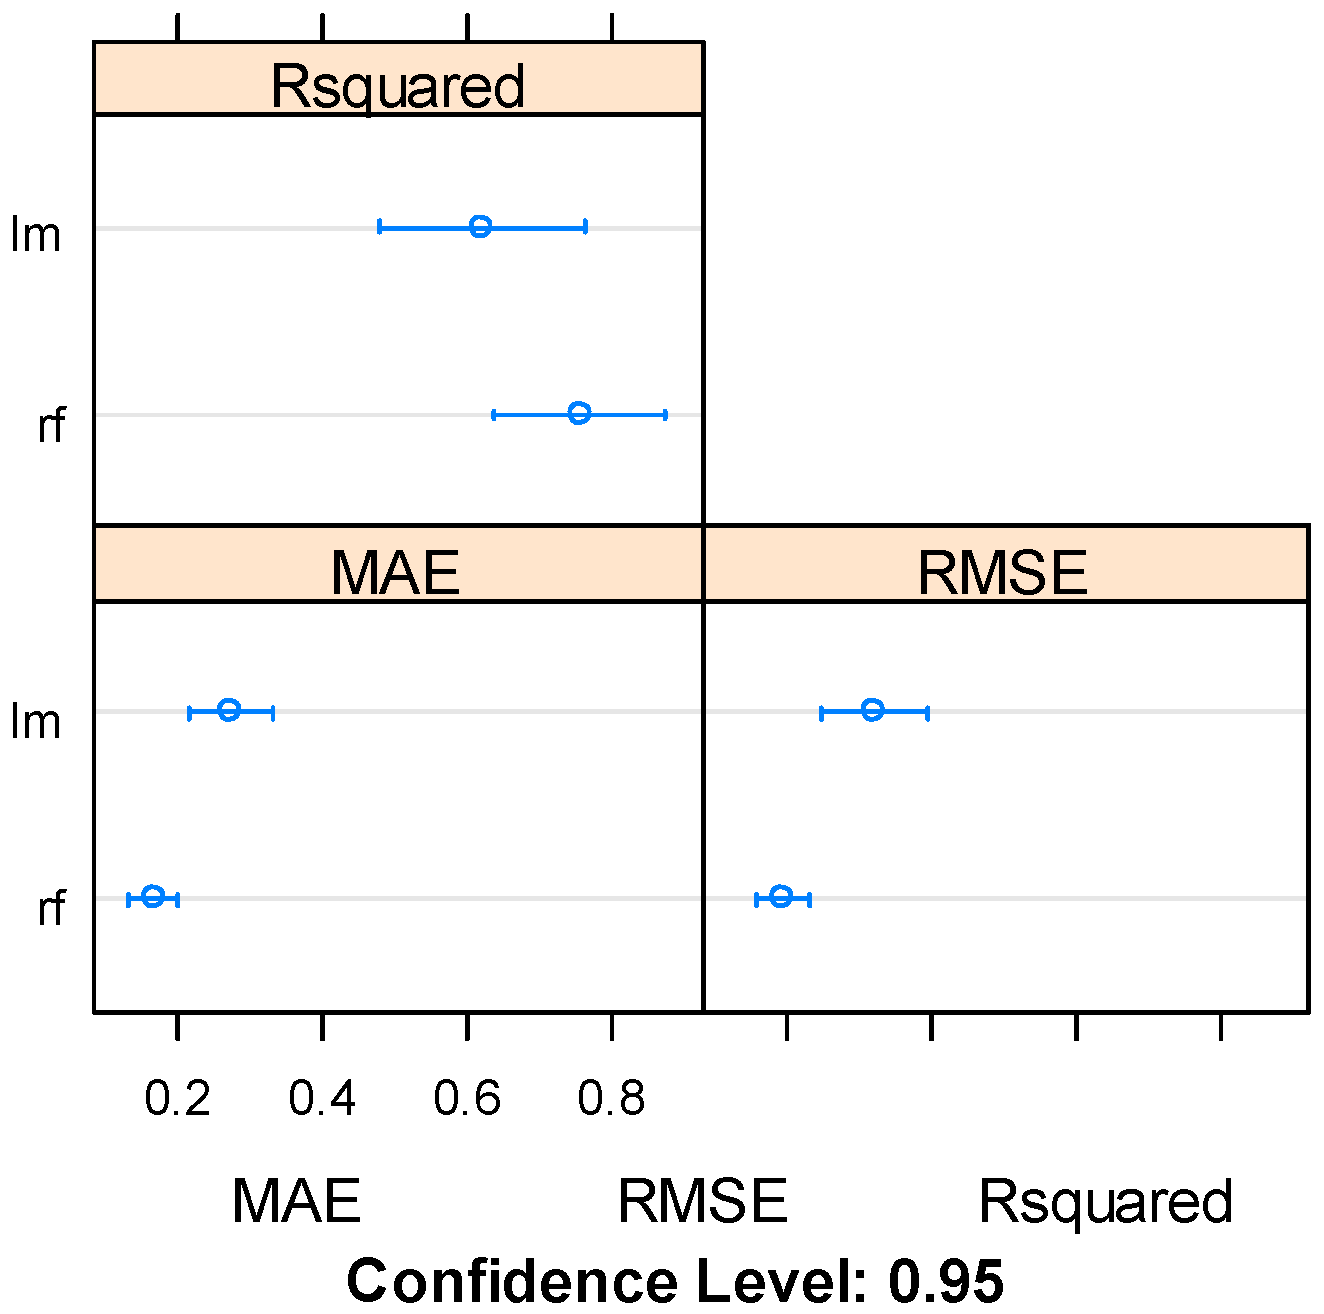
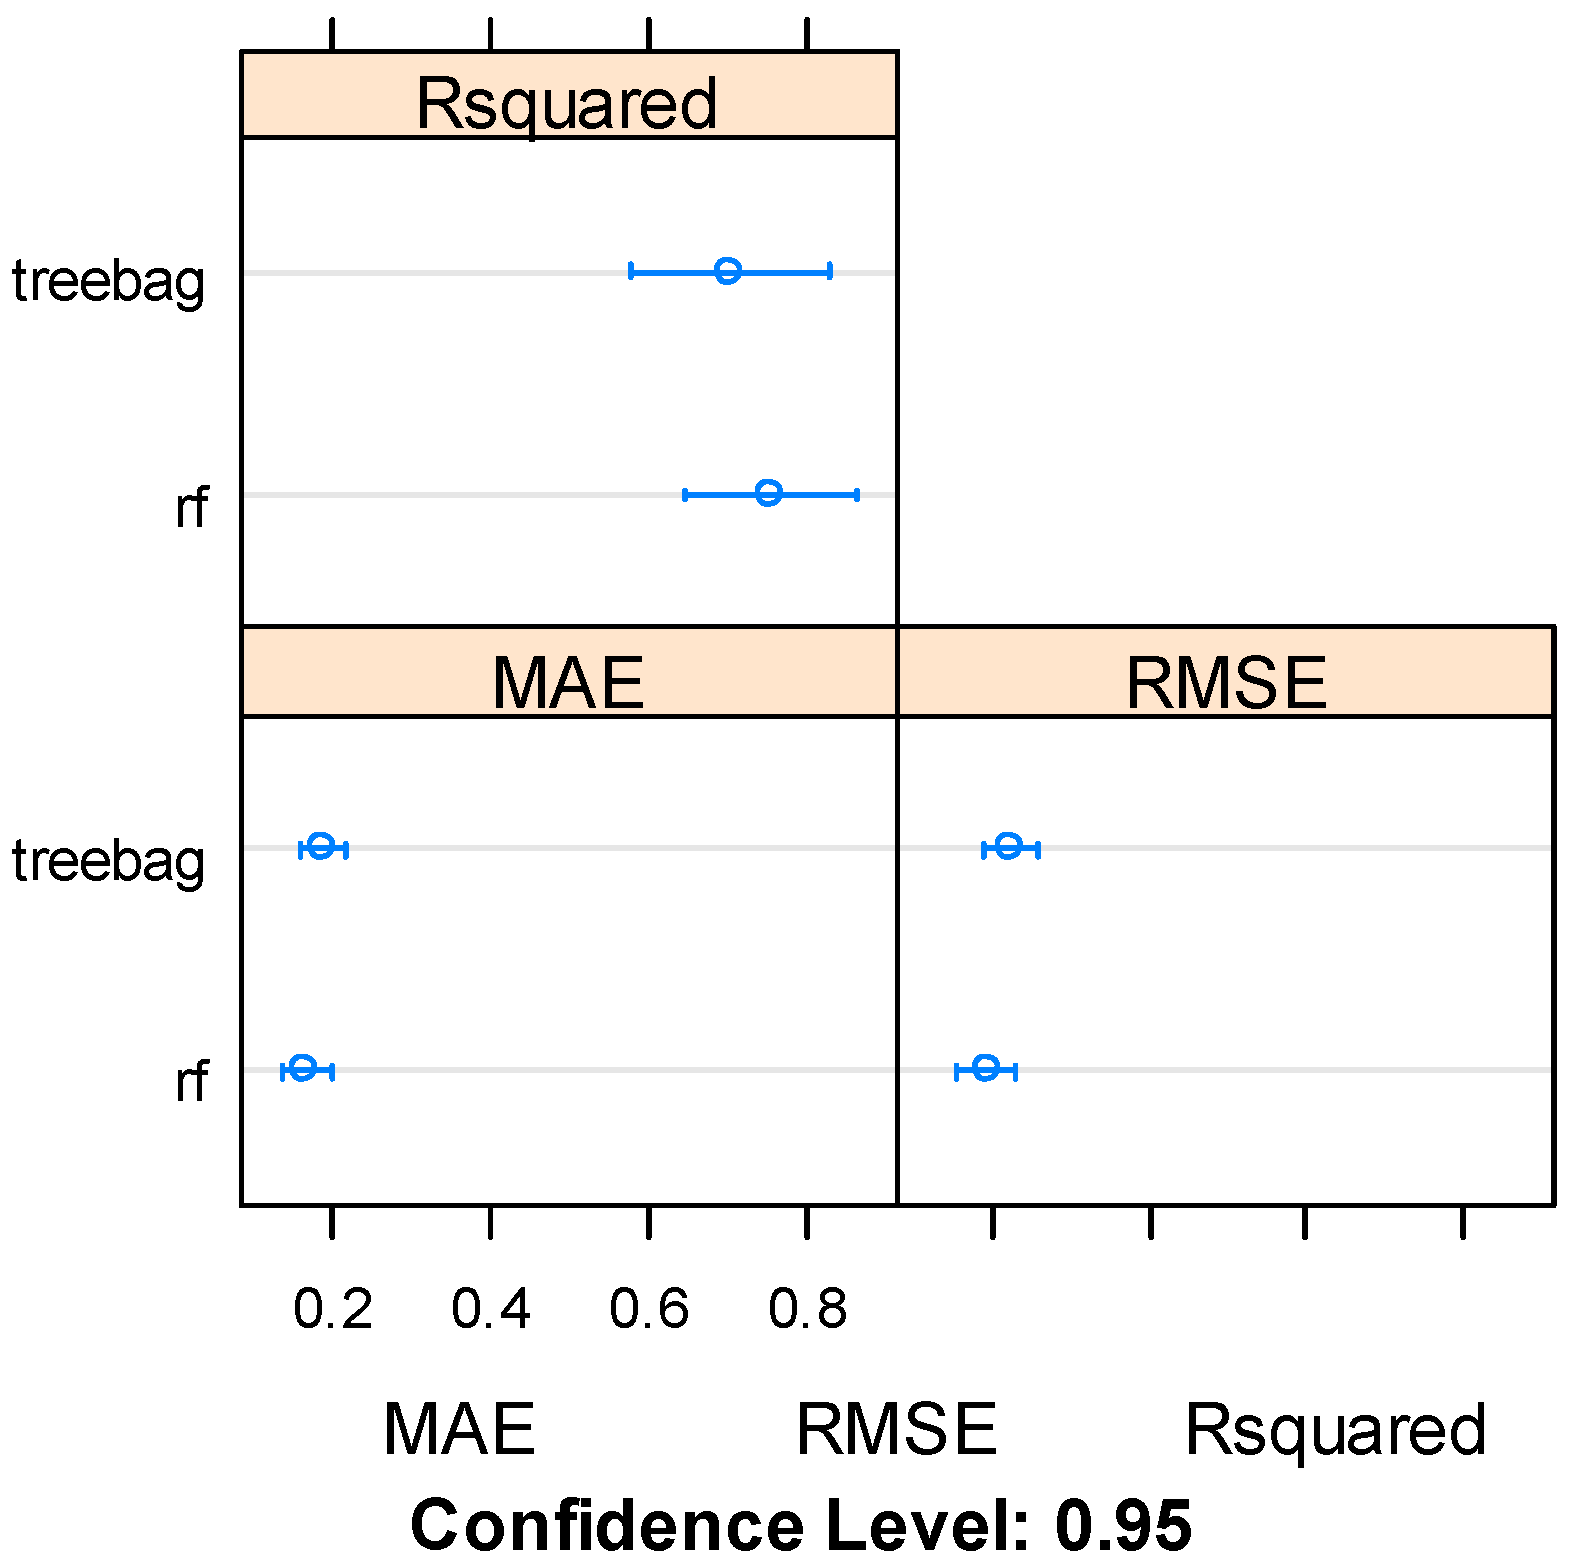
3.1. Results of Investigated Ensemble-Based Strategies for the Creation of the Model for the Readiness Assessment of R&D Products
3.2. Assessment Model Development
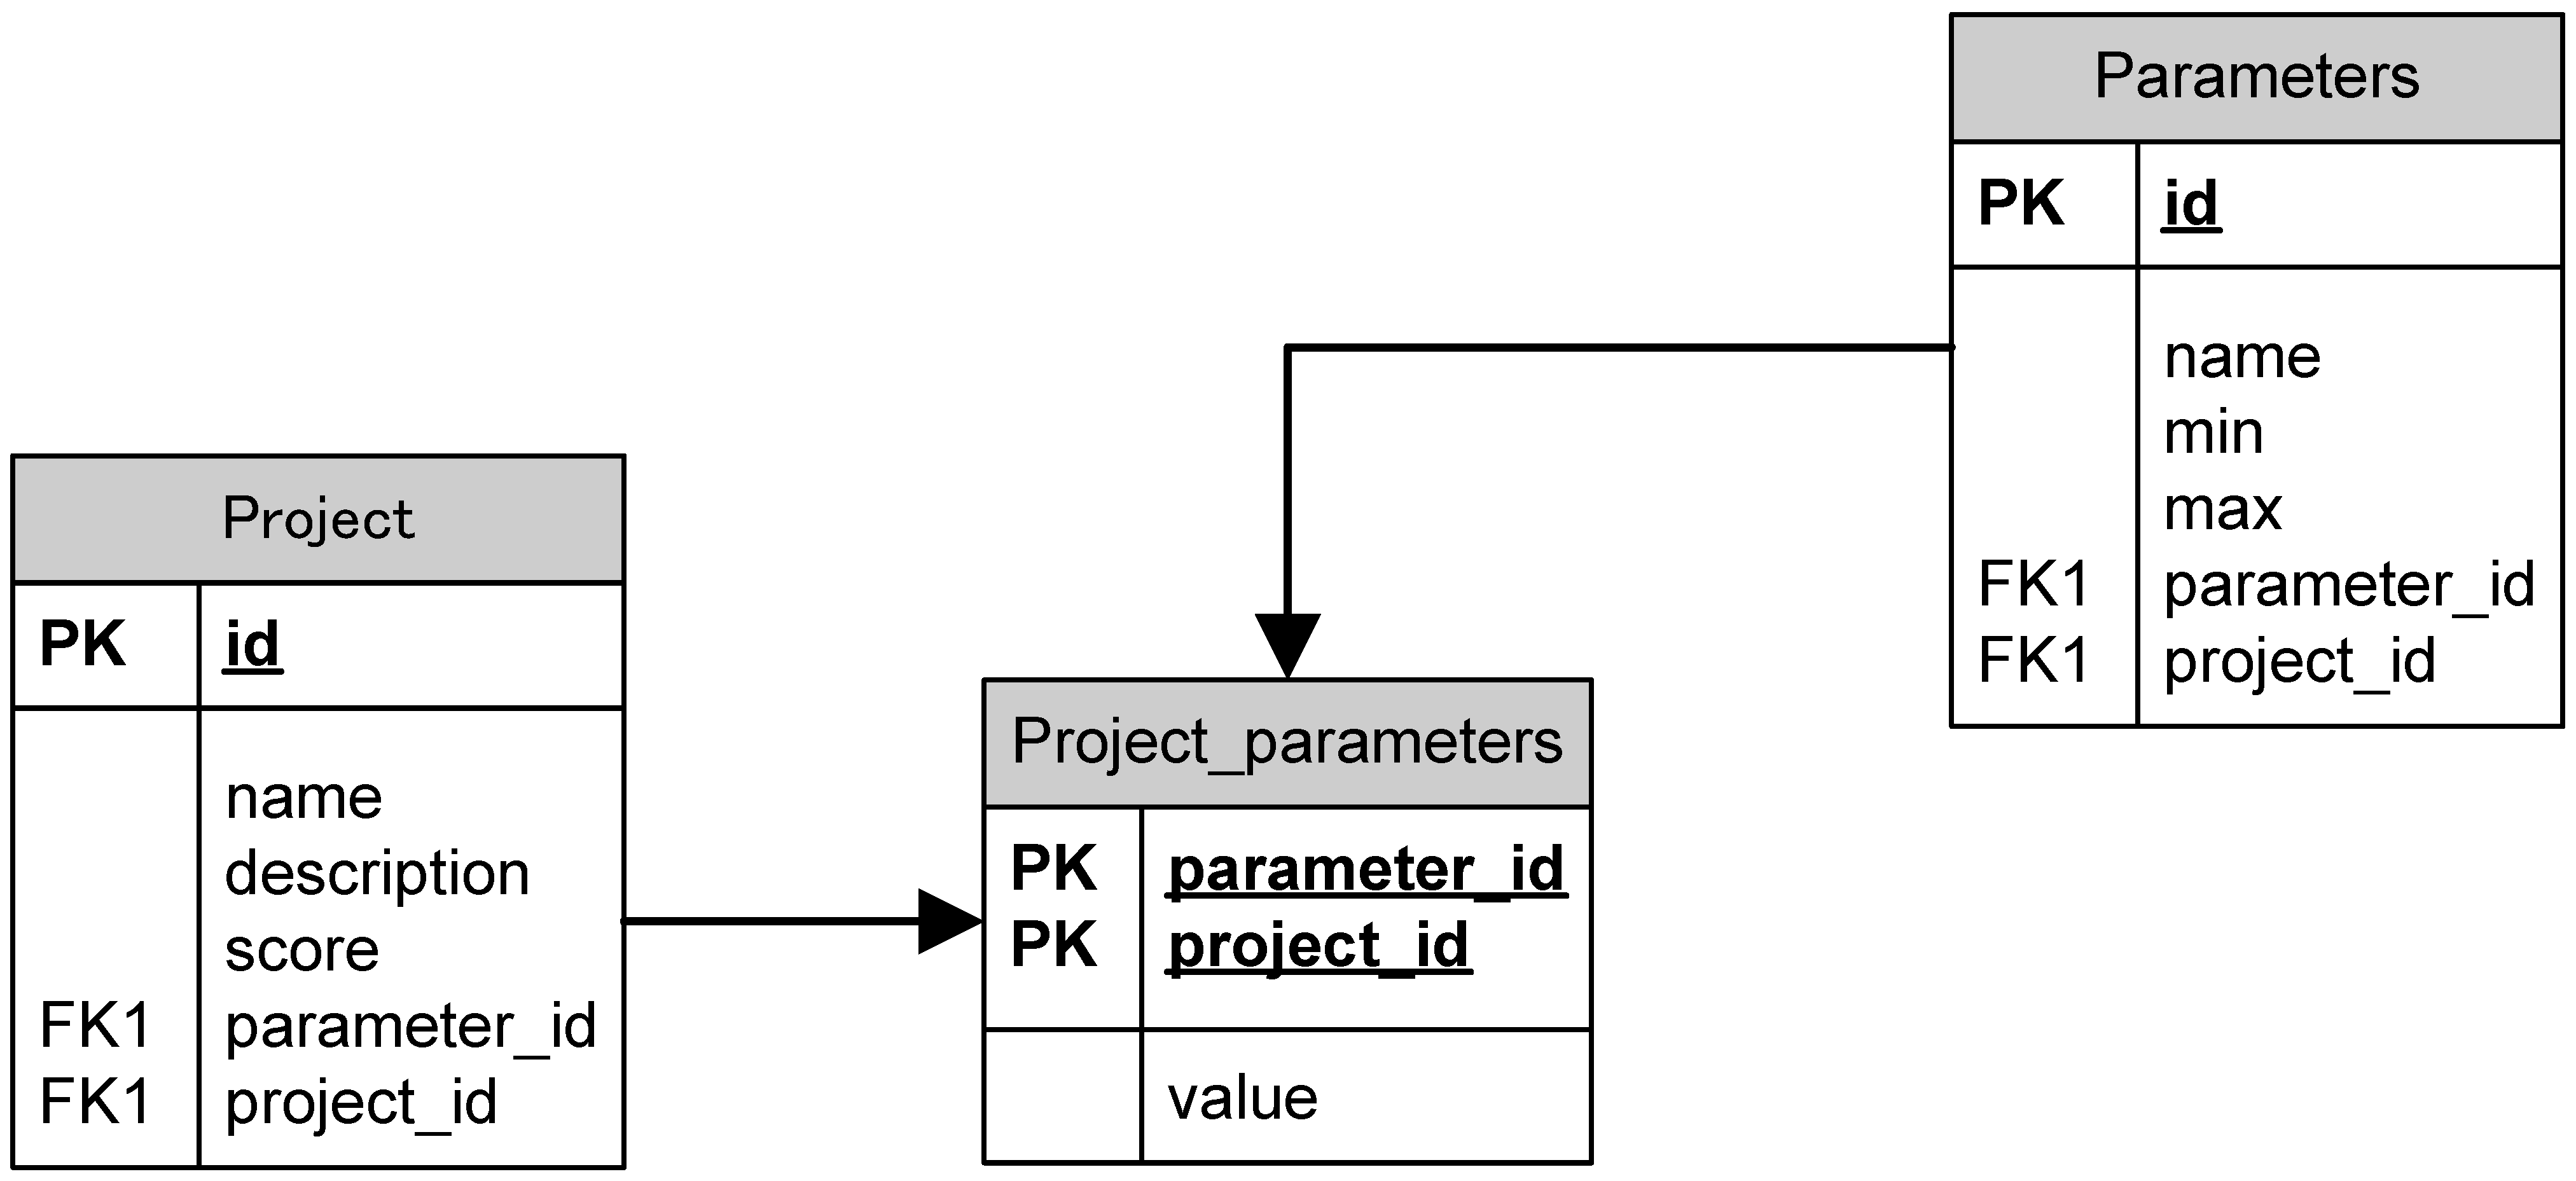
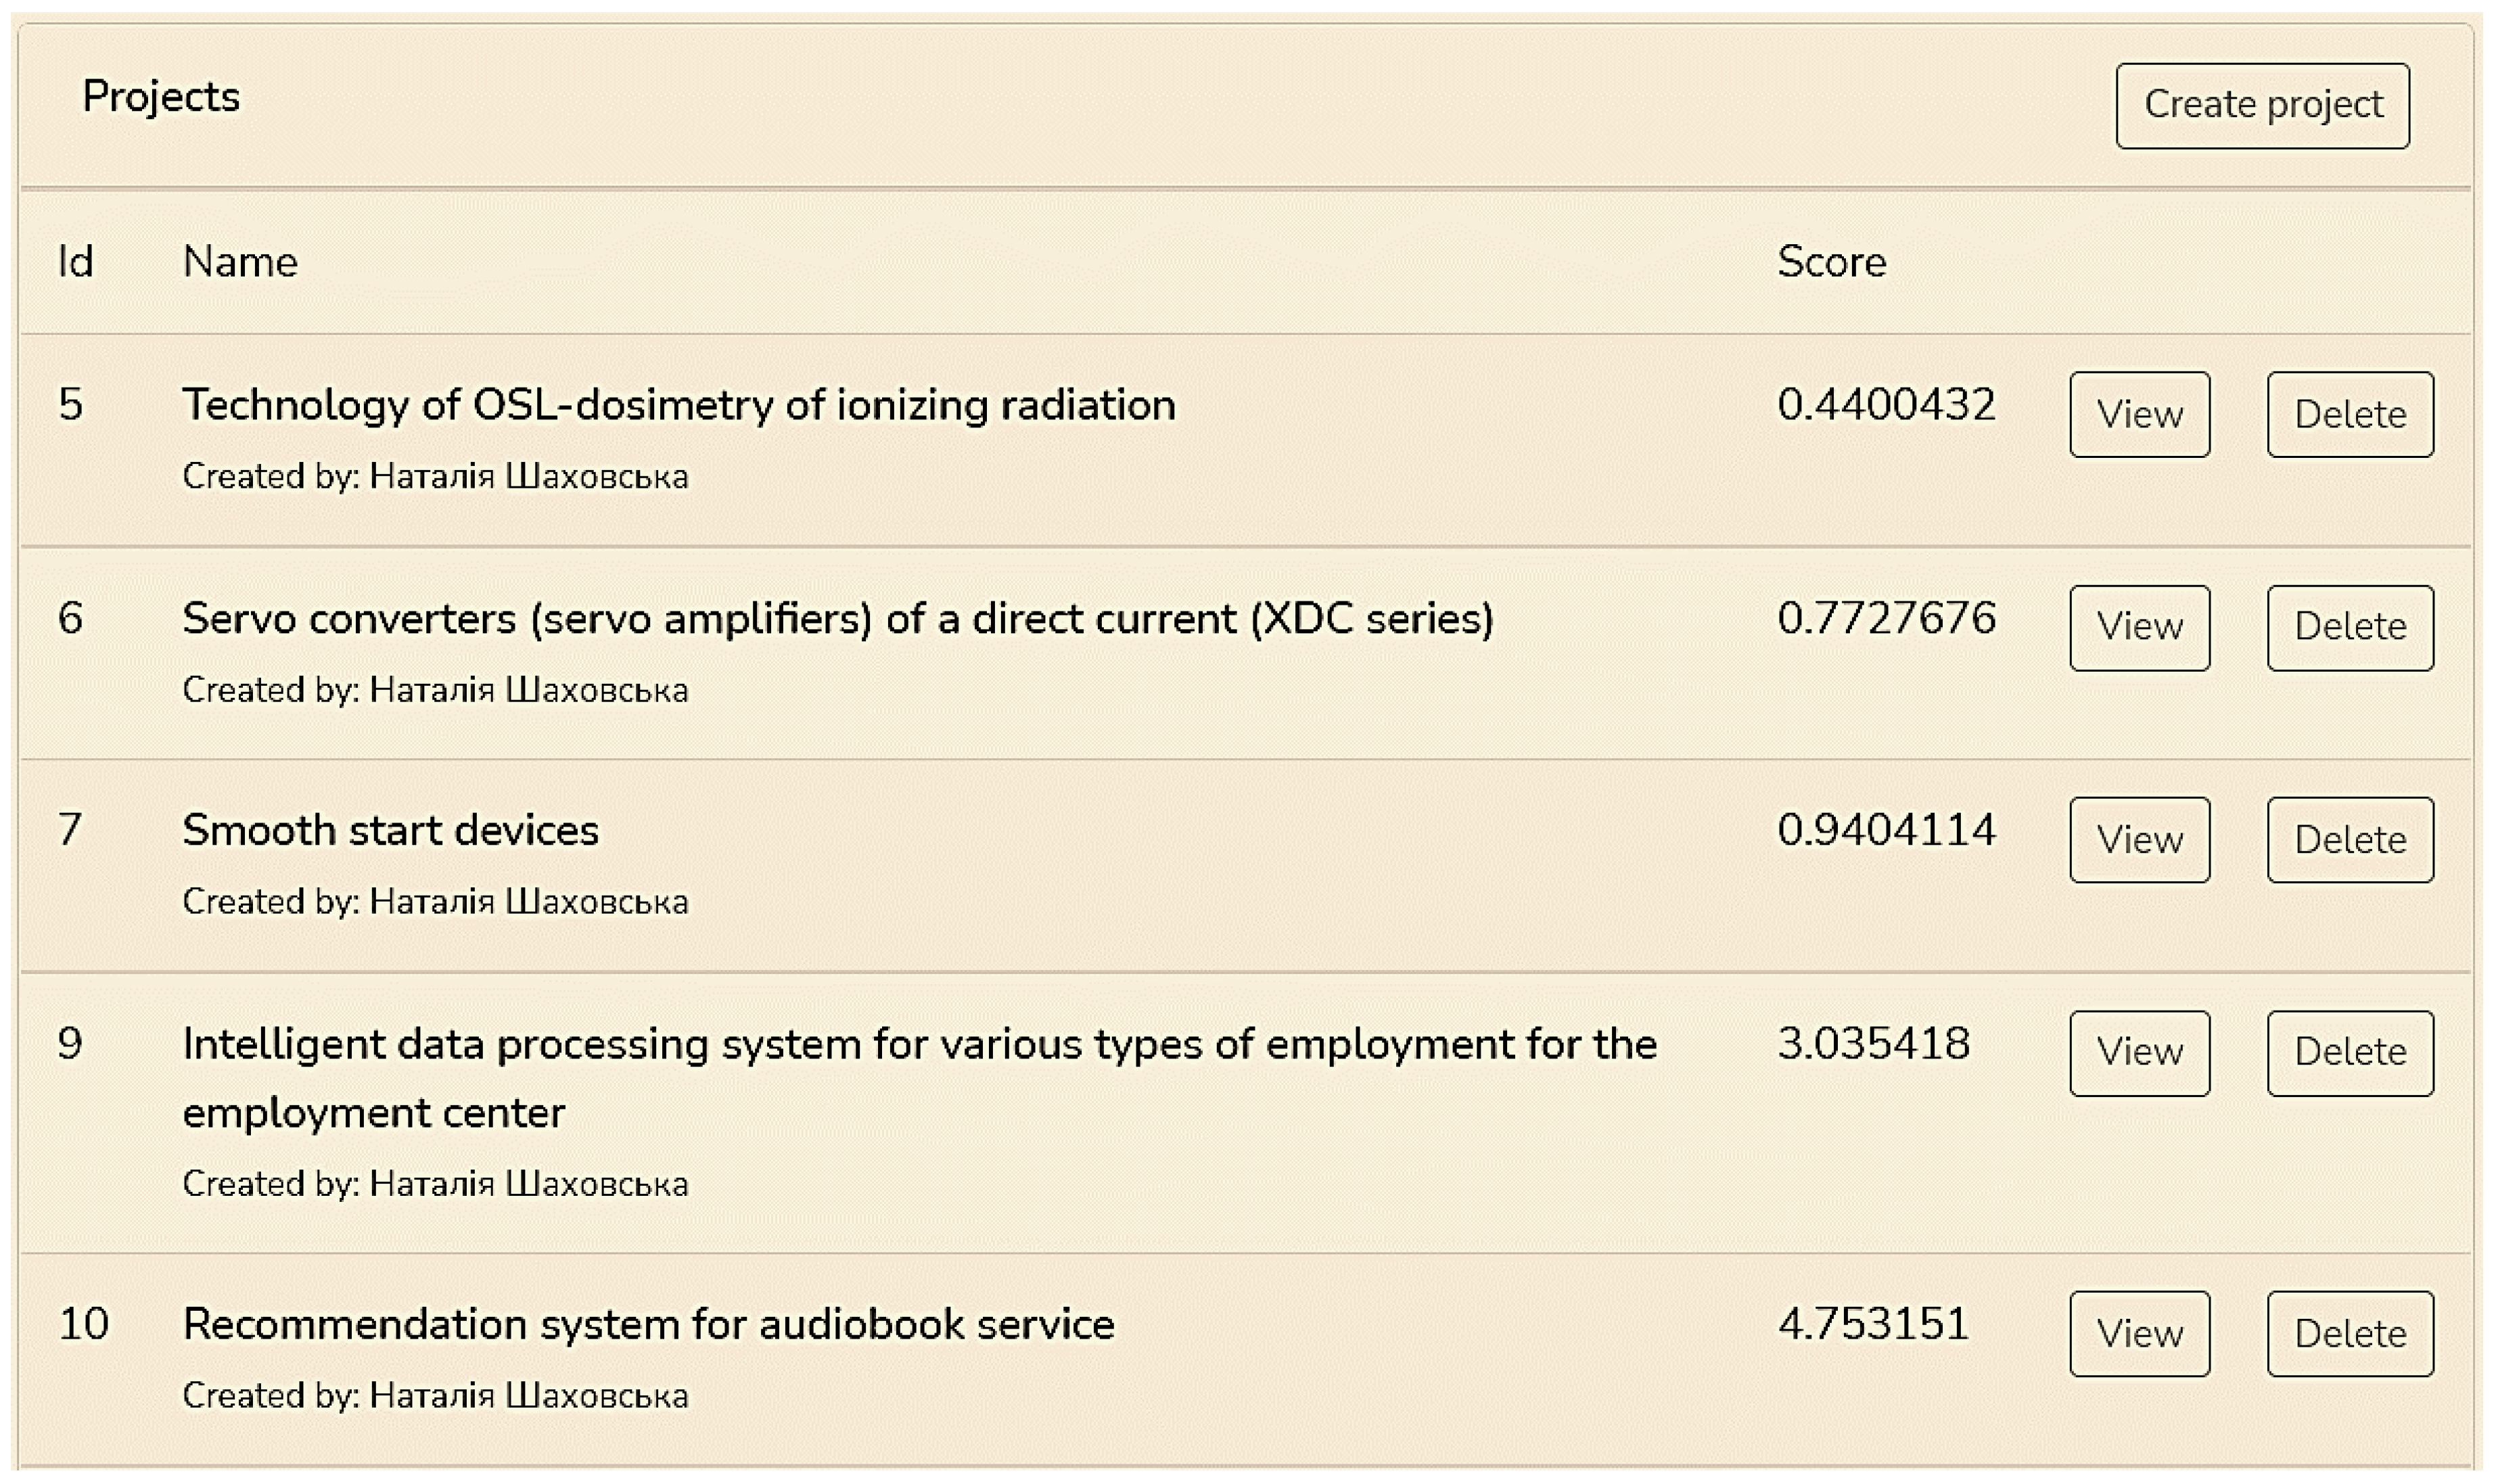
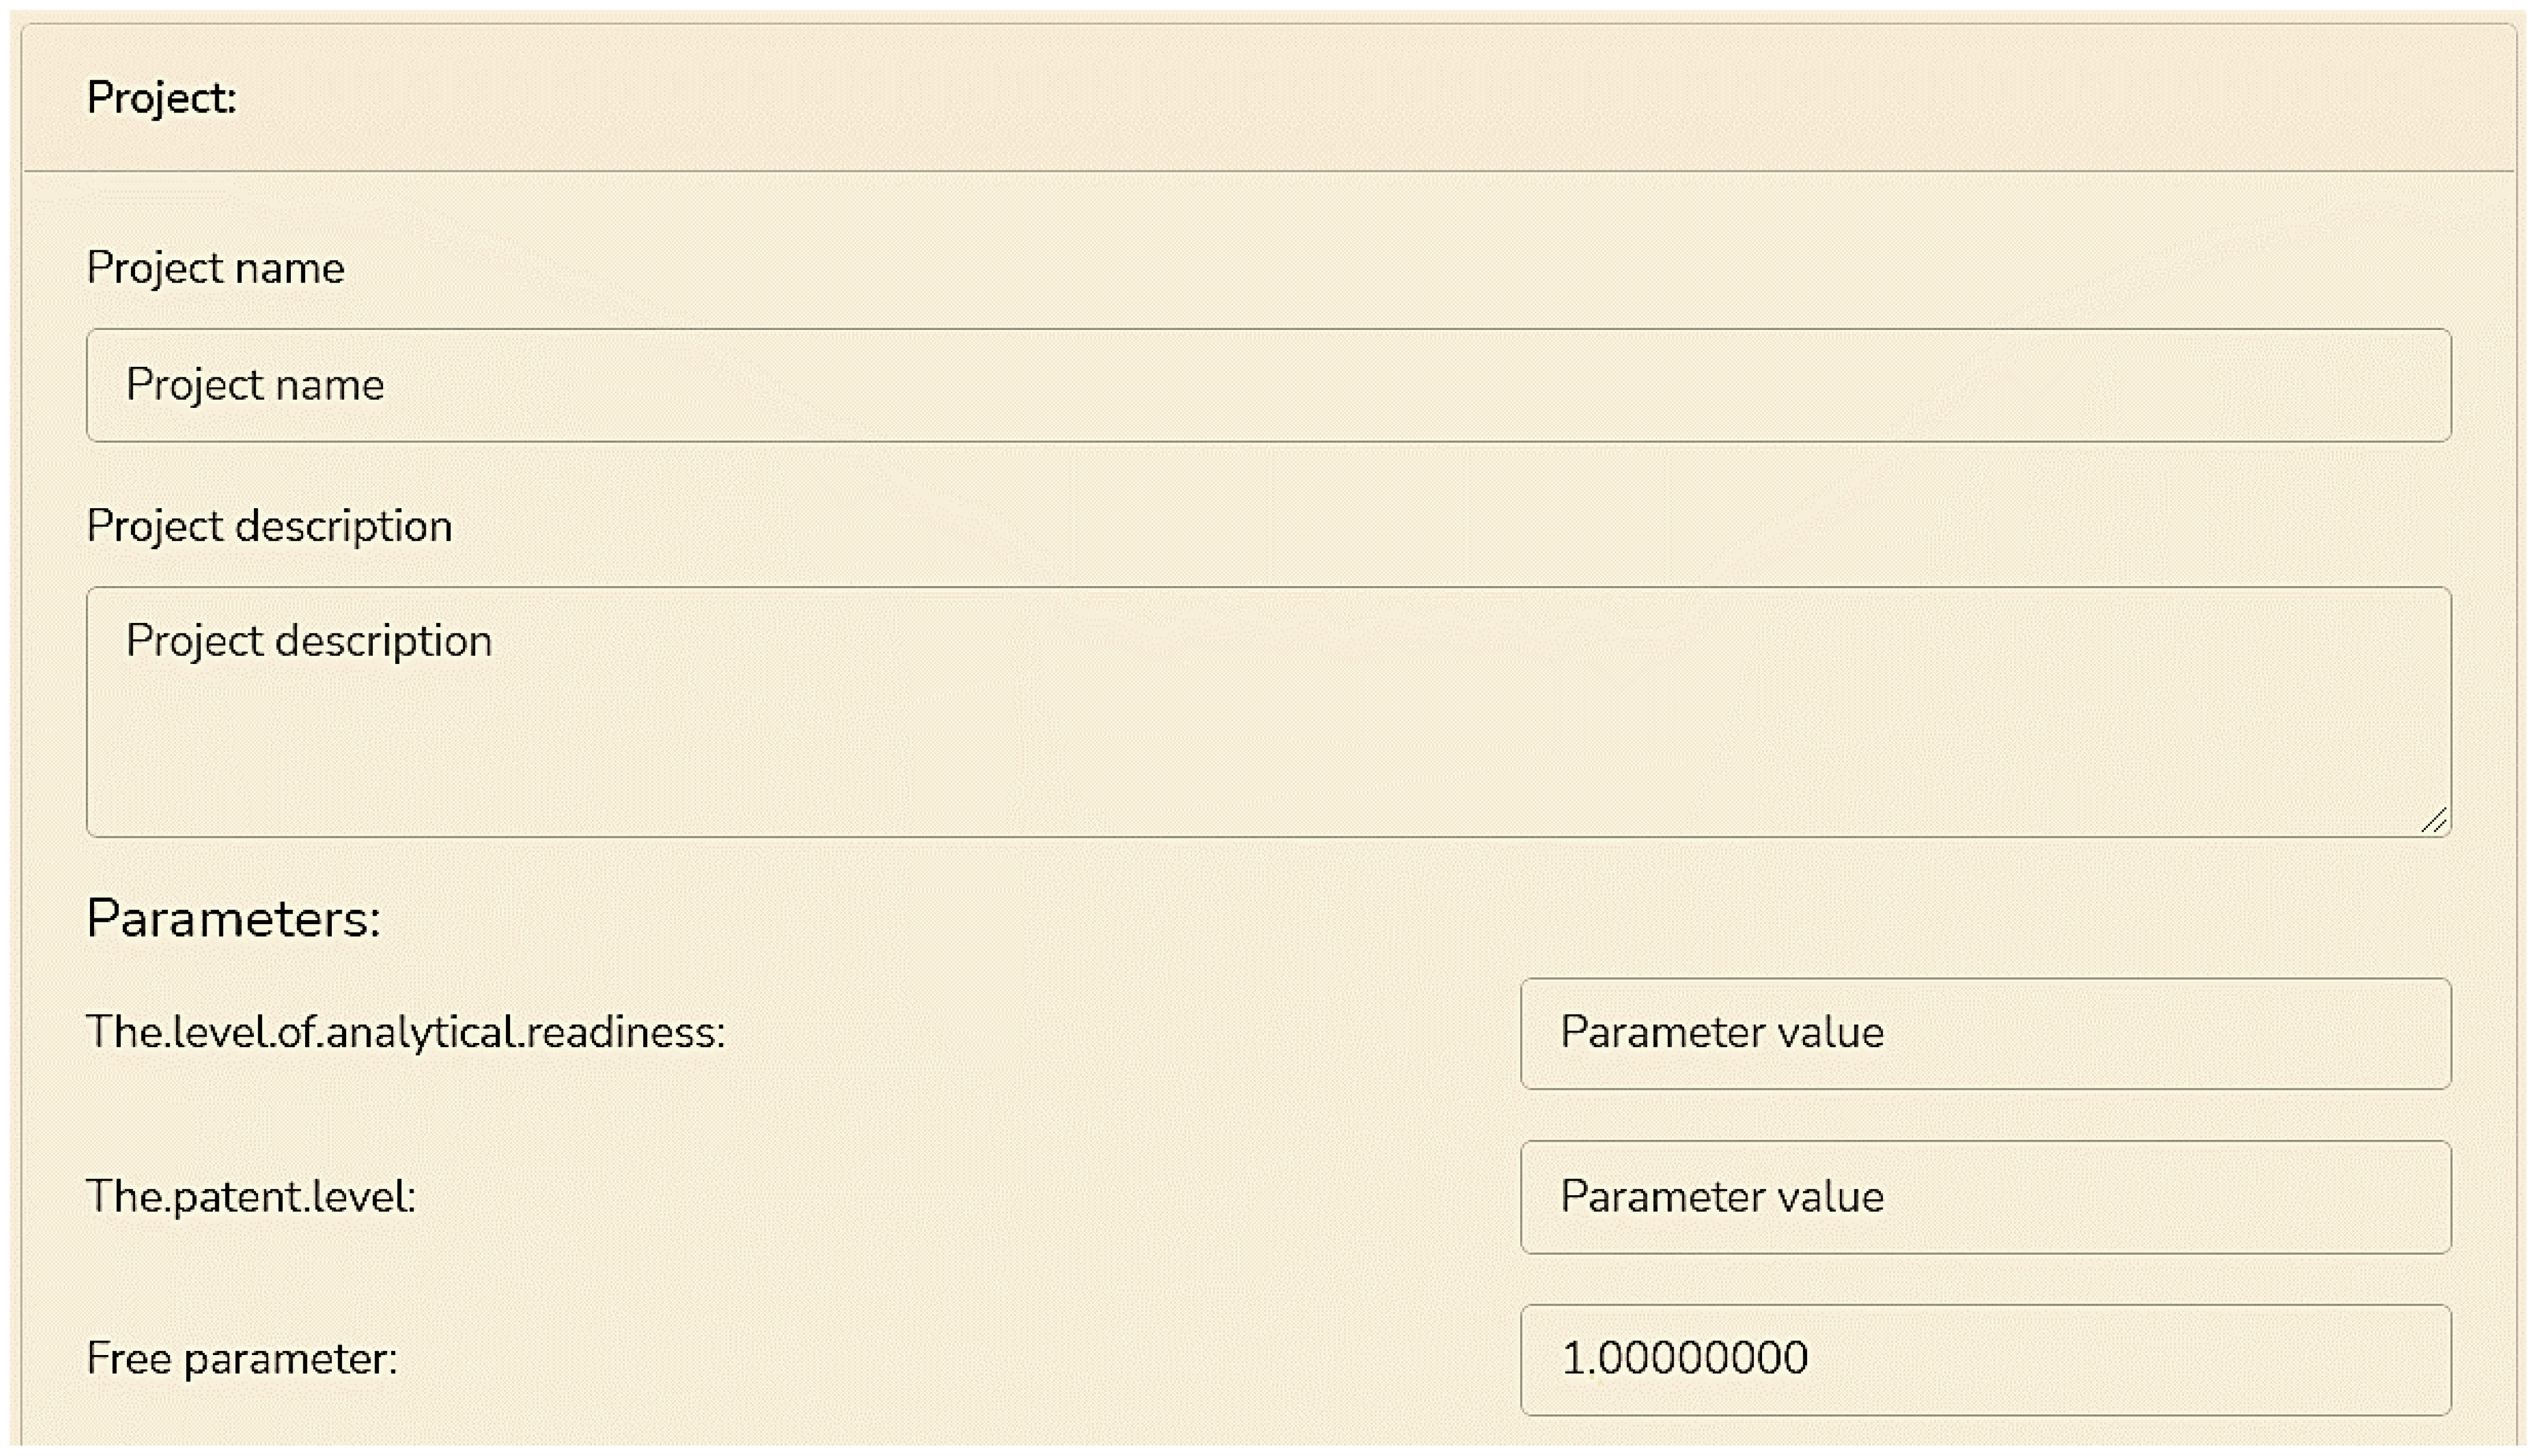
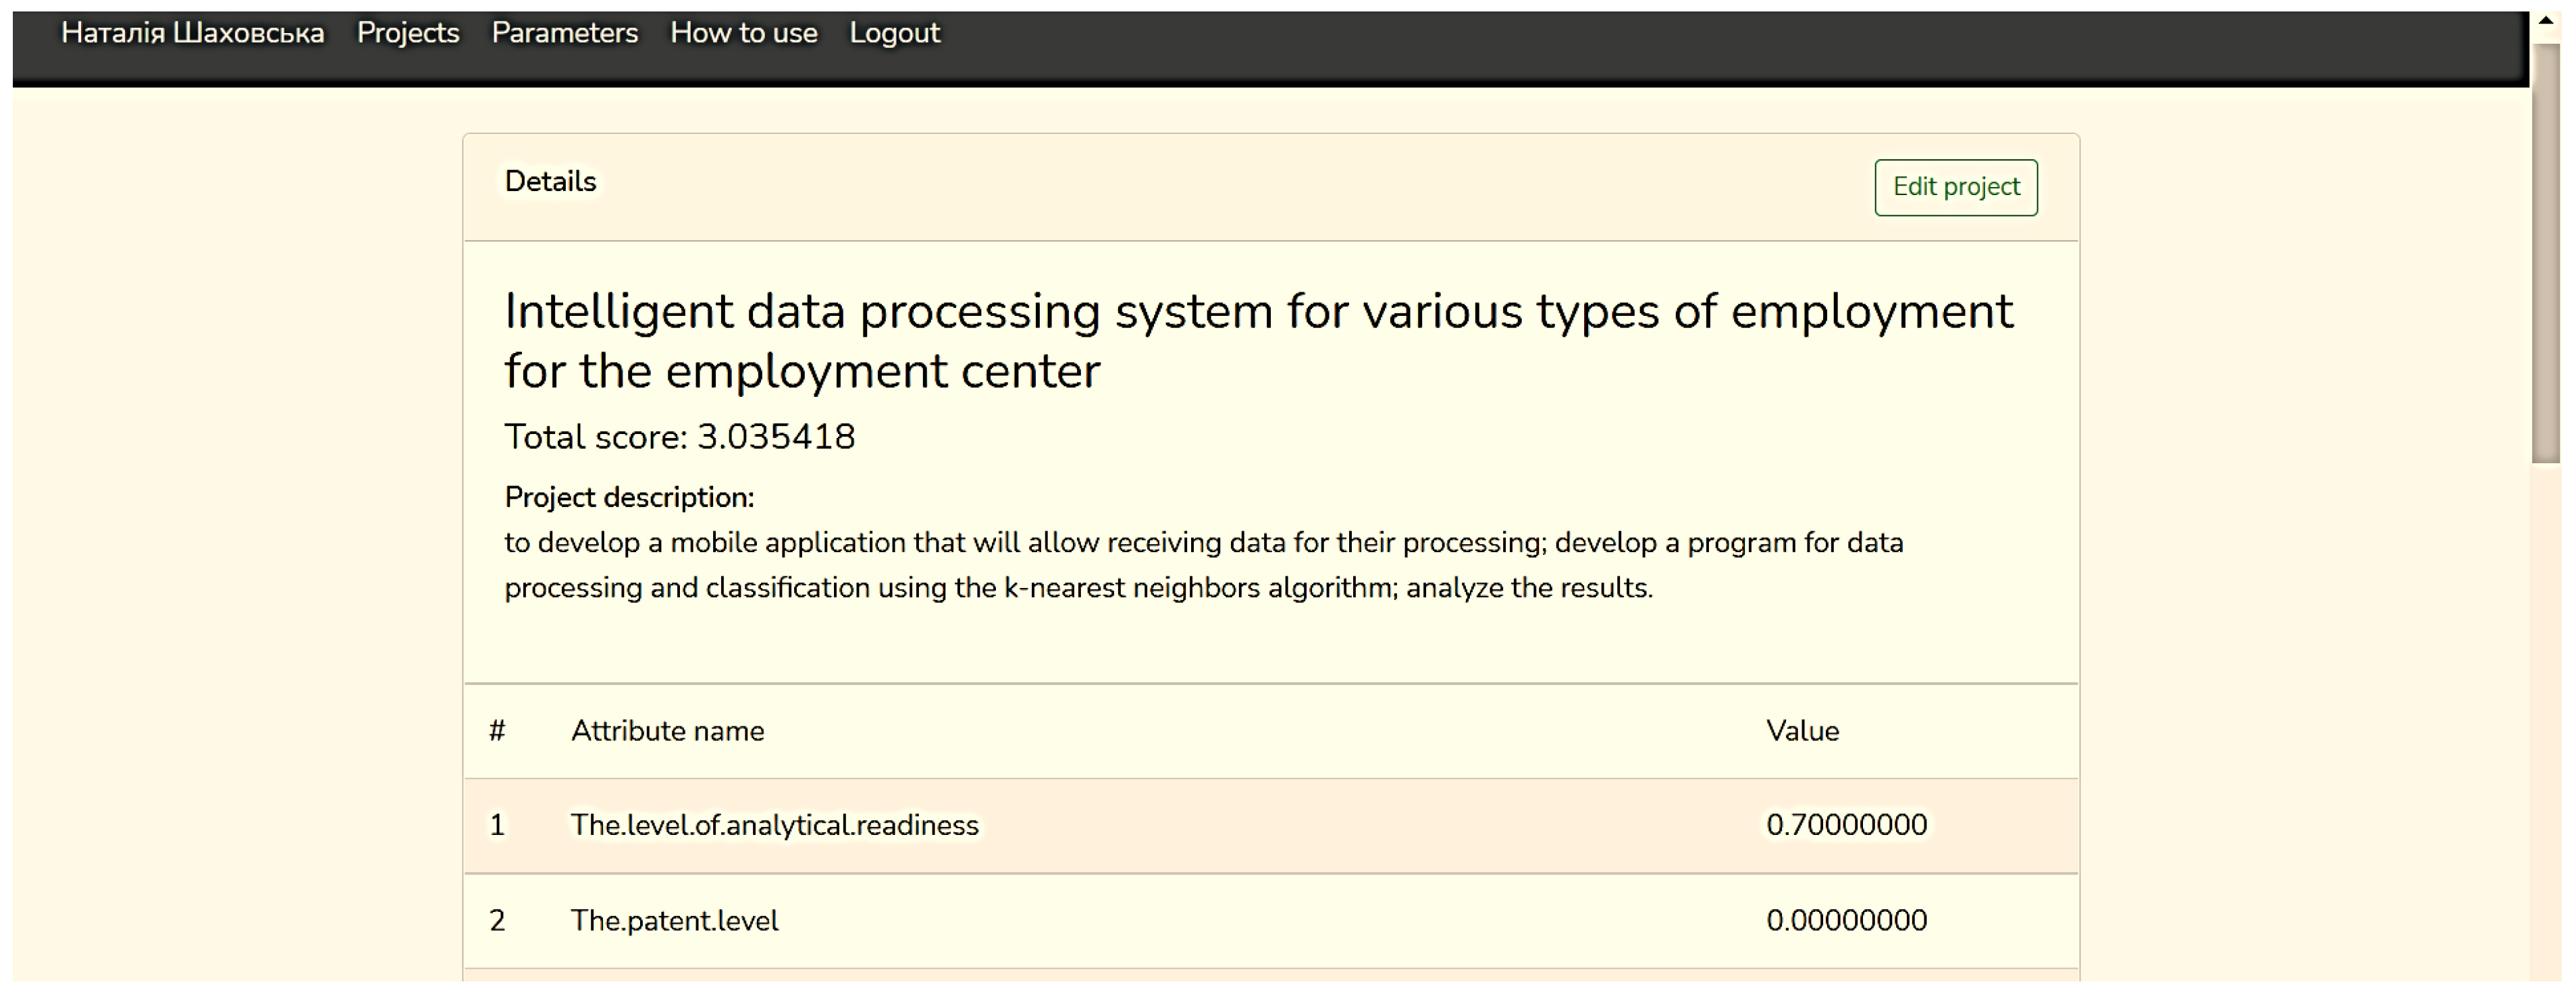
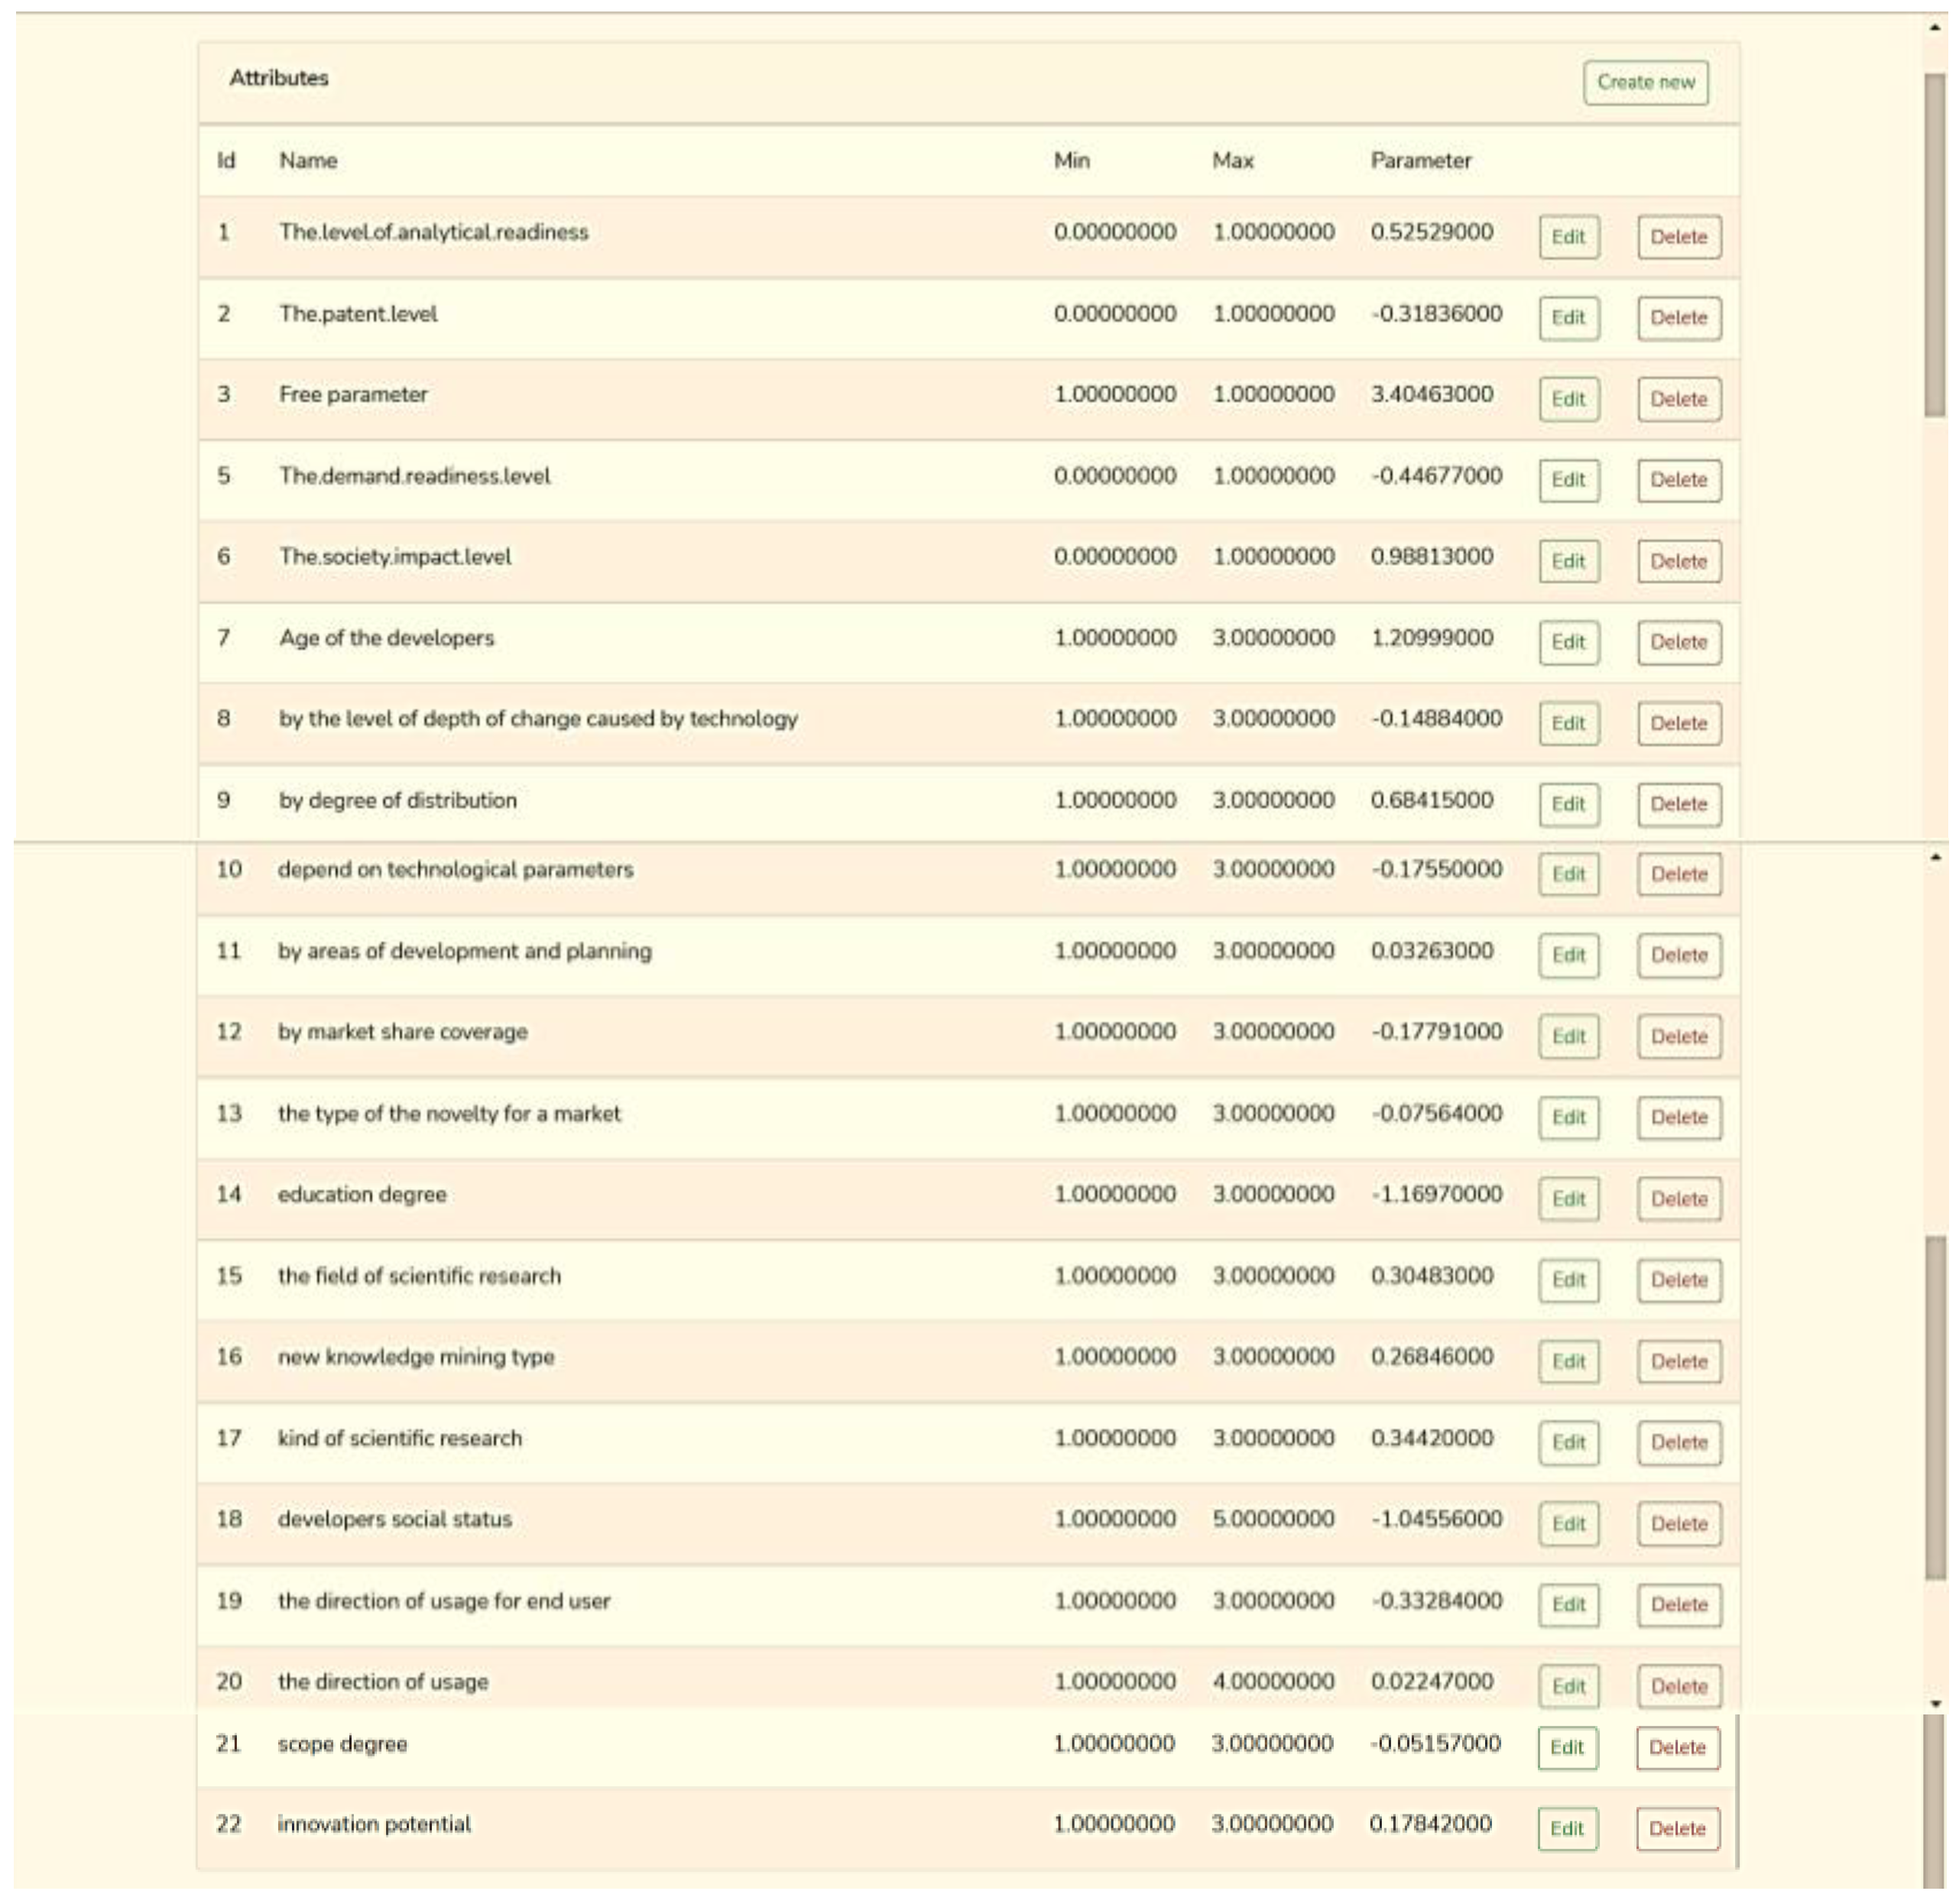
3.3. System Development and Testing
- determination of an integrated indicator of the readiness level of R&D products for commercialization, calculated based on the indicators’ aggregation for each block of the approach. This approach makes it possible to aggregate interdisciplinary positions in evaluating R&D products;
- assessment of the level of readiness of R&D products for a particular evaluation unit; analyzing the possibilities of the commercialization of R&D results in different variations of the ratio of readiness for the components;
- comparison of the levels of readiness of R&D products for commercialization when selecting projects for investment, as the obtained values of the integrated assessments of the readiness levels of R&D products are based on their feasibility study;
- application of the method when deciding whether to include R&D products in the entity’s assets.
4. Discussion and Conclusions
- R&D products’ readiness level assessment;
- R&D products’ cost estimation.
- an increase in the efficiency of transfer, commercialization, and market launch of R&D products,
- promotion of the interaction of all the components of national innovation infrastructure, innovations, etc.
- to carry out the operational transfer and commercialization of R&D products;
- to develop the policies of market pricing, giving opportunities to clarify the impact of components on the formation of value and, accordingly, the price of R&D products;
- to promptly respond to the market demands for innovation [2];
- to form the basis for the country’s successful technological and economic development [3].
- determining the moment and nature of the added value of product R&D (based on the justification of the relationship between levels of readiness and market perception of the product);
- taking into account the dynamism and extractive nature of the R&D product;
- separating the elements in the R&D of the product, which will further contribute to its market convergence, multiplicity, synergy, diffusion, etc. Economic forecasting of the possibility of such effects at the evaluation stage will allow adjusting the price of the product;
- the value expression of tangible and intangible value (object of intellectual property rights) of the R&D product;
- establishing the level of economic feasibility of product transfer/commercialization;
- modeling consumer sensitivity to the purchase of R&D products.
- striking a balance between “technology push” and “technology pull” strategies for the activities of developers working in university structures;
- the substantiation and selection of potential commercially attractive R&D products at the idea stage;
- a significant reduction in the risk of transferring R&D products from universities to the business environment and their commercialization;
- elaboration of scenarios for the creation of companies such as “spin” (spin-off, spin-out), which are based on the results of the prospects of R&D products, obtained through the author’s approach to modeling the value and readiness of products;
- filling gaps in the predominantly low level of entrepreneurial knowledge and competencies of university developers (and, consequently, insufficient level of understanding of market needs and features of commercialization);
- the substantiation of business models of the transfer of R&D products in universities, etc.
Author Contributions
Funding
Data Availability Statement
Acknowledgments
Conflicts of Interest
Appendix A. Descriptive Statistics

| Readiness | The Level of Analytical Readiness | The Patent Level | The Demand Readiness Level | The Society Impact Level | Age | Influence Level | Wide Usage | Technological Complexity | Area | Part of Market | Novelty | Education Level | Scientific Level | New Knowledge | Type of Scientific Research | Social Group | |
|---|---|---|---|---|---|---|---|---|---|---|---|---|---|---|---|---|---|
| Min. | 0.22 | 0.11 | 0 | 0.25 | 0.25 | 1 | 1 | 1 | 1 | 1 | 1 | 1 | 2 | 2 | 1 | 1 | 4 |
| 1st Qu. | 0.66 | 0.44 | 0 | 0.5 | 0.375 | 3 | 2 | 1 | 1 | 1 | 1 | 2 | 3 | 3 | 2 | 2 | 4 |
| Median | 0.88 | 0.56 | 0 | 0.5 | 0.5 | 3 | 2 | 1 | 2 | 1 | 2 | 3 | 3 | 3 | 2 | 2 | 5 |
| Mean | 0.78 | 0.61 | 0.26 | 0.58 | 0.52 | 2.74 | 2.37 | 1.37 | 1.8 | 1.81 | 1.63 | 2.44 | 2.81 | 2.89 | 1.93 | 1.96 | 4.59 |
| 3rd Qu. | 1 | 0.775 | 0.75 | 0.75 | 0.75 | 3 | 3 | 2 | 2.5 | 2.5 | 2 | 3 | 3 | 3 | 2 | 2 | 5 |
| Max. | 1 | 1 | 0.75 | 1 | 1 | 3 | 3 | 2 | 3 | 5 | 3 | 3 | 3 | 3 | 2 | 2 | 5 |
| Direction of Technology for the Consumer | Direction of Action | Value | Innovative Level | |
|---|---|---|---|---|
| Min. | 1 | 1 | 1 | 1 |
| 1st Qu. | 1 | 2 | 1 | 2 |
| Median | 1 | 2 | 1 | 2 |
| Mean | 1.96 | 2.48 | 1.56 | 2.41 |
| 3rd Qu. | 3 | 3 | 2 | 3 |
| Max. | 3 | 4 | 3 | 3 |
Appendix B. Correlation Matrix
| Var1 | Var2 | Freq | |
|---|---|---|---|
| 1 | readiness | readiness | 1 |
| 2 | The.level.of.analytical.readiness | readiness | 0.426211 |
| 3 | The.patent.level | readiness | −0.0648 |
| 4 | The.demand.readiness.level | readiness | −0.00967 |
| 5 | The.society.impact.level | readiness | 0.21396 |
| 6 | age | readiness | −0.08677 |
| 7 | influence.level | readiness | 0.133182 |
| 8 | wide.usage | readiness | 0.062229 |
| 9 | technological.complexity | readiness | −0.18923 |
| 10 | area | readiness | −0.32458 |
| 11 | part.of.market | readiness | 0.037499 |
| 12 | novelty | readiness | −0.12008 |
| 13 | education.level | readiness | −0.04072 |
| 14 | scientific.level | readiness | 0.231502 |
| 15 | new.knowledge | readiness | 0.543526 |
| 16 | type.of.scientificresearch | readiness | 0.284744 |
| 17 | social.group | readiness | −0.19313 |
| 18 | direction.of.technology.for.the.consumer | readiness | 0.044315 |
| 19 | direction.of.action | readiness | −0.46876 |
| 20 | value | readiness | 0.040261 |
| 21 | innovative.level | readiness | −0.1267 |
| 22 | readiness | The.level.of.analytical.readiness | 0.426211 |
| 23 | The.level.of.analytical.readiness | The.level.of.analytical.readiness | 1 |
| 24 | The.patent.level | The.level.of.analytical.readiness | −0.19353 |
| 25 | The.demand.readiness.level | The.level.of.analytical.readiness | 0.42783 |
| 26 | The.society.impact.level | The.level.of.analytical.readiness | 0.26566 |
| 27 | age | The.level.of.analytical.readiness | −0.29131 |
| 28 | influence.level | The.level.of.analytical.readiness | −0.29054 |
| 29 | wide.usage | The.level.of.analytical.readiness | 0.143412 |
| 30 | technological.complexity | The.level.of.analytical.readiness | 0.091115 |
| 31 | area | The.level.of.analytical.readiness | −0.03075 |
| 32 | part.of.market | The.level.of.analytical.readiness | 0.189293 |
| 33 | novelty | The.level.of.analytical.readiness | −0.18939 |
| 34 | education.level | The.level.of.analytical.readiness | −0.3926 |
| 35 | scientific.level | The.level.of.analytical.readiness | −0.31171 |
| 36 | new.knowledge | The.level.of.analytical.readiness | 0.137015 |
| 37 | type.of.scientificresearch | The.level.of.analytical.readiness | −0.22991 |
| 38 | social.group | The.level.of.analytical.readiness | −0.22274 |
| 39 | direction.of.technology.for.the.consumer | The.level.of.analytical.readiness | 0.286185 |
| 40 | direction.of.action | The.level.of.analytical.readiness | −0.1345 |
| 41 | value | The.level.of.analytical.readiness | 0.262898 |
| 42 | inovative.level | The.level.of.analytical.readiness | −0.36535 |
| 43 | readiness | The.patent.level | −0.0648 |
| 44 | The.level.of.analytical.readiness | The.patent.level | −0.19353 |
| 45 | The.patent.level | The.patent.level | 1 |
| 46 | The.demand.readiness.level | The.patent.level | −0.35482 |
| 47 | The.society.impact.level | The.patent.level | −0.35358 |
| 48 | age | The.patent.level | 0.339676 |
| 49 | influence.level | The.patent.level | 0.129253 |
| 50 | wide.usage | The.patent.level | 0.484056 |
| 51 | technological.complexity | The.patent.level | −0.31177 |
| 52 | area | The.patent.level | −0.15146 |
| 53 | part.of.market | The.patent.level | 0.166853 |
| 54 | novelty | The.patent.level | −0.00624 |
| 55 | education.level | The.patent.level | 0.364306 |
| 56 | scientific.level | The.patent.level | 0.270177 |
| 57 | new.knowledge | The.patent.level | −0.09874 |
| 58 | type.of.scientificresearch | The.patent.level | 0.033424 |
| 59 | social.group | The.patent.level | 0.63362 |
| 60 | direction.of.technology.for.the.consumer | The.patent.level | −0.69237 |
| 61 | direction.of.action | The.patent.level | −0.20323 |
| 62 | value | The.patent.level | 0.225471 |
| 63 | inovative.level | The.patent.level | −0.04959 |
| 64 | readiness | The.demand.readiness.level | −0.00967 |
| 65 | The.level.of.analytical.readiness | The.demand.readiness.level | 0.42783 |
| 66 | The.patent.level | The.demand.readiness.level | −0.35482 |
| 67 | The.demand.readiness.level | The.demand.readiness.level | 1 |
| 68 | The.society.impact.level | The.demand.readiness.level | 0.572469 |
| 69 | age | The.demand.readiness.level | −0.30198 |
| 70 | influence.level | The.demand.readiness.level | −0.26485 |
| 71 | wide.usage | The.demand.readiness.level | −0.02605 |
| 72 | technological.complexity | The.demand.readiness.level | 0.048038 |
| 73 | area | The.demand.readiness.level | 0.045295 |
| 74 | part.of.market | The.demand.readiness.level | 0.242353 |
| 75 | novelty | The.demand.readiness.level | −0.27552 |
| 76 | education.level | The.demand.readiness.level | −0.42104 |
| 77 | scientific.level | The.demand.readiness.level | −0.24019 |
| 78 | new.knowledge | The.demand.readiness.level | −0.19215 |
| 79 | type.of.scientificresearch | The.demand.readiness.level | −0.33309 |
| 80 | social.group | The.demand.readiness.level | −0.33286 |
| 81 | direction.of.technology.for.the.consumer | The.demand.readiness.level | 0.428043 |
| 82 | direction.of.action | The.demand.readiness.level | 0.27417 |
| 83 | value | The.demand.readiness.level | 0.30024 |
| 84 | inovative.level | The.demand.readiness.level | −0.34266 |
| 85 | readiness | The.society.impact.level | 0.21396 |
| 86 | The.level.of.analytical.readiness | The.society.impact.level | 0.26566 |
| 87 | The.patent.level | The.society.impact.level | −0.35358 |
| 88 | The.demand.readiness.level | The.society.impact.level | 0.572469 |
| 89 | The.society.impact.level | The.society.impact.level | 1 |
| 90 | age | The.society.impact.level | −0.11569 |
| 91 | influence.level | The.society.impact.level | −0.20216 |
| 92 | wide.usage | The.society.impact.level | −0.06987 |
| 93 | technological.complexity | The.society.impact.level | −0.21901 |
| 94 | area | The.society.impact.level | −0.02065 |
| 95 | part.of.market | The.society.impact.level | 0.387471 |
| 96 | novelty | The.society.impact.level | −0.52462 |
| 97 | education.level | The.society.impact.level | −0.19109 |
| 98 | scientific.level | The.society.impact.level | −0.25766 |
| 99 | new.knowledge | The.society.impact.level | 0.199689 |
| 100 | type.of.scientificresearch | The.society.impact.level | −0.46451 |
| 101 | social.group | The.society.impact.level | −0.01717 |
| 102 | direction.of.technology.for.the.consumer | The.society.impact.level | 0.276856 |
| 103 | direction.of.action | The.society.impact.level | 0.299626 |
| 104 | value | The.society.impact.level | 0.354286 |
| 105 | inovative.level | The.society.impact.level | −0.35137 |
| 106 | readiness | age | −0.08677 |
| 107 | The.level.of.analytical.readiness | age | −0.29131 |
| 108 | The.patent.level | age | 0.339676 |
| 109 | The.demand.readiness.level | age | −0.30198 |
| 110 | The.society.impact.level | age | −0.11569 |
| 111 | age | age | 1 |
| 112 | influence.level | age | 0.266594 |
| 113 | wide.usage | age | −0.18507 |
| 114 | technological.complexity | age | 0.34125 |
| 115 | area | age | −0.56224 |
| 116 | part.of.market | age | 0.132431 |
| 117 | novelty | age | 0.28843 |
| 118 | education.level | age | 0.932392 |
| 119 | scientific.level | age | 0.246957 |
| 120 | new.knowledge | age | 0.116743 |
| 121 | type.of.scientificresearch | age | −0.08717 |
| 122 | social.group | age | 0.406852 |
| 123 | direction.of.technology.for.the.consumer | age | −0.33419 |
| 124 | direction.of.action | age | −0.45872 |
| 125 | value | age | 0.089803 |
| 126 | inovative.level | age | 0.290139 |
| 127 | readiness | influence.level | 0.133182 |
| 128 | The.level.of.analytical.readiness | influence.level | −0.29054 |
| 129 | The.patent.level | influence.level | 0.129253 |
| 130 | The.demand.readiness.level | influence.level | −0.26485 |
| 131 | The.society.impact.level | influence.level | −0.20216 |
| 132 | age | influence.level | 0.266594 |
| 133 | influence.level | influence.level | 1 |
| 134 | wide.usage | influence.level | −0.2116 |
| 135 | technological.complexity | influence.level | −0.06786 |
| 136 | area | influence.level | 0.036789 |
| 137 | part.of.market | influence.level | −0.4707 |
| 138 | novelty | influence.level | 0.48647 |
| 139 | education.level | influence.level | 0.285924 |
| 140 | scientific.level | influence.level | 0.021205 |
| 141 | new.knowledge | influence.level | −0.05937 |
| 142 | type.of.scientificresearch | influence.level | 0.435204 |
| 143 | social.group | influence.level | 0.131105 |
| 144 | direction.of.technology.for.the.consumer | influence.level | −0.33787 |
| 145 | direction.of.action | influence.level | −0.31466 |
| 146 | value | influence.level | −0.4347 |
| 147 | inovative.level | influence.level | 0.665518 |
| 148 | readiness | wide.usage | 0.062229 |
| 149 | The.level.of.analytical.readiness | wide.usage | 0.143412 |
| 150 | The.patent.level | wide.usage | 0.484056 |
| 151 | The.demand.readiness.level | wide.usage | −0.02605 |
| 152 | The.society.impact.level | wide.usage | −0.06987 |
| 153 | age | wide.usage | −0.18507 |
| 154 | influence.level | wide.usage | −0.2116 |
| 155 | wide.usage | wide.usage | 1 |
| 156 | technological.complexity | wide.usage | −0.28201 |
| 157 | area | wide.usage | 0.26795 |
| 158 | part.of.market | wide.usage | 0.307277 |
| 159 | novelty | wide.usage | −0.3857 |
| 160 | education.level | wide.usage | −0.02925 |
| 161 | scientific.level | wide.usage | 0.027116 |
| 162 | new.knowledge | wide.usage | −0.07593 |
| 163 | type.of.scientificresearch | wide.usage | −0.2557 |
| 164 | social.group | wide.usage | 0.323748 |
| 165 | direction.of.technology.for.the.consumer | wide.usage | −0.12507 |
| 166 | direction.of.action | wide.usage | 0.34976 |
| 167 | value | wide.usage | 0.420303 |
| 168 | inovative.level | wide.usage | −0.50062 |
| 169 | readiness | technological.complexity | −0.18923 |
| 170 | The.level.of.analytical.readiness | technological.complexity | 0.091115 |
| 171 | The.patent.level | technological.complexity | −0.31177 |
| 172 | The.demand.readiness.level | technological.complexity | 0.048038 |
| 173 | The.society.impact.level | technological.complexity | −0.21901 |
| 174 | age | technological.complexity | 0.34125 |
| 175 | influence.level | technological.complexity | −0.06786 |
| 176 | wide.usage | technological.complexity | −0.28201 |
| 177 | technological.complexity | technological.complexity | 1 |
| 178 | area | technological.complexity | −0.22252 |
| 179 | part.of.market | technological.complexity | −0.07762 |
| 180 | novelty | technological.complexity | 0.43589 |
| 181 | education.level | technological.complexity | 0.296648 |
| 182 | scientific.level | technological.complexity | −0.05 |
| 183 | new.knowledge | technological.complexity | −0.04 |
| 184 | type.of.scientificresearch | technological.complexity | −0.02774 |
| 185 | social.group | technological.complexity | −0.50102 |
| 186 | direction.of.technology.for.the.consumer | technological.complexity | 0.51366 |
| 187 | direction.of.action | technological.complexity | −0.234 |
| 188 | value | technological.complexity | −0.1 |
| 189 | inovative.level | technological.complexity | 0.243363 |
| 190 | readiness | area | −0.32458 |
| 191 | The.level.of.analytical.readiness | area | −0.03075 |
| 192 | The.patent.level | area | −0.15146 |
| 193 | The.demand.readiness.level | area | 0.045295 |
| 194 | The.society.impact.level | area | −0.02065 |
| 195 | age | area | −0.56224 |
| 196 | influence.level | area | 0.036789 |
| 197 | wide.usage | area | 0.26795 |
| 198 | technological.complexity | area | −0.22252 |
| 199 | area | area | 1 |
| 200 | part.of.market | area | −0.15222 |
| 201 | novelty | area | −0.03028 |
| 202 | education.level | area | −0.54416 |
| 203 | scientific.level | area | −0.64117 |
| 204 | new.knowledge | area | −0.44505 |
| 205 | type.of.scientificresearch | area | 0.115065 |
| 206 | social.group | area | −0.00201 |
| 207 | direction.of.technology.for.the.consumer | area | 0.128495 |
| 208 | direction.of.action | area | 0.622087 |
| 209 | value | area | −0.09429 |
| 210 | inovative.level | area | 0.001583 |
| 211 | readiness | part.of.market | 0.037499 |
| 212 | The.level.of.analytical.readiness | part.of.market | 0.189293 |
| 213 | The.patent.level | part.of.market | 0.166853 |
| 214 | The.demand.readiness.level | part.of.market | 0.242353 |
| 215 | The.society.impact.level | part.of.market | 0.387471 |
| 216 | age | part.of.market | 0.132431 |
| 217 | influence.level | part.of.market | −0.4707 |
| 218 | wide.usage | part.of.market | 0.307277 |
| 219 | technological.complexity | part.of.market | −0.07762 |
| 220 | area | part.of.market | −0.15222 |
| 221 | part.of.market | part.of.market | 1 |
| 222 | novelty | part.of.market | −0.68554 |
| 223 | education.level | part.of.market | 0.020931 |
| 224 | scientific.level | part.of.market | −0.0194 |
| 225 | new.knowledge | part.of.market | 0.054331 |
| 226 | type.of.scientificresearch | part.of.market | −0.39824 |
| 227 | social.group | part.of.market | 0.103422 |
| 228 | direction.of.technology.for.the.consumer | part.of.market | 0.089499 |
| 229 | direction.of.action | part.of.market | 0.16833 |
| 230 | value | part.of.market | 0.747045 |
| 231 | inovative.level | part.of.market | −0.60899 |
| 232 | readiness | novelty | −0.12008 |
| 233 | The.level.of.analytical.readiness | novelty | −0.18939 |
| 234 | The.patent.level | novelty | −0.00624 |
| 235 | The.demand.readiness.level | novelty | −0.27552 |
| 236 | The.society.impact.level | novelty | −0.52462 |
| 237 | age | novelty | 0.28843 |
| 238 | influence.level | novelty | 0.48647 |
| 239 | wide.usage | novelty | −0.3857 |
| 240 | technological.complexity | novelty | 0.43589 |
| 241 | area | novelty | −0.03028 |
| 242 | part.of.market | novelty | −0.68554 |
| 243 | novelty | novelty | 1 |
| 244 | education.level | novelty | 0.309344 |
| 245 | scientific.level | novelty | 0.057354 |
| 246 | new.knowledge | novelty | −0.22942 |
| 247 | type.of.scientificresearch | novelty | 0.413585 |
| 248 | social.group | novelty | −0.12228 |
| 249 | direction.of.technology.for.the.consumer | novelty | −0.08417 |
| 250 | direction.of.action | novelty | −0.34043 |
| 251 | value | novelty | −0.65957 |
| 252 | inovative.level | novelty | 0.789338 |
| 253 | readiness | education.level | −0.04072 |
| 254 | The.level.of.analytical.readiness | education.level | −0.3926 |
| 255 | The.patent.level | education.level | 0.364306 |
| 256 | The.demand.readiness.level | education.level | −0.42104 |
| 257 | The.society.impact.level | education.level | −0.19109 |
| 258 | age | education.level | 0.932392 |
| 259 | influence.level | education.level | 0.285924 |
| 260 | wide.usage | education.level | −0.02925 |
| 261 | technological.complexity | education.level | 0.296648 |
| 262 | area | education.level | −0.54416 |
| 263 | part.of.market | education.level | 0.020931 |
| 264 | novelty | education.level | 0.309344 |
| 265 | education.level | education.level | 1 |
| 266 | scientific.level | education.level | 0.43823 |
| 267 | new.knowledge | education.level | 0.229228 |
| 268 | type.of.scientificresearch | education.level | −0.09349 |
| 269 | social.group | education.level | 0.380911 |
| 270 | direction.of.technology.for.the.consumer | education.level | −0.3039 |
| 271 | direction.of.action | education.level | −0.37324 |
| 272 | value | education.level | −0.03371 |
| 273 | inovative.level | education.level | 0.311177 |
| 274 | readiness | scientific.level | 0.231502 |
| 275 | The.level.of.analytical.readiness | scientific.level | −0.31171 |
| 276 | The.patent.level | scientific.level | 0.270177 |
| 277 | The.demand.readiness.level | scientific.level | −0.24019 |
| 278 | The.society.impact.level | scientific.level | −0.25766 |
| 279 | age | scientific.level | 0.246957 |
| 280 | influence.level | scientific.level | 0.021205 |
| 281 | wide.usage | scientific.level | 0.027116 |
| 282 | technological.complexity | scientific.level | −0.05 |
| 283 | area | scientific.level | −0.64117 |
| 284 | part.of.market | scientific.level | −0.0194 |
| 285 | novelty | scientific.level | 0.057354 |
| 286 | education.level | scientific.level | 0.43823 |
| 287 | scientific.level | scientific.level | 1 |
| 288 | new.knowledge | scientific.level | 0.35 |
| 289 | type.of.scientificresearch | scientific.level | −0.06934 |
| 290 | social.group | scientific.level | −0.0533 |
| 291 | direction.of.technology.for.the.consumer | scientific.level | −0.13104 |
| 292 | direction.of.action | scientific.level | −0.32817 |
| 293 | value | scientific.level | −0.0625 |
| 294 | inovative.level | scientific.level | 0.041959 |
| 295 | readiness | new.knowledge | 0.543526 |
| 296 | The.level.of.analytical.readiness | new.knowledge | 0.137015 |
| 297 | The.patent.level | new.knowledge | −0.09874 |
| 298 | The.demand.readiness.level | new.knowledge | −0.19215 |
| 299 | The.society.impact.level | new.knowledge | 0.199689 |
| 300 | age | new.knowledge | 0.116743 |
| 301 | influence.level | new.knowledge | −0.05937 |
| 302 | wide.usage | new.knowledge | −0.07593 |
| 303 | technological.complexity | new.knowledge | −0.04 |
| 304 | area | new.knowledge | −0.44505 |
| 305 | part.of.market | new.knowledge | 0.054331 |
| 306 | novelty | new.knowledge | −0.22942 |
| 307 | education.level | new.knowledge | 0.229228 |
| 308 | scientific.level | new.knowledge | 0.35 |
| 309 | new.knowledge | new.knowledge | 1 |
| 310 | type.of.scientificresearch | new.knowledge | −0.05547 |
| 311 | social.group | new.knowledge | −0.23452 |
| 312 | direction.of.technology.for.the.consumer | new.knowledge | 0.272554 |
| 313 | direction.of.action | new.knowledge | −0.468 |
| 314 | value | new.knowledge | 0.025 |
| 315 | inovative.level | new.knowledge | −0.26854 |
| 316 | readiness | type.of.scientificresearch | 0.284744 |
| 317 | The.level.of.analytical.readiness | type.of.scientificresearch | −0.22991 |
| 318 | The.patent.level | type.of.scientificresearch | 0.033424 |
| 319 | The.demand.readiness.level | type.of.scientificresearch | −0.33309 |
| 320 | The.society.impact.level | type.of.scientificresearch | −0.46451 |
| 321 | age | type.of.scientificresearch | −0.08717 |
| 322 | influence.level | type.of.scientificresearch | 0.435204 |
| 323 | wide.usage | type.of.scientificresearch | −0.2557 |
| 324 | technological.complexity | type.of.scientificresearch | −0.02774 |
| 325 | area | type.of.scientificresearch | 0.115065 |
| 326 | part.of.market | type.of.scientificresearch | −0.39824 |
| 327 | novelty | type.of.scientificresearch | 0.413585 |
| 328 | education.level | type.of.scientificresearch | −0.09349 |
| 329 | scientific.level | type.of.scientificresearch | −0.06934 |
| 330 | new.knowledge | type.of.scientificresearch | −0.05547 |
| 331 | type.of.scientificresearch | type.of.scientificresearch | 1 |
| 332 | social.group | type.of.scientificresearch | −0.16261 |
| 333 | direction.of.technology.for.the.consumer | type.of.scientificresearch | −0.20352 |
| 334 | direction.of.action | type.of.scientificresearch | −0.3245 |
| 335 | value | type.of.scientificresearch | −0.45069 |
| 336 | inovative.level | type.of.scientificresearch | 0.442219 |
| 337 | readiness | social.group | −0.19313 |
| 338 | The.level.of.analytical.readiness | social.group | −0.22274 |
| 339 | The.patent.level | social.group | 0.63362 |
| 340 | The.demand.readiness.level | social.group | −0.33286 |
| 341 | The.society.impact.level | social.group | −0.01717 |
| 342 | age | social.group | 0.406852 |
| 343 | influence.level | social.group | 0.131105 |
| 344 | wide.usage | social.group | 0.323748 |
| 345 | technological.complexity | social.group | −0.50102 |
| 346 | area | social.group | −0.00201 |
| 347 | part.of.market | social.group | 0.103422 |
| 348 | novelty | social.group | −0.12228 |
| 349 | education.level | social.group | 0.380911 |
| 350 | scientific.level | social.group | −0.0533 |
| 351 | new.knowledge | social.group | −0.23452 |
| 352 | type.of.scientificresearch | social.group | −0.16261 |
| 353 | social.group | social.group | 1 |
| 354 | direction.of.technology.for.the.consumer | social.group | −0.86046 |
| 355 | direction.of.action | social.group | 0.10647 |
| 356 | value | social.group | 0.13325 |
| 357 | inovative.level | social.group | 0.058147 |
| 358 | readiness | direction.of.technology.for.the.consumer | 0.044315 |
| 359 | The.level.of.analytical.readiness | direction.of.technology.for.the.consumer | 0.286185 |
| 360 | The.patent.level | direction.of.technology.for.the.consumer | −0.69237 |
| 361 | The.demand.readiness.level | direction.of.technology.for.the.consumer | 0.428043 |
| 362 | The.society.impact.level | direction.of.technology.for.the.consumer | 0.276856 |
| 363 | age | direction.of.technology.for.the.consumer | −0.33419 |
| 364 | influence.level | direction.of.technology.for.the.consumer | −0.33787 |
| 365 | wide.usage | direction.of.technology.for.the.consumer | −0.12507 |
| 366 | technological.complexity | direction.of.technology.for.the.consumer | 0.51366 |
| 367 | area | direction.of.technology.for.the.consumer | 0.128495 |
| 368 | part.of.market | direction.of.technology.for.the.consumer | 0.089499 |
| 369 | novelty | direction.of.technology.for.the.consumer | −0.08417 |
| 370 | education.level | direction.of.technology.for.the.consumer | −0.3039 |
| 371 | scientific.level | direction.of.technology.for.the.consumer | −0.13104 |
| 372 | new.knowledge | direction.of.technology.for.the.consumer | 0.272554 |
| 373 | type.of.scientificresearch | direction.of.technology.for.the.consumer | −0.20352 |
| 374 | social.group | direction.of.technology.for.the.consumer | −0.86046 |
| 375 | direction.of.technology.for.the.consumer | direction.of.technology.for.the.consumer | 1 |
| 376 | direction.of.action | direction.of.technology.for.the.consumer | 0.140598 |
| 377 | value | direction.of.technology.for.the.consumer | 0.091725 |
| 378 | inovative.level | direction.of.technology.for.the.consumer | −0.27271 |
| 379 | readiness | direction.of.action | −0.46876 |
| 380 | The.level.of.analytical.readiness | direction.of.action | −0.1345 |
| 381 | The.patent.level | direction.of.action | −0.20323 |
| 382 | The.demand.readiness.level | direction.of.action | 0.27417 |
| 383 | The.society.impact.level | direction.of.action | 0.299626 |
| 384 | age | direction.of.action | −0.45872 |
| 385 | influence.level | direction.of.action | −0.31466 |
| 386 | wide.usage | direction.of.action | 0.34976 |
| 387 | technological.complexity | direction.of.action | −0.234 |
| 388 | area | direction.of.action | 0.622087 |
| 389 | part.of.market | direction.of.action | 0.16833 |
| 390 | novelty | direction.of.action | −0.34043 |
| 391 | education.level | direction.of.action | −0.37324 |
| 392 | scientific.level | direction.of.action | −0.32817 |
| 393 | new.knowledge | direction.of.action | −0.468 |
| 394 | type.of.scientificresearch | direction.of.action | −0.3245 |
| 395 | social.group | direction.of.action | 0.10647 |
| 396 | direction.of.technology.for.the.consumer | direction.of.action | 0.140598 |
| 397 | direction.of.action | direction.of.action | 1 |
| 398 | value | direction.of.action | 0.114146 |
| 399 | inovative.level | direction.of.action | −0.21313 |
| 400 | readiness | value | 0.040261 |
| 401 | The.level.of.analytical.readiness | value | 0.262898 |
| 402 | The.patent.level | value | 0.225471 |
| 403 | The.demand.readiness.level | value | 0.30024 |
| 404 | The.society.impact.level | value | 0.354286 |
| 405 | age | value | 0.089803 |
| 406 | influence.level | value | −0.4347 |
| 407 | wide.usage | value | 0.420303 |
| 408 | technological.complexity | value | −0.1 |
| 409 | area | value | −0.09429 |
| 410 | part.of.market | value | 0.747045 |
| 411 | novelty | value | −0.65957 |
| 412 | education.level | value | −0.03371 |
| 413 | scientific.level | value | −0.0625 |
| 414 | new.knowledge | value | 0.025 |
| 415 | type.of.scientificresearch | value | −0.45069 |
| 416 | social.group | value | 0.13325 |
| 417 | direction.of.technology.for.the.consumer | value | 0.091725 |
| 418 | direction.of.action | value | 0.114146 |
| 419 | value | value | 1 |
| 420 | inovative.level | value | −0.76575 |
| 421 | readiness | inovative.level | −0.1267 |
| 422 | The.level.of.analytical.readiness | inovative.level | −0.36535 |
| 423 | The.patent.level | inovative.level | −0.04959 |
| 424 | The.demand.readiness.level | inovative.level | −0.34266 |
| 425 | The.society.impact.level | inovative.level | −0.35137 |
| 426 | age | inovative.level | 0.290139 |
| 427 | influence.level | inovative.level | 0.665518 |
| 428 | wide.usage | inovative.level | −0.50062 |
| 429 | technological.complexity | inovative.level | 0.243363 |
| 430 | area | inovative.level | 0.001583 |
| 431 | part.of.market | inovative.level | −0.60899 |
| 432 | novelty | inovative.level | 0.789338 |
| 433 | education.level | inovative.level | 0.311177 |
| 434 | scientific.level | inovative.level | 0.041959 |
| 435 | new.knowledge | inovative.level | −0.26854 |
| 436 | type.of.scientificresearch | inovative.level | 0.442219 |
| 437 | social.group | inovative.level | 0.058147 |
| 438 | direction.of.technology.for.the.consumer | inovative.level | −0.27271 |
| 439 | direction.of.action | inovative.level | −0.21313 |
| 440 | value | inovative.level | −0.76575 |
| 441 | innovative.level | inovative.level | 1 |
References
- Dziallas, M.; Blind, K. Innovation indicators throughout the innovation process: An extensive literature analysis. Technovation 2019, 80–81, 3–29. [Google Scholar] [CrossRef]
- Brasseur, T.-M.; Mladenow, A.; Strauss, C. Open business model innovation: Literature review and agenda for future research. Bus. Inform. 2017, 4, 7–16. [Google Scholar] [CrossRef]
- Brasseur, T.M.; Mladenow, A.; Strauss, C. Business Model Innovation to Support Smart Manufacturing. In Proceedings of the AMCIS 2017 Workshops, Boston, MA, USA, 10–12 August 2017. [Google Scholar]
- Fernández-Esquinas, M.; Pinto, H.; Yruela, M.P.; Pereira, T.S. Tracing the flows of knowledge transfer: Latent dimensions and determinants of university–industry interactions in peripheral innovation systems. Technol. Forecast. Soc. Chang. 2016, 113, 266–279. [Google Scholar] [CrossRef]
- Leydesdorff, L.; Ivanova, I. “Open innovation” and “triple helix” models of innovation: Can synergy in innovation systems be measured? J. Open Innov. Technol. Mark. Complex. 2016, 2, 11. [Google Scholar] [CrossRef]
- Filho, F.B.D.; Santiago, Y.C.; Lora, E.E.S.; Palacio, J.C.E.; del Olmo, O.A.A. Evaluation of the maturity level of biomass electricity generation technologies using the technology readiness level criteria. J. Clean. Prod. 2021, 295, 126426. [Google Scholar] [CrossRef]
- Puhar, J.; Vujanovic, A.; Krajnc, D.; Cucek, L. Technology Readiness Level Assessment of Formalin Production Pathways. Chem. Eng. Trans. 2021, 88, 607–612. [Google Scholar] [CrossRef]
- Vik, J.; Melås, A.M.; Stræte, E.P.; Søraa, R.A. Balanced readiness level assessment (BRLa): A tool for exploring new and emerging technologies. Technol. Forecast. Soc. Chang. 2021, 169, 120854. [Google Scholar] [CrossRef]
- Yönkul, N.G.; Ünlü, H. How Does the Effect of Absorptive Capacity on Innovation Capacity Change According to Countries’ Technology Manufacturing Value-Added Levels? In Performance Management Systems; Leitão, J., Ratten, V., Eds.; Springer Science and Business Media LLC.: Berlin/Heidelberg, Germany, 2022; pp. 127–164. [Google Scholar]
- Petrovic, S.; Hossain, E. Development of a Novel Technological Readiness Assessment Tool for Fuel Cell Technology. IEEE Access 2020, 8, 132237–132252. [Google Scholar] [CrossRef]
- Sim, T.S. Exploratory Research into Intellectual Property Commercialisation: The Role of Polytechnics in Facilitating Small and Medium Enterprise Development in Singapore. Ph.D. Thesis, University of Adelaide, Adelaide, SA, Australia, 2021. Available online: https://hdl.handle.net/2440/132894 (accessed on 5 April 2022).
- Jutimongkonkul, K.; Pentrakoon, D.; Wonglimpiyarat, J. Challenges and factors affecting patent valuation: The case of Thailand 4.0. Kasetsart J. Soc. Sci. 2021, 42, 227–232. [Google Scholar]
- Bozeman, B.; Melkers, J. (Eds.) Evaluating R&D Impacts: Methods and Practice; Springer Science & Business Media: Berlin/Heidelberg, Germany, 2013. [Google Scholar]
- Suttipun, M. R&D Spending and Share Price of Listed Companies in the Stock Exchange of Thailand. J. Manag. Sci. Chiangrai Rajabhat Univ. 2021, 16, 94–108. [Google Scholar]
- Harris, W.L.; Wonglimpiyarat, J. R&D Investments and Strategic Use of Financial Models. Int. J. Innov. Technol. Manag. 2020, 17, 2050030. [Google Scholar] [CrossRef]
- Kang, M.; Um, K.-H.; Wang, S.; Park, K.; Colclough, S.N.; Park, Y. Integrating manufacturing and R&D functions for better quality and product development performance. J. Manuf. Technol. Manag. 2021, 33, 191–212. [Google Scholar] [CrossRef]
- Liu, H.; Yang, N.; Yang, Z.; Zhang, Y.; Li, R. Using combined network-based approaches to analyze risk interactions in R&D alliance. J. Oper. Res. Soc. 2020, 72, 2460–2471. [Google Scholar] [CrossRef]
- Leung, W.S.; Evans, K.P.; Mazouz, K. The R&D anomaly: Risk or mispricing? J. Bank. Financ. 2020, 115, 105815. [Google Scholar] [CrossRef]
- Sharma, S.K.; Chanda, U. Developing a Bayesian belief network model for prediction of R&D project success. J. Manag. Anal. 2017, 4, 321–344. [Google Scholar] [CrossRef]
- Schuhmacher, A.; Brieke, C.; Gassmann, O.; Hinder, M.; Hartl, D. Systematic risk identification and assessment using a new risk map in pharmaceutical R&D. Drug Dis. Today 2021, 26, 2786–2793. [Google Scholar] [CrossRef]
- Tan, O.K.; Rasli, A. Prediction of new product development (NPD) performance in research and development (R&D) company. In Proceedings of the 3rd International Conference on Advanced Management Science IPEDR, Kuala Lumpur, Malaysia, 4–6 November 2011; IACSIT Press: Singapore, 2011; Volume 19, pp. 192–200. [Google Scholar]
- Yoon, B.; Jeong, Y.; Lee, K.; Lee, S. A systematic approach to prioritizing R&D projects based on customer-perceived value using opinion mining. Technovation 2020, 98, 102164. [Google Scholar] [CrossRef]
- Bozhikova, V.; Stoeva, M. An approach for software cost estimation. In Proceedings of the 11th International Conference on Computer Systems and Technologies and Workshop for PhD Students in Computing, Ruse, Bulgaria, 18–18 June 2009; Association for Computing Machinery (ACM): New York, NY, USA, 2010; pp. 119–124. [Google Scholar]
- Wang, K.; Wang, C.K.; Hu, C. Analytic Hierarchy Process with Fuzzy Scoring in Evaluating Multidisciplinary R&D Projects in China. IEEE Trans. Eng. Manag. 2005, 52, 119–129. [Google Scholar] [CrossRef]
- Oh, S.; Hong, A.; Hwang, J. An Analysis of CSR on Firm Financial Performance in Stakeholder Perspectives. Sustainability 2017, 9, 1023. [Google Scholar] [CrossRef]
- Sutopo, W.; Astuti, R.W.; Suryandari, R.T. Accelerating a Technology Commercialization; with a Discussion on the Relation between Technology Transfer Efficiency and Open Innovation. J. Open Innov. Technol. Mark. Complex. 2019, 5, 95. [Google Scholar] [CrossRef]
- Kim, H.; Park, S.-Y.; Joh, W.-I. A Study on Technology Development Performance and Technology Commercialization Performance According to the Technology Development Capability of SMEs Focusing on a Comparative Analysis of Technology Business Groups. J. Open Innov. Technol. Mark. Complex. 2019, 5, 65. [Google Scholar] [CrossRef]
- Kim, J.-H.; Seok, B.-I.; Choi, H.-J.; Jung, S.-H.; Yu, J.-P. Sustainable Management Activities: A Study on the Relations between Technology Commercialization Capabilities, Sustainable Competitive Advantage, and Business Performance. Sustainability 2020, 12, 7913. [Google Scholar] [CrossRef]
- Baek, S.H.; Lee, H. Effects of Interdisciplinary R&D on Technology Commercialization. J. Converg. Inf. Technol. 2019, 9, 28–37. [Google Scholar]
- Larissa, B.; Maran, R.M.; Ioan, B.; Anca, N.; Mircea-Iosif, R.; Horia, T.; Gheorghe, F.; Speranta, M.E.; Dan, M.I. Adjusted Net Savings of CEE and Baltic Nations in the Context of Sustainable Economic Growth: A Panel Data Analysis. J. Risk Financ. Manag. 2020, 13, 234. [Google Scholar] [CrossRef]
- Batrancea, L. An Econometric Approach Regarding the Impact of Fiscal Pressure on Equilibrium: Evidence from Electricity, Gas and Oil Companies Listed on the New York Stock Exchange. Mathematics 2021, 9, 630. [Google Scholar] [CrossRef]
- Chukhray, N.; Shakhovska, N.; Mrykhina, O.; Bublyk, M.; Lisovska, L. Methodical Approach to Assessing the Readiness Level of Technologies for the Transfer. In Advances in Intelligent Systems and Computing; Springer Science and Business Media LLC.: Berlin/Heidelberg, Germany, 2020; pp. 259–282. [Google Scholar]
- Lalienė, R.; Sakalas, A. Development of R&D Effectiveness Assessment System in the Research Organizations. Procedia Soc. Behav. Sci. 2014, 156, 340–344. [Google Scholar] [CrossRef]
- Anley, M.B.; Beshah Tesema, T. A Collaborative Approach to Build a KBS for Crop Selection: Combining Experts Knowledge and Machine Learning Knowledge Discovery. Int. J. Inf. Eng. Electron. Bus. 2019, 11, 8–15. [Google Scholar] [CrossRef]
- Estlund, D.M. Opinion leaders, independence, and Condorcet’s Jury Theorem. Theory Decis. 1994, 36, 131–162. [Google Scholar] [CrossRef]
- Lindner, I. A generalization of Condorcet’s Jury Theorem to weighted voting games with many small voters. Econ. Theory 2008, 35, 607–611. [Google Scholar] [CrossRef]
- Kumar Bhimagavni, N.; Kumar, P. Extension of Refinement Algorithm for Manually Built Bayesian Networks Created by Domain Experts. Int. J. Wirel. Microw. Technol. 2018, 8, 25–33. [Google Scholar] [CrossRef]
- Izonin, I.; Tkachenko, R.; Vitynskyi, P.; Zub, K.; Tkachenko, P.; Dronyuk, I. Stacking-based GRNN-SGTM Ensemble Model for Prediction Tasks. In Proceedings of the 2020 International Conference on Decision Aid Sciences and Application (DASA), Sakheer, Bahrain, 8–9 November 2020; IEEE: Piscataway, NJ, USA, 2020; pp. 326–330. [Google Scholar] [CrossRef]
- Iqbal, A.; Aftab, S. Prediction of Defect Prone Software Modules using MLP based Ensemble Techniques. Int. J. Inf. Technol. Comput. Sci. 2020, 12, 26–31. [Google Scholar] [CrossRef]
- Cherkassky, V.; Ma, Y. Practical selection of SVM parameters and noise estimation for SVM regression. Neural Netw. 2004, 17, 113–126. [Google Scholar] [CrossRef]
- Chicco, D.; Warrens, M.J.; Jurman, G. The coefficient of determination R-squared is more informative than SMAPE, MAE, MAPE, MSE and RMSE in regression analysis evaluation. PeerJ Comput. Sci. 2021, 7, e623. [Google Scholar] [CrossRef] [PubMed]
- Zhu, Y.; Xie, C.; Wang, G.-J.; Yan, X.-G. Comparison of individual, ensemble and integrated ensemble machine learning methods to predict China’s SME credit risk in supply chain finance. Neural Comput. Appl. 2016, 28, 41–50. [Google Scholar] [CrossRef]
- Chukhray, N.; Shakhovska, N.; Mrykhina, O. Method for Estimation of R&D Products Cost Taking into Account Their Technological Readiness. In Conference on Computer Science and Information Technologies; Springer: Cham, Switzerland, 2020; pp. 907–922. [Google Scholar]
- Burenok, V.C.; Lavrinov, G.C.; Podolskiy, A.C. Estimating the cost of military R&D. Military Thought 2001, 10, 27. [Google Scholar]
- Relich, M.; Pawlewski, P. A case-based reasoning approach to cost estimation of new product development. Neurocomputing 2018, 272, 40–45. [Google Scholar] [CrossRef]
- Farid, S.S.; Baron, M.; Stamatis, C.; Nie, W.; Coffman, J. Benchmarking biopharmaceutical process development and manufacturing cost contributions to R&D. In MAbs; Taylor & Francis: Oxford, UK, 2020; Volume 12, p. 1754999. [Google Scholar]
- Batrancea, I.; Batrancea, L.; Nichita, A.; Gaban, L.; Morar, I.D.; Masca, E.; Fatacean, G.; Moscviciov, A. An econometric approach on production, costs and profit in Romanian coal mining enterprises. Econ. Res. Ekon. Istraž. 2019, 32, 1019–1036. [Google Scholar] [CrossRef]
- Hu, Z.; Ivashchenko, M.; Lyushenko, L.; Klyushnyk, D. Artificial Neural Network Training Criterion Formulation Using Error Continuous Domain. Int. J. Mod. Educ. Comput. Sci. 2021, 13, 13–22. [Google Scholar] [CrossRef]
- Hu, Z.; Tereykovski, I.A.; Tereykovska, L.O.; Pogorelov, V.V. Determination of Structural Parameters of Multilayer Perceptron Designed to Estimate Parameters of Technical Systems. Int. J. Intell. Syst. Appl. 2017, 9, 57–62. [Google Scholar] [CrossRef]
- Hu, Z.; Bodyanskiy, Y.V.; Kulishova, N.Y.; Tyshchenko, O.K. A Multidimensional Extended Neo-Fuzzy Neuron for Facial Expression Recognition. Int. J. Intell. Syst. Appl. 2017, 9, 29–36. [Google Scholar] [CrossRef]


| Attribute Title | Attribute’s Value Type |
|---|---|
| Readiness | num (target attribute) |
| The level of analytical readiness | num |
| The patent level | num |
| The demand readiness level | num |
| The society impact level | num |
| Developer’s age | int (categorical) |
| Influence level | int (categorical) |
| Wide usage level | int (categorical) |
| Technological complexity | int (categorical) |
| Area of usage | int categorical) |
| The part of market | int (categorical) |
| Novelty level | int (categorical) |
| Education level | int (categorical) |
| Scientific level | int (categorical) |
| Level of knowledge usage | int (categorical) |
| Type of scientific research | int (categorical) |
| Social group | int (categorical) |
| Direction of technology for the consumer | int (categorical) |
| Direction of action | int (categorical) |
| Value | int (categorical) |
| Innovative level | int (categorical) |
| Model | MAE | RMSE |
|---|---|---|
| Linear regression | 0.1186738 | 0.1497206 |
| k-nearest neighbor, n = 5 | 0.2039549 | 0.2020502 |
| Support vector machine, Radial Basis kernel | 0.105906 | 0.1193939 |
| Statistical Indicators | ||||||
|---|---|---|---|---|---|---|
| Weak Predictor | Min | 1st Qu. | Median | Mean | 3rd Qu. | Max. |
| rf | 0.2717025 × 10⁻³ | 0.5283736 | 0.8681555 | 0.7250325 | 1 | 1 |
| lm | 0.1335612 × 10⁻⁴ | 0.2026962 | 0.7689927 | 0.5788250 | 1 | 1 |
| k-nn | 0.2583209 × 10⁻⁴ | 0.5344081 | 0.9525670 | 0.7501362 | 1 | 1 |
| svmRadial | 0.2112816 × 10⁻⁴ | 0.5117884 | 0.8886191 | 0.7295303 | 1 | 1 |
| svmLinear | 0.1894514× 10⁻⁵ | 0.342166 | 0.9491874 | 0.6846886 | 1 | 1 |
| Size | RMSE | Rsquared | MAE |
|---|---|---|---|
| 3 | 0.2223931 | 0.6517460 | 0.1977703 |
| 5 | 0.2449432 | 0.7053856 | 0.2065954 |
| 7 | 0.2710932 | 0.7192740 | 0.2174573 |
| 9 | 0.2611066 | 0.6925929 | 0.2084706 |
| Size | RMSE | Rsquared | MAE |
|---|---|---|---|
| 3 | 0.2286407 | 0.6102281 | 0.1943607 |
| 5 | 0.2073460 | 0.6470182 | 0.1766673 |
| 7 | 0.2074397 | 0.6457215 | 0.1767149 |
| 9 | 0.2088174 | 0.6449099 | 0.1760879 |
| Number of Variables in Each Split | RMSE | Rsquared | MAE |
|---|---|---|---|
| 2 | 0.1531979 | 0.6179473 | 0.1224977 |
| 4 | 0.1497206 | 0.5990950 | 0.1186738 |
| 6 | 0.1510873 | 0.5803320 | 0.1182399 |
| Parameters | Rule |
|---|---|
| competitive_method.analog_implementation_costs (Ia) | numeric, range [0..∞) |
| competitive_method.analog_quality_value (Pa) | numeric, range (0..1] |
| competitive_method.analog_support_cost (Sa) | numeric, range [0.. ∞) |
| competitive_method.k1 (innovation comparison) | numeric, range {1, 1.1, 1.15, 1.2, 1.25} |
| competitive_method.k2 (ecological parameter) | numeric, {0.6, 0.8, 1, 1.1, 1.3} |
| competitive_method.k3 (complexity of implementation) | numeric, {0.6, 0.8, 1, 1.1, 1.3} |
| competitive_method.k4 (support complexness) | numeric, {0.5, 1} |
| competitive_method.k5 (attractiveness of market conditions) | numeric, (0.8, 0.9, 1, 1.1, 1.2} |
| competitive_method.own_implementation_costs (Io) | numeric, range [0..∞) |
| competitive_method.own_quality_value (Po) | numeric, range (0..1], |
| competitive_method.own_support_cost (So) | numeric, range [0.. ∞) |
| competitive_method.parameters_count | array, max:5, min:1 |
| competitive_method.analog_price (Price_a) | numeric, range [0..∞) |
| expensive_method.percentage_of_cost (PS) | numeric, gte:0, lte:100 |
| expensive_method.sum.commercial_expenses (a1) | numeric, range [0..∞) |
| expensive_method.sum.defective_lose (a2) | numeric, range [0..∞) |
| expensive_method.sum.fuel_and_energy (a3) | numeric, range [0..∞) |
| expensive_method.sum.general_expenses (a4) | numeric, range [0..∞) |
| expensive_method.sum.other_production_expenses (a5) | numeric, range [0..∞) |
| expensive_method.sum.raw_materials (a6) | numeric, range [0..∞) |
| expensive_method.sum.returnable_waste (a7) | numeric, range [0..∞) |
| expensive_method.sum.social_events_deductions (a8) | numeric, range [0..∞) |
| expensive_method.sum.third_parties_production (a9) | numeric, range [0..∞) |
| expensive_method.sum.total_expenditures (a11) | numeric, range [0..∞) |
| R&D_readiness_level | numeric, gte:1, lte:11 |
| revenue_method.discount_rate (Q) | numeric, range [0..1] |
| revenue_method.period.expected_cost (C) | numeric, range [1..5] |
| revenue_method.period.expected_price (P) | numeric, range [1..5] |
| revenue_method.period.licensor_percentage (∆) | numeric, range [0..1] |
| revenue_method.period.sales_volume (t) | numeric, range [0..∞) |
| Model | Rsquared | MAE | RMSE |
|---|---|---|---|
| New Stacking model | 0.9366 | 0.0559359 | 0.05898147 |
| Boosted rf | 0.7553046 | 0.1640238 | 0.1916724 |
| Boosted lm | 0.7217016 | 0.2720410 | 0.3206452 |
| Bagged rtree | 0.7043159 | 0.1870193 | 0.2257885 |
| Bagged rf | 0.7541548 | 0.1662005 | 0.1937453 |
Publisher’s Note: MDPI stays neutral with regard to jurisdictional claims in published maps and institutional affiliations. |
© 2022 by the authors. Licensee MDPI, Basel, Switzerland. This article is an open access article distributed under the terms and conditions of the Creative Commons Attribution (CC BY) license (https://creativecommons.org/licenses/by/4.0/).
Share and Cite
Chukhray, N.; Shakhovska, N.; Mrykhina, O.; Lisovska, L.; Izonin, I. Stacking Machine Learning Model for the Assessment of R&D Product’s Readiness and Method for Its Cost Estimation. Mathematics 2022, 10, 1466. https://doi.org/10.3390/math10091466
Chukhray N, Shakhovska N, Mrykhina O, Lisovska L, Izonin I. Stacking Machine Learning Model for the Assessment of R&D Product’s Readiness and Method for Its Cost Estimation. Mathematics. 2022; 10(9):1466. https://doi.org/10.3390/math10091466
Chicago/Turabian StyleChukhray, Nataliya, Nataliya Shakhovska, Oleksandra Mrykhina, Lidiya Lisovska, and Ivan Izonin. 2022. "Stacking Machine Learning Model for the Assessment of R&D Product’s Readiness and Method for Its Cost Estimation" Mathematics 10, no. 9: 1466. https://doi.org/10.3390/math10091466
APA StyleChukhray, N., Shakhovska, N., Mrykhina, O., Lisovska, L., & Izonin, I. (2022). Stacking Machine Learning Model for the Assessment of R&D Product’s Readiness and Method for Its Cost Estimation. Mathematics, 10(9), 1466. https://doi.org/10.3390/math10091466