Article

Choosing Industrial Zones Multi-Criteria Problem Solution for Chemical Industries Development Using the Additive Global Criterion Method

by
Aleksey I. Shinkevich
1,*,
Nadezhda Yu. Psareva
2 and
Tatyana V. Malysheva
1
1
Department of Logistics and Management, Kazan National Research Technological University, 420015 Kazan, Russia
2
Department of Organization and Management Theory, State University of Management, 109542 Moscow, Russia
*
Author to whom correspondence should be addressed.
Mathematics 2022, 10(9), 1434; https://doi.org/10.3390/math10091434
Submission received: 20 March 2022 / Revised: 22 April 2022 / Accepted: 22 April 2022 / Published: 24 April 2022

Abstract

:
The safe development of chemical industries requires adequate control of the environmental sustainability of the areas where enterprises are located. The purpose of the article is to develop and test a methodology for solving the multicriteria problem of choosing industrial zones for the development of chemical industries using the method of an additive global criterion. The novelty of the methodology lies in the multi-criteria and complexity of the tool and the presence of a statistical base, which allows it to be used for various socio-economic purposes at all levels of government. As the main research tools, the methods of multi-criteria selection of objects, one-dimensional data scaling, additive convolution of criteria, and methods of multivariate statistical analysis for verifying the results obtained and making a decision were used. The article describes the mathematical apparatus of the technique for solving the multicriteria problem of selecting objects by the method of an additive global criterion. The solution algorithm provides for a three-level integration of particular indicators using the methods of mathematical processing of an array of different-dimensional values. The procedure for selecting the vectors of the criterion space makes it possible to select industrial zones and obtain a global criterion using the additive convolution method. In order to test the methodology, the problem of choosing industrial zones for the potential development of chemical industries in the Russian region was solved. For the development of chemical production, industrial zones have been selected that are included in the above-average environmental sustainability group: Bavlinskaya, Nurlatskaya, Bugulminskaya, and Leninogorskaya. Tendencies of decrease in ecological stability of the zones, which have relatively safe industries on their territory but are adjacent to the zones of location of environmentally unfavorable industries, are revealed. The materials of the article can be used in the development of intelligent systems for monitoring and controlling the development of chemical industries, which allow monitoring the level of environmental safety of industrial zones, identifying sources of negative environmental impact with pursuing decision-making on the organization and planning of production systems in the territorial space.

1. Introduction

Chemical enterprises, as open production systems, carry out an intensive exchange of production resources with the environment. Currently, when designing new chemical and technological facilities, insufficient attention is paid to assessment of ecology negative factors of an industrial zone impact. The territorial development of chemical technological systems should be carried out with continuous monitoring of environmental sustainability and balance of enterprises operation zones.
According to new Russian legislation, first category enterprises of negative impact on environment must obtain an integrated environmental permit to conduct their activities, including mathematical calculation and justification confirming production site environmental safety. In this regard, this study is relevant and has high scientific theoretical and practical significance.
Numerous works of foreign and domestic scientists are devoted to industrial zones development in conditions of negative impact of chemical industries on the environment.
The main research directions in the field of territories concept and principles sustainable development are determined by works of the following scientists. Zhou Y., Kong Y., Sha J. and others examined industrial structure modernization in the evolution of eco-efficiency in a spatial aspect [1]; Fernando L., Suarez M., Eugenia M. proposed a multidisciplinary model to ensure territories sustainability [2]; Chertow M., Gordon M., Hirsch P. assessed industrial symbiosis and infrastructure potentials [3]; and John B., Luederitz C., Lang D. et al. [4], Cui X. [5] proposed a concept and system model for the development of ecologically safe industrial zones.
The study of sustainable development possibilities in the western regions of China based on the DEA method is reflected in the articles of Niu D.H. and Gu Kh.Ch. [6]; the conceptual categorical policy toolkit for stimulating region sustainable development is considered by V.G. Polishchuk [7]; the preconditions and prospects for state regulation of state and region sustainable development of the state and regions were studied by A. Merzlyak and U. Vikhort [8]; and methodological tools for choosing a sustainable development strategy the region is reflected in the writings of Szabo, M; Chete M.S., Palvolgi T., Ye B.N. [9,10]. Russia regions example demonstrates socio-ecological-economic system and methodological aspects sustainable development model for assessment of factors affecting sustainable development in the publications of M.A. Dugarovich, D.E. Buyantuev, S.M. Reznichenko, O.V. Takhumova, and Filatova V.V. [11,12].
The problems of chemical industries environmental safety are widely considered in scientific works of researchers, chemists, ecologists, and process engineers. The fundamental concept of “green” chemistry belongs to the researchers Anastas P.T. and Warner J.C. [13], who proposed twelve principles of “green engineering” as the basis for sustainable development [14]. Co-authored with Zimmerman J.B., the principles of waste recycling are considered in the work “When is waste not waste?” [15]. The scientific team consisting of Vest S., Aguedo M., Anastas P.T. focused on the targeted modification of raw materials using green chemistry to produce high value-added products [16]. Under the direction of Falinsky M.M. for the purposes of sustainable development, they proposed methods of water purification based on nanotechnologies [17]. Golden J.C. and co-authors from the position of social security considered the trends of ecological trade [18].
A significant contribution to the modern development of low-waste chemical-technological systems at the world level was made by the Russian academician V.P. Meshalkin. Under his scientific guidance, a lot of works were created in theory analysis field and synthesis of energy-efficient environmentally friendly chemical industries [19,20] and methods of automation of systems for optimal control of chemical-technological processes [21,22]. Problems of efficiency, competitiveness and environmental safety of industrial production in Russia and Tatarstan are considered in the works of Malysheva T., Shinkevich A., Ostanin L., Dyrdonova A. and others [23,24,25].
Methods for solving multi-criteria decision-making problems are widely used by specialists in various economy areas. Approaches to solving such problems are described in the works of domestic and foreign scientists: Bezruk V., Svid Y., and Korsun Y. who investigated methods of multi-criteria optimization in planning and management of telecommunication networks [26]; Roy B. and Slouinski R. who proposed solution to multi-criteria problems with limited bandwidth and mutual exclusion [27]; Shi Ts. and Hao F. who developed a strategy for ranking the tasks of making multi-criteria decisions in social networks [28]; Bobs D., Pascual F. who applied multi-criteria decision analysis in medical substitution therapy programs [29]; and Nunez A. and Dondo J. who considered the possibility of resource planning for reconfigurable systems based on the multi-criteria method [30]. Approaches to solving problems of multi-criteria optimization in the construction industry, energy, transport complex, social sphere, regional economy are presented in the works [31,32,33,34].
Methods of multivariate statistical analysis are also presented in the literature in relation to various research problems including factorial, discriminant, cluster analysis, multivariate scaling, and other approaches. Wang Yu and Xu Ch. used statistical analysis to evaluate work with contracts in Chinese universities [35]; Yang Ch. applied multivariate statistical analysis in monitoring equipment condition [36]; Du V., Han Y. and Chen S. developed approaches to analysis with the preservation of confidentiality [37]; Gavrilko Yu.V. et al. demonstrated temporal multivariate critical attributes analysis of production process quality with data factorization [38]; and Qian X., Min Ch. and Huang X. applied multivariate statistical analysis to assess enterprises efficiency, a comprehensive assessment of regions [39,40].
Nevertheless, despite extensive theoretical and methodological data set and practical solutions presence, there is a lack of research that may solve diagnostics and a differentiated approach problem to the organization of production systems from the standpoint of industrial zones sustainable development. This leads to the fact that when designing chemical plants with complex technological processes without taking into account territories environmental sustainability, project environmental justification may be incorrectly presented, and this is important to consider when preparing documentation for obtaining an integrated environmental permit.
The developed toolkit has a high practical value, since it is necessary for chemical industries to obtain a comprehensive environmental permit for the operation of enterprises. According to the current Russian legislation, industrial facilities of the first category of negative impact on the ecosystem are required to assess the environmental sustainability of the areas of their location or planned expansion. Unlike previously existing methods, the proposed approach to solving the problem of selecting territories is a universal tool based on a ready-made database of state statistics. The novelty of the approach also lies in the multi-criteria and complex nature of the tool, which allows it to be used for various socio-economic purposes at all levels of management (enterprise, industry, region).
The purpose of the study is to develop and test a methodology for solving the multi-criteria problem of choosing industrial zones for the development of chemical industries by the additive global criterion method. The study includes three key sections:
  • Development of a three-level multi-criteria system for chemical production development zones environmental sustainability assessment;
  • Indicators of one to three levels of integration calculation for industrial zones, links analysis between environmental sustainability criteria K1–K4;
  • Calculation of additive global criterion for environmental sustainability with the choice of industrial zones for the potential development of chemical production.
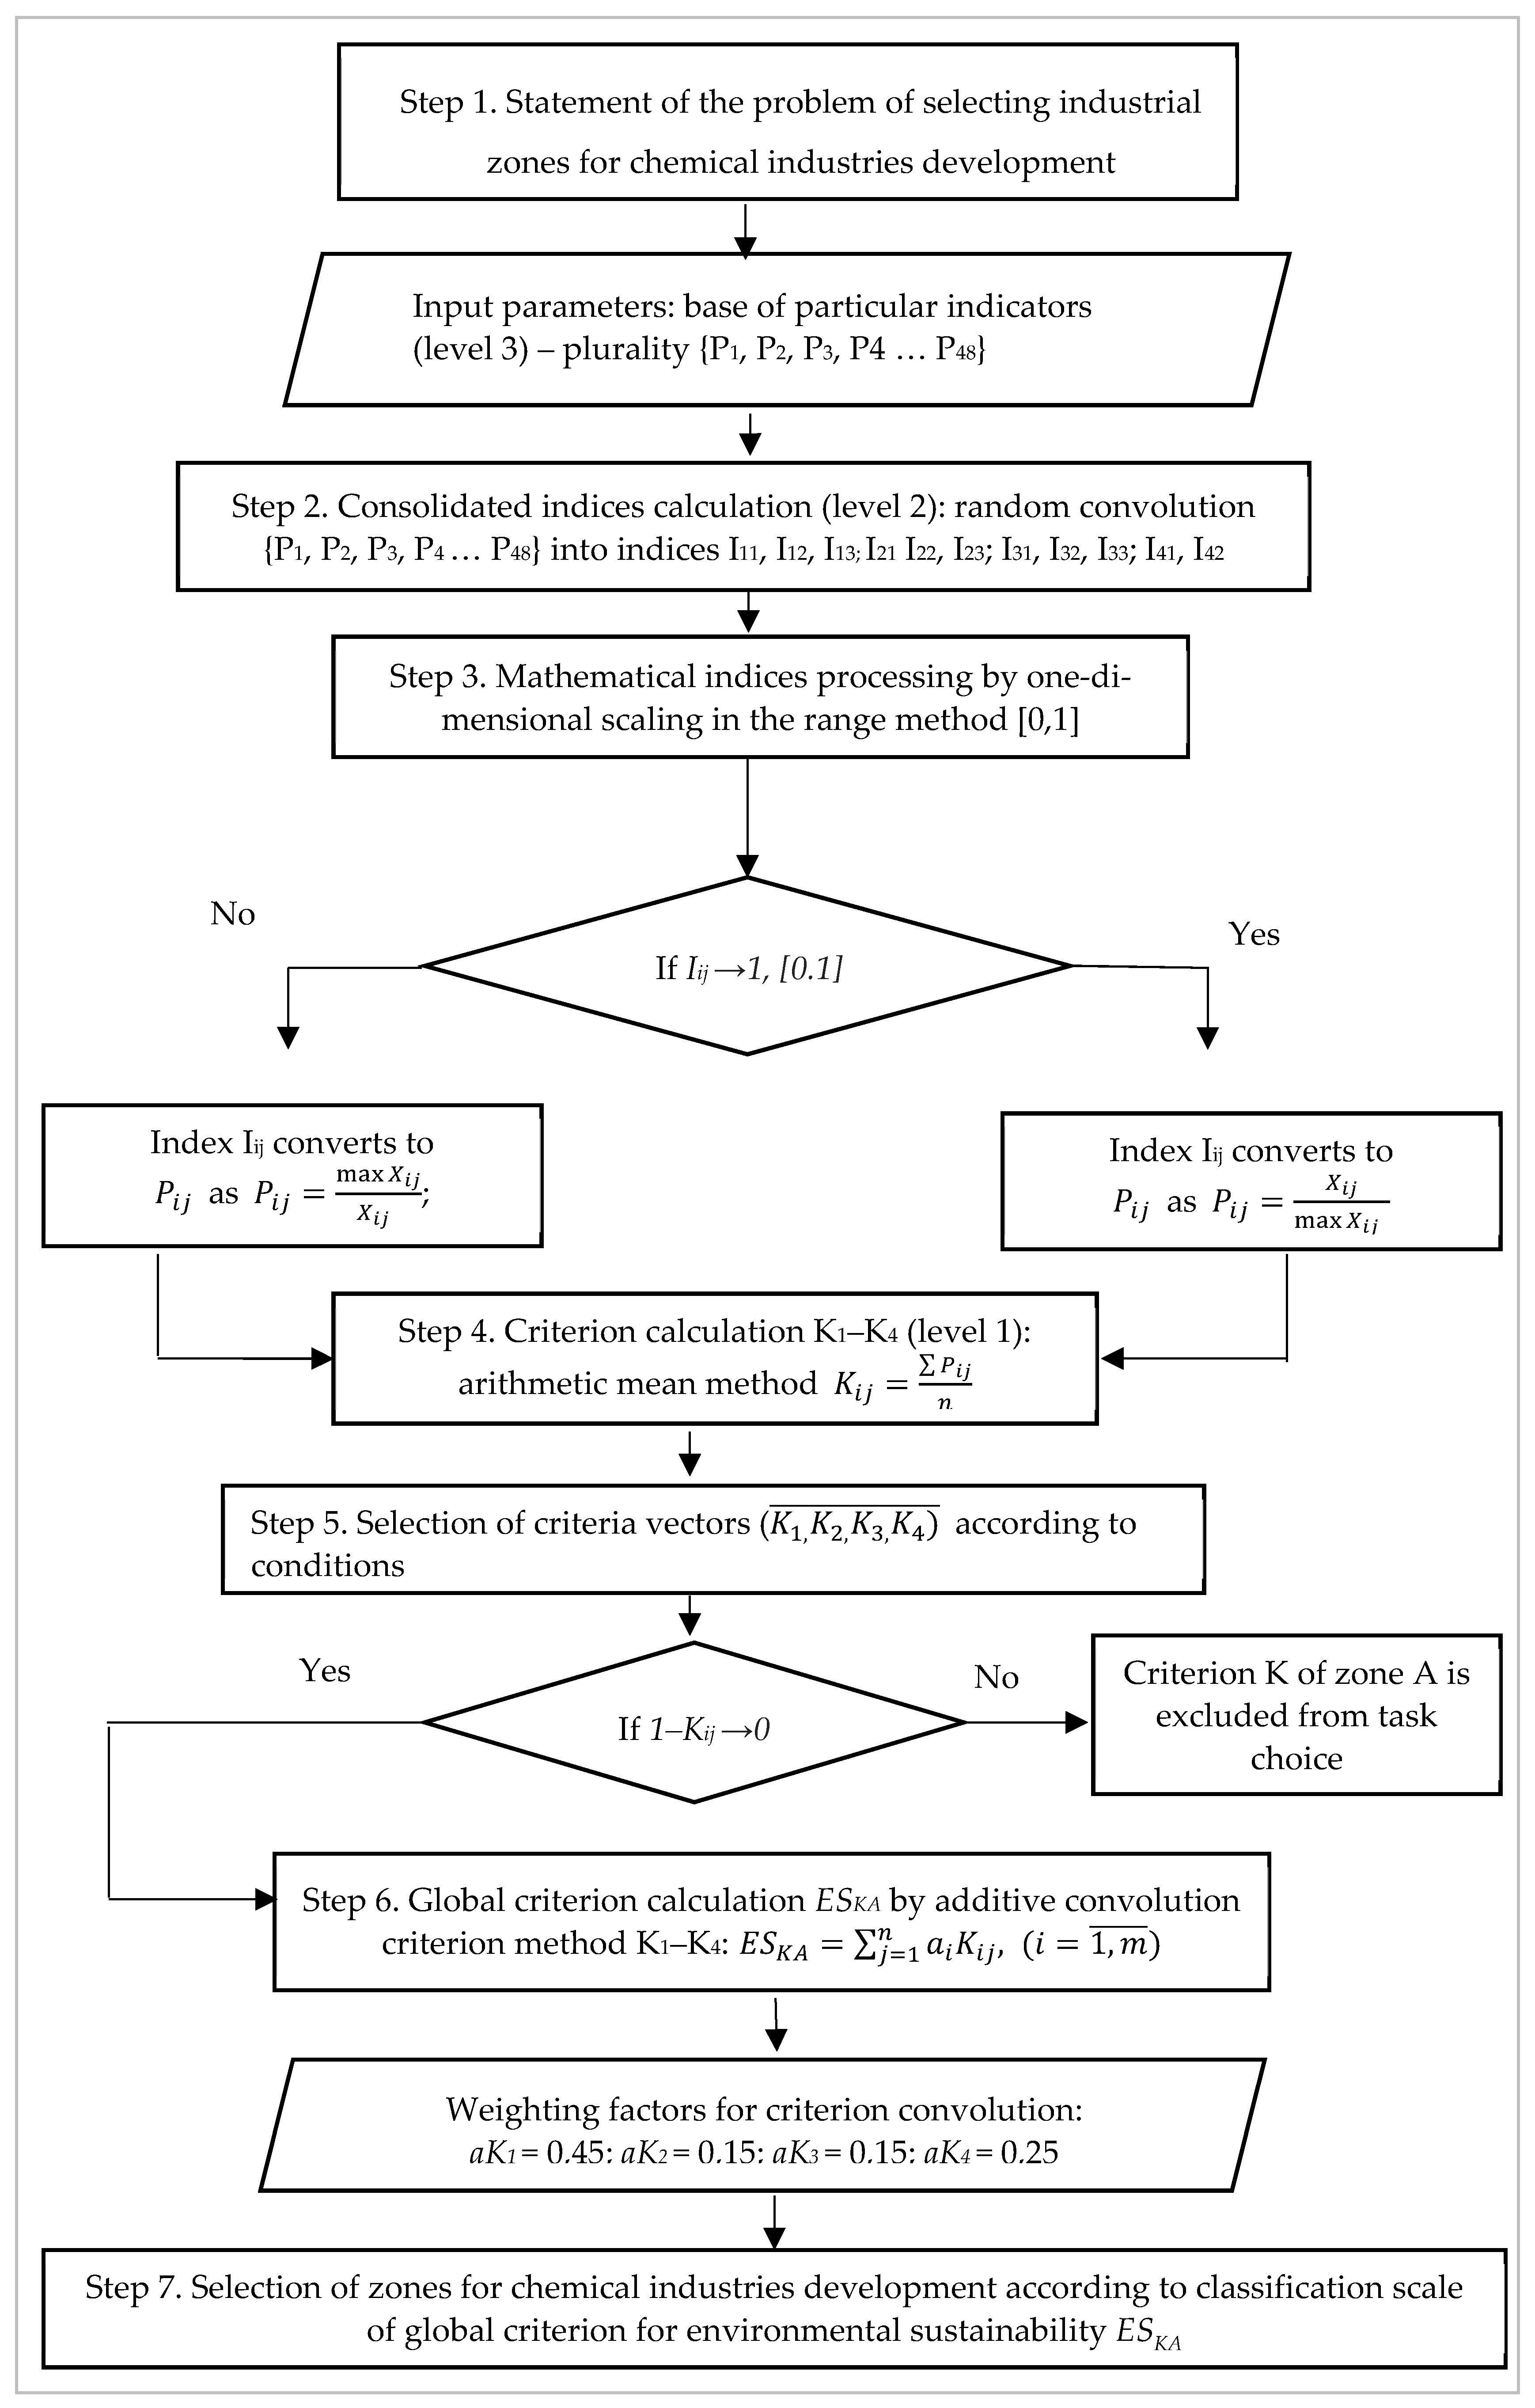
2. Methodology

To solve the problem of choosing industrial zones for chemical industries development, the authors have developed a methodology that provides solving the multi-criteria problem of objects selection by the method of the additive global criterion. Unlike the classical methods of multi-criteria decision analysis (MCDM), the proposed approach evaluates not only conflicting criteria, but also dependent causal criteria. Depending on the purpose of the study, each of the criteria can be used both in the general space and separately, taking into account weight coefficients. This choice is due to the specifics of the area of application of the methodology, namely the assessment of the environmental friendliness of industrial zones. Structuring complex problems and considering consistent criteria leads to more informed decisions.
As a rule, some solutions work well for one method, and some for others. In this regard, the proposed approach is an integration of elements of MCDM methods:
  • Analytical hierarchy process (structuring the problem of selecting industrial zones into a hierarchy with criteria and alternatives);
  • Scalarization of the vector criterion (scalar global criterion of environmental sustainability);
  • Clustering of the numerical space (classification of industrial zones in relation to the value of the global criterion);
  • Randomization of aggregated indices (convolution of single indices in a criterion).
Let us present a detailed description of the methodology for solving the multicriteria problem of choosing industrial zones for the development of chemical industries using the method of an additive global criterion. The multi-criteria selection method, unlike other approaches, is the most preferable for decision-making in conditions of multitasking, a multidimensional set of source data, the presence of two or more criteria for object management. It is with these characteristics that we can describe the task of assessing the environmental sustainability of chemical production development zones.
The transformation of selection problem into a one-criterion problem is carried out in several stages: by combining private local indicators (set {P1, P2, P3, P4 … P48}) into summary indices (I11, I12, I13; I21 I22, I23; I31, I32, I33; I41, I42) with subsequent convolution into criteria (K1, K2, K3, K4) and the general global criterion for environmental sustainability (ESKA).
Note that each integral index I is assigned a number or place of this index in the set of indices. For example, “I12”, where “1” means that the index will form criterion No. 1 (K1) in the future, and “2” means that this is the second index in the group of indices that form the criterion K1.
The following well-known mathematical and logical methods were used in the methodology for industrial zones selection for chemical industries development:
  • One-dimensional scaling (point assessment) method—for integrating a large number of different-sized parameters of environmental sustainability (indices In in the criterion Kn);
  • Additive convolution of criteria method—for transforming a multi-criteria problem into a one-criterion one, including the definition of criteria vectors (K1, K2, K3, K4) and a procedure for filtering out the worst objects, as well as the use of weight coefficients (aK1, aK2, aK3, aK4) when folding the criteria (K1, K2, K3, K4) into an additive global criterion (ESKA);
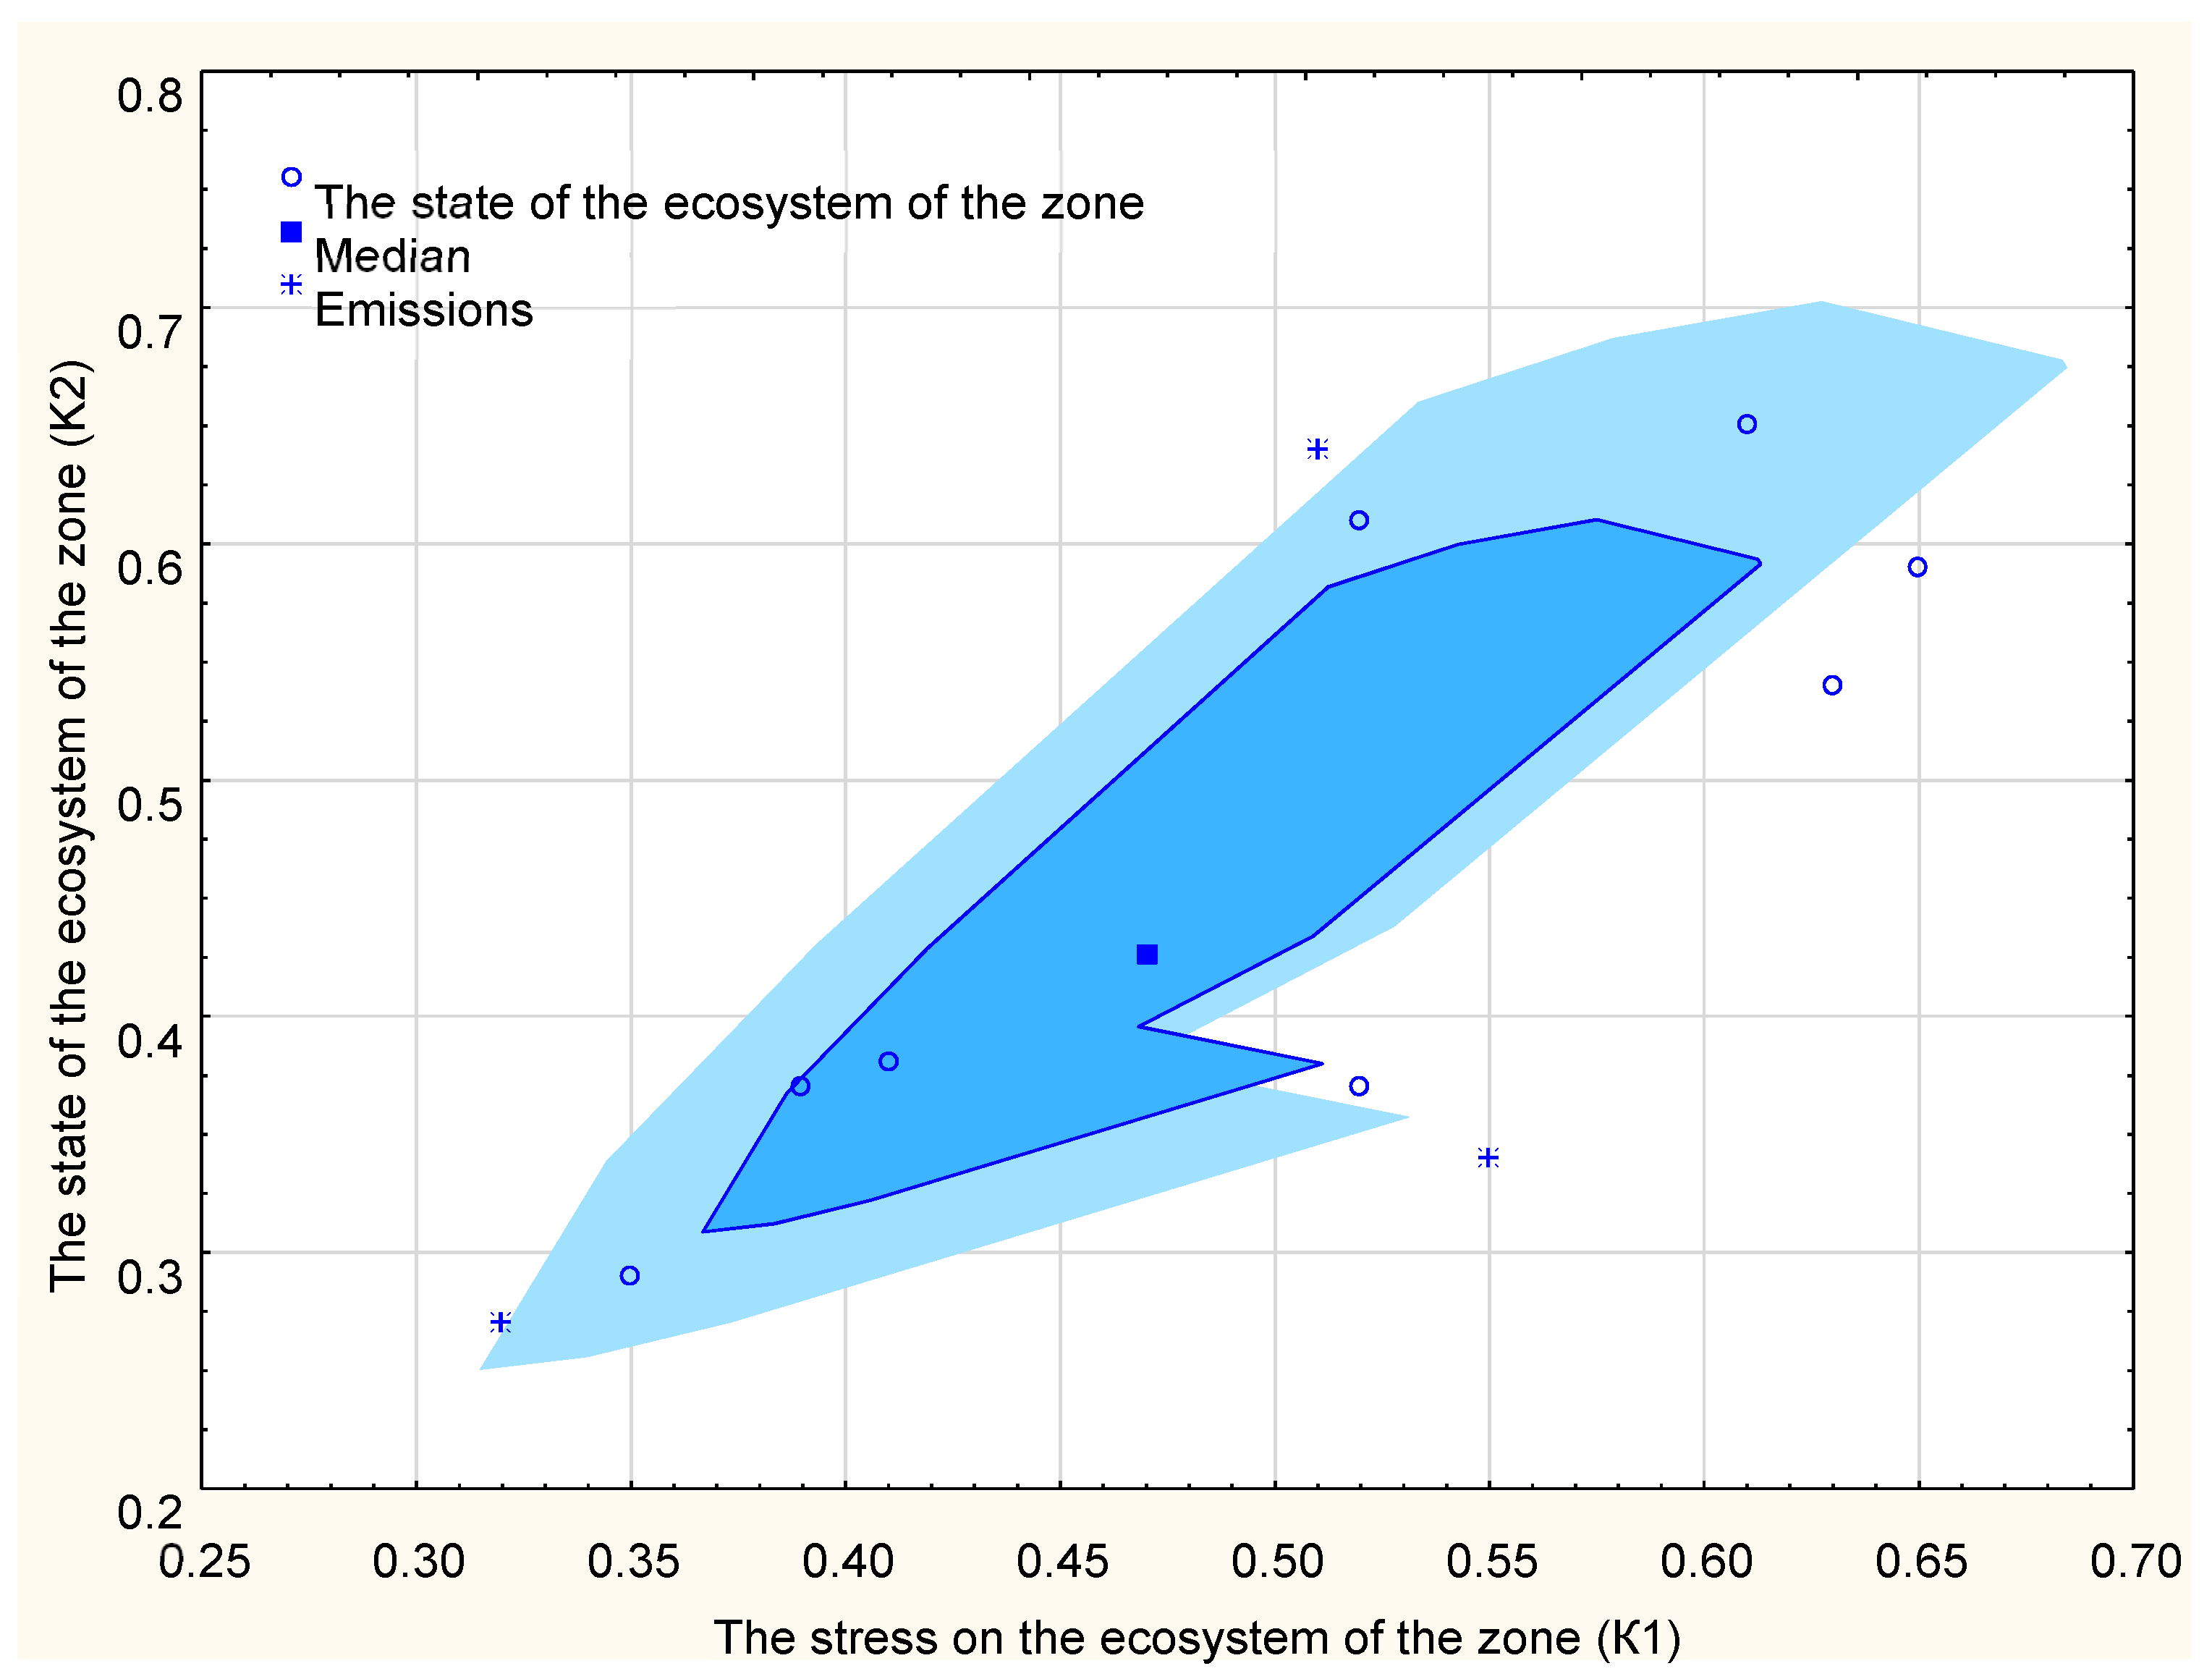
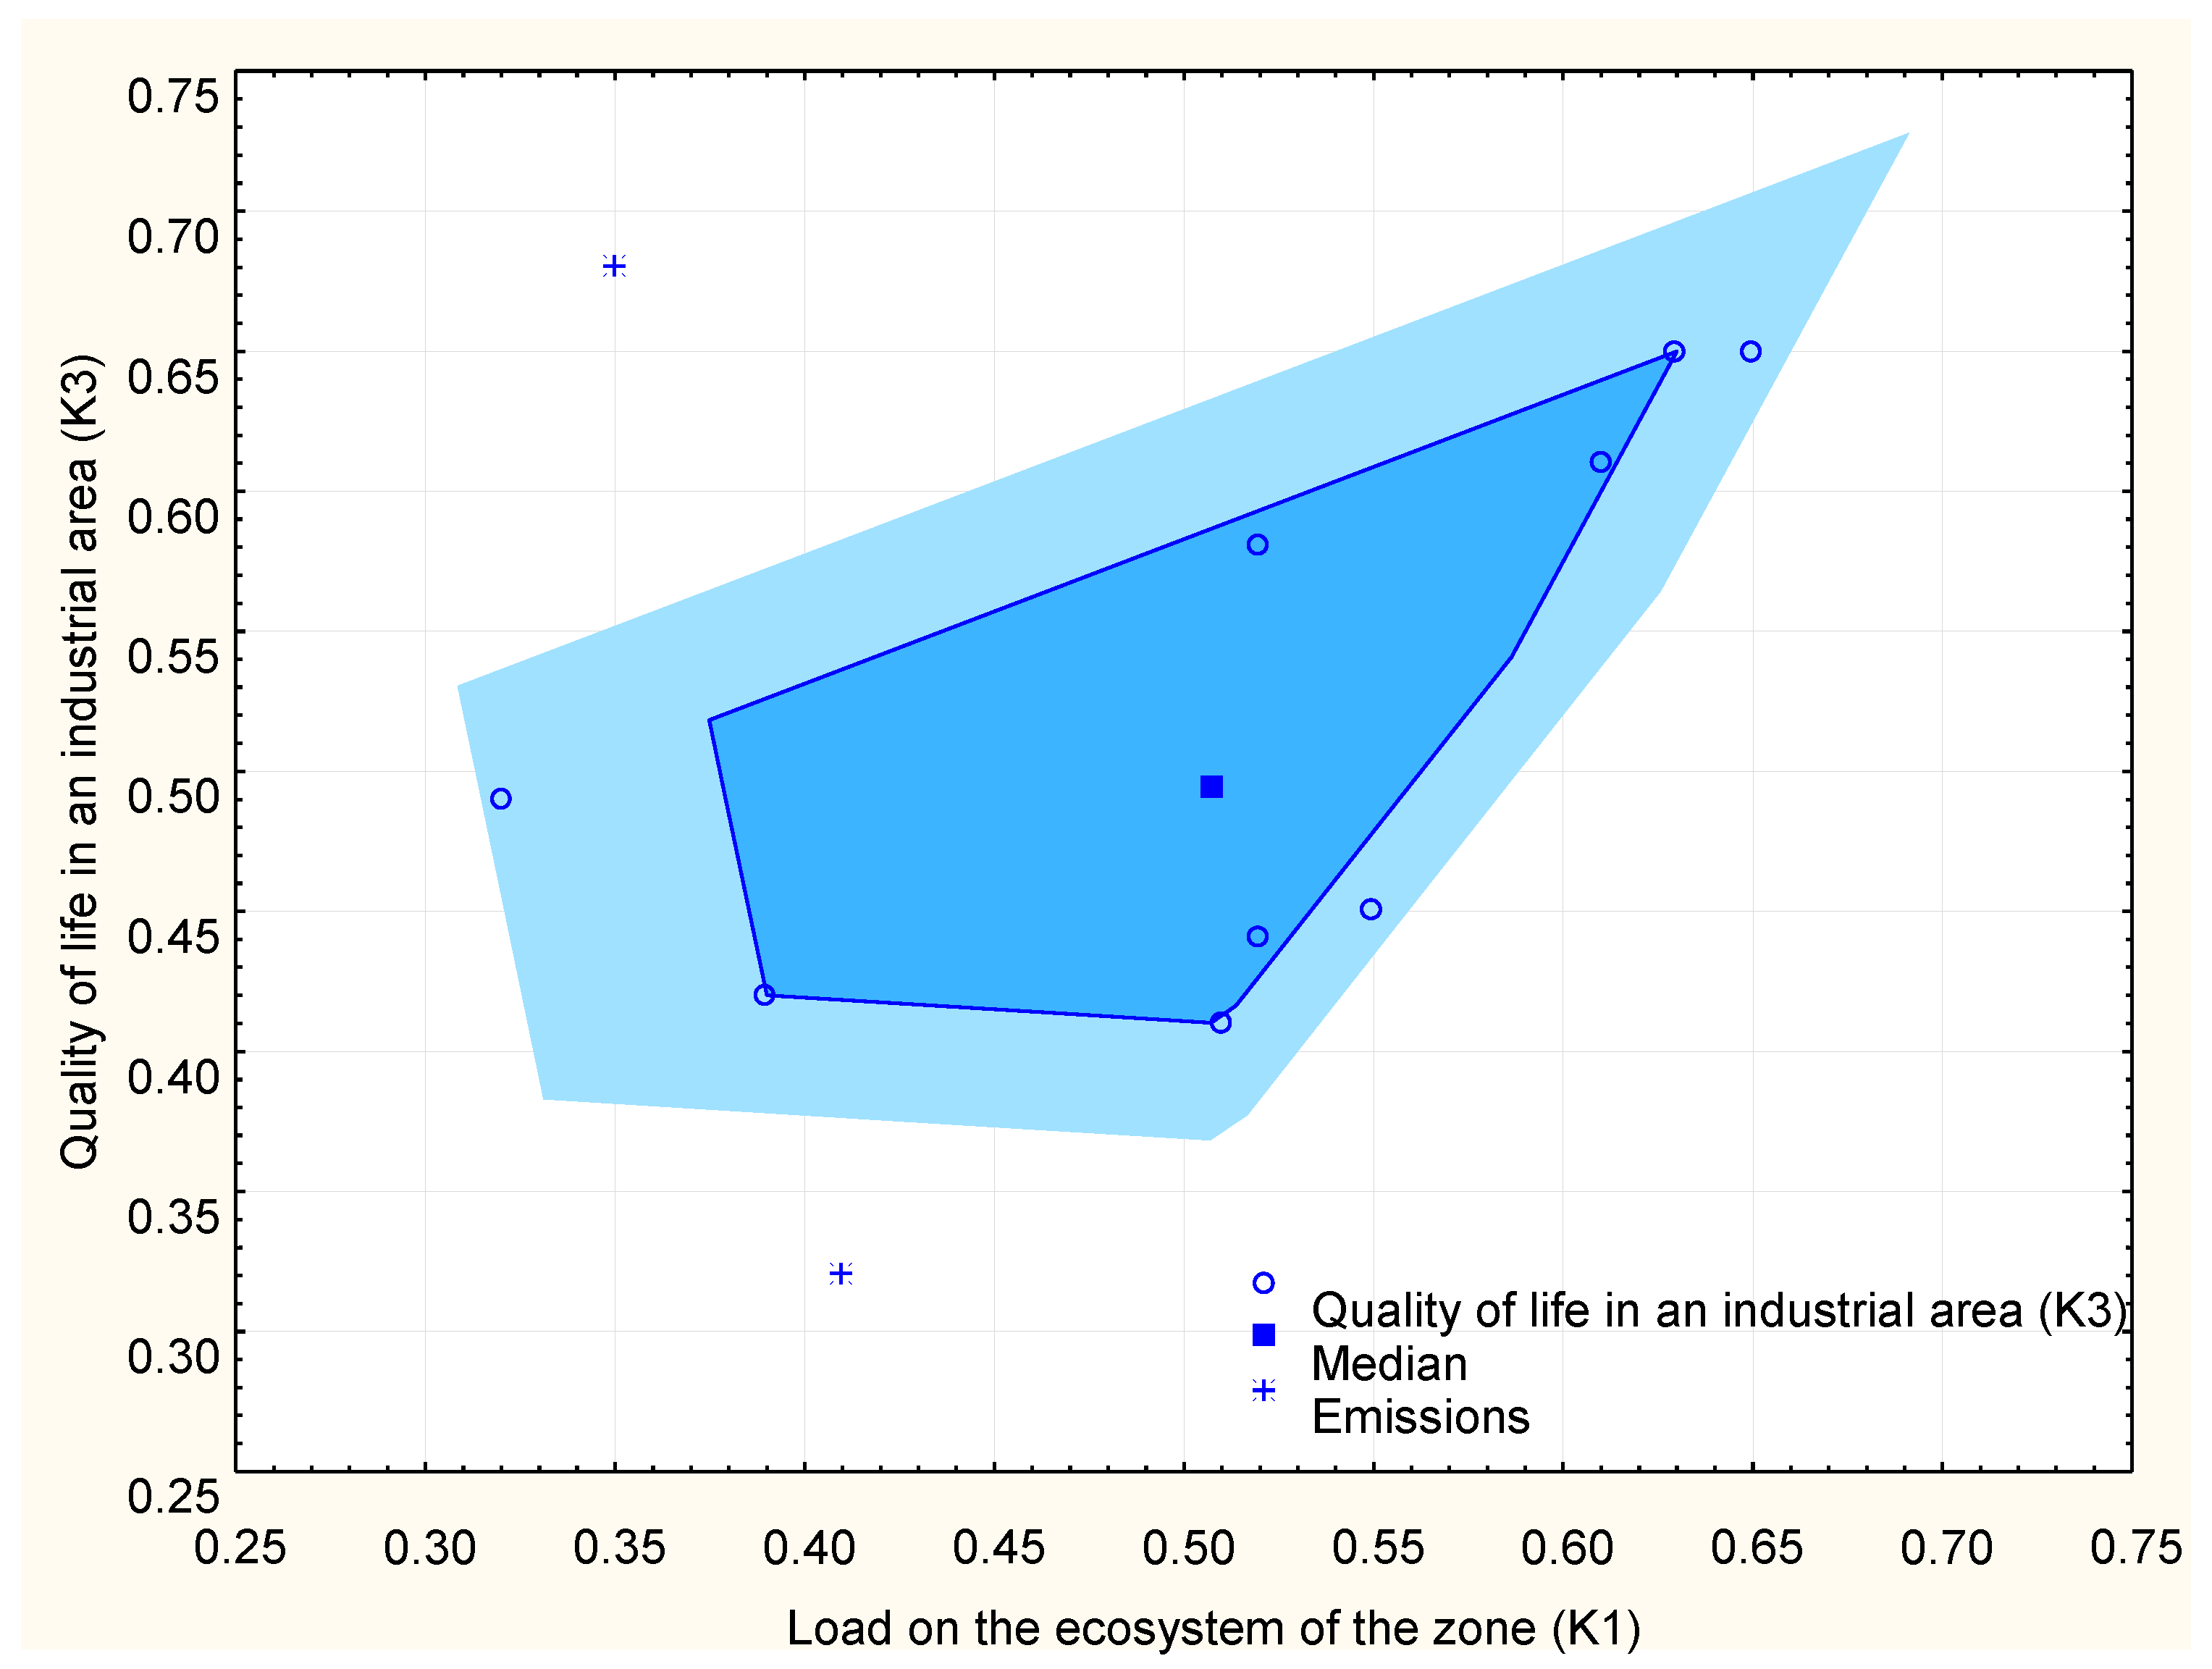
  • Correlation analysis of data method—to identify the direction and closeness of the re lationship between dependent criteria (K2, K3) and an independent criterion (K2), that are in consistent ecological chain;
  • Data clustering method (hierarchical objects classification by the method of single connection according to the criteria K1–K4)—to verify the results of industrial zones selection for the development of chemical production according to the classification scale of environmental sustainability global criterion ESKA;
  • Expert assessment method—for assessment of environmental sustainability criteria significance and determining the weight coefficients based on vectors of preferences and focal objects method.
A total of 48 particular indicators were used for the sequential formation of the global additive ESKA criterion. Table 1 provides a detailed description of private indicators by criteria.
Solving the problem of choosing industrial zones for chemical production development involves seven sequential steps. The algorithm for solving a multi-criteria problem by the additive global criterion method is visualized in Figure 1.
The technique for solving the problem is as follows:
Step 1. The task of selecting industrial zones for the development of chemical industries is being formulated. The input parameters or indicators of the third level of integration are determined—the base of private indicators representing a set {P1, P2, P3, P4 … P48} in industrial zones (A1–A11).
Step 2. Composite indices (level 2 indicators) are calculated by arbitrary convolution of private indicators {P1, P2, P3, P4 … P48} to composite indices I11, I12, I13; I21, I22, I23; I31, I32, I33; I41, I42.
Step 3. Environmental sustainability different-sized indices array by one-dimensional scaling method is converted into one-dimensional indicators within the range [0,1]. At the same time, primary multi-directionality of indicators is leveled: the essence of the indices improves as their value approaches 1.
Step 4. On the basis of one-dimensional indices of environmental sustainability, there is a calculation of K1–K4 criteria (indicators of the 1st level) by the arithmetic mean method.
Step 5. To make a decision on the choice of the most optimal according to criterion of industrial zones environmental sustainability choice, the vectors of criteria ( K 1 , K 2 , K 3 , K 4 ) ¯ are its best values close to 1. Procedure for filtering out the worst objects in relation to vector values is undertaken.
Step 6. The global ESKA criterion is calculated by additive convolution method of K1–K4 criteria. Since, for making a decision, criteria K1–K4 are not equal, they are assigned weight coefficients ai by carrying out the expert evaluation procedure.
Step 7. The selection of industrial zones for chemical industries development is made according to the global criterion for environmental sustainability classification scale ESKA. Objects are classified into four levels of environmental sustainability (high level, above average level, below average level and low level), making it possible to decide on the choice of potential industrial zones for the development of chemical production.
Mathematical data processing is performed using Microsoft Office Excel software and the Statistica software package.

3. Results

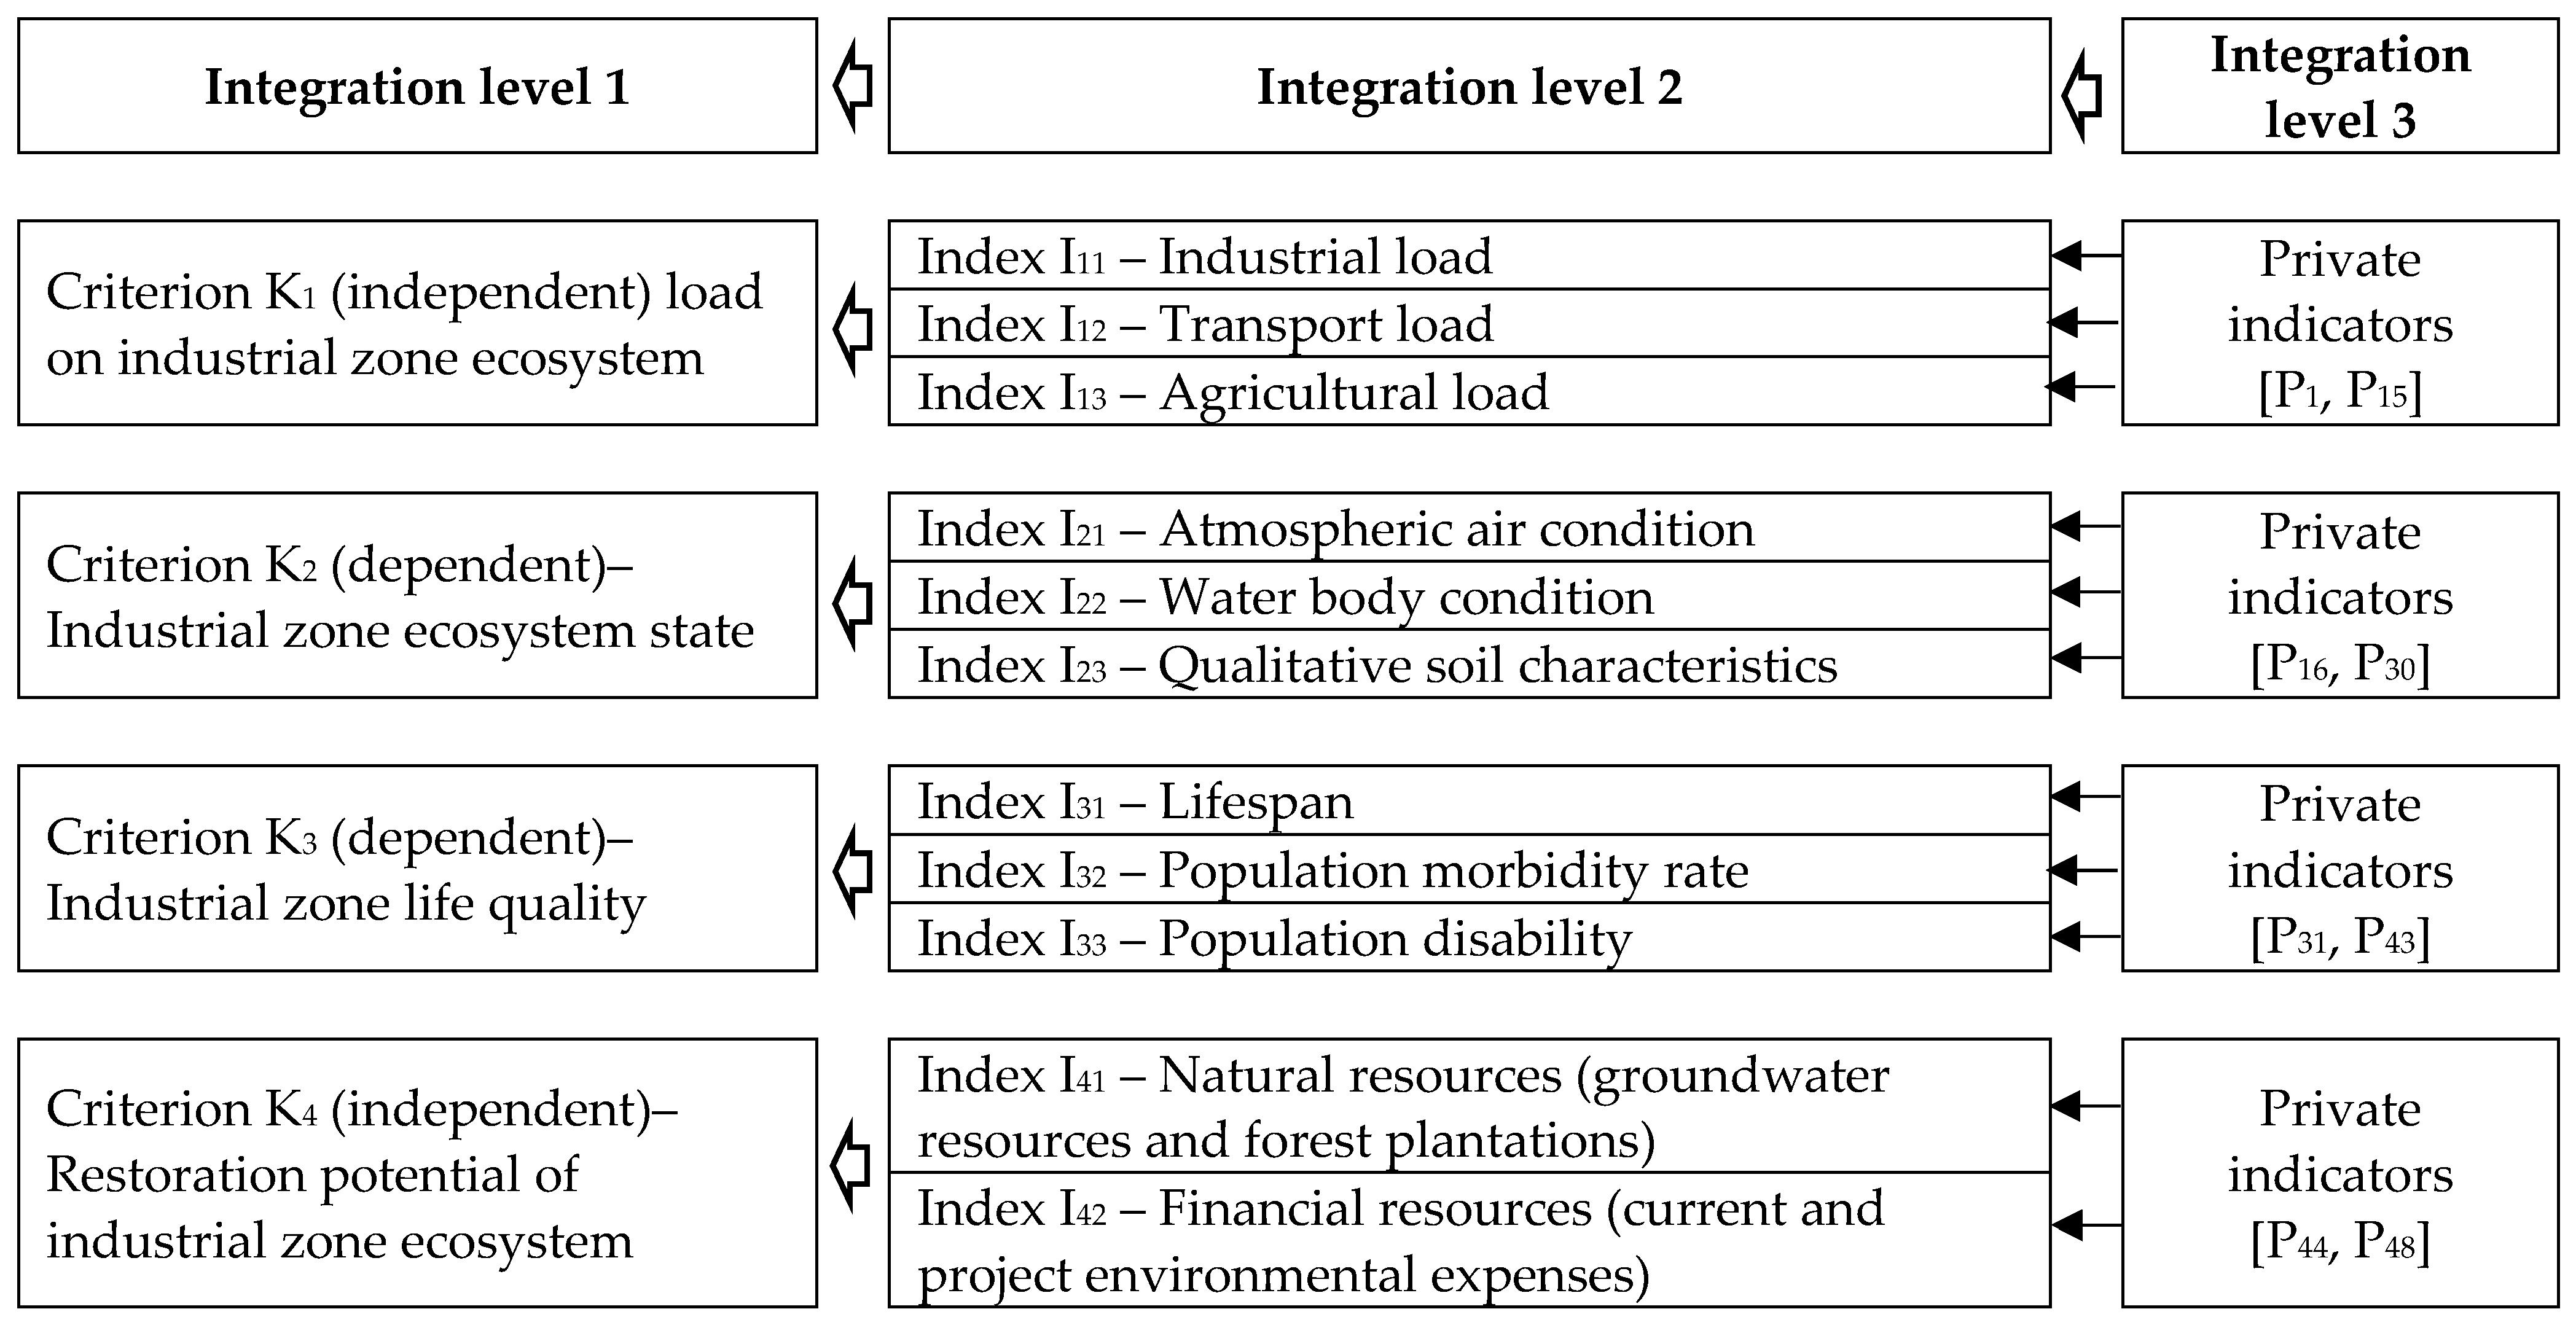
3.1. Development of a Three-Level Multi-Criteria System for Chemical Production Development Zones Environmental Sustainability Assessment

The condition for industrial zones selection for chemical industries development is the ecological sustainability of the regions. Particular indicators and criteria were selected typical for regions with industrial complexes on their territory and most informatively reflecting the impact effect of unfavorable environmental factors.
According to the developed methodology 48 particular indicators (multiplicity {P1, P2, P3, P4 … P48}) form four criteria for industrial zones environmental sustainability of (K1, K2, K3, K4):
  • K1—load on industrial zone ecosystem;
  • K2—industrial zone ecosystem state;
  • K3—life quality of industrial zone;
  • K4—restoration potential of industrial zone ecosystem.
Accordingly, criteria K1–K4 are a certain function of the corresponding particular indicators:
K 1 = f ( P 1 ,   P 2 , P 3   P 15 ) , K 2 = f ( P 16 ,   P 17 , P 18   P 30 ) , K 3 = f ( P 31 ,   P 32 , P 33   P 43 ) , K 4 = f ( P 44 ,   P 45 , P 46 , P 47 ,   P 48 ) .
Private indicators information base is based on forms of state statistical observation, reports from relevant government departments, and on sociological surveys results. In view of the large data array on private local indicators, their list is not provided in the article.
The criteria for the environmental sustainability of industrial zones represent a dependent ecological chain, where the criteria K1—independent, K2—dependent, K3—dependent, K4—independent:
[ K 1 ; K 2 = f ( K 1 , K 4 ) ; K 3 = f ( K 1 , K 2 , K 4 ) ; K 4 ,
or
[ K 1 = f ( P 1 ,   P 2 , P 3   P 15 ) ; K 2 = f ( P 1 ,   P 2 , P 3   P 15 ;   P 44 ,   P 45 , P 46 , P 47 , P 48 ) ; K 3 = f ( P 1 ,   P 2 , P 3   P 30 ;   P 44 ,   P 45 , P 46 , P 47 , P 48 ) ; K 4 = f ( P 44 ,   P 45 , P 46 , P 47 ,   P 48 ) .  
It is also taken into account that environmental sustainability level of an industrial zone is closely related to the fourth criterion—industrial zones potential to preserve and restore ecosystem(K4) at the expense of available natural resources and investment opportunities.
The calculation of K1–K4 criteria is carried out on the basis of a three-tier approach by sequentially folding the previous level indicators (Figure 2).
The task provides for the following levels of integration:
  • Integration level 3—formation of primary private indicators (multiplicity {P1, P2, P3, P4 … P48});
  • Integration level 2—calculation of second order indicators, where indices I11 (industrial load) are formed for K1
  • Second order indicators calculation, where for K1 I11 (industrial load), I12 (transport load), I13 (agricultural load) are formed; for K2—indexes I21 (atmospheric air condition), I22 (water body condition), I23 (qualitative soil characteristic); for K3—indexes I31 (life span), I32 (population morbidity rate), I33 (population disability); for K4—indexes I41 (natural resources (groundwater resources and forest plantations)), I42 (financial resources (current and project environmental expenses));
  • Integration level 3—first order indicators calculation—directly, criteria for the environmental sustainability of industrial zones K1, K2, K3, K4.
Thus, multi-criteria task of selecting industrial zones methodology for chemical industries development is complemented by the formation stage of second-order indicators, that at the next step form criteria or indicators of the first order. K1 “Industrial zone ecosystem load” includes the negative impact of industrial production as stationary sources, the transport subsystem as mobile pollutants and agricultural load due to land cultivation with chemicals and pollution of water bodies on the external environment. K2 “Industrial zone ecosystem state” includes ecological characteristics of the environment-forming elements, namely the state of atmospheric air, water bodies, soil characteristics, including taking into account heavy metals content of salts. K3 “Industrial zone life quality” includes life expectancy level, population morbidity and disability. This criterion is the final one in the ecological chain K1 → K2 → K3. In this case, K2 is a dependent criterion from K1, K3 is a dependent criterion from K2. Criterion K1 in this chain is independent. Criterion K4 includes the industrial zone natural potential, taking into account the predicted operational resources of groundwater and forest plantations, and the financial potential expressed by the expenses level for environmental purposes, including for current needs and expenses for capital repairs of fixed assets for environmental protection.
The objects of assessment according to K1–K4 criteria are Republic of Tatarstan industrial zones with a predominance of petrochemical industries in the industrial structure (11 territorial units A1–A11): Aznakaevsky (A1), Almetyevsky (A2), Bavlinsky (A3), Bugulminsky (A4), Yelabuzhsky (A5), Zainskiy (A6), Leninogorskiy (A7), Mendeleevskiy (A8), Nizhnekamskiy (A9), Nurlatskiy (A10) municipal districts, and Kazan (A11). Mostly, these are representatives of the Kama (processing enterprises of the chemical and petrochemical industry) and the Almetyevsk industrial agglomeration (suppliers of raw materials for chemical production, e.g., oil and natural gas production enterprises). The city of Kazan is characterized by large production facilities for chemical products and production of rubber and plastic products presence.

3.2. Indicators of 1–3 Levels of Integration Calculation for Industrial Zones, Links Analysis between Environmental Sustainability Criteria K1–K4

The second level indicators formation and directly the criteria K1–K4 themselves (level 1 integration) for the objects of assessment (A1–A11) is carried out by the method of one-dimensional scaling. This approach is used to integrate indicators system due to environmental sustainability parameters large number, as well as their diversity. The methodology is intended for the purposes of ranking industrial zones according to the criteria of environmental sustainability K1–K4.
The algorithm for calculating second level indicators (indices Ikn) and the first level of integration (criteria K1–K4) is as follows:
(1) The logical orientation of indicators is determined: some indicators are maximized (that is, with an indicator value increase, its essence improves), others are minimized (that is, with an indicator value decrease, its essence improves).
(2) At each stage of integration, due to different dimensions and different directions, the indicators are normalized on a scale from 0 to 1.
(3) If the indicator xij is maximized, then it is normalized according to the following formula:
P i j = X i j     max X i j ,   ( i = 1 , m ¯ ,   j = 1 , n ¯ ) ,
  • где x—previous level of integration indicator;
  • Р—next level of integration indicator;
  • i—object number (industrial zone);
  • m—objects quantity (11 industrial zones);
  • j—indicator or criterion number;
  • n—given integration level indicators quantity.
(4) If indicator is minimized, it is normalized according to the following formula:
P i j = max X i j X i j     ,   ( i = 1 , m ¯ ,   j = 1 , n ¯ ) .
Table 2 shows the matrix of the highest first integration level with standardized objects A1–A11 and calculated environmental criteria K1–K4. All elements of the matrix are in the range [0,1], while the best or optimal criterion value is 1.
The pair correlation coefficient according to K1–K2 criteria shows a fairly strong direct dependence of the industrial zone ecosystem state on the industrial load on it (the tightness of the relationship Kkor = 0.74). At the same time, the criteria dependence is not absolutely linear, which is confirmed graphically on the concentration diagram “Industrial zone ecosystem load—Industrial zone ecosystem state” (Figure 3).
The diagram shows individual points—emissions from the concentration zone, characteristic of industrial zones that do not have a high environmental load due to the specifics and scale of petrochemical industries, but adjacent to disadvantaged areas. For example, the Yelabuga industrial zone (A5), located in close proximity to a large petrochemical center—the city of Nizhnekamsk: with a relatively favorable level of industrial load of 0.52, the state of the ecosystem is 0.37.
Weak relationship is observed between the criteria K1–K3 “Industrial zone ecosystem load—Industrial zone life quality” (tightness of connection Kkor = 0.37) (Figure 4). We believe that the formation of a criterion for industrial zone life quality is influenced by a number of other factors related, inter alia, by health care system characteristics. One of the emission points on the concentration diagram is the Almetyevsk industrial zone, where, against the background of an unfavorable load (0.35) and the state of the environment (0.29), a fairly high level of life quality (0.68) is observed, probably due to the presence of medical institutions of the largest oil company.

3.3. Calculation of Additive Global Criterion for Environmental Sustainability with the Choice of Industrial Zones for the Potential Development of Chemical Production

To make a decision on the choice of the most optimal industrial zones for potential development of chemical industries, let us single out the vectors of environmental sustainability criteria—the best values close to 1. These are most likely the Bavlinskaya (A3) and Bugulminskaya (A4) industrial zones, where in the first case three vector criterion (K1, K3, K4), in the second—two vector criteria (K1, K3).
In case of multi-criteria problems, before proceeding to a single-criterion problem, a procedure is performed to filter out the worst objects with respect to vector values. Nevertheless, the purpose of our solution is not only to select the optimal industrial zones for petrochemical industries potential development, according to the criterion of environmental sustainability, but also to assess the impact of enterprises on ecosystem state and life quality in the territories. In addition, certain optimal zones (Bavlinskaya, Bugulminskaya) based on the feature of vector criteria require confirmation, since not all of the four criteria have vector significance. Furthermore, the importance of K1–K4 criteria is not equivalent for making a decision that will be discussed below.
In this regard, we will convolve criteria K1–K4 for all studied objects A1–A11. Let us accept the condition that for making a decision, the criteria K1–K4 are not equal and are assigned to the corresponding weight coefficients ai by carrying out the expert evaluation procedure:
a1 = 0.45;
a2 = 0.15;
a3 = 0.15;
a4 = 0.25;
 where ∑ ai =1, that is 0.45 + 0.15 + 0.15 + 0.25 = 1.
The expert decision on assigning weight coefficients to the criteria is based on the opinions of six specialists—representatives of the environmental safety services of petrochemical enterprises and employees of state structures in terms of managing and monitoring processes in the industry and ecosystem.
The survey of experts was conducted by the interview method based on the developed regulations for the collection and analysis of expert assessments. The development of expert assessments by specialists was carried out on the basis of the method of preference vectors and focal objects. Further, the examination of the received opinions and assessments of experts was carried out by comparing the obtained average estimates.
As you can see, the key criterion is industrial zone ecosystem load (aK1 = 0.45), which we consider quite justified in view of the fact that K1 serves as a “starting” link and “launches” the entire further chain of criteria. The second most important K4, which represents the potential to restore lost environmental sustainability of an industrial zone (aK4 = 0.25). Criteria K2 and K3, which are a consequence of the cause of K1, have equal importance and weight coefficients—1.5 each.
The transformation of multi-criteria problem into a one-criterion problem was carried out by the method of additive convolution of criteria according to the formula:
E S K , A = j = 1 n a i K i j , ( i = 1 , m ¯ ) ,
where ESKA—integral criterion of environmental sustainability obtained from a set of criteria Kj on objects (industrial zones) Ai.
For the integral criterion ESKA, scale of environmental sustainability of an industrial zone in the range [0,1] is proposed, corresponding to four sustainability states:
  • 0.75 < ESKA < 1.0—high environmental sustainability;
  • 0.50 < ESKA < 0.75—environmental sustainability above average;
  • 0.25 < ESKA < 0.50—environmental sustainability below average;
  • 0.0 < ESKA < 0.25—low environmental sustainability.
Table 3 shows industrial zones classification with chemical-technological facilities on their territory, according to the level of environmental sustainability. The convolution of K1–K4 criteria made it possible to obtain an additive global criterion and to group the industrial zones.
According to ESKA not one of the research objects has been assigned to the zone of “ideal” high environmental sustainability. The situation is similar with the group of low environmental sustainability. Thus, all industrial zones are divided into the second and third groups with environmental sustainability above and below average. Furthermore, in the second group, there are mainly regions with oil-producing companies, in the third (i.e., the production of chemical and petrochemical products). Our earlier assumptions about the optimality of Bavlinskaya (A3) and Bugulminskaya (A4) industrial zones on the basis of 4 criteria are confirmed by additive criterion present calculations. We believe that industrial zones included in the group of environmental sustainability above average may be considered as optimal for the development of petrochemical industries: Bavlinskaya (A3), Nurlatskaya (A10), Bugulminskaya (A4), Leninogorskaya (A7) industrial zones.
To verify the results of industrial zones selection for the development of chemical industries according to the classification scale of the global criterion for environmental sustainability ESKA, a hierarchical classification of objects is carried out according to the criteria K1–K4 by multidimensional clustering method. The method of single connection is used where the distance between observation objects is determined on the basis of the Euclidean metric. The distance (Seu) between the values of K1–K4 for industrial zones (Ai) is determined by the formula:
S e u = i = 1 4 ( K A i K A i + 1 ) 2 .
The results of cluster analysis confirm industrial zones distribution by the level of environmental sustainability, which is confirmed by the matrix of Euclidean distances (Table 4). Objects with a value of the Euclidean distance Seu ≤ 0.18 are included in the group of industrial zones of environmental sustainability above average; with the value of the Euclidean distance Seu ≥ 0.18 are included in the group of industrial zones of ecological stability below the average.
The presented classification of industrial zones according to the level of environmental sustainability is relevant at this point in time and may be mobile in dynamics. With a high degree of probability, it may be assumed that in the case of putting into operation low-ecological petrochemical plants in industrial zones with environmental sustainability above average, the territories may move to a worse group of environmental sustainability below the average. On the contrary, the modernization of existing production facilities, and the organization of ecological industrial chemical engineering systems with a corresponding decrease in industrial load on the territory may raise the level of sustainability to a higher one.
In this regard, we believe that the proposed and tested methodology for multi-criteria environmental sustainability assessment of industrial zones is relevant and practically significant for programs creation aimed for development of petrochemical complex at the level of state coordinating structures (ministries, departments), at the level of holdings or groups of companies (for example, in Tatarstan JSC Tatneftekhiminvest Holding, GC Taif). In turn, the further methodology development, taking into account the natural resource potential, seems valid. The study of financial resources in two projections—as pre-costs (for measures to improve technological processes in order to minimize the negative impact) and post-costs (costs for the elimination, neutralization and compensation of already committed environmental violations) allows you to justify the direction and feasibility of environmental engineering projects.

4. Conclusions

Achievement of the set goal of choosing industrial zones for chemical industries development made it possible to obtain the following scientific and practical results:
1. To solve the question of choosing industrial zones for chemical industries development, a method that provides for solving a multi-criteria problem of selecting objects by the method of an additive global criterion has been developed. The algorithm for solving the problem provides for seven consecutive steps, including the calculation of indicators of the third level (partial indicators), the second level (summary indices) and the first level (criteria) using methods of mathematical processing of different quantities array. The procedure for identifying criterion vectors space allows you to optimize the sample of industrial zones and to obtain a global criterion for environmental sustainability using the additive convolution method. The final algorithm step is objects classification according to the level of environmental sustainability, which makes it possible to make a decision on the selection of potential industrial zones for the development of chemical production.
2. A multi-criteria system for assessing zones environmental sustainability for the development of chemical industries of three-level integration has been developed. The assessment system combines 48 private local indicators into 11 composite integral indices with their further convolution into 4 criteria: industrial zone ecosystem load (K1), industrial zone ecosystem state (K2), industrial zone life quality (K3), and the potential for ecosystem restoration industrial zone (K4). The criteria for the environmental sustainability of industrial zones represent a dependent ecological chain. The objects of assessment according to the K1–K4 criteria are industrial zones with a predominance of chemical production in the industrial structure (11 territorial units A1–A11).
3. By three-level integration method of basic indicators using one-dimensional scaling of values and their linear convolution, the key criteria of environmental sustainability K1–K4 are obtained for the industrial zones under study. Pairwise correlation showed a fairly strong direct dependence (Kkor = 0.74) of the state of the ecosystem of the industrial zone (K2) on the industrial load on the territory (K1) with individual emissions of points-objects from the concentration zone. A weak relationship (Kkor = 0.37) is observed between industrial zone ecosystem load (K1) and industrial zone life quality (K3), which is explained by a number of other social factors and the indirect criteria impact. The tendencies of a decrease in the environmental sustainability of industrial zones that have relatively environmentally friendly production facilities on their territory, but are adjacent to the zones where environmentally unfavorable production facilities are located, are revealed.
4. The problem of selecting industrial zones for the potential development of chemical industries is solved on the basis of obtained additive global criterion for environmental sustainability. When transforming a multi-criteria problem into a one-criterion problem, the procedure for determining the criteria vectors, screening out non-dominated objects relative to the vectors, weighing the criteria during convolution based on expert assessment is performed. Industrial zones classification according to the level of environmental sustainability relative to the value of the additive global criterion is made, which is verified by the method of clustering objects according to the set of criteria K1–K4. Industrial zones that are included in the group of environmental sustainability above average Bavlinskaya (A3), Nurlatskaya (A10), Bugulminskaya (A4), and Leninogorskaya (A7) are selected for the development of chemical production.
The practical significance of the results of the study lies in the need to develop methodological tools for enterprises of the first category in order to assess the negative impact on the ecosystem. The new legislation obliges chemical industries to assess the environmental sustainability of their areas. Approbation of the proposed tools clearly shows the practical applicability of the methodology and the multivariance of its use in the real economy.

Author Contributions

Conceptualization, methodology—A.I.S., T.V.M.; formal analysis—N.Y.P.; investigation—A.I.S., T.V.M.; data curation—T.V.M.; writing—original draft preparation—A.I.S.; writing—review and editing—N.Y.P. All authors have read and agreed to the published version of the manuscript.

Funding

The research was carried out at the expense of the grant of the Russian Science Foundation, project number 22-28-00581, https://rscf.ru/en/project/22-28-00581/.

Conflicts of Interest

The authors declare no conflict of interest.

References

  1. Zhou, Y.; Kong, J.; Hankun, W. The role of industrial structure upgrades in eco-efficiency evolution: Spatial correlation and spillover effects. Sci. Total Environ. 2019, 687, 1327–1336. [Google Scholar] [CrossRef]
  2. Fernando, M.; Suarez-Serrano, L.; Eugenia, M. Multidisciplinary loop for urban sustainability. Rev. De Arquit. 2019, 21, 76–89. [Google Scholar]
  3. Chertow, M.; Gordon, M.; Hirsch, P.; Ramaswami, A. Industrial symbiosis potential and urban infrastructure capacity in Mysuru, India. Environ. Res. Lett. 2019, 14, 075003. [Google Scholar] [CrossRef]
  4. John, B.; Luederitz, C.; Lang, D.; Wehrden, H. Toward Sustainable Urban Metabolisms. From System Understanding to System Transformation. Ecol. Econ. 2019, 157, 402–414. [Google Scholar] [CrossRef]
  5. Cui, X. How can cities support sustainability: A bibliometric analysis of urban metabolism? Ecol. Indic. 2018, 93, 704–717. [Google Scholar] [CrossRef]
  6. Li, L.; Lei, Y.; Pan, D.; Si, C. Research on Sustainable Development of Resource-Based Cities Based on the DEA Approach: A Case Study of Jiaozuo, China. Math. Probl. Eng. 2016, 2016, 5024837. [Google Scholar] [CrossRef] [Green Version]
  7. Polishchuk, V.G. Conceptual categorial policy toolkit for promoting sustainable development of the region. Top. Probl. Econ. 2009, 101, 168–174. [Google Scholar]
  8. Merzlyak, A.; Vikhort, U. Background and prospects for state regulation of sustainable development of the state and regions. Balt. J. Econ. Res. 2016, 2, 83–89. [Google Scholar]
  9. Sabo, M.; Chete, M.C.; Palvolga, T. Sustainable Regions in terms of sustainable development. Eur. Sustain. Dev. J. 2018, 7, 395–411. [Google Scholar]
  10. Ye, B.N. Methodological tools for selecting a strategy for sustainable development of the region. Indep. Manag. Prod. J. 2020, 11, 1803–1818. [Google Scholar]
  11. Dugarovich, M.A.; Buyantuevna, D.E.; Alexandrovna, A.D. Model of sustainable development of the socio-ecological-economic system of the municipal formation in Russia. In Proceedings of the International Conference on Social Science and Educational Research (ACSS-SSTR 2015), Singapore, 6–7 November 2015; Volume 14, pp. 138–142. [Google Scholar]
  12. Reznichenko, S.M.; Takhumova, O.V.; Filatov, V.V. Methodological aspects of assessing factors affecting sustainable development Region. Mod. J. Teach. Foreign Lang. 2018, 8, 70–80. [Google Scholar]
  13. Anastas, P.T.; Warner, J.C. Green Chemistry: Theory and Practice; Oxford University Press: New York, NY, USA, 1998; p. 135. [Google Scholar]
  14. Anastas, P.T.; Zimmerman, J.B. Twelve principles of green engineering as a foundation for sustainable development. Sustain. Dev. Sci. Technol. Defin. Princ. 2006, 1, 11–32. [Google Scholar]
  15. Zimmerman, J.B.; Anastas, P.T. When is waste not waste? Sustain. Dev. Sci. Technol. Defin. Princ. 2006, 1, 201–221. [Google Scholar]
  16. Vest, S.; Aguedo, M.; Anastas, P.T. Lignin Conversions for High Value Added Applications: Towards Targeted Modifications Using Green Chemistry. Green Chem. 2017, 19, 4200–4233. [Google Scholar]
  17. Falinsky, M.M.; Turley, R.; Zimmerman, J.B. Proper Water Treatment Using Nanotechnology: Considerations of Sustainability from Design and Research to Development and Implementation. Environ. Sci.-Nano 2020, 7, 3255–3278. [Google Scholar] [CrossRef]
  18. Golden, J.C.; Subramanian, V.; Zimmerman, J.B. Sustainable Development and Trade Trends. J. Ind. Ecol. 2011, 15, 821–824. [Google Scholar] [CrossRef]
  19. Meshalkin, V.P.; Gartman, T.N.; Kokhov, T.A.; Korelshtein, L.B. Approximate mathematical model of heat exchange in a complex thermal engineering system of several product pipelines carrying a motionless isothermal product within a single insulating jacket. Dokl. Chem. 2018, 481, 152–156. [Google Scholar] [CrossRef]
  20. Meshalkin, V.; Shinkar, E.; Okhlobystin, A. Logical-information model of energy-saving production of organic sulfur compounds from low-molecular sulfur waste fuel oil. Energy 2020, 13, 5286. [Google Scholar] [CrossRef]
  21. Makarova, H.; Meshalkin, V.; Kolybanov, K. System analysis of the efficiency of imitation of processes of chemical immobilization of mercury in waste using multivariate visualization tools. Theor. Basis Chem. Eng. 2020, 54, 872–878. [Google Scholar] [CrossRef]
  22. Meshalkin, V.P.; Shulaev, N.S.; Aristov, V.M. Physicochemical Basics of Energy and Resource Efficient Combined Technology of Wastewater Treatment of Soda Ash Production. Rep. Chem. 2020, 494, 145–148. [Google Scholar]
  23. Shinkevich, A.I.; Malysheva, T.V.; Ostanin, L.M.; Muzhzhavleva, T.V.; Kandrashina, E.A. Organization challenges of competitive petrochemical products production. Espacios 2018, 39, 28–41. [Google Scholar]
  24. Dyrdonova, A.N.; Shinkevich, A.I.; Galimulina, F.F.; Malysheva, T.V.; Zaraychenko, I.A.; Petrov, V.I.; Shinkevich, M.V. Issues of Industrial Production Environmental Safety in Modern Economy. Ekoloji 2018, 106, 193–201. [Google Scholar]
  25. Malysheva, T.; Shinkevich, A.; Ostanina, S.; Vodolazhskaya, E.; Moiseyev, V. Perspective directions of improving energy efficiency on the meso and micro levels of the economy. J. Adv. Res. Law Econ. 2016, 7, 75. [Google Scholar]
  26. Bezruk, V.; Svid, I.; Korsun, I. Methods of multicriteria optimization in planning and management of telecommunication networks. In Proceedings of the International Conference on Contemporary Problems of Radio Engineering, Telecommunications and Informatics, Lvov, Ukraine, 28 February–3 March 2006; pp. 381–383. [Google Scholar]
  27. Roy, B.; Slowinski, R. Distribution of multicriteria tasks to heterogeneous processors with limited bandwidth and mutual exclusion. Comb. Optim. Appl. 2014, 2, 327–364. [Google Scholar]
  28. Shi, Z.; Hao, F. Ranking strategy for the tasks of making multicriteria decisions in social networks. J. Super Comput. Technol. 2013, 66, 556–571. [Google Scholar]
  29. Bobs, J.; Pascual, F.; Casado, M. A multicriteria analysis of decisions in opioid substitution therapy programs for opioid use disorders. Adicciones 2018, 30, 167–169. [Google Scholar]
  30. Nunez, A.; Dondo, F.; Murdochka, M. Scheduling and Resource Scheduling Based on a multicriteria method for Partially Dynamically Reconfigurable Systems. IEEE Trans. Lat. Am. 2020, 18, 414–421. [Google Scholar] [CrossRef]
  31. Zhao, L.; Tan, V.; Huang, L. Collaborative task distribution based on crowd using Multi-Criteria Optimization and Decision Making. IEEE Syst. J. 2020, 14, 3904–3915. [Google Scholar] [CrossRef]
  32. Mitkus, S.; Trinkuniene, E. Analysis of the construction contract evaluation criteria system model. Technol. Econ. Dev. Econ. 2007, 13, 244–252. [Google Scholar] [CrossRef]
  33. Jelohani-Niaraki, M. Joint spatial multicriteria assessment: Overview and directions for future research. Int. J. Geogr. Inform. 2021, 35, 9–42. [Google Scholar] [CrossRef]
  34. Jakovljevic, V.; Zizovic, M.; Pamucar, D.; Stević, Ž.; Albijanic, M. Evaluation of Human Resources in Transportation Companies Using Multi-Criteria Model for Ranking Alternatives by Defining Relations between Ideal and Anti-Ideal Alternative (RADERIA). Mathematics 2021, 9, 976. [Google Scholar] [CrossRef]
  35. Wang, Y.; Xu, Z. Statistical Analysis of Contract Fraud in Chinese Universities. Mathematics 2021, 9, 1684. [Google Scholar] [CrossRef]
  36. Yang, C. How to Use the Multivariate Statistical Analysis Method in Equipment Condition Monitoring. In Proceedings of the 4th International Conference on Mechatronics, Materials, Chemistry and Computing (ICMMCCE 2015), Xi’an, China, 12–13 December 2015; Volume 39, pp. 176–181. [Google Scholar]
  37. Du, V.; Han, Y.; Chen, S. Confidentiality-Preserving Multivariate Statistical Analysis: Linear Regression and Classification. In Proceedings of the 4th International SIAM Conference on Data Mining, Lake Buena Vista, FL, USA, 22–24 April 2004; pp. 222–223. [Google Scholar]
  38. Gavrilko, Y.; Kurchenko, O.; Tereshchenko, A. Method for multi-dimensional statistical analysis of temporary multi-dimensional critical atri-butes of the quality of the production process with data factorization. Radio Electron. Inform. Manag. 2019, 1, 167–177. [Google Scholar]
  39. Qian, X. Multivariate statistical methods the level of our comprehensive analysis of all regions. In Proceedings of the International Colloquium on Computing, Communications, Control and Management (CCCM 2010), Yangzhou, China, 20–22 August 2010; Volume 3, pp. 454–457. [Google Scholar]
  40. Min, C.; Huang, X. Assessment of the economic efficiency of enterprises based on the method of multivariate statistical analysis. In Proceedings of the International Conference on Quality, Reliability, Risk, Maintenance and Safety (QR2MSE), Chengdu, China, 15–18 June 2012; pp. 971–974. [Google Scholar]
Figure 1. Algorithm for solving the multicriteria problem of choosing industrial zones for chemical industries development using the additive global criterion method.
Mathematics 10 01434 g001
Figure 2. Multi-criteria three-level system for environmental sustainability of chemical production development zones assessment.
Mathematics 10 01434 g002
Figure 3. Criterion concentration chart K1–K2 “Industrial zone ecosystem load—Industrial zone ecosystem state”.
Mathematics 10 01434 g003
Figure 4. Criterion concentration chart K1–K3 «Industrial zone ecosystem load—Industrial zone life quality».
Mathematics 10 01434 g004
Table 1. Base of partial indicators for the formation of criteria for environmental sustainability of industrial zones.
CriteriaParticular Indicators
K1 “Load on industrial zone ecosystem”P1—is the amount of pollutants departing from all stationary sources of discharge per person;
P2—the amount of pollutants departing from all stationary sources of isolation without purification, in % of the total amount of pollutants;
P3—formation of industrial waste per unit area;
P4—formation of industrial waste by hazard classes (1st class—extremely dangerous and 2nd class—highly dangerous) per unit area;
P5—availability of operating waste sorting complexes per unit area;
P6—the area of authorized landfills in relation to the territory of the industrial zone;
P7—the proportion of respondents who noted the problem of the presence of enterprises polluting the environment;
P8—the percentage of respondents who noted the problem of oil pollution;
P9—the percentage of respondents who noted the problem of outdated treatment systems;
P10—the number of vehicles per unit area of the industrial zone;
P11—mineral fertilizers applied per unit area;
P12—the specific weight of arable land in the structure of farmland;
P13—density of cattle per unit of farmland;
P14—livestock waste relative to the area of the industrial zone;
P15—is the percentage of respondents who noted the problem of fertilizers and pesticides flowing from the fields.
K2 “Industrial zone ecosystem state”P16—caught harmful substances per person;
P17—disposed of harmful substances per person;
P18—emissions of pollutants into the atmosphere from stationary sources per person;
P19—emissions of air pollutants from vehicles per person;
P20—the share of respondents who noted the problem of exhaust gases from auto transport;
P21—is the proportion of respondents who indicated “wastewater entering rivers and lakes” as an environmental factor affecting health;
P22—the percentage of respondents satisfied with the quality of drinking water;
P23—discharge of pollutants with wastewater relative to the area of the industrial zone;
P24—the proportion of insufficiently treated wastewater;
P25—the proportion of wastewater without treatment;
P26—exceeding the maximum permissible concentration of pollutants in waters;
P27—soil quality;
P28—exceeding the maximum permissible concentration of exogenous chemicals in the soil;
P29—the average weighted content of heavy metal salts % in the total amount of the maximum permissible concentration;
P30—is the total indicator of chemical contamination of the soil.
K3 “Industrial zone life quality”P31—is the average life expectancy of the population in the industrial zone;
P32—natural increase (decrease) in relation to the population of the industrial zone;
P33—the level of morbidity of the population in the industrial zone per population;
P34—neoplasms per population;
P35—diseases of the blood, hematopoietic organs and individual disorders involving the immune mechanism, per population;
P36—diseases of the endocrine system, eating disorders and metabolic disorders per population;
P37—respiratory diseases per population;
P38—the percentage of respondents who noted the absence of chronic diseases in children;
P39—the percentage of respondents who noted their health status as “Good”, “Very good”;
P40—the proportion of respondents who noted being on “sick leave” 3 or more times a year;
P41—the proportion of respondents who noted the absence of chronic diseases in the adult population;
P42—the share of disabled people in the industrial zone;
P43—availability of sanatoriums per unit of population.
K4 “Restoration potential of industrial zone ecosystem” P44—forecast operational resources of fresh groundwater relative to the area of the industrial zone;
P45—creation of protective forest plantations to the total area of the industrial zone;
P46—the share of forest plantations in the total area of the industrial zone;
P47—current environmental protection costs relative to the area of the industrial zone;
P48—the cost of capital repairs of fixed assets for environmental protection relative to the area of the industrial zone.
Table 2. Matrix of criteria for environmental sustainability assessment of industrial zones (level of integration 1) with the allocation of criteria vectors.
Industrial zones (A1–A11)Environmental Sustainability Criterion (K1–K4)
Ecosystem Load (K1)Ecosystem State (K2)Life Quality (K3)Ecosystem Restoration Potential (K4)
Aznakaevskaya (A1)0.390.370.420.49
Almetyevskaya (A2)0.350.290.680.35
Bavlinskaya (A3)0.650.590.650.73
Bugulminskaya (A4)0.630.540.650.61
Yelabugskaya (A5)0.520.370.440.37
Zainskaya (A6)0.550.340.450.34
Leninogorskaya (A7)0.520.610.580.71
Mendeleevskaya (A8)0.410.380.320.31
Nignekamskaya (A9)0.320.270.490.27
Nurlatskaya (A10)0.610.650.610.62
Kazan (A11)0.510.640.410.42
Optimal valuesmaxmaxmaxmax
Criterion vectors0.65; 0.630.65; 0.640.68; 0.650.73; 0.71
The gray cells in the table contain criteria vectors.
Table 3. Additive global criterion value for ESKA environmental sustainability and industrial zones classification.
Industrial Zone NameIntegral Criterion Value ESKAValue Range ESKAIndustrial Zones Environmental Sustainability Classification
No representatives in this selection0.75 < ESKA < 1.0high environmental sustainability
Bavlinskaya (A3)0.6610.50 < ESKA < 0.75environmental sustainability above average
Nurlatskaya (A10)0.619
Bugulminskaya (A4)0.615
Leninogorskaya (A7)0.590
Kazan (A11)0.4920.25 < ESKA < 0.50environmental sustainability below average
Zainskaya (A6)0.451
Yelabugskaya (A5)0.448
Aznakayevskaya (A1)0.417
Almetyevskaya (A2)0.391
Mendeleevskaya (A8)0.367
Nignekamskaya (A9)0.326
No representatives in this selection0.0 < ESKA < 0.25low environmental sustainability
Table 4. Euclidean distances matrix between industrial zones when clustering objects by levels of environmental sustainability according to the criteria K1–K4.
A3A7A10A4A1A11A5A2A6A8A9
environmental sustainability above average
A30.000.150.140.130.480.420.490.570.510.620.67
A70.150.000.140.180.390.340.440.520.480.540.60
A100.140.140.000.120.420.300.420.520.450.540.60
A40.130.180.120.000.390.340.380.460.400.520.56
environmental sustainability below average
A10.480.390.420.390.000.300.180.310.220.210.26
A110.420.340.300.340.300.000.280.480.320.310.45
A50.490.440.420.380.180.280.000.310.050.170.25
A20.570.520.520.460.310.480.310.000.310.380.21
A60.510.480.450.400.220.320.050.310.000.200.25
A80.620.540.540.520.210.310.170.380.200.000.23
A90.670.600.600.560.260.450.250.210.250.230.00
Publisher’s Note: MDPI stays neutral with regard to jurisdictional claims in published maps and institutional affiliations.

