1. Introduction
After the excavation of roadway, the initial stress in the surrounding rock mass is redistributed. When the stress is greater than the strength of the surrounding rock, the rock mass will be damaged. Then, a ringlike broken zone can be formed around the excavated space; this is called the excavation damaged zone (EDZ) [
1,
2]. The thickness of the EDZ can not only be used to judge the stability of the roadway, but can also be adopted in the support design [
3,
4,
5]. In addition, due to the weakening in the rock strength, an EDZ can also be utilized for nonexplosive continuous mining in deep hard-rock mines [
6]. Therefore, predicting the thickness of the EDZ around a roadway is significant.
Since the concept of the EDZ was proposed, many scholars have conducted plenty of research to determine its size or thickness. These methods can be mainly summarized as the onsite measurement technique, the numerical simulation method, the empirical formula, and the machine-learning (ML) algorithm. Among them, the onsite measurement technique is the most direct method to determine the thickness of an EDZ, and includes digital panoramic drilling camera technology [
7], ground-penetrating radar [
8], ultrasonic detection technology [
9], the borehole imaging method [
10], the complex resistivity method [
11], and microseismic monitoring [
12,
13]. Although the results of these measurements are accurate, the operation is complicated and vulnerable to the site conditions. With the rapid development of rock mechanics and computers, numerical-simulation methods became popular to determine the thickness of an EDZ. Liu et al. [
14] used the ANSYS software to analyze the influencing factors and distribution law of an EDZ around a rectangular roadway. Sun et al. [
15] studied the formation mechanism of a butterfly-shaped EDZ by combining the force and elastic wave theory, and then used Midas/GTS-FLAC3D simulation technology to determine the range of the EDZ. Perras et al. [
16] used the finite element method in the Phase2 software to determine the thickness of an EDZ. Wan et al. [
17] used 3DEC to determine the thickness of an EDZ, and the simulation results were consistent with the measured values. Although a numerical simulation is low-cost and convenient to operate, many assumptions exist in the simulation process that lead to idealized results and affect the accuracy. According to field-engineering experience and theoretical analysis, some empirical formulas were proposed to calculate the thickness of an EDZ. Yan [
18] proposed an empirical formula for the thickness prediction of an EDZ based on the wave velocity of the rock and rock mass. Wang [
19] combined the elastoplastic theory and measured data to determine the range of the EDZ in the Chazhen Tunnel. Chen et al. [
20] deduced the radius of an EDZ based on the Hoek–Brown criterion and elastoplastic solution of a circular hole. Based on similar simulation tests and field experience, Dong [
4] proposed a relationship between the stress and the rock strength to calculate the thickness of an EDZ. Zhao [
21] derived the quantitative relationship between the thickness of an EDZ and its influencing factors based on a dimensional-analysis method. In addition, the zonal disintegration phenomenon, which indicates the alternation of fractured and intact zones, appears in deep roadways. Shemyakin [
22] proposed the concept of zonal disintegration and deduced the empirical formula for the thickness of the discontinuous zone. After Myasnikov [
23] proposed a non-Euclidean continuum model to describe the stress-field distribution, some scholars [
24,
25,
26] used that non-Euclidean model to investigate the zonal disintegration phenomenon in a surrounding rock mass, and obtained the corresponding formulas. Although an empirical formula is easy to understand, it ignores the effects of joints and mining. Currently, there is no universally accepted empirical formula for predicting the thickness of an EDZ.
Considering ML can well deal with nonlinear and complex problems [
27,
28], it shows great potential to predict the thickness of an EDZ. Asadi et al. [
29] used artificial neural networks in the thickness prediction of an EDZ. Zhou [
30] verified that the support vector machine (SVM) could reliably estimate the range of an EDZ. In addition, some scholars adopted intelligent optimization techniques to improve traditional ML algorithms for the determination of an EDZ’s thickness. For example, Hu [
31] used a layered fish school to improve the SVM; Ma [
32] combined the particle-swarm algorithm (PSO) and the least-squares support vector machine; Yu [
33] integrated PSO and a Gaussian process model; and Liu [
34] employed the wavelet-relevance vector machine. In addition, ML is being increasingly used in other civil engineering fields, and achieves an excellent prediction performance [
35,
36,
37]. For example, Mangalathu et al. [
38] used ML to classify the building damage caused by earthquakes; Ruggieri et al. [
39] adopted ML to analyze the vulnerability of existing buildings. ML can not only obtain reliable prediction results, but can also save time and economic costs. However, numerous EDZ cases are needed to improve its credibility.
After comparing it with other types of approaches, the ML method was preferentially chosen to predict the thickness of an EDZ. An important reason is that it has strong self-learning and adaptive capabilities based on big data and can find implicit relationships between indicators. Nevertheless, it is essential to determine the favorable parameters of ML, because they directly affect its predictive performance [
40]. The sparrow search algorithm (SSA) proposed by Xue [
41] in 2020 is an efficient swarm-intelligence optimization algorithm. Compared with other optimization algorithms, the SSA has a higher search efficiency and a simpler operation. SSA considers all possible situations of a sparrow population, so that the sparrows in the population are close to the global optimal value, and converge [
42]. At the same time, SSA has a high convergence speed, a good stability, a strong global search ability, and few parameters. In addition, backpropagation neural network (BPNN), Elman neural network (ENN), and support vector regression (SVR) models have shown extraordinary capabilities in solving prediction problems, and have been widely used in various engineering fields [
43,
44,
45]. Therefore, using SSA to optimize the parameters of BPNN, ENN, and SVR models is more competitive.
The goal of this study was to use SSA-BPNN, SSA-ENN, and SSA-SVR models to predict the thickness of an EDZ. Firstly, an EDZ database including 209 cases was established. Secondly, SSA-BPNN, SSA-ENN, and SSA-SVR models were proposed for the thickness prediction of an EDZ. Thirdly, seven indexes were used to evaluate the performance of each model. Finally, all models were compared and analyzed, and the best model was determined.
2. Data Collection
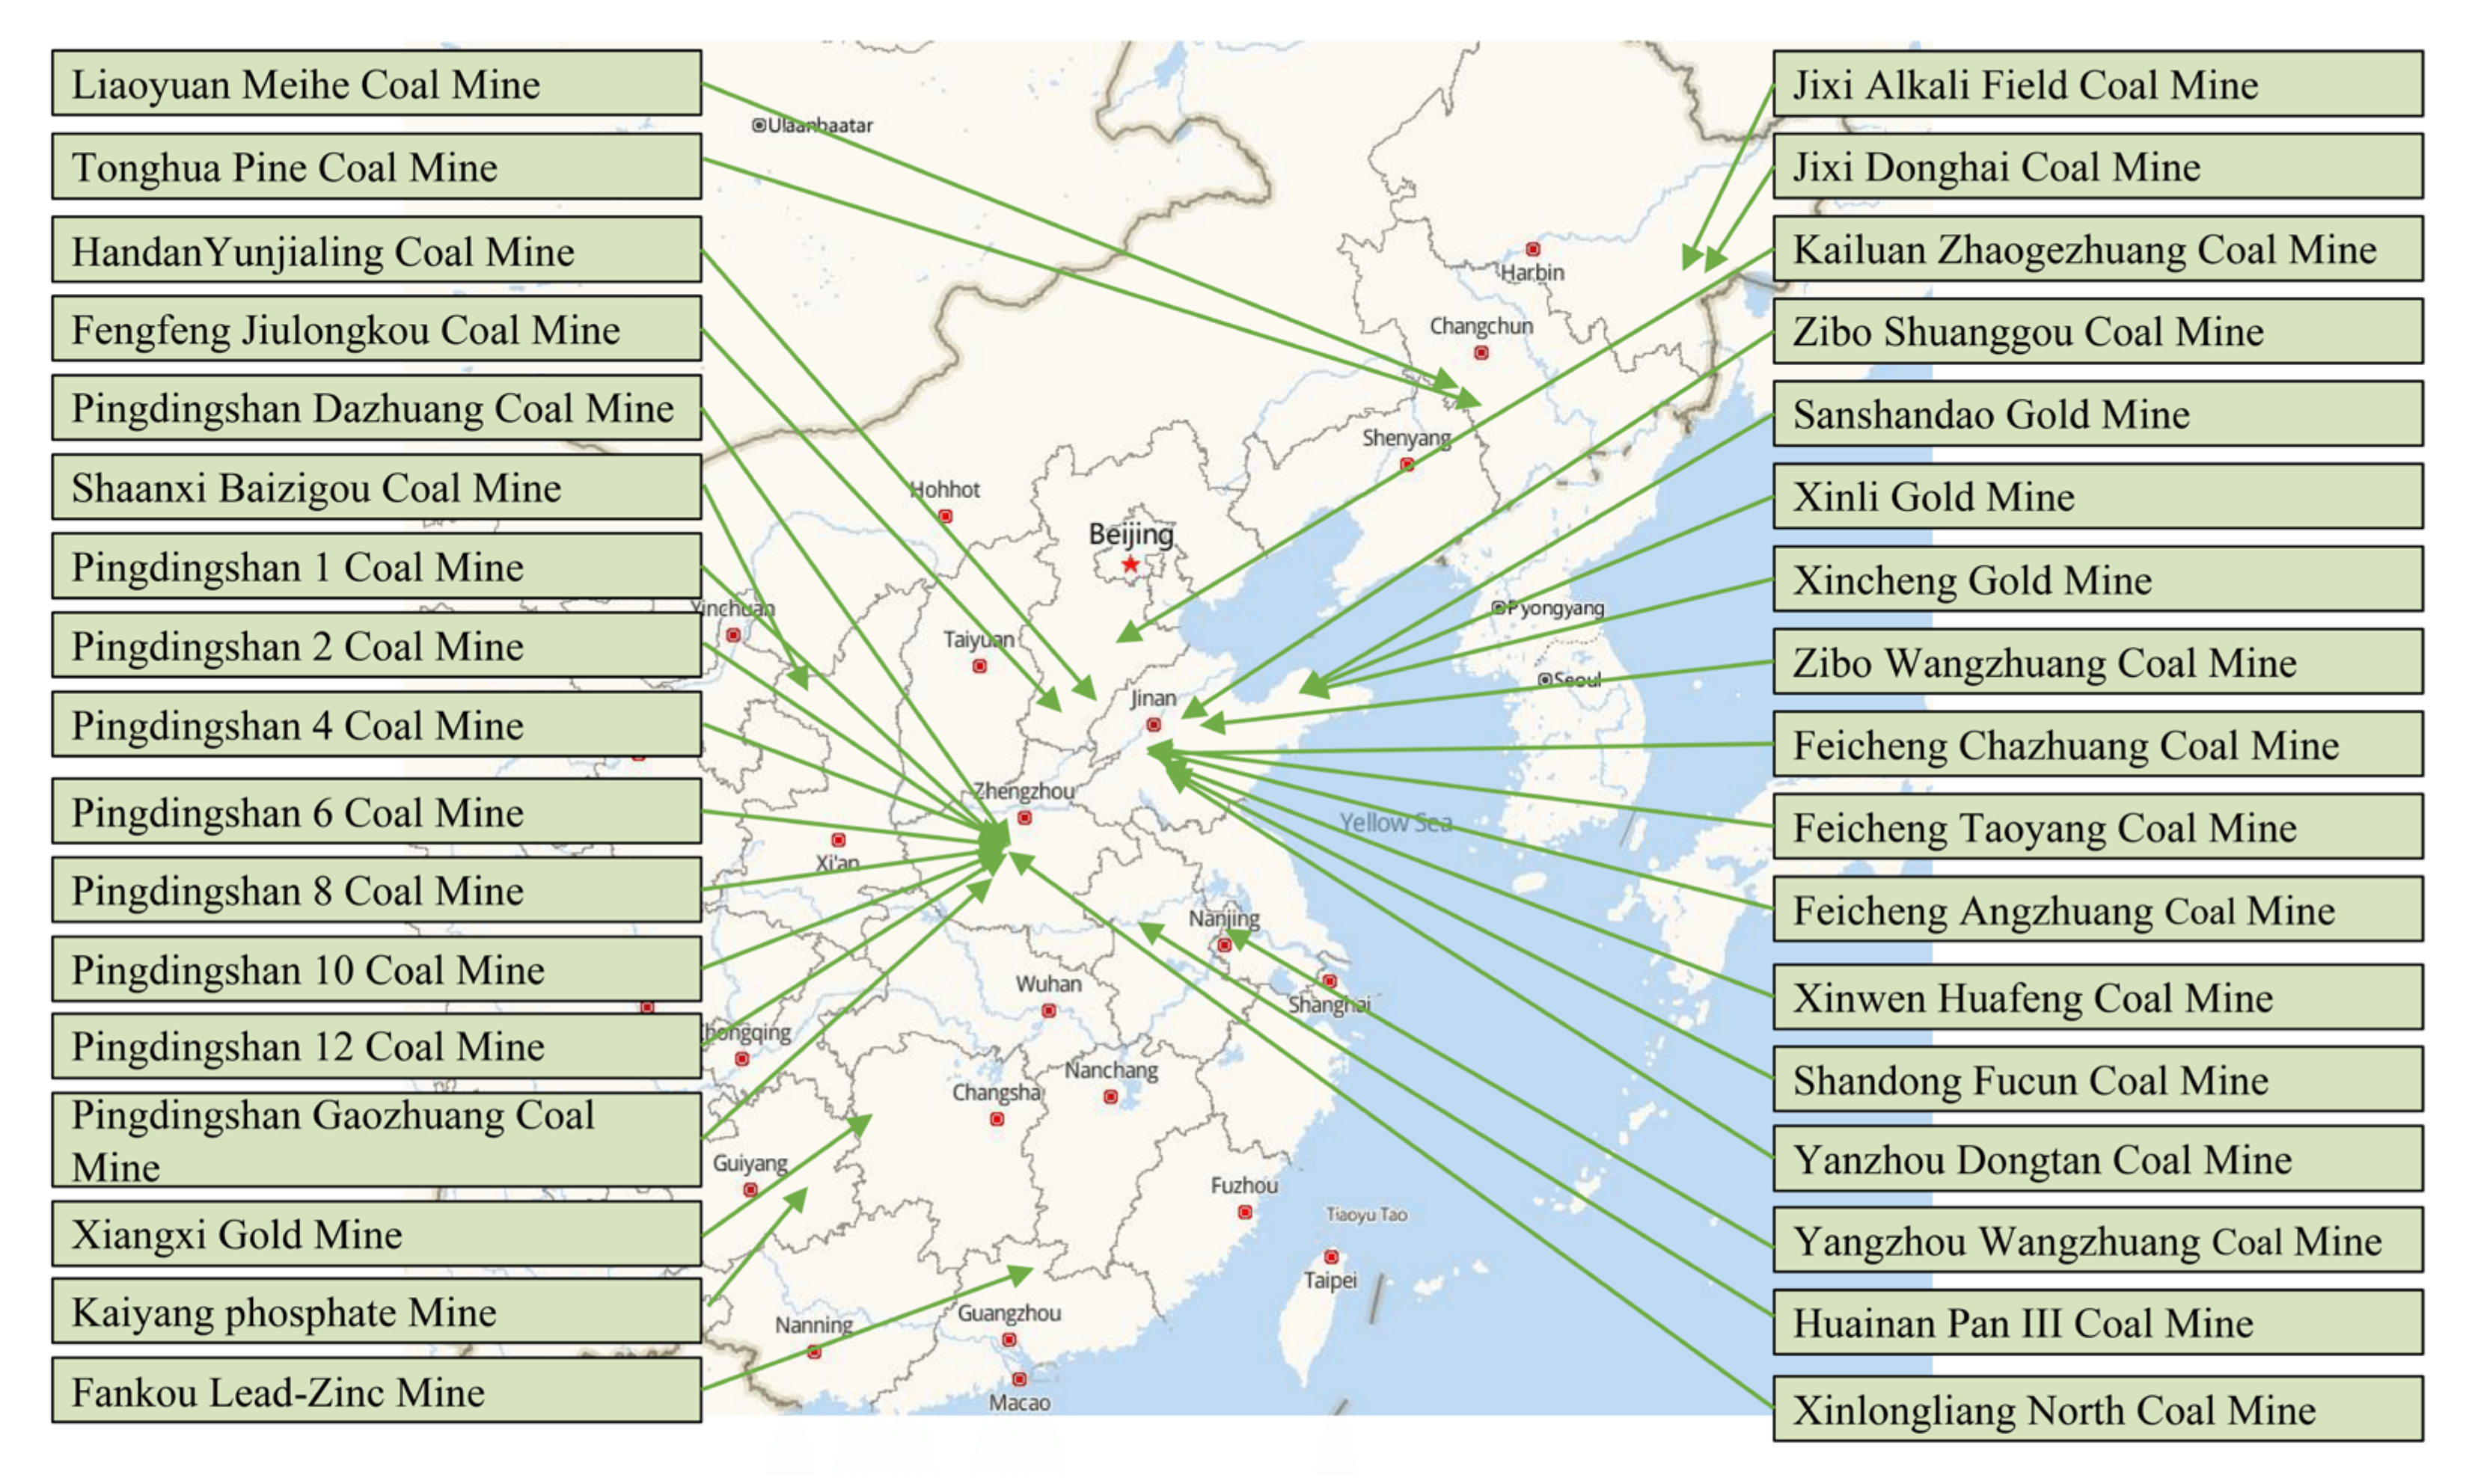
To establish a reliable predictive model, a total of 209 cases from 34 mines were collected [
46,
47,
48,
49,
50]. The locations of these mines are shown in
Figure 1. It can be seen that the types of these mines were different, and included coal mines, gold mines, phosphate mines, and lead–zinc mines. In addition, these mines were in different regions, which indicated that the collected dataset was complex to some extent.
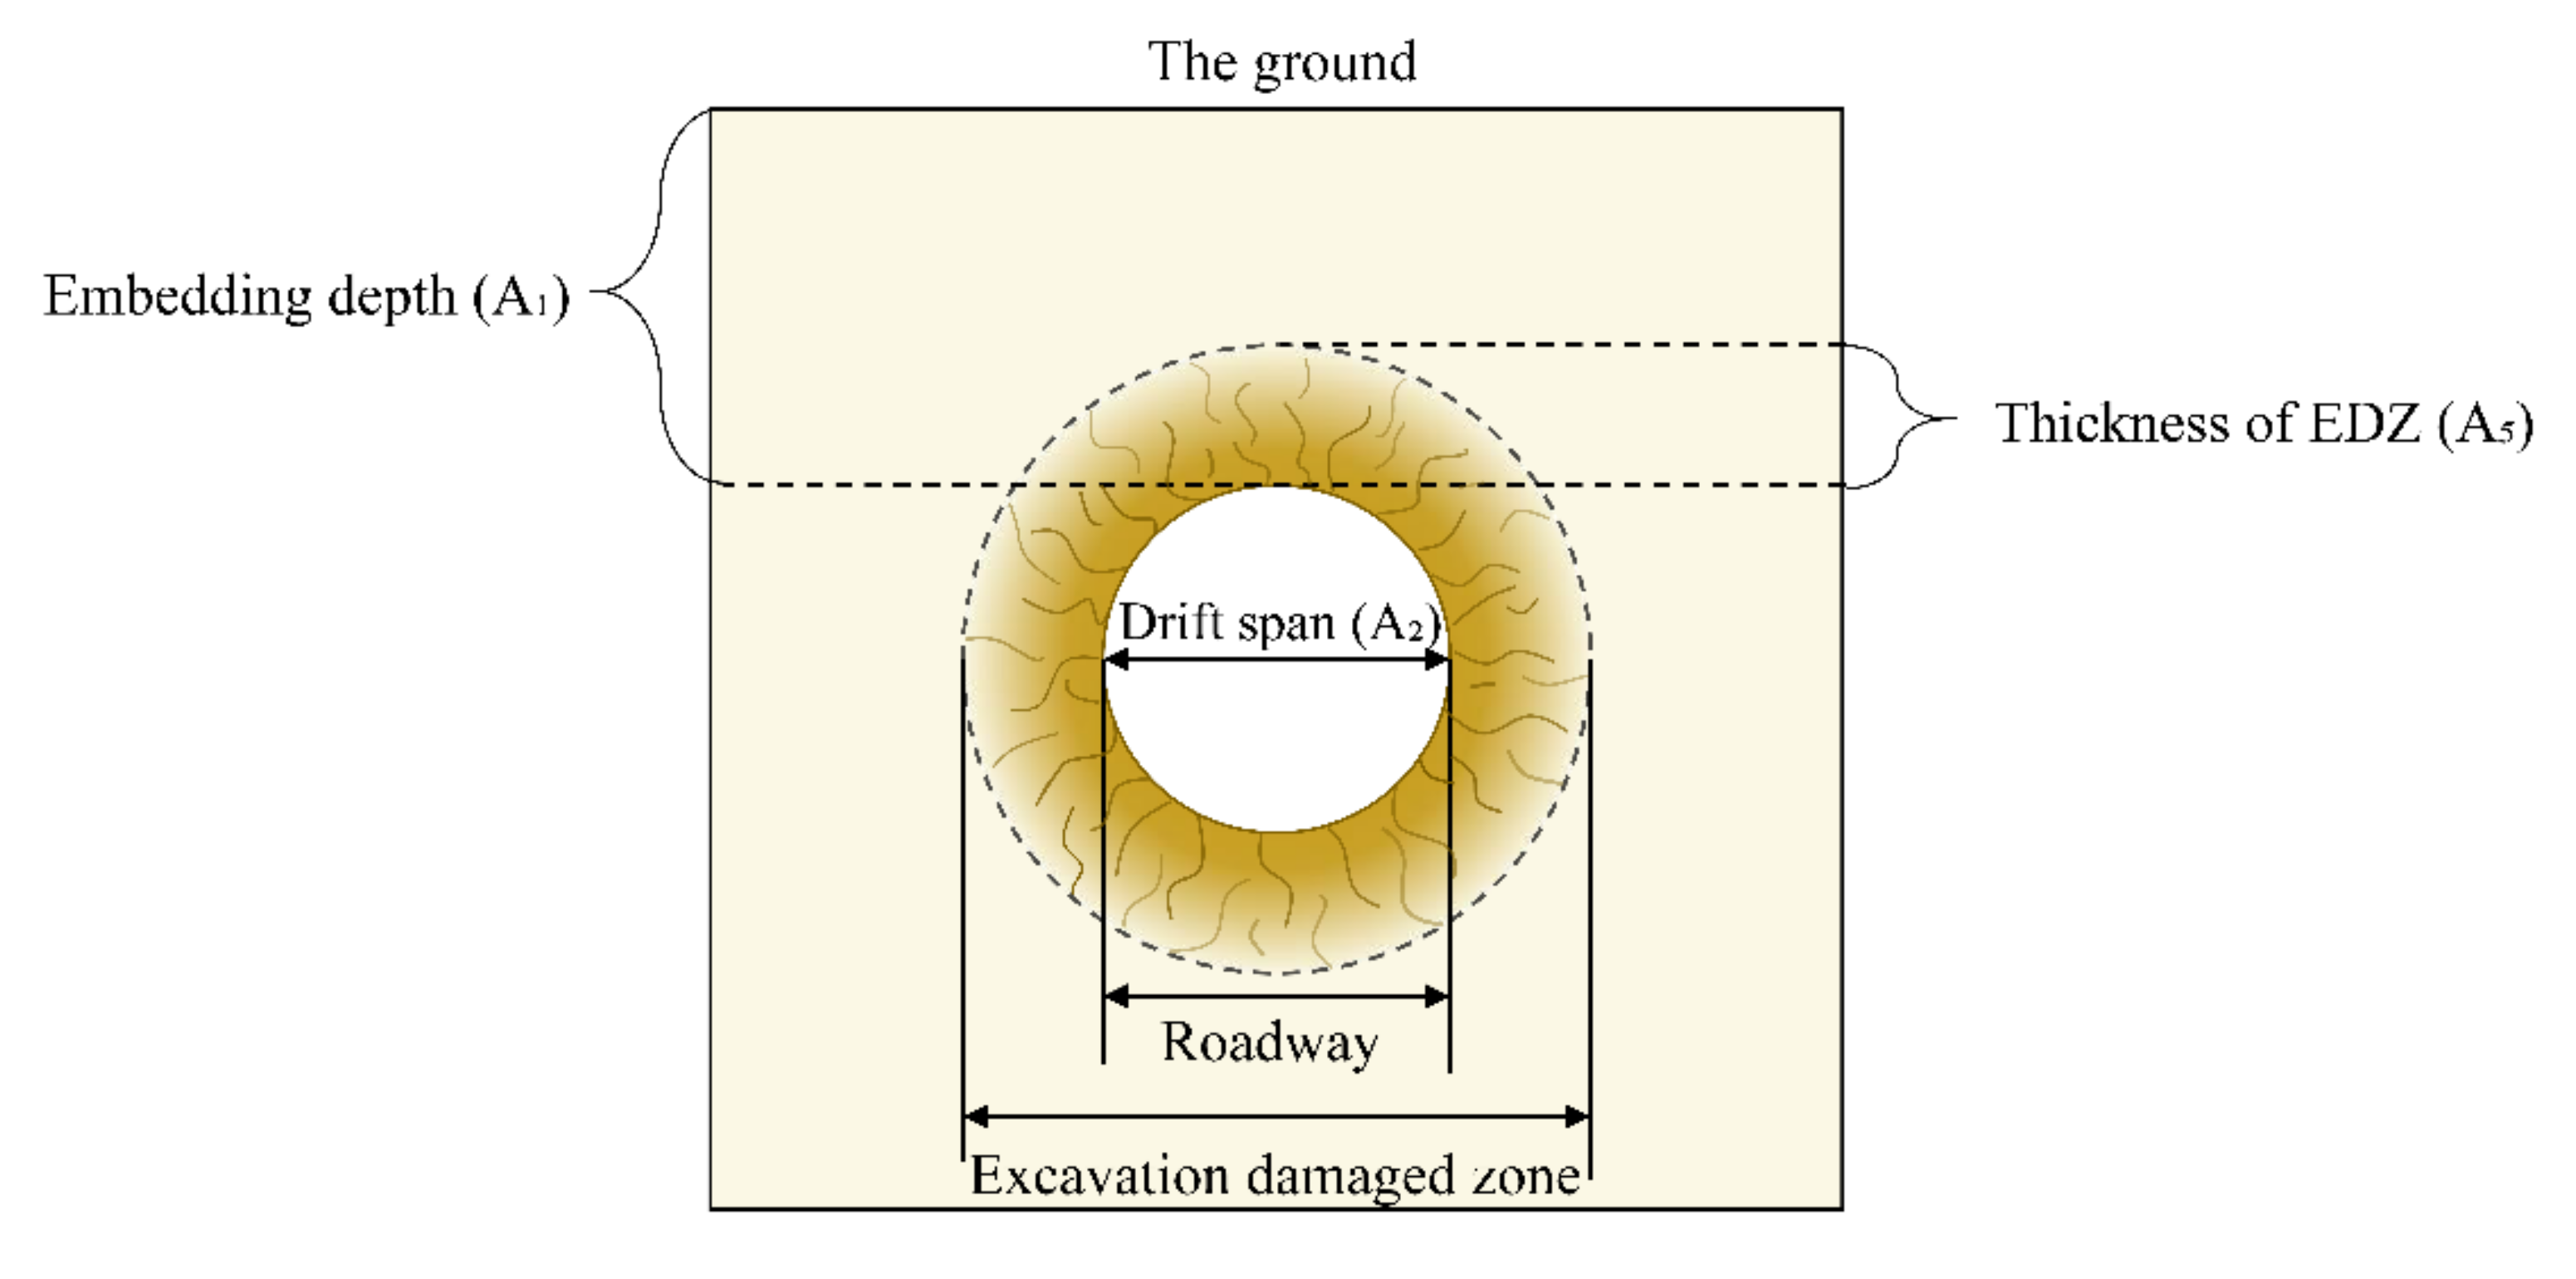
The dataset statistics of each indicator are shown in
Table 1, where
indicates the embedding depth,
indicates the drift span,
indicates the surrounding rock strength,
indicates the joint index, and
indicates the EDZ thickness. The complete data can be found in
Appendix A Table A1. It should be noted that EDZ indicates the ruptured zone around the roadway, but not the zonal disintegration. For a better understanding, the structure of an EDZ and some indicators are illustrated in
Figure 2. The meaning of these indicators is indicated in
Table 2.
Each sample contained four indicators and the thickness of the EDZ. The thickness of an EDZ is affected by many factors, such as the strength of surrounding rock mass, in situ stress, size and shape of the roadway, excavation method, time effect, and other environmental factors. First of all, the strength of the surrounding rock mass reflects the ability of the rock mass to resist damage, and is inversely proportional to the thickness of EDZ. Therefore, the indicators and were selected. Second, considering that the thickness of an EDZ is proportional to the in situ stress around the roadway, the indicator was chosen. Third, because different roadway sizes have diverse influences on an EDZ, was used as an indicator. Fourth, since the thickness of the EDZ used in this study was a stable value, the time effect could be ignored. When considering the influence of other factors, such as temperature, groundwater, and excavation method, they were deemed too complicated to quantify, and were not considered in this study.
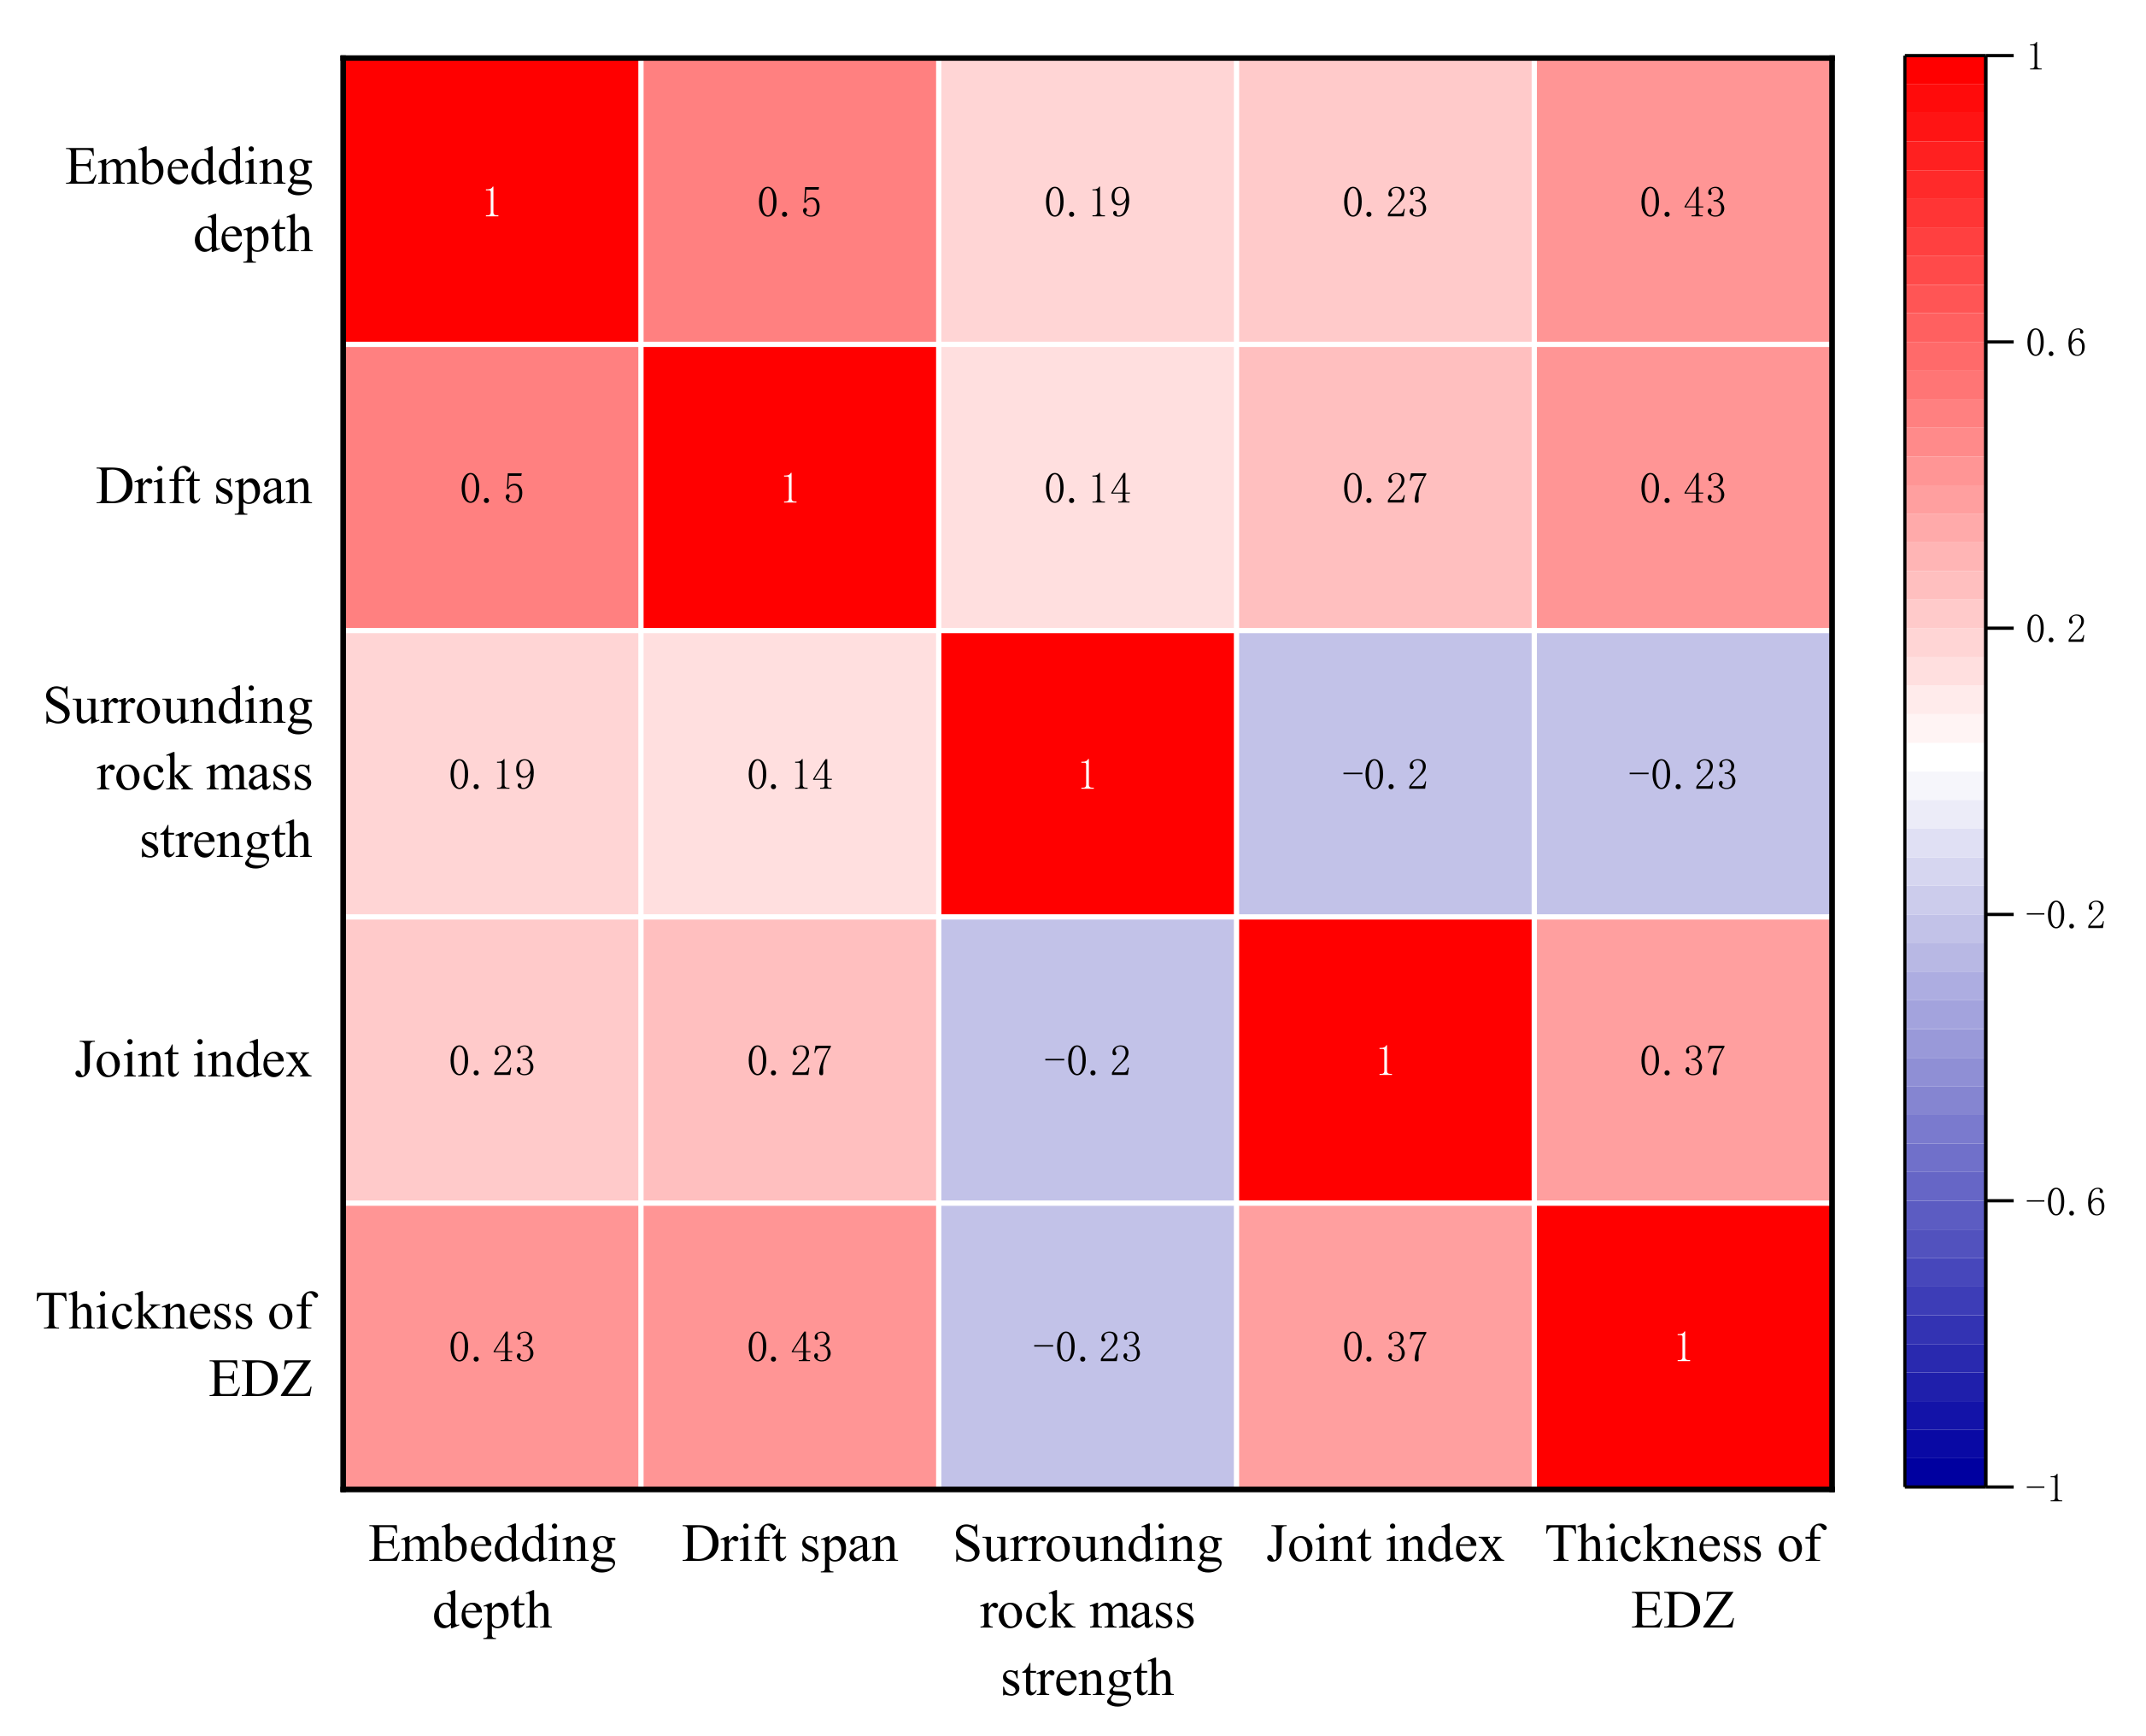
To quantitatively describe the correlation between indicators and the thickness of an EDZ, the Pearson correlation coefficient was calculated, as shown in
Figure 3. In this figure, red represents a positive correlation, blue represents a negative correlation, and the depth of color indicates the strength of correlation. It can be seen that the thickness of an EDZ and these four indicators had different correlation degrees, which showed that these indicators were relatively independent. Therefore, these four indicators were used as the input variables.
The advantages of these selected indicators can be summarized as: (1) they could reflect the main factors affecting the formation of an EDZ; (2) their values were easy to obtain; and (3) the information described by these indicators was independent.
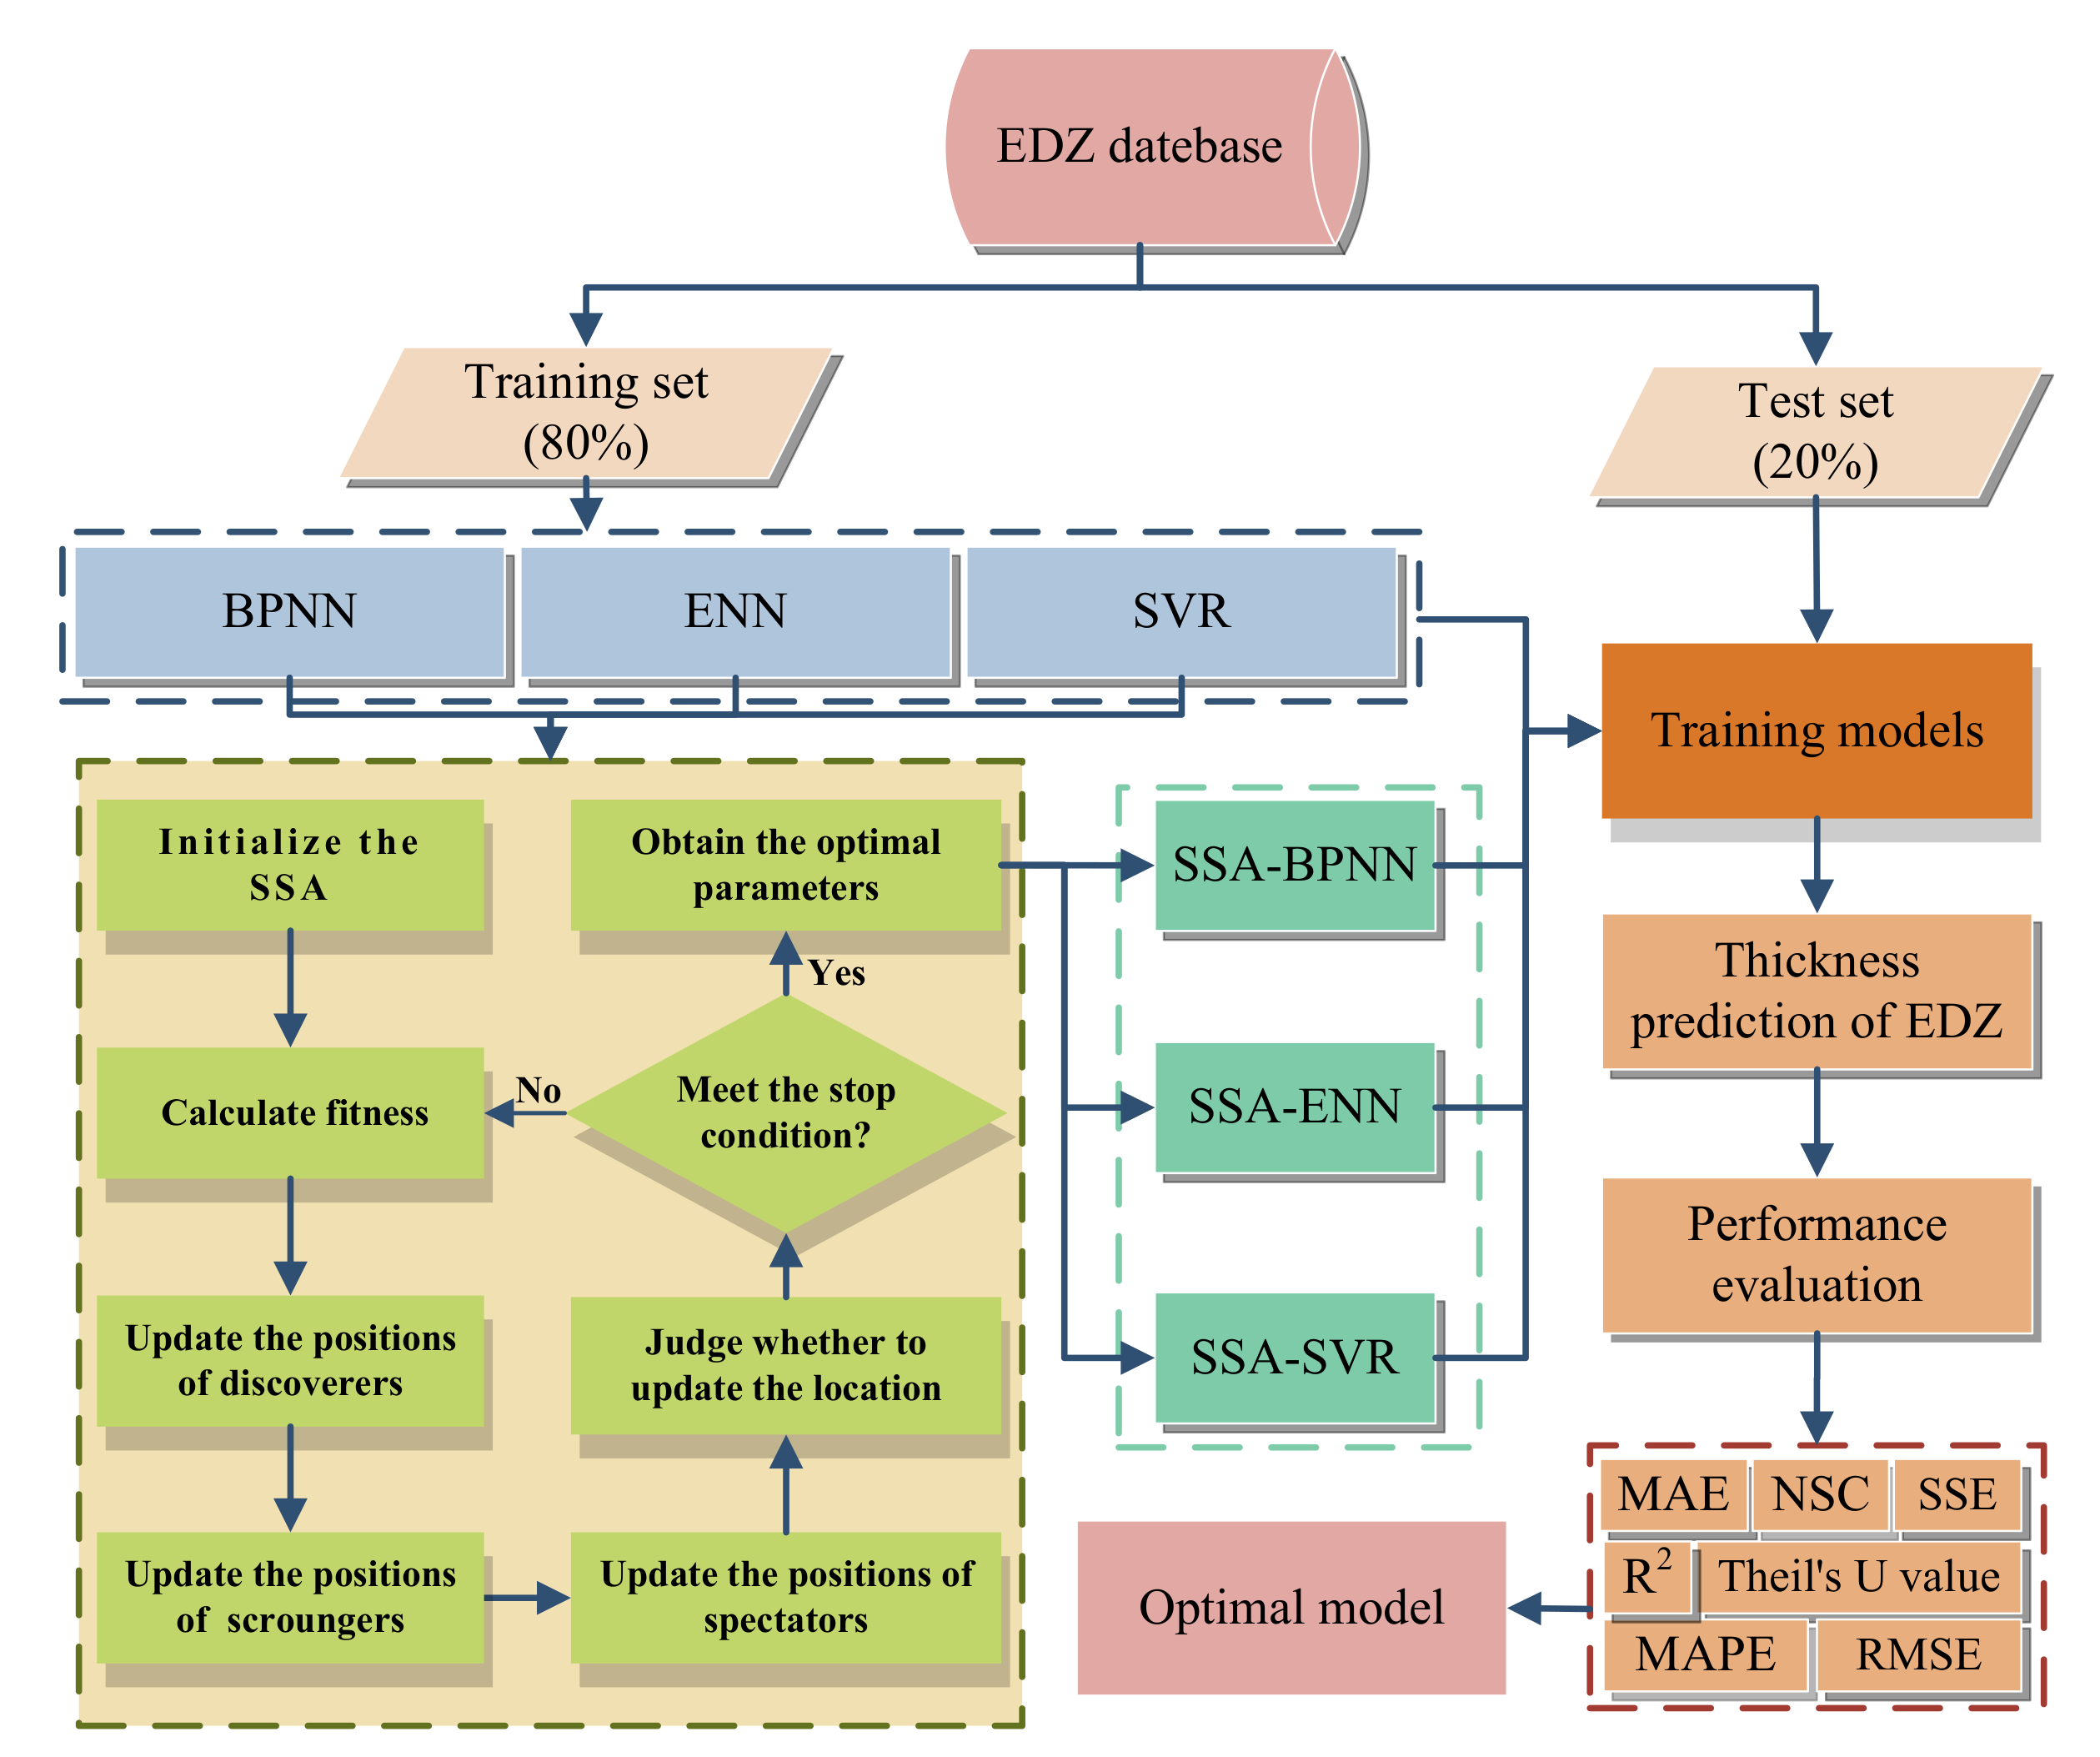
3. Methodology
The structure of the proposed methodology is shown in
Figure 4. Firstly, the original data were randomly divided into a training set (80%) and test set (20%). Secondly, the SSA was used to optimize the parameters of the BPNN, ENN and SVR models. Thirdly, the training set was adopted to train the optimized model. Fourthly, the test set was employed to analyze the accuracy of each model, and seven indexes, including the mean absolute error (MAE), coefficient of determination (R
2), Nash–Sutcliffe efficiency coefficient (NSC), mean absolute percentage error (MAPE), Theil’s U value, root-mean-square error (RMSE), and the sum of squares error (SSE), were used to evaluate each model’s performance. Finally, the optimal model was determined based on their comprehensive performance. The whole process was implemented in the MATLAB software. This section introduces the principles of the different models and the performance-evaluation indexes in detail.
3.1. Sparrow Search Algorithm (SSA)
Xue [
41] proposed the SSA, which was inspired by the behavior strategy of a sparrow population. It solves the global optimization problems by simulating the behavior characteristics of sparrows, and provides a new approach to solving practical problems with a large number of local optimal values. SSA has a faster solution speed, a better stability, and convergence accuracy. In addition, because randomness is introduced in the search process, it can avoid falling into local solutions, and solve global optimization problems more effectively [
51,
52,
53].
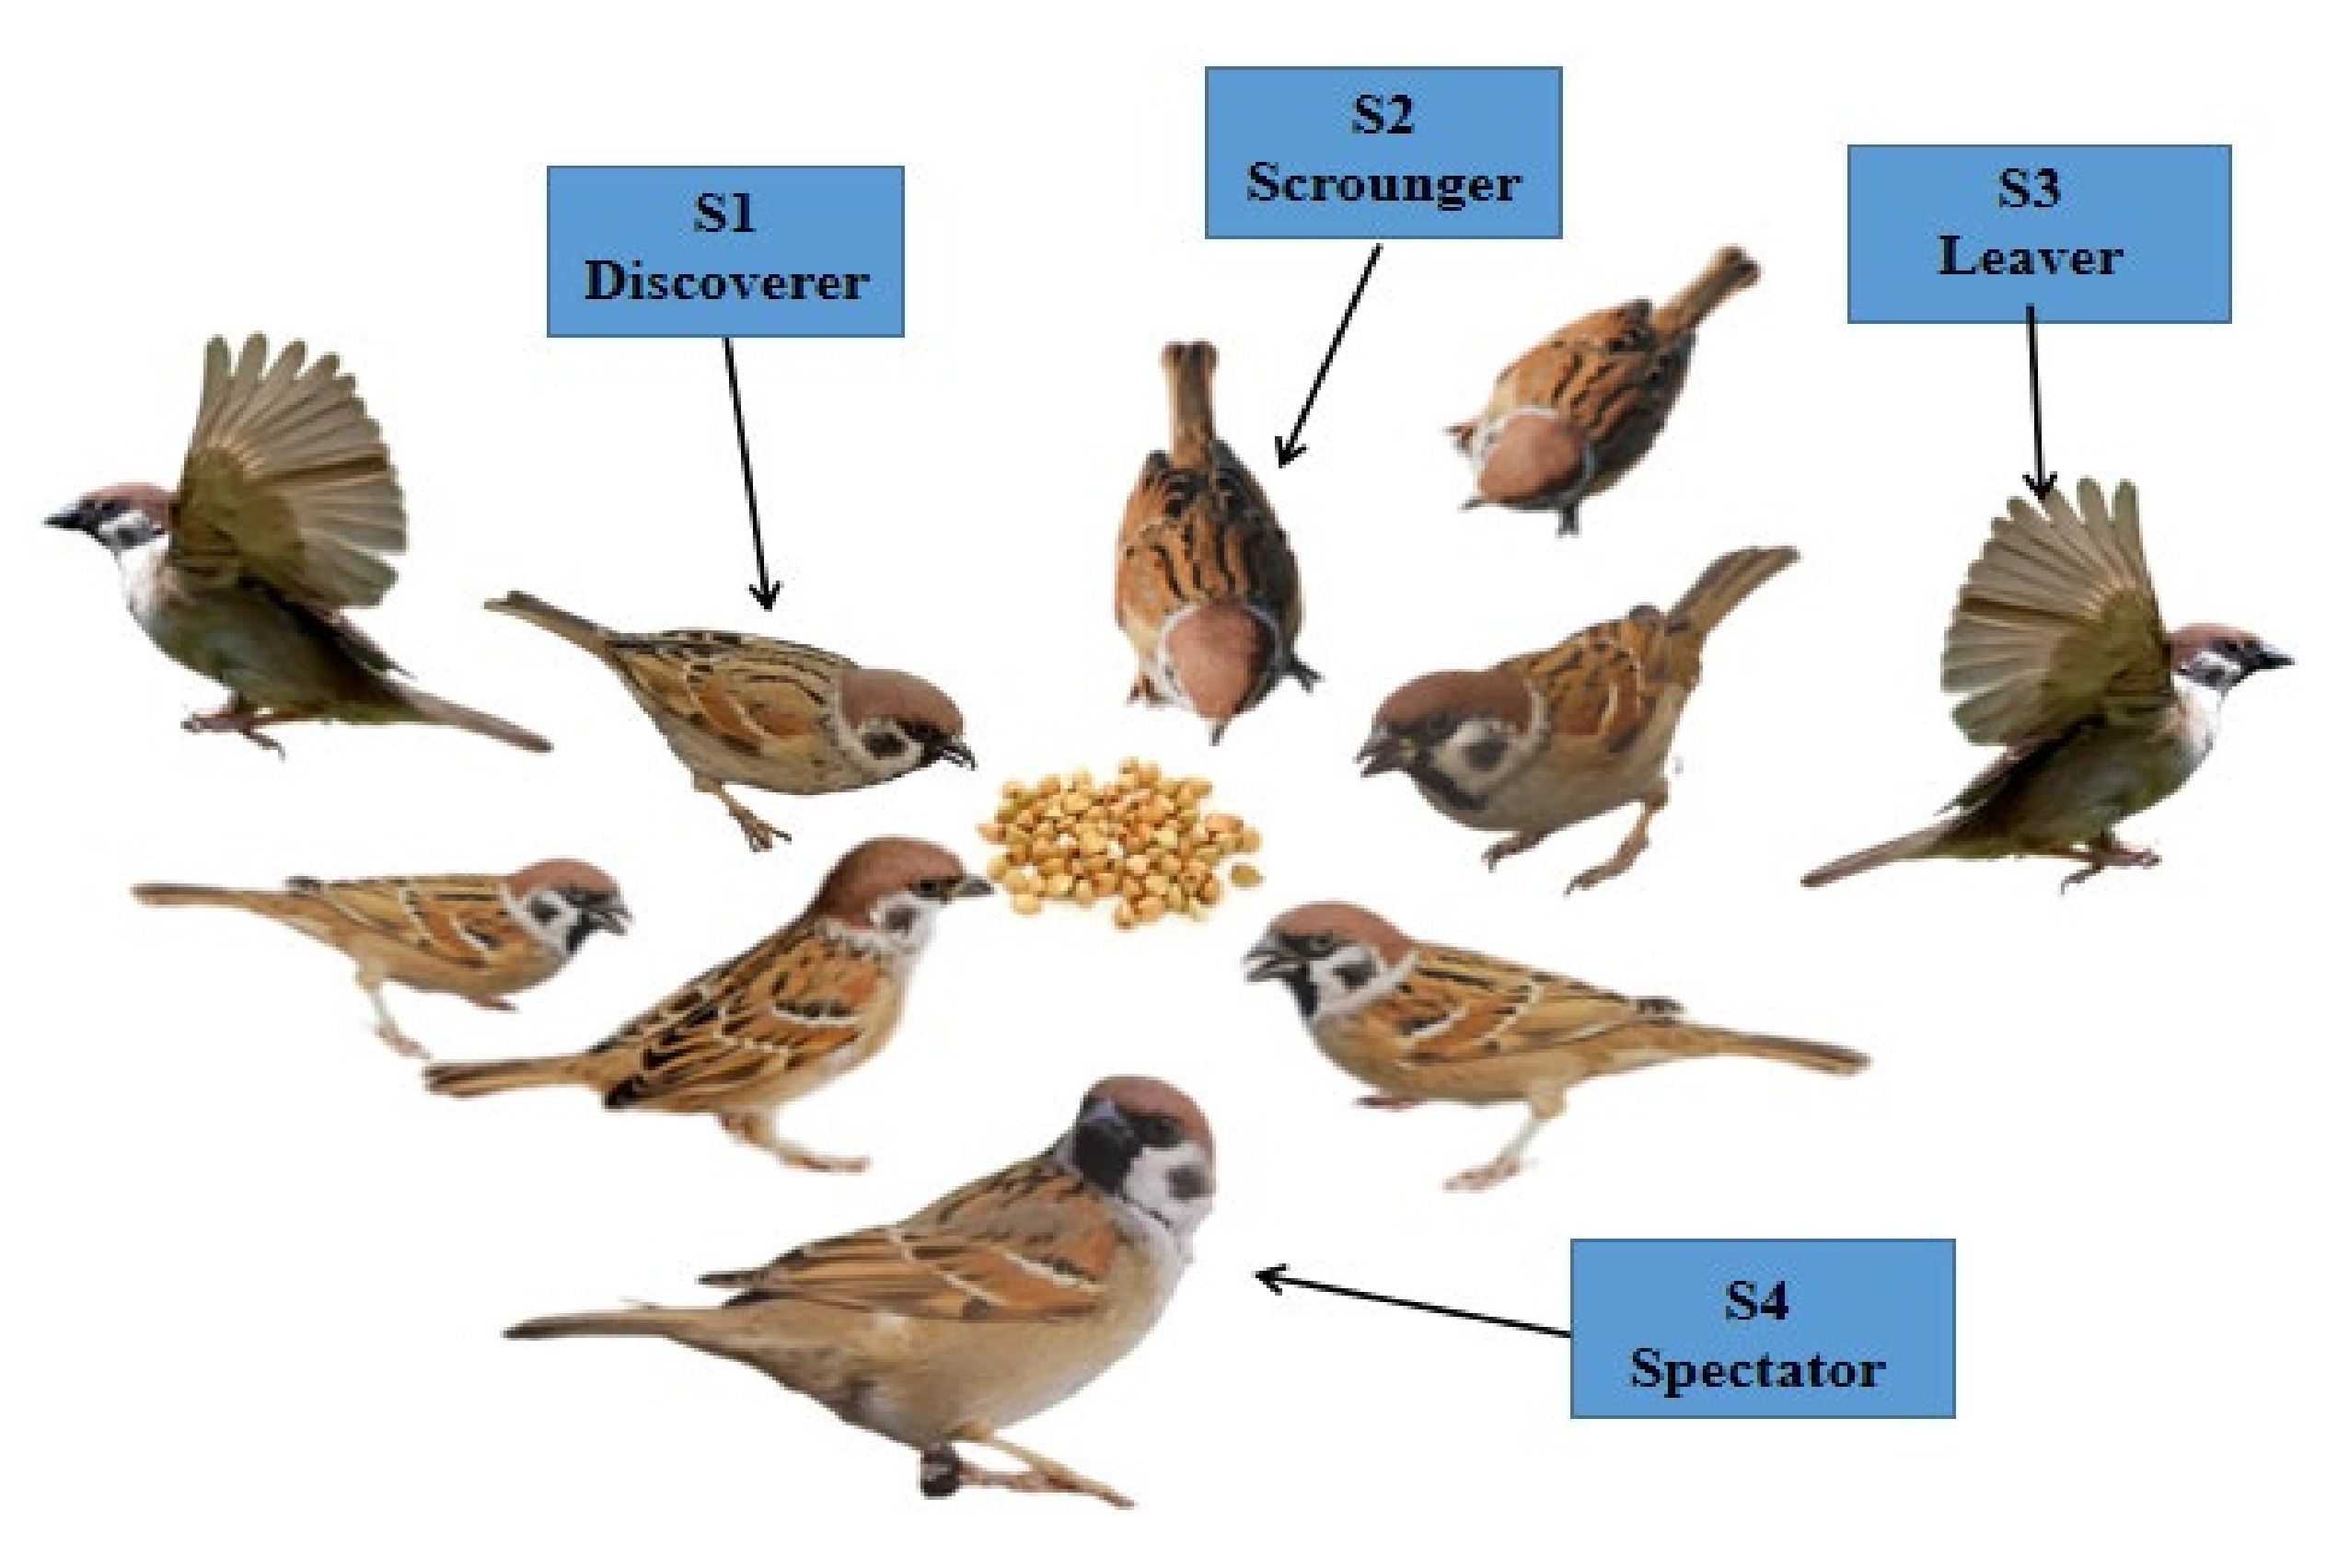
According to the original foraging principle of sparrow populations, a discoverer–scrounger model was established [
54]. The interrelationships between individuals in the sparrow population are shown in
Figure 5. Generally, the discoverer S1 is responsible for finding food and safe areas, while the scrounger S2 tracks the location of S1 to obtain food, and their roles are constantly changing [
55,
56]. S3 represents the sparrow at the edge of feeding area. It may leave the location and find another place because it is in the most dangerous position. S4 is responsible for detecting the safety of surrounding environment, and other sparrows also pay attention to S4 while eating.
During the foraging and eating process of sparrow groups, individuals monitor each other while constantly observing changes in the surrounding environment [
57,
58]. If S4 sends a hazard signal to the population, the entire group will scatter away immediately. In addition, sparrows at the edge of community are more likely to be attacked by natural enemies than those at the center, so they will spontaneously and constantly adjust their positions to ensure safety.
According to the above idea, the SSA model can be established. Assuming that the sparrow population is in the space of
, it can be defined by:
where
x is the position of sparrows,
D indicates the spatial dimension, and
N represents the number of total sparrows.
The fitness value indicates the energy reserve, which is defined as:
Generally, the discoverer S1 has a larger foraging range than the scrounger S2, and updates its position constantly. The update process can be calculated as:
where
denotes the current number of iterations;
refers to the maximum number of iterations;
is a random number of
;
is the warning threshold, and
;
indicates the safety value, and
;
represents a random number that follows the normal distribution;
shows a
matrix in which each element is 1; and
signifies the position of a sparrow.
When , it indicates the current foraging area is safe, and the sparrows can continue to eat, so the foraging range can be expanded. When , the spectators find the predator and immediately issue an alarm signal, then all sparrows will scatter away immediately.
The location of scroungers S2 is also updated accordingly because the central location is more secure. The update equation is indicated as:
where
represents the global worst position;
is the best position occupied by the discoverer; and
represents a 1 × d matrix in which the elements are randomly assigned to be 1 or −1, and
.
When , it means that the scrounger with a poor fitness value is hungry, and should fly in other directions to find food.
The spectators S4 generally account for 10% to 20% of the population. When danger approaches, they will scatter away and move to a new location. The position-update equation is:
where
represents the global safest position;
and
are both control parameters of step length, while
is a random number that follows the normal distribution with a mean value of 0 and variance of 1, and
represents the direction of sparrow movement;
,
, and
respectively represent the current fitness value of a sparrow, the global optimal value, and the global worst value; and
e is a constant to prevent the denominator from being 0.
When , it means the sparrow is at the edge of the population and is vulnerable to predators. When , it indicates the sparrow in the middle of the population is aware of the danger and needs to be close to other sparrows to reduce the probability of being preyed upon.
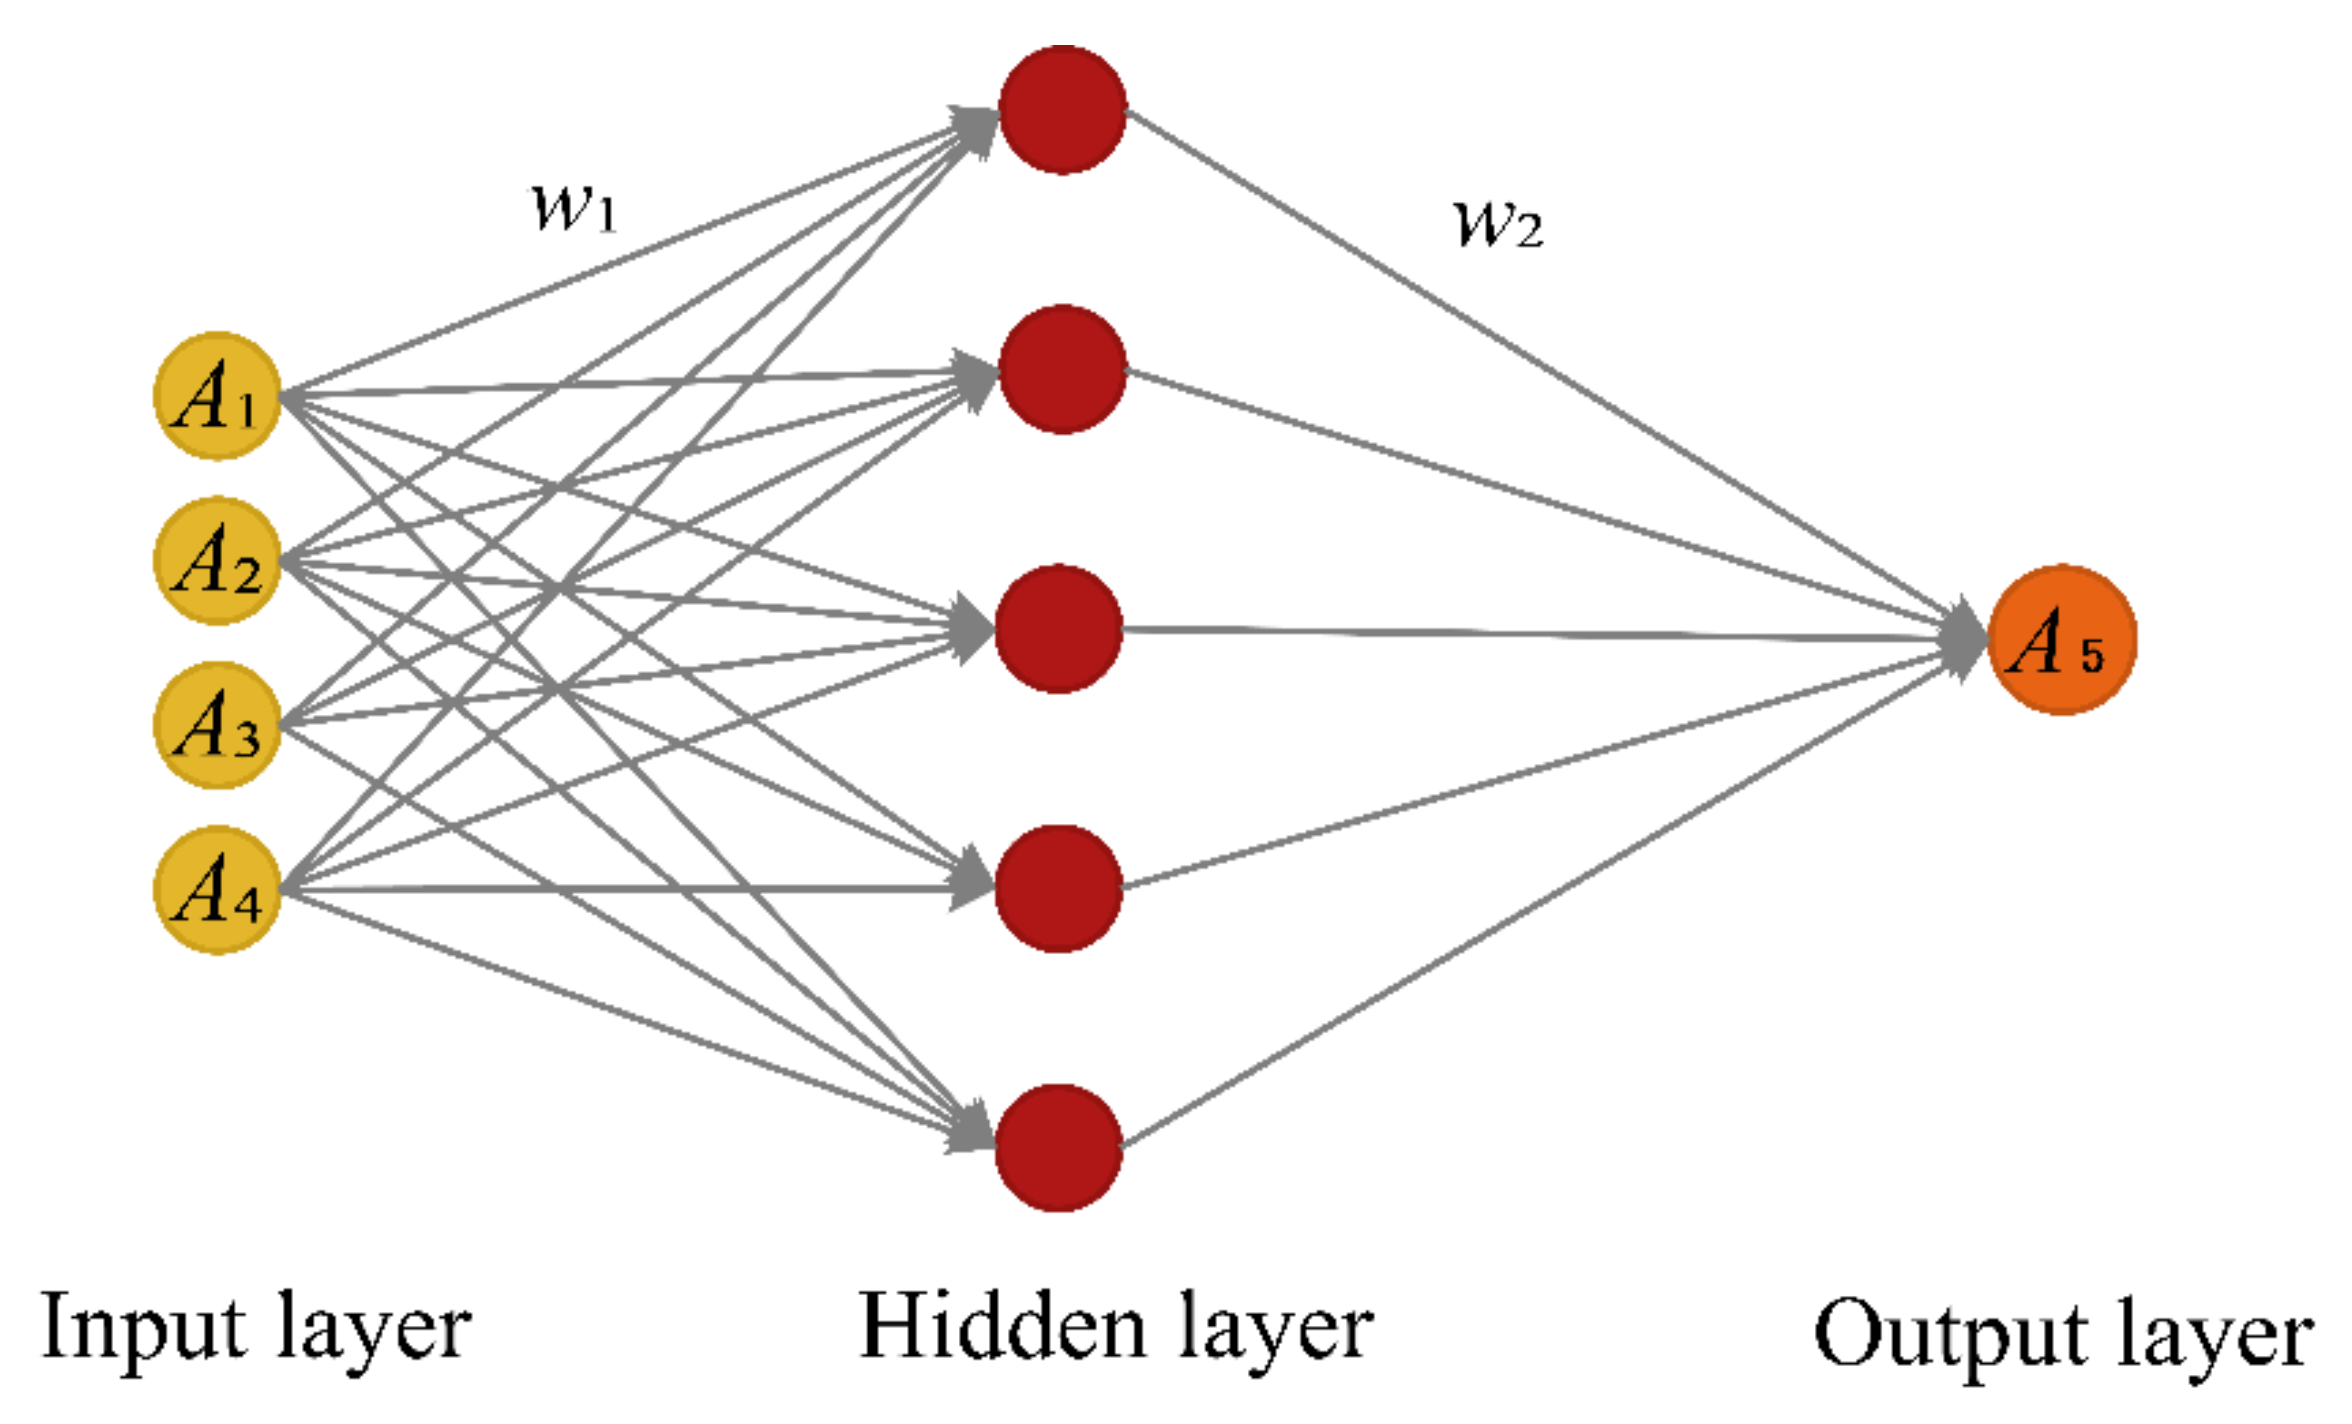
3.2. Sparrow Search Algorithm–Back Propagation Neural Network (SSA-BPNN) Model
The calculation process of a BPNN is similar to nonlinear mapping, which uses multiple neurons to form a multilayer feedback model. The characteristics of the data are obtained through the continuous iteration of the algorithm. BPNN has a high learning adaptability, and can predict unknown data based on a previously learned pattern [
59,
60,
61,
62,
63].
However, a BPNN has the defect of being easy to converge to a local minimum when fitting nonlinear functions. The SSA provides a new method to solve the parameter-optimization problem of a BPNN. In the SSA-BPNN model, the SSA reduces the error by continuously adjusting the weight and threshold of each layer, and improves the convergence speed.
The steps for an SSA to optimize a BPNN are as follows:
Step 1: The relevant parameters of the BPNN are initialized;
Step 2: The relevant parameters of the sparrow population are initialized, and the maximum number of iterations is defined;
Step 3: Based on the fitness values, the sparrows are sorted to generate initial population positions. The mean-square error (MSE) is selected as the fitness function;
Step 4: According to Equations (3)–(5), the positions of discoverer S1, scrounger S2, and spectator S4 are updated;
Step 5: The current updated position is obtained. If the new position is better than the old position from a previous iteration, the update operation is performed; otherwise, the iterative process continues until the condition is met. Finally, the best individual and fitness values are obtained;
Step 6: The global optimal individual is used as the weight of the BPNN, and the global optimal solution is adopted as the threshold of the BPNN;
Step 7: When the number of iterations is reached or the error is met, the calculation process stops; otherwise, the program re-executes beginning at step 3.
3.3. Sparrow Search Algorithm–Elman Neural Network (SSA-ENN) Model
An ENN is a dynamic recurrent neural network that adds local memory units on the basis of a traditional feedforward network [
64,
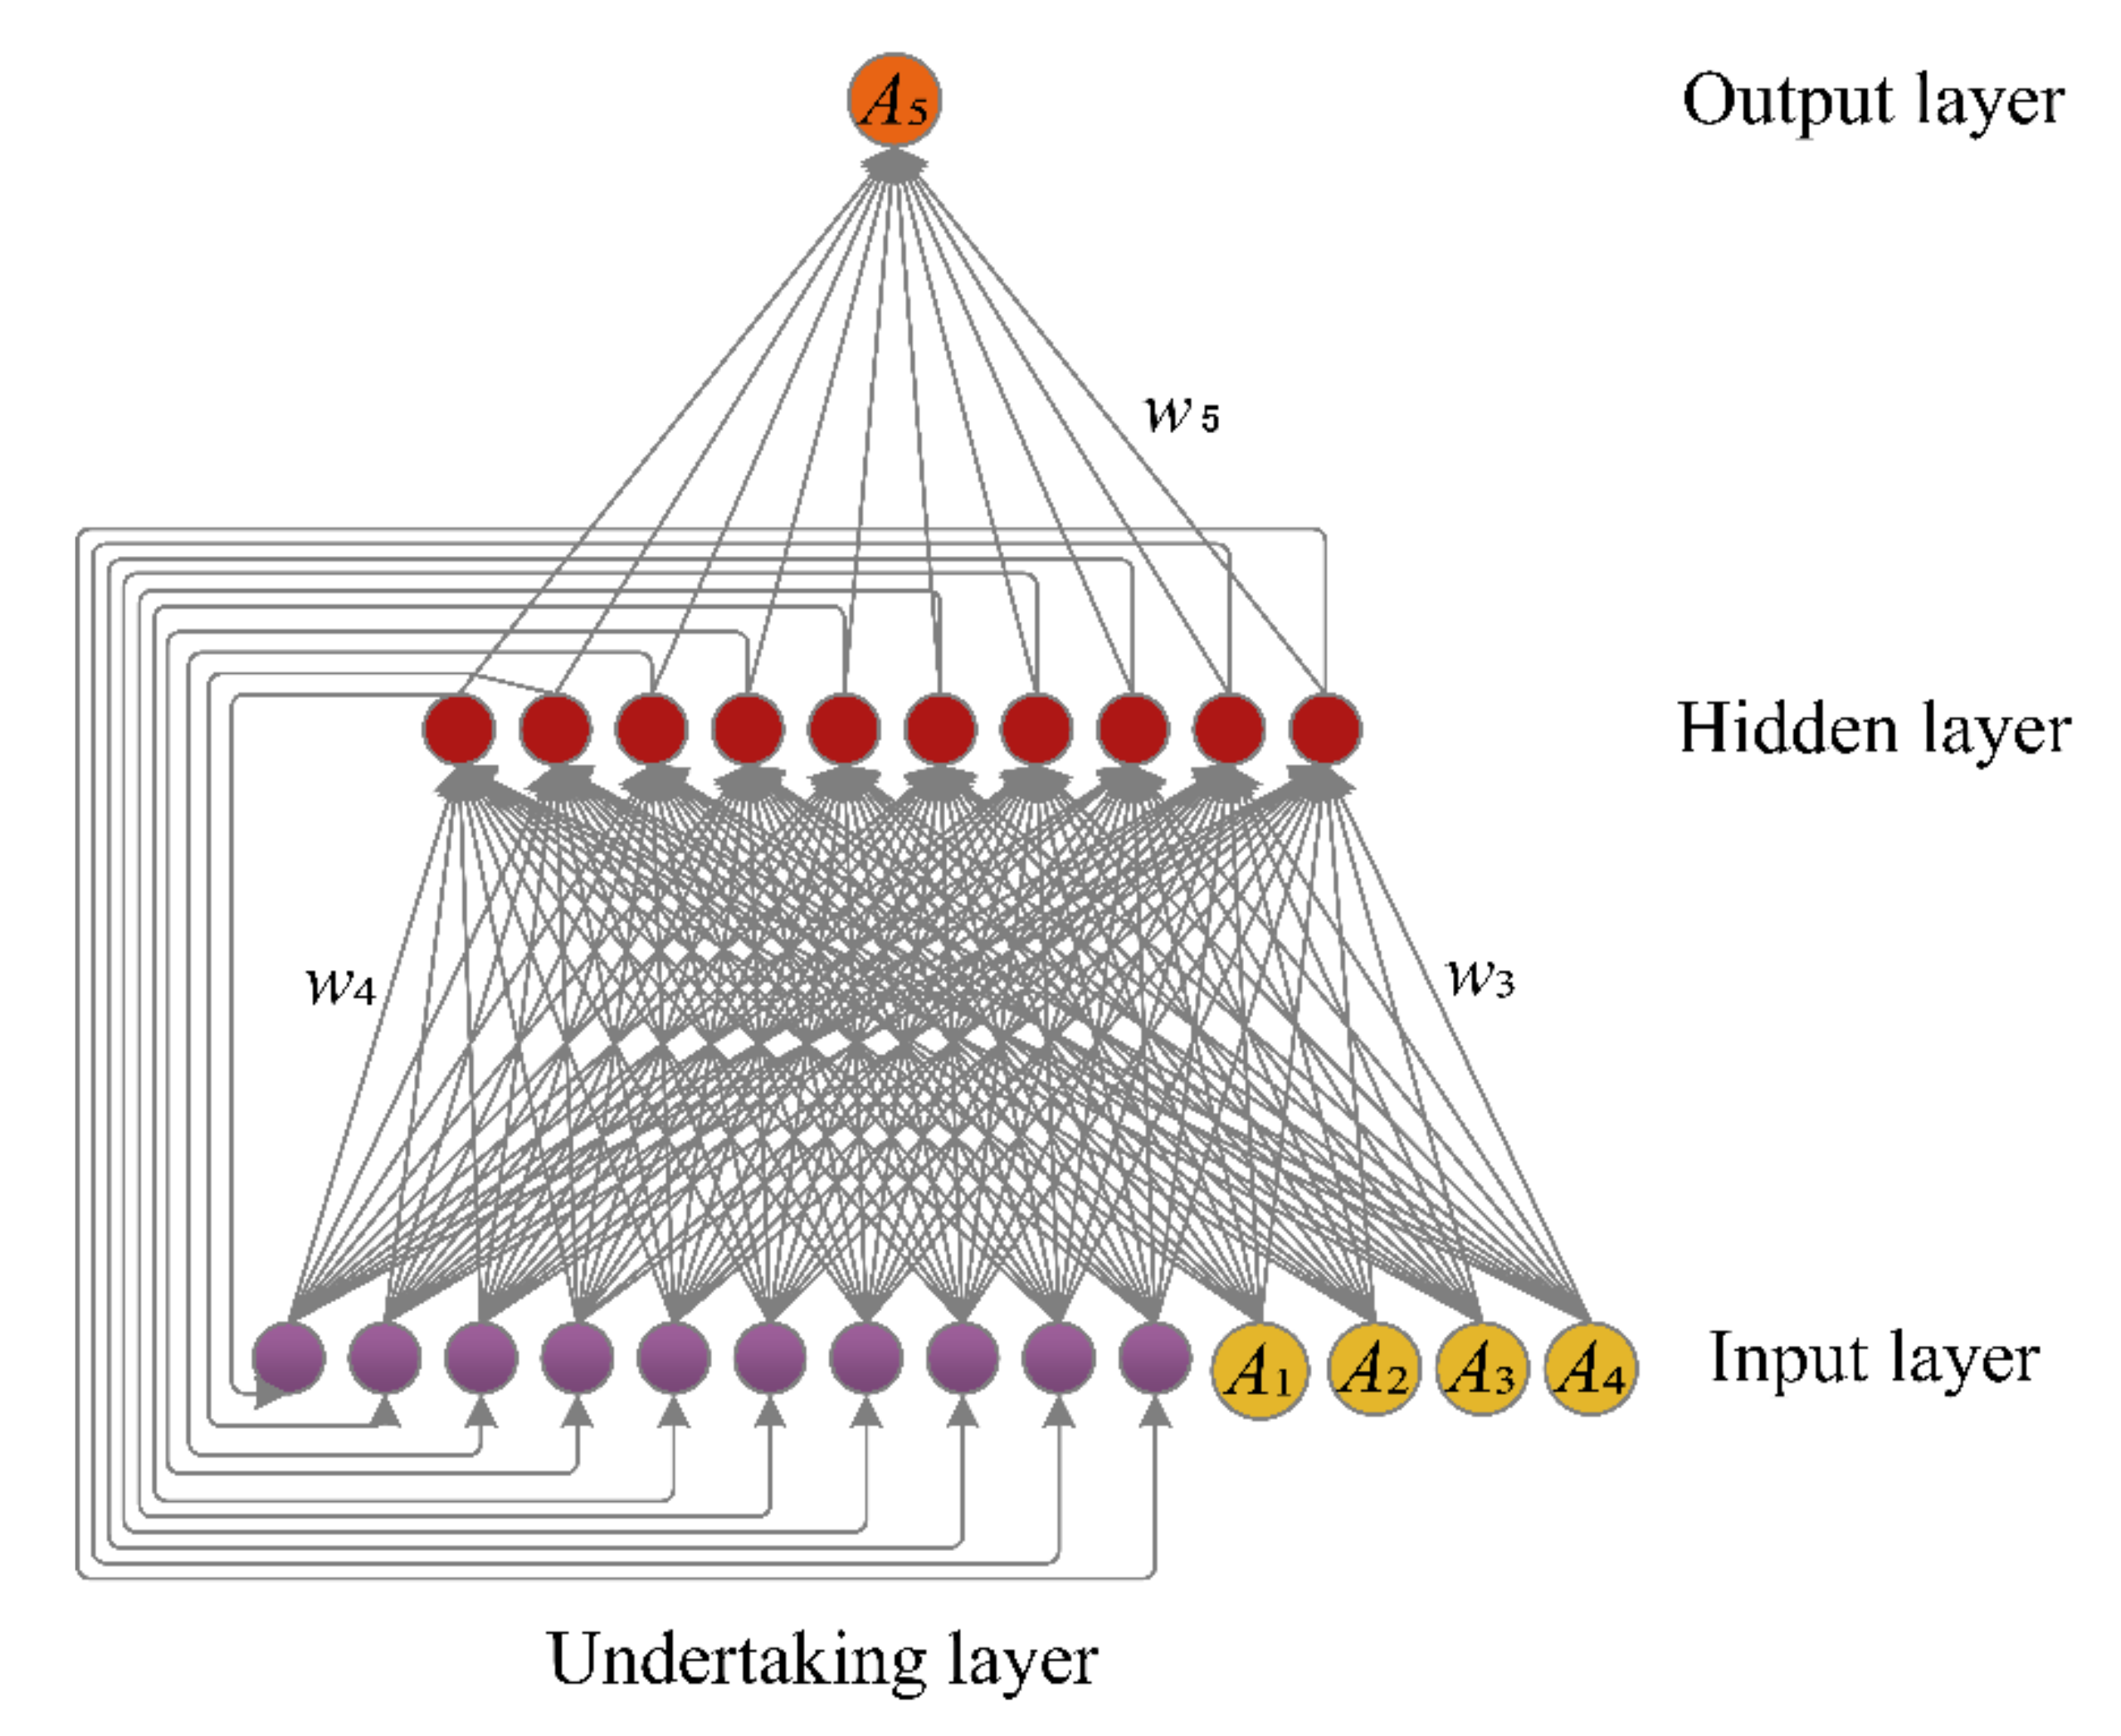
65]. In addition to the hidden layer, it inserts an undertaking layer to the original grid that is used as a one-step delay operator to record dynamic information. Therefore, it obtains the ability to adapt to time-varying characteristics. Compared with traditional neural networks, it has better learning capabilities and can be used to solve problems including optimization, fitting, and regression.
However, an ENN has the randomness problem with initial weights and thresholds, which affects the accuracy of its predictions. In this study, an SSA was used to optimize the initial weights and thresholds of an ENN to improve the overall predictive performance.
The stages of SSA optimization of an ENN are as follows:
Stage 1: Initialize the relevant parameters of ENN and SSA;
Stage 2: Calculate the fitness of initial population and sort the results. The best and worst individuals can be determined. MSE is selected as the fitness function;
Stage 3: According to Equations (3)–(5), the positions of sparrows S1, S2, and S4 are updated based on fitness ranking;
Stage 4: Calculate the fitness value. The position of each sparrow is updated constantly. If the stop condition is met, the iterative process stops. Otherwise, the above process should be repeated;
Stage 5: Obtain the optimal weights and thresholds of the ENN.
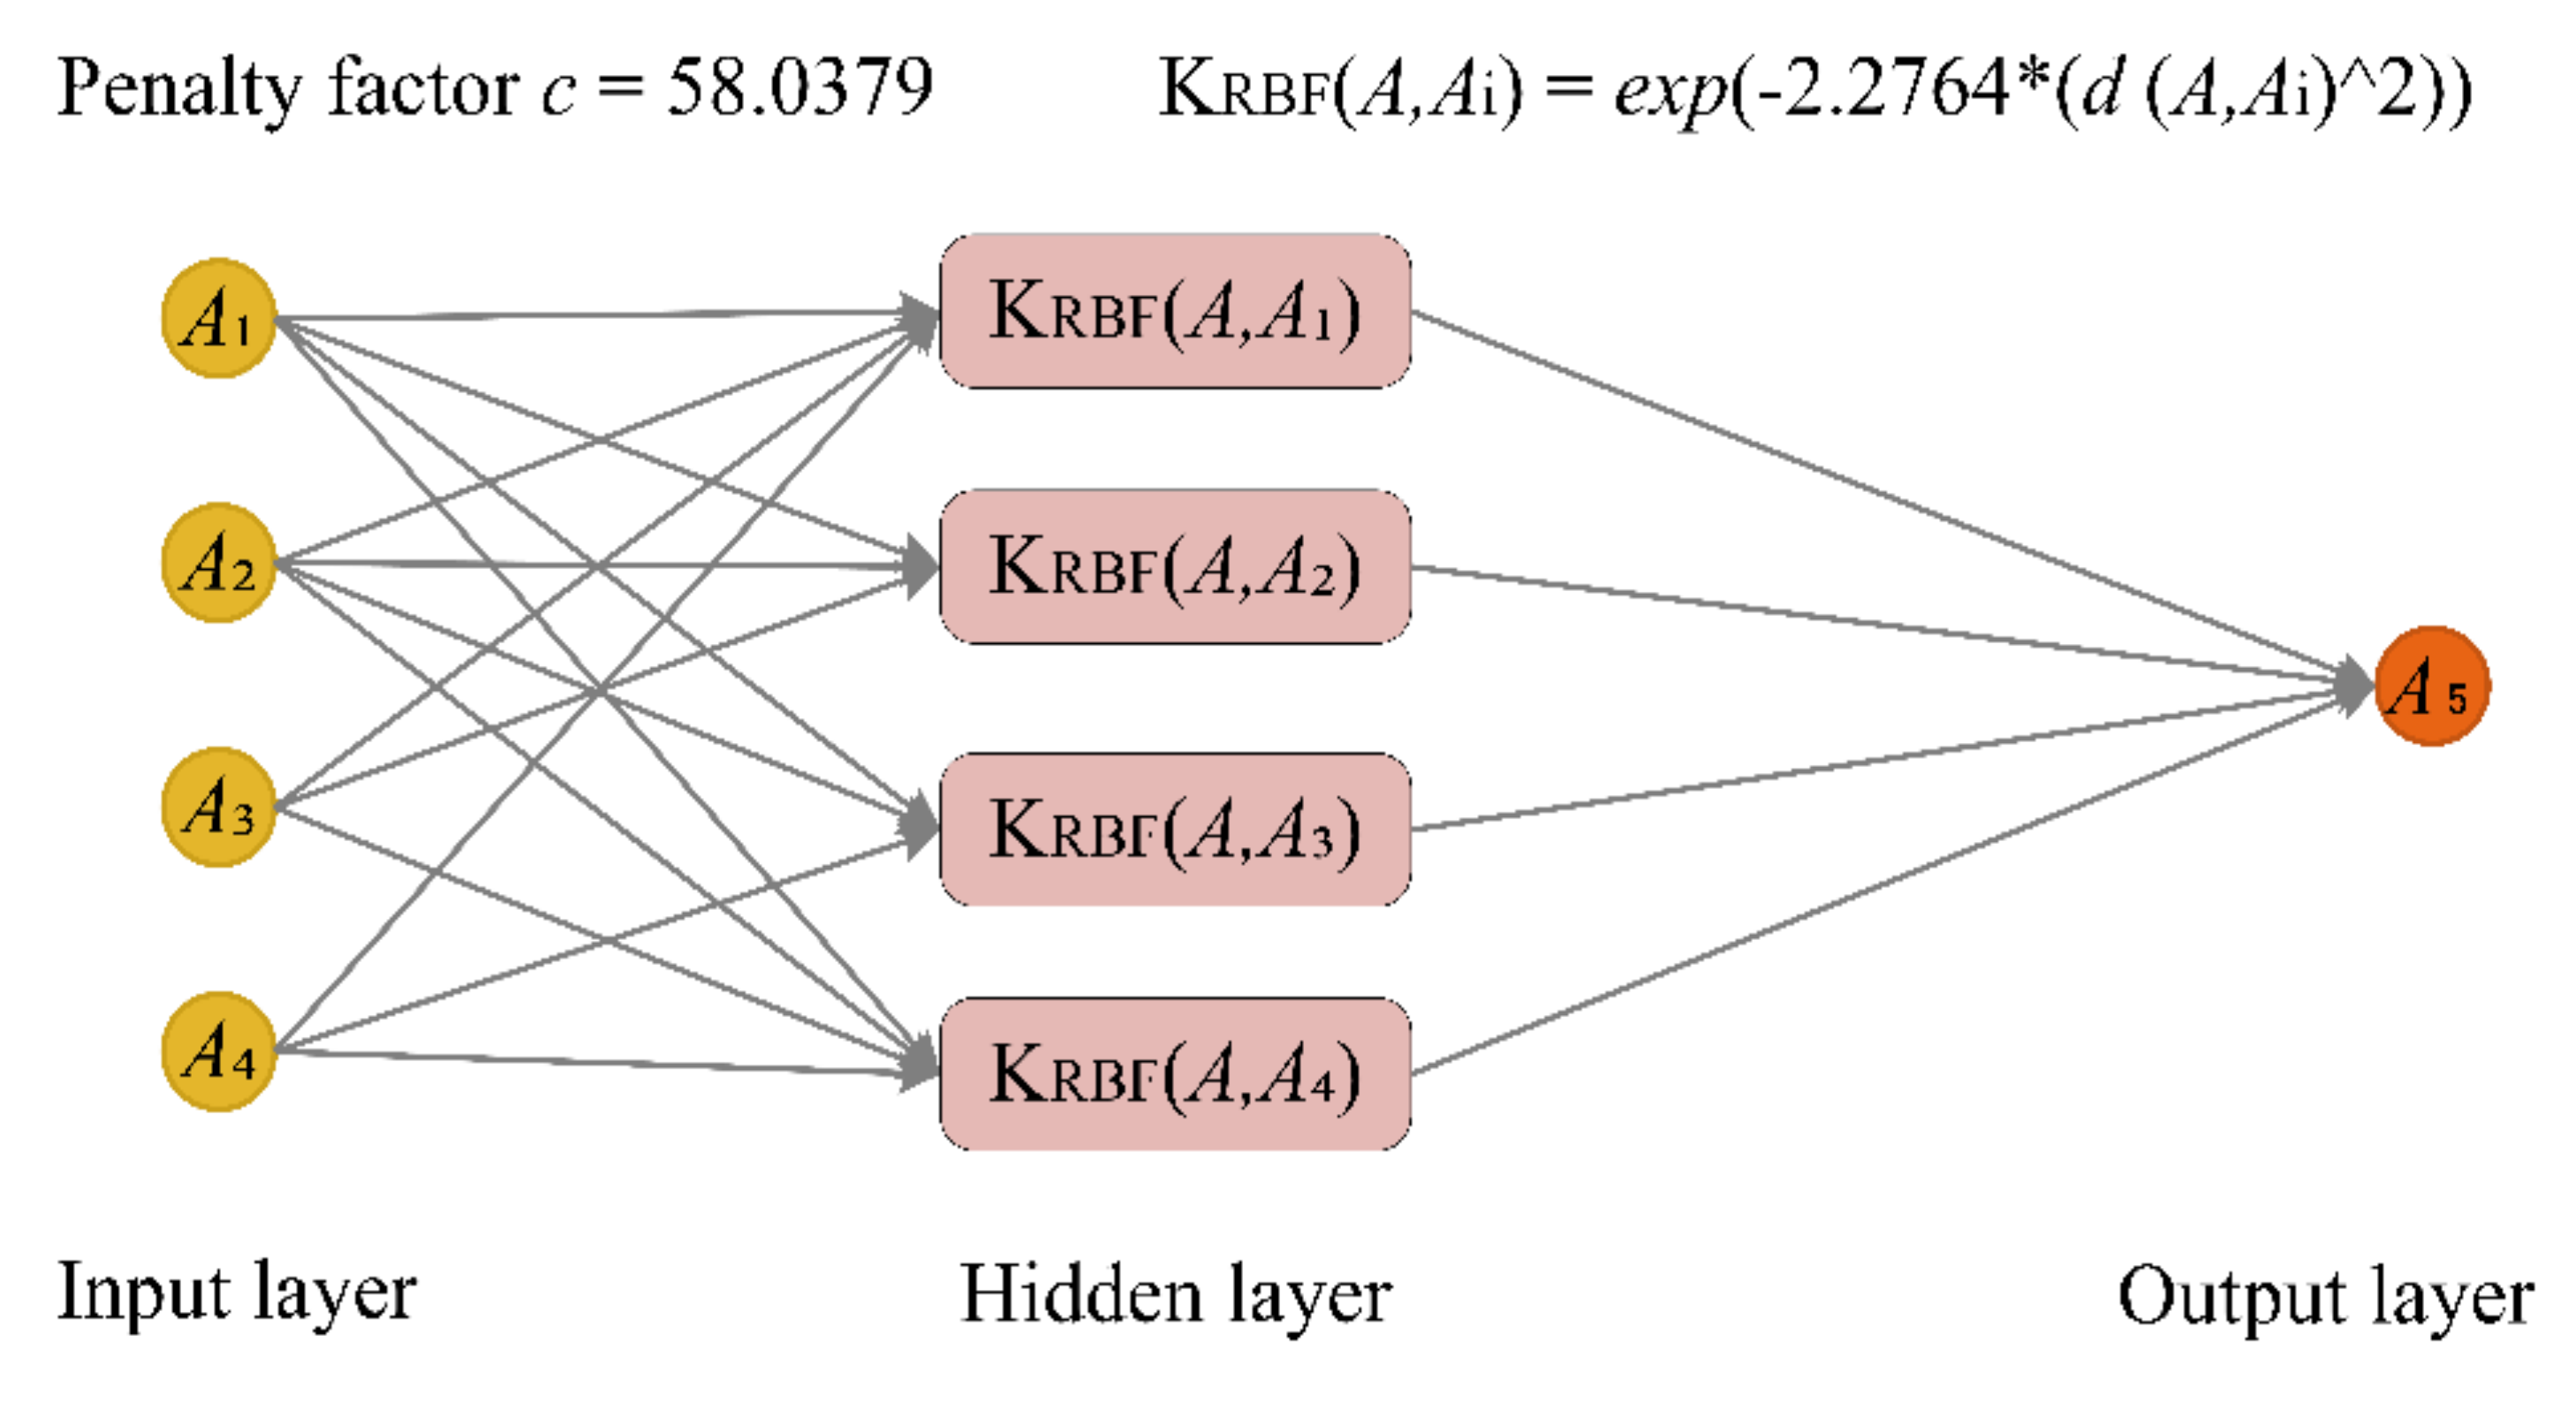
3.4. Sparrow Search Algorithm–Support Vector Regression (SSA-SVR) Model
An SVR model mainly includes two steps. First, the nonlinear data is mapped into a high-dimensional space through the kernel function to make the data linearly separable. Then, the data is processed based on the principle of structural risk minimization.
Two important parameters in the SVR model include the penalty parameter and the kernel function parameter . Among them, represents the error tolerance and indicates the learning ability. The higher the value of , the smaller the tolerance to error, and the more likely to overfit. In addition, affects the prediction accuracy directly. Therefore, it is necessary to determine the optimal and during the training process.
The stages of SSA optimization of an SVR are as follows:
Stage 1: Build and initialize the SVR model;
Stage 2: Initialize the parameters of SSA, and determine the range of and ;
Stage 3: Calculate the fitness of the initial population and determine the best and worst individuals. MSE is selected as the fitness function;
Stage 4: Update the positions of sparrows S1, S2, and S4 based on Equations (3)–(5);
Stage 5: Calculate the fitness value and update the position of the sparrows. The iterative process will break when the stop condition is met. Otherwise, the above steps will be repeated;
Stage 6: Obtain the optimal and , which are then used for model training.
3.5. Model Evaluation Indexes
In order to evaluate model performance, seven indexes, including MAE, R2, NSC, MAPE, Theil’s U value, RMSE, and SSE, were adopted.
MAE represents the average error between predicted value and actual value. The calculation equation is [
66]:
where
is the number of samples;
and
are the predicted value and actual value of the
sample, respectively; and
denotes the average of the actual values.
R
2 is used to indicate the correlation between two variables. The calculation equation is [
33]:
NSC is used to describe the predictive efficiency. The calculation equation is [
67]:
Theil’s U value is used to indicate the prediction accuracy. The calculation equation is [
68]:
MAPE denotes the average value of the relative error. The calculation equation is [
69]:
RMSE is used to describe the deviation between the predicted value and actual value. The calculation equation is [
70]:
SSE is used to calculate the sum of the squared error. The calculation equation is [
71]:
5. Discussion
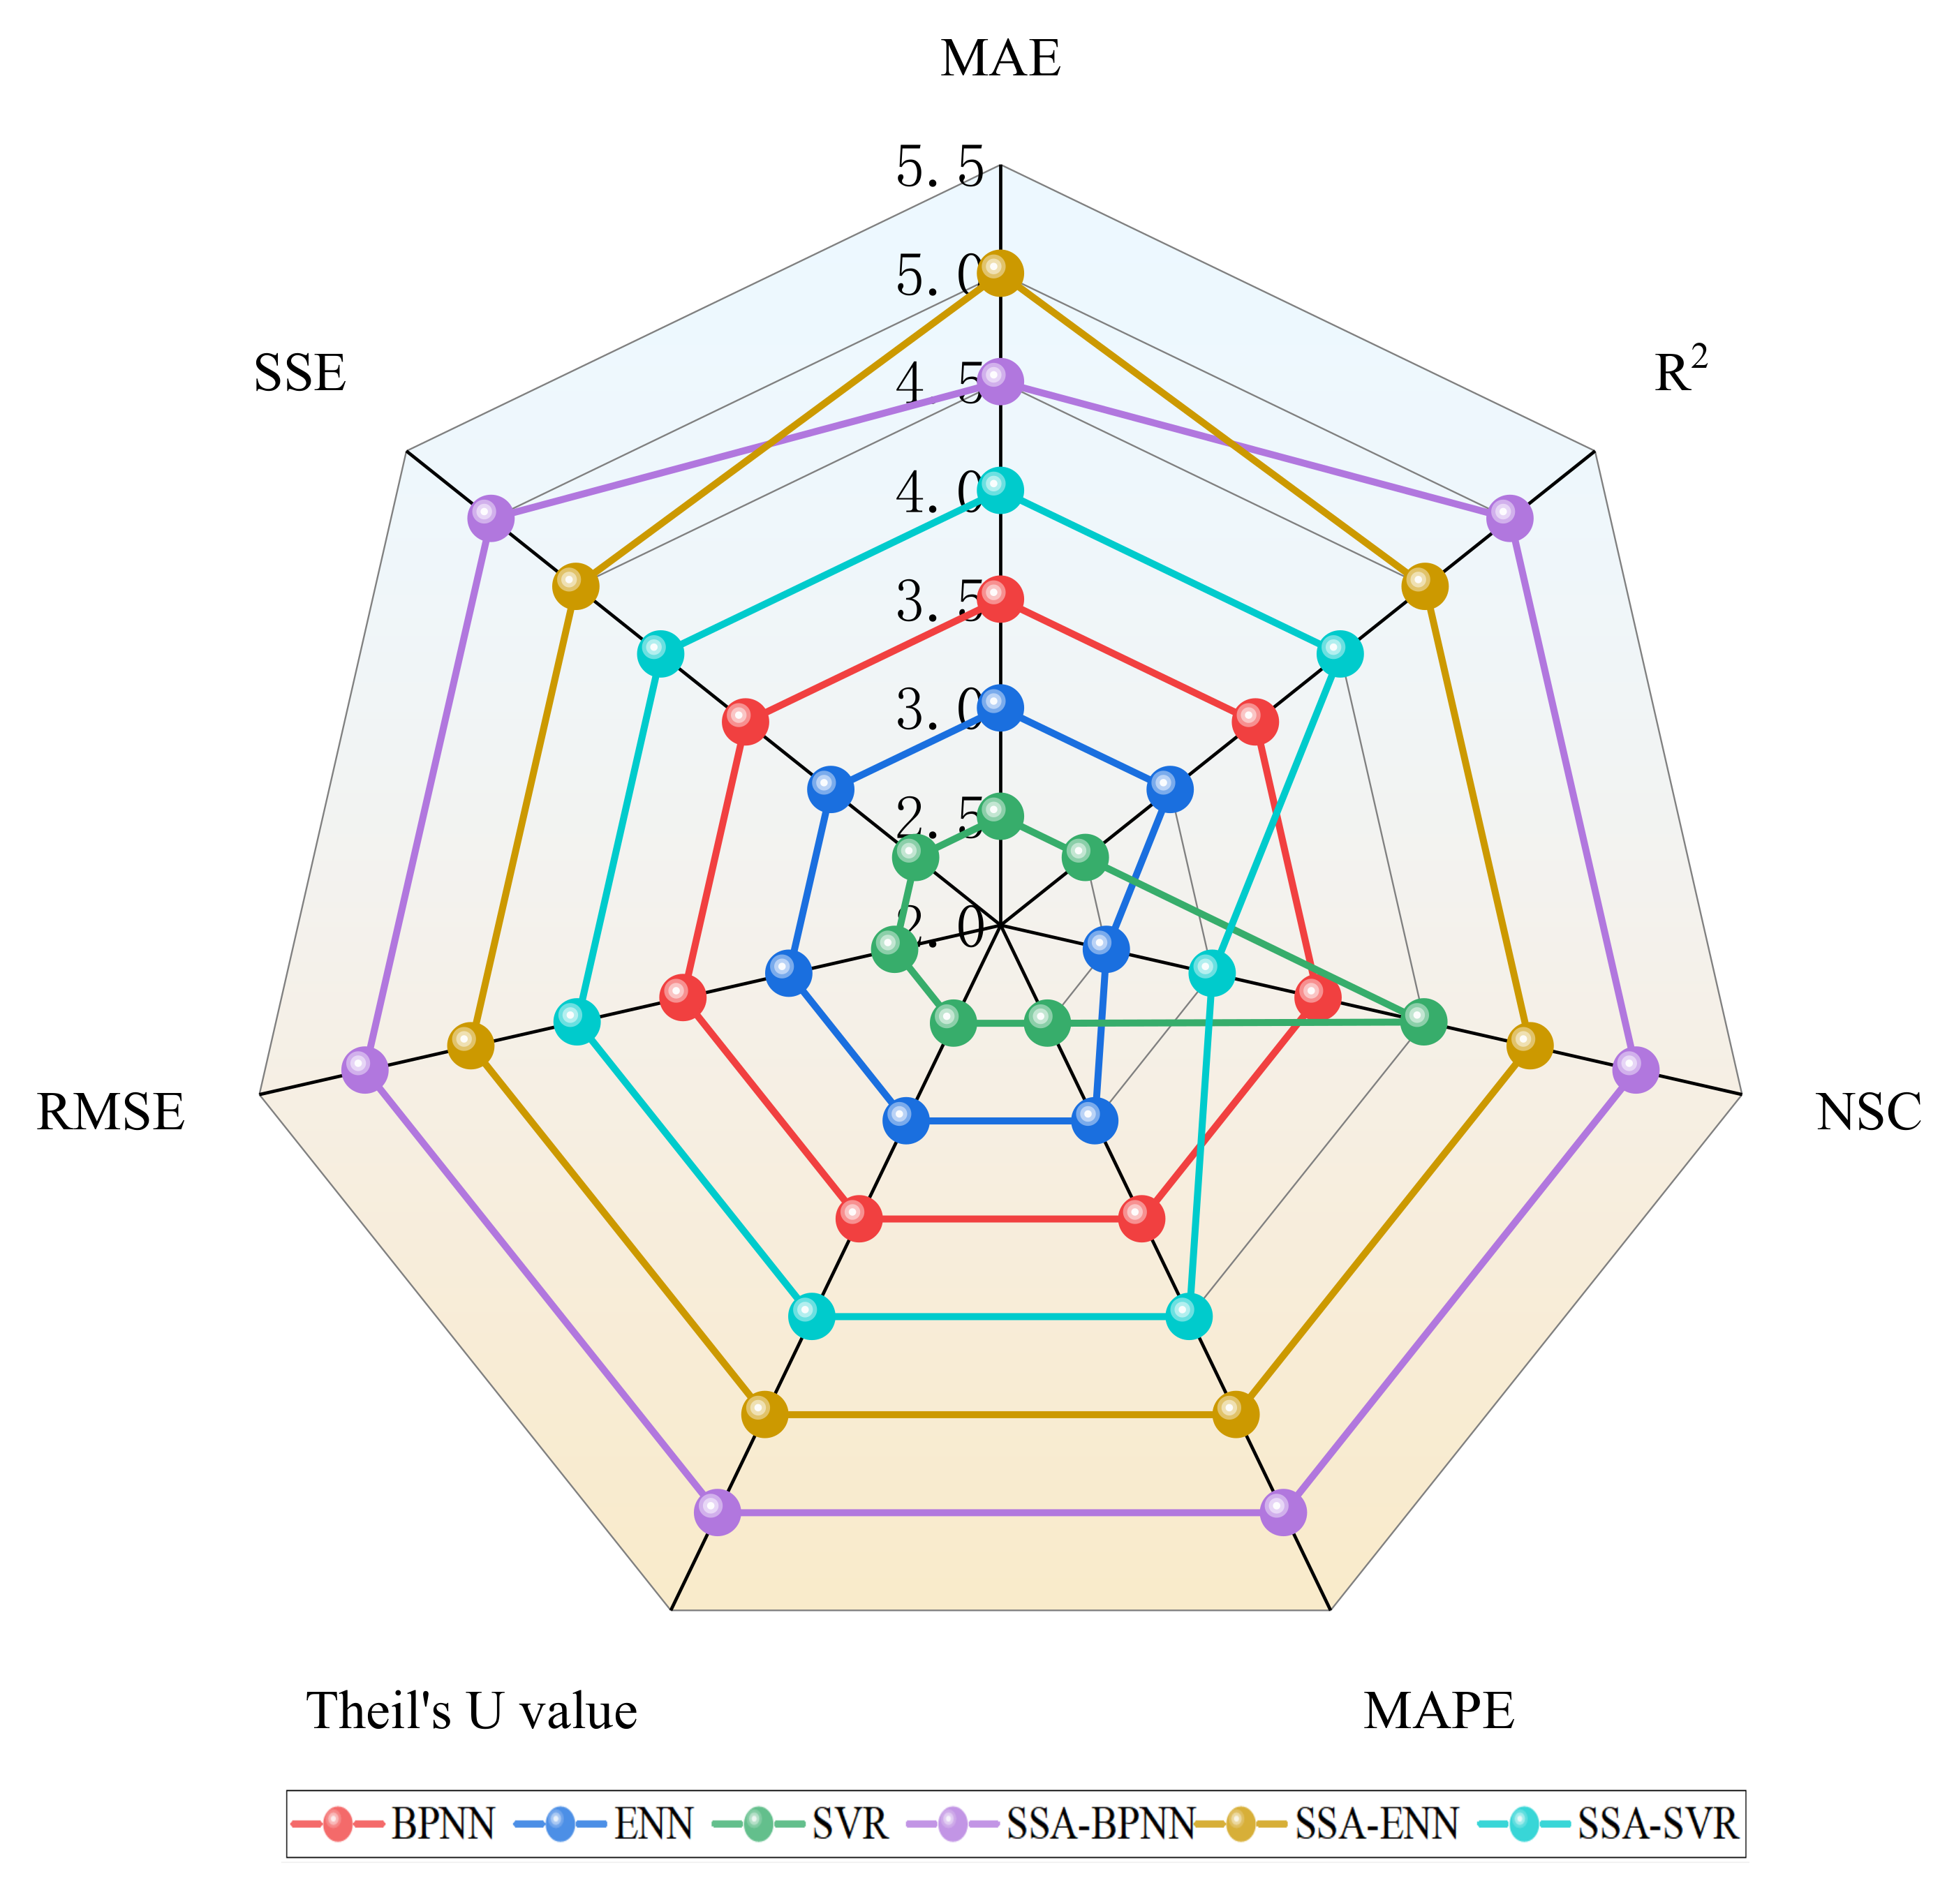
The main purpose of this study was to select an appropriate model to predict the thickness of an EDZ. Although these models were comprehensively evaluated based on seven evaluation indexes, as shown in
Table 3,
Table 4 and
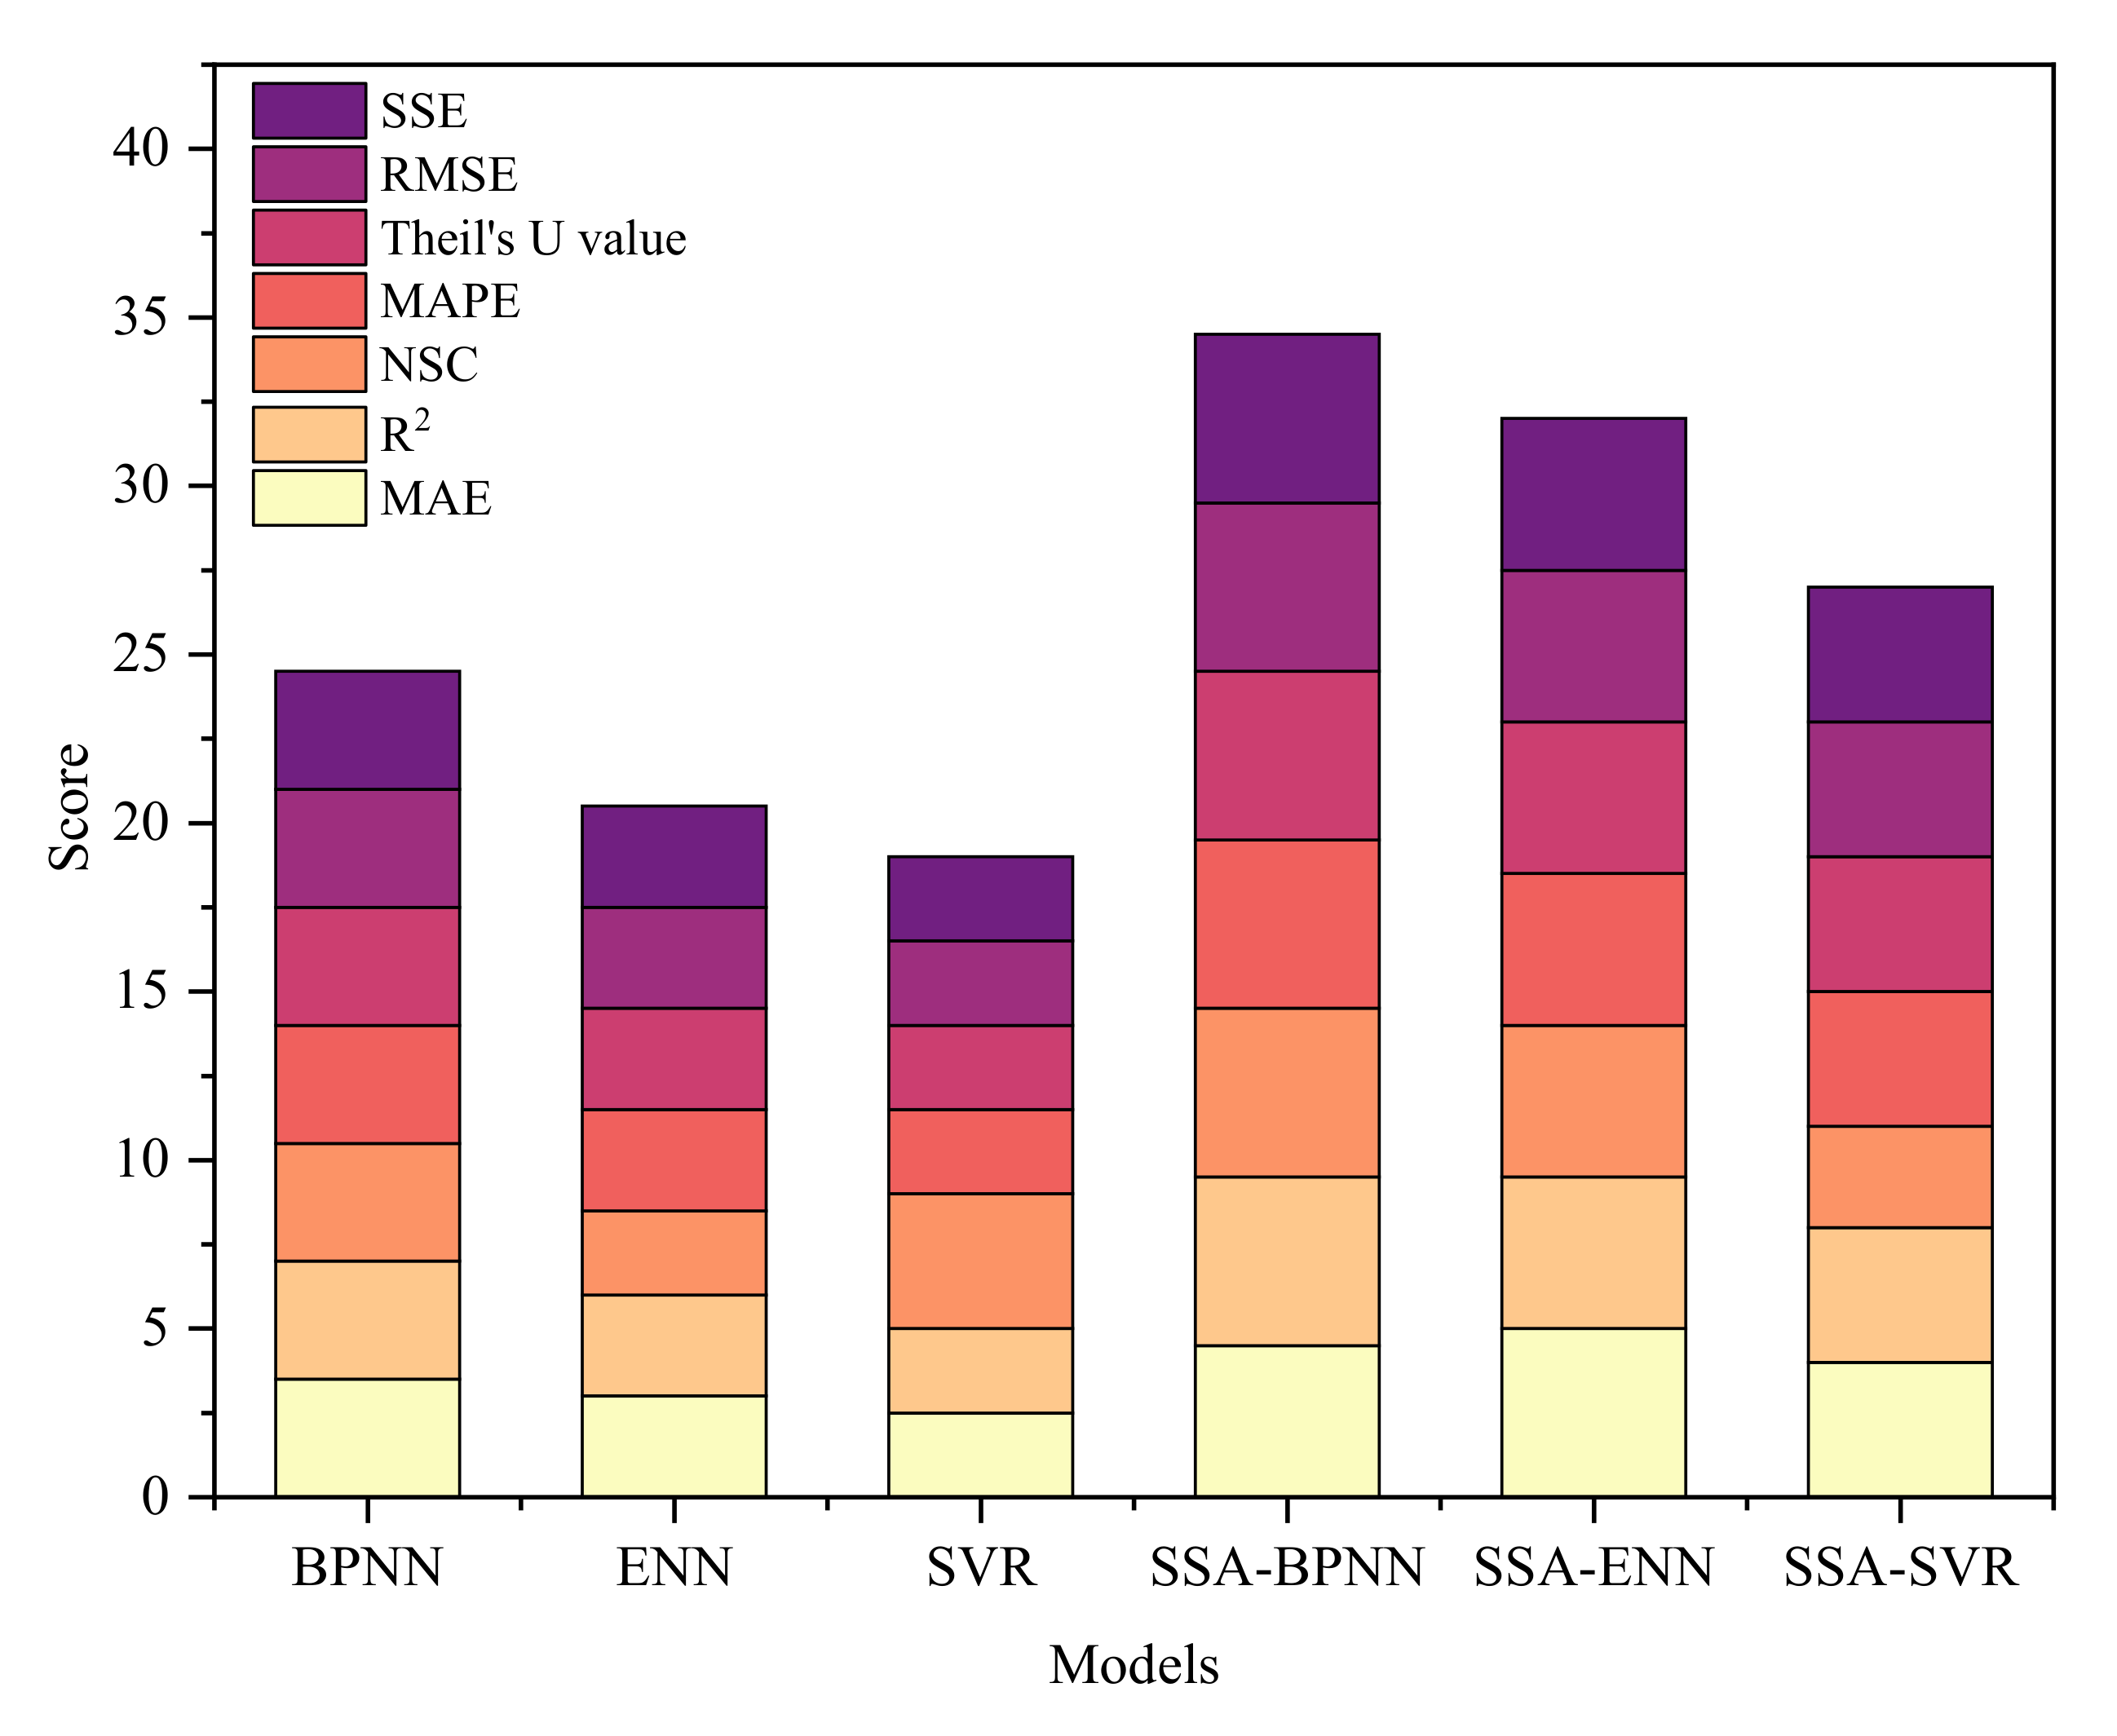
Table 5, it was necessary to determine their ranking results. In order to obtain the predictive performance of each model more intuitively, a score method was proposed. The specific scoring principle was that the best model in each index was given 5 points, the second-ranked model was given 4.5 points, and the lower-ranked models’ scores were sequentially reduced by 0.5 points. The radar chart of the model score corresponding to each index is shown in
Figure 18. It can be seen that most of the scores for each model index were basically at the same level. According to the area of the radar chart, it can clearly be seen that the SSA-BPNN and SSA-ENN models performed better. Based on the scores of various indexes, a stacked chart was obtained, as shown in
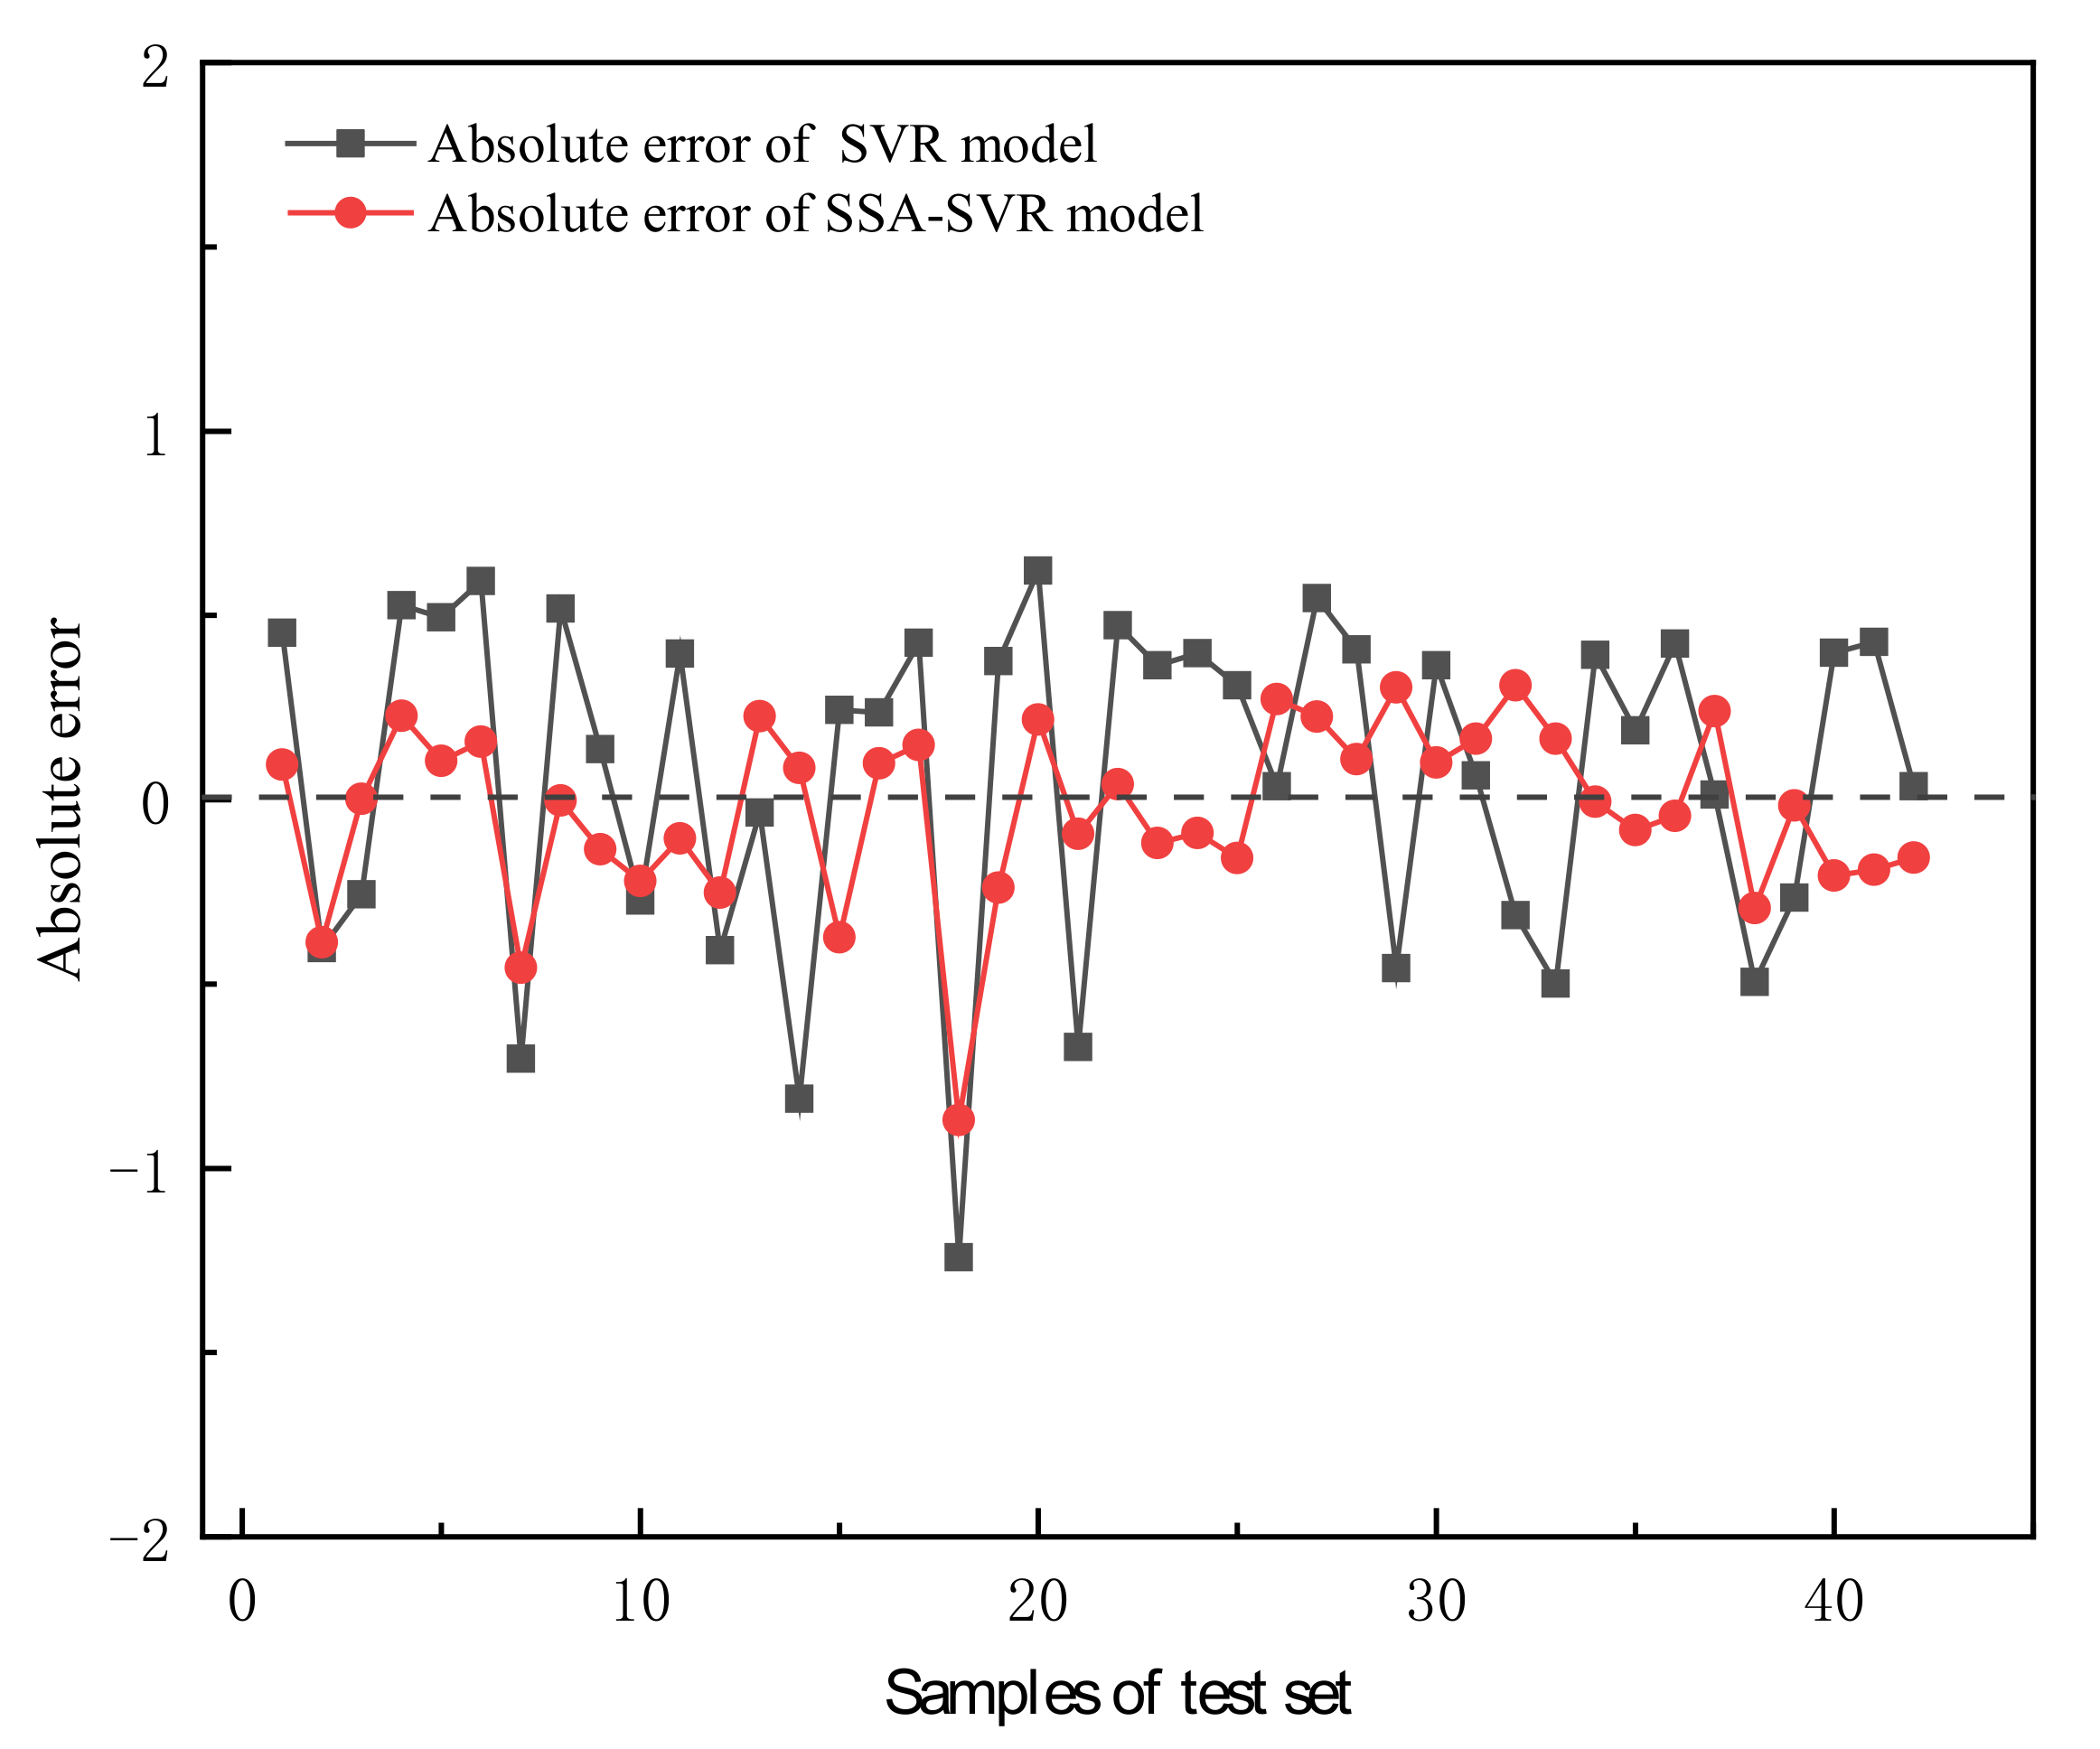
Figure 19. It can be seen that the scores of the models optimized by SSA increased significantly, which illustrated the importance of parameter optimization with the SSA. According to the total scores, the ranking results were determined as SSA-BPNN > SSA-ENN > SSA-SVR > BPNN > ENN >SVR. The SSA-BPNN model was more suitable for predicting the thickness of an EDZ.
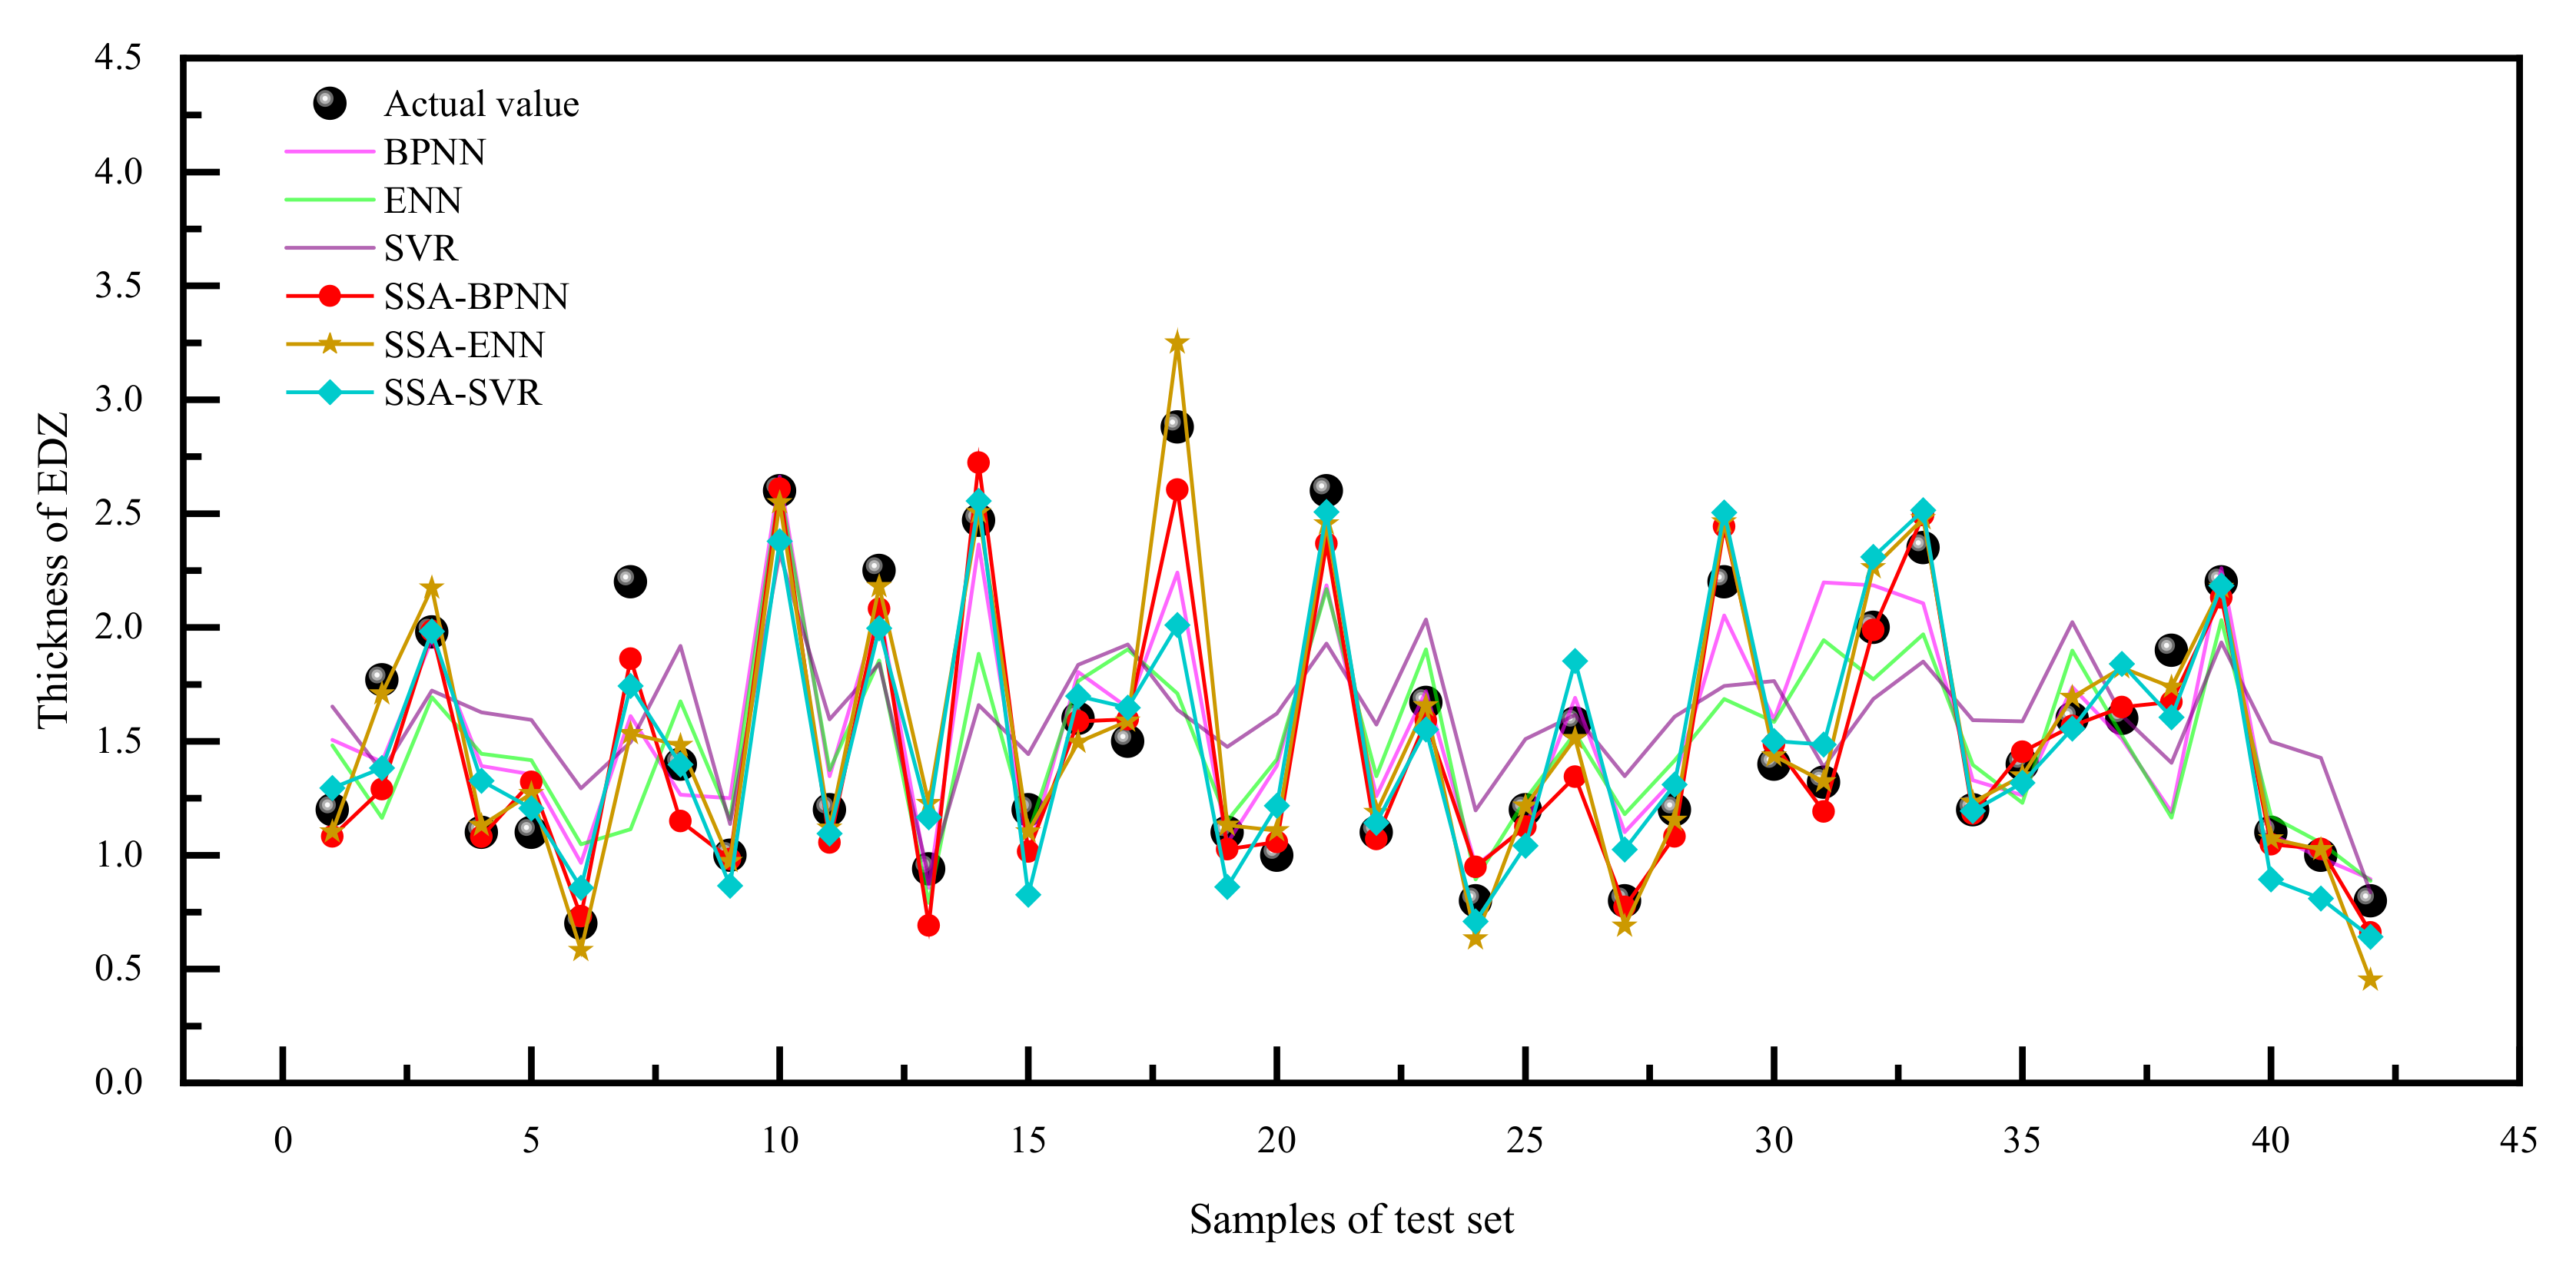
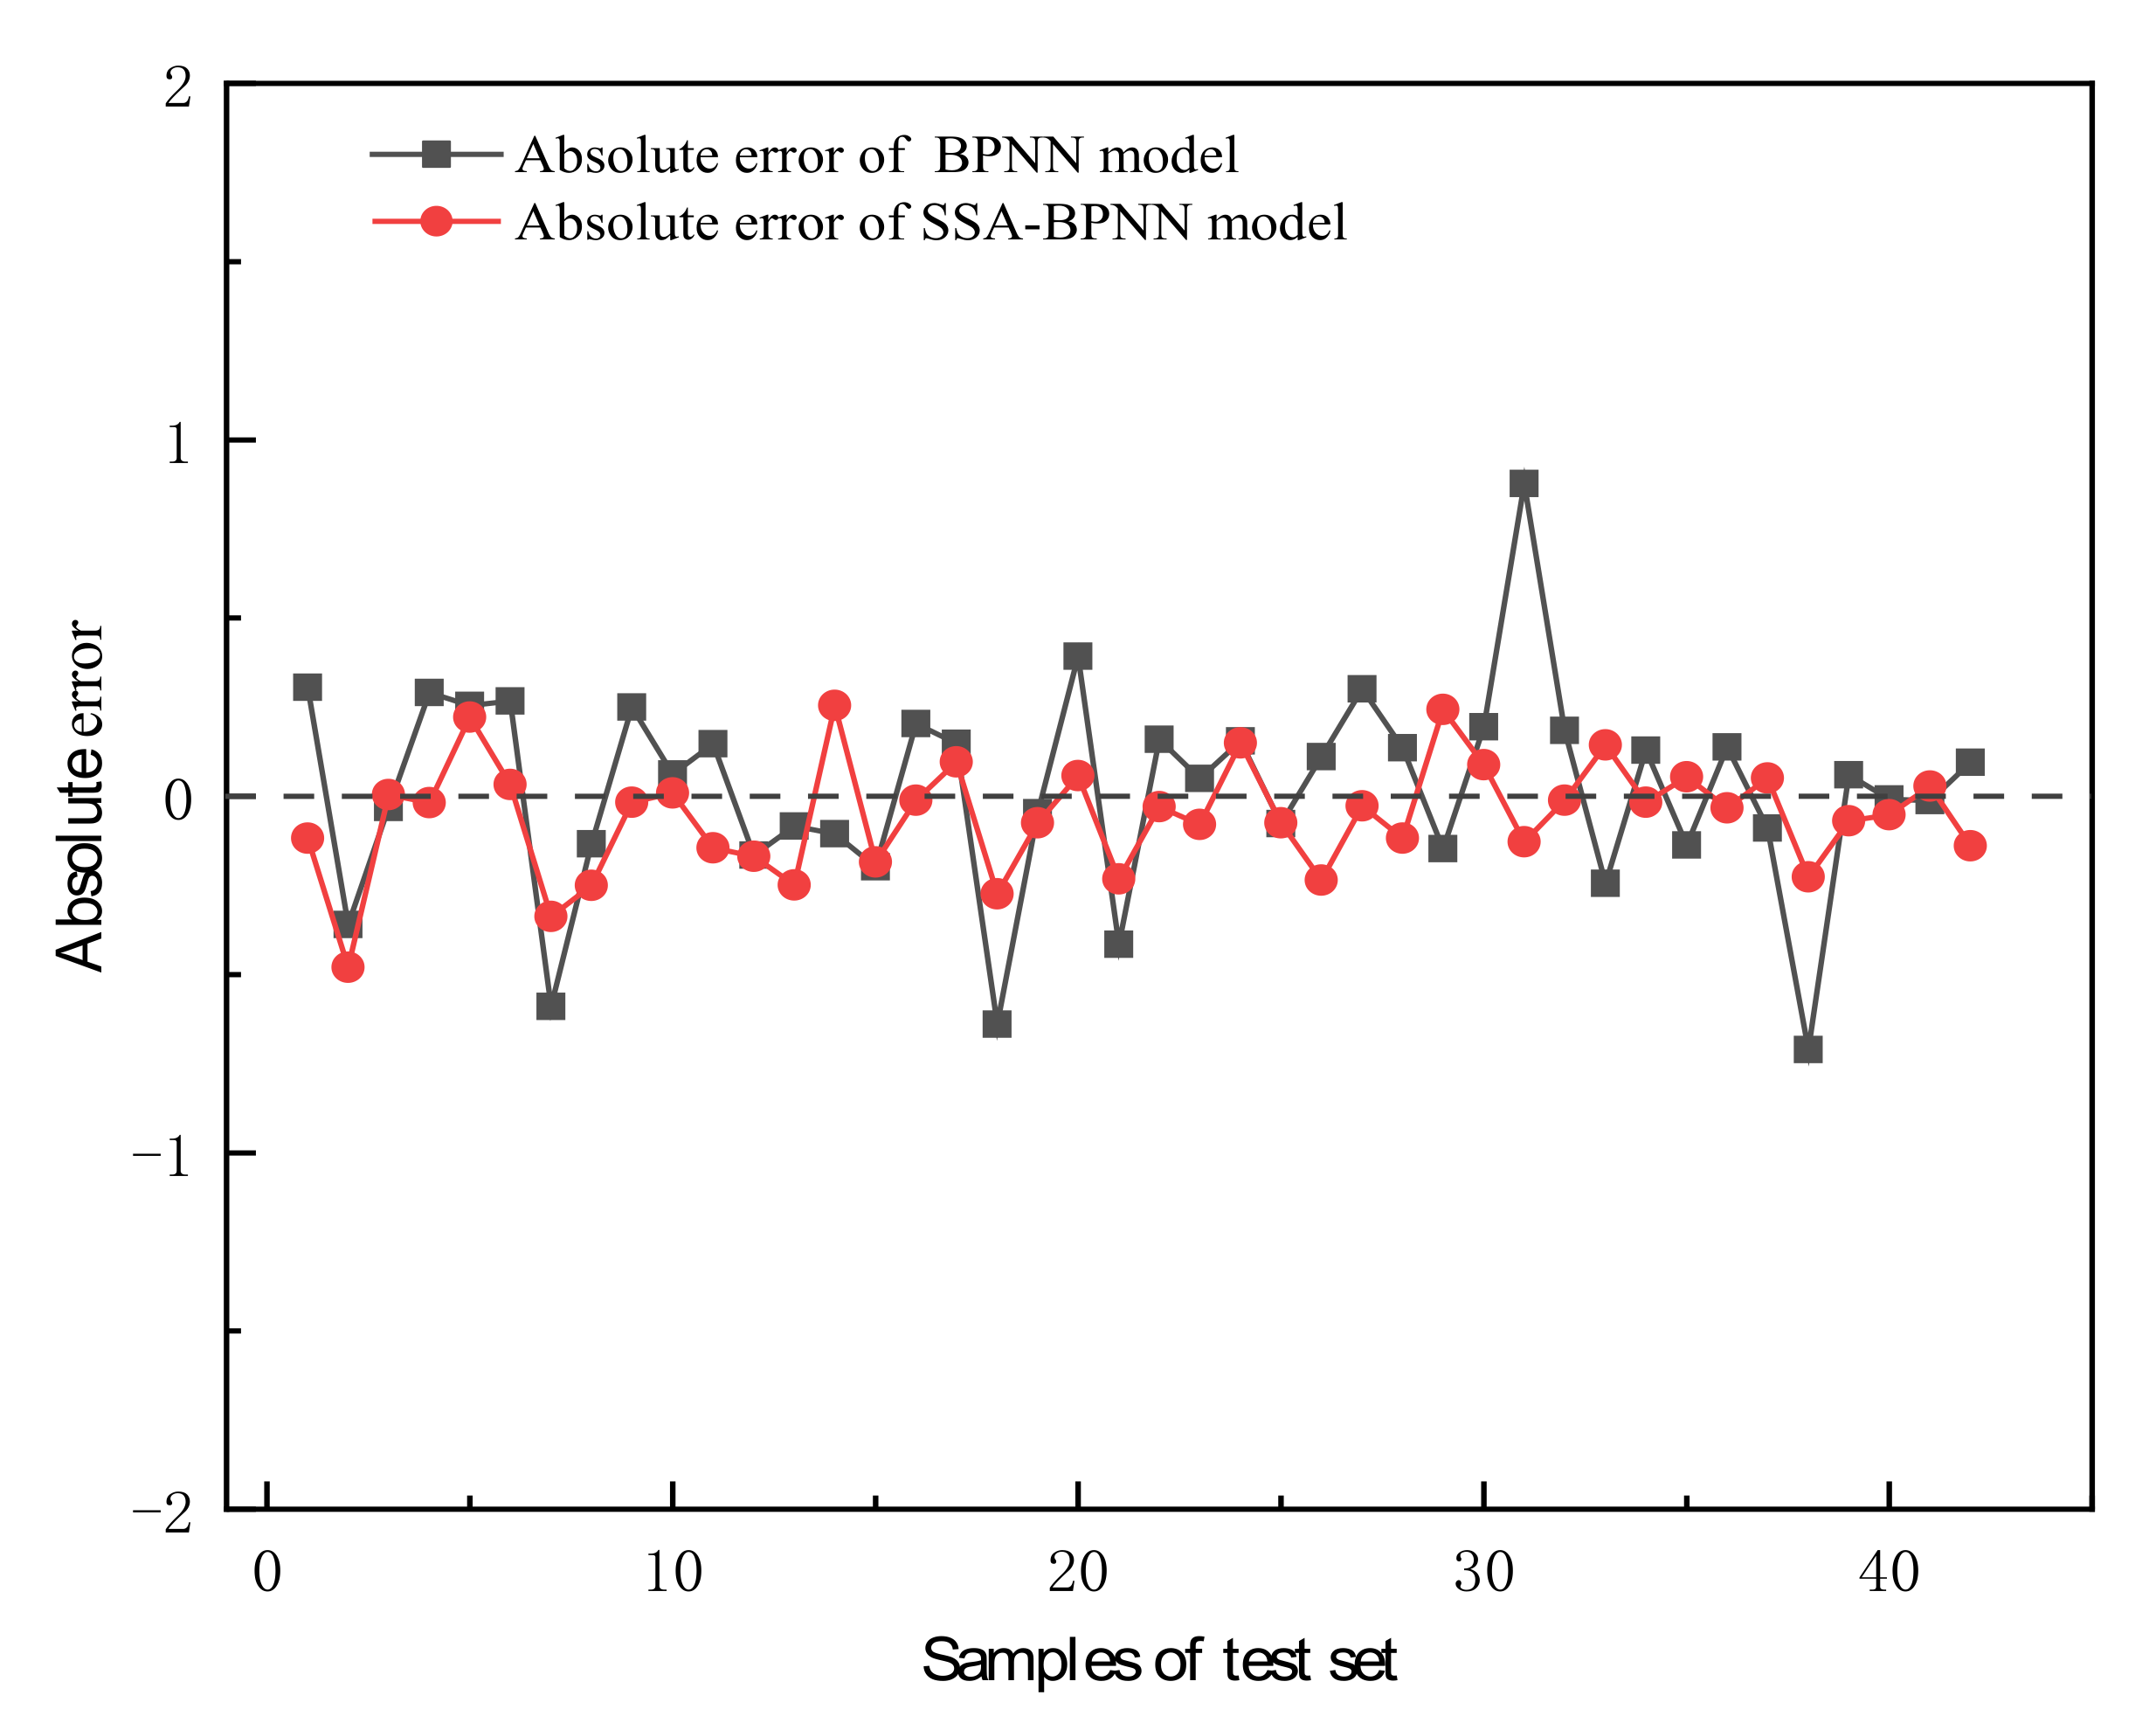
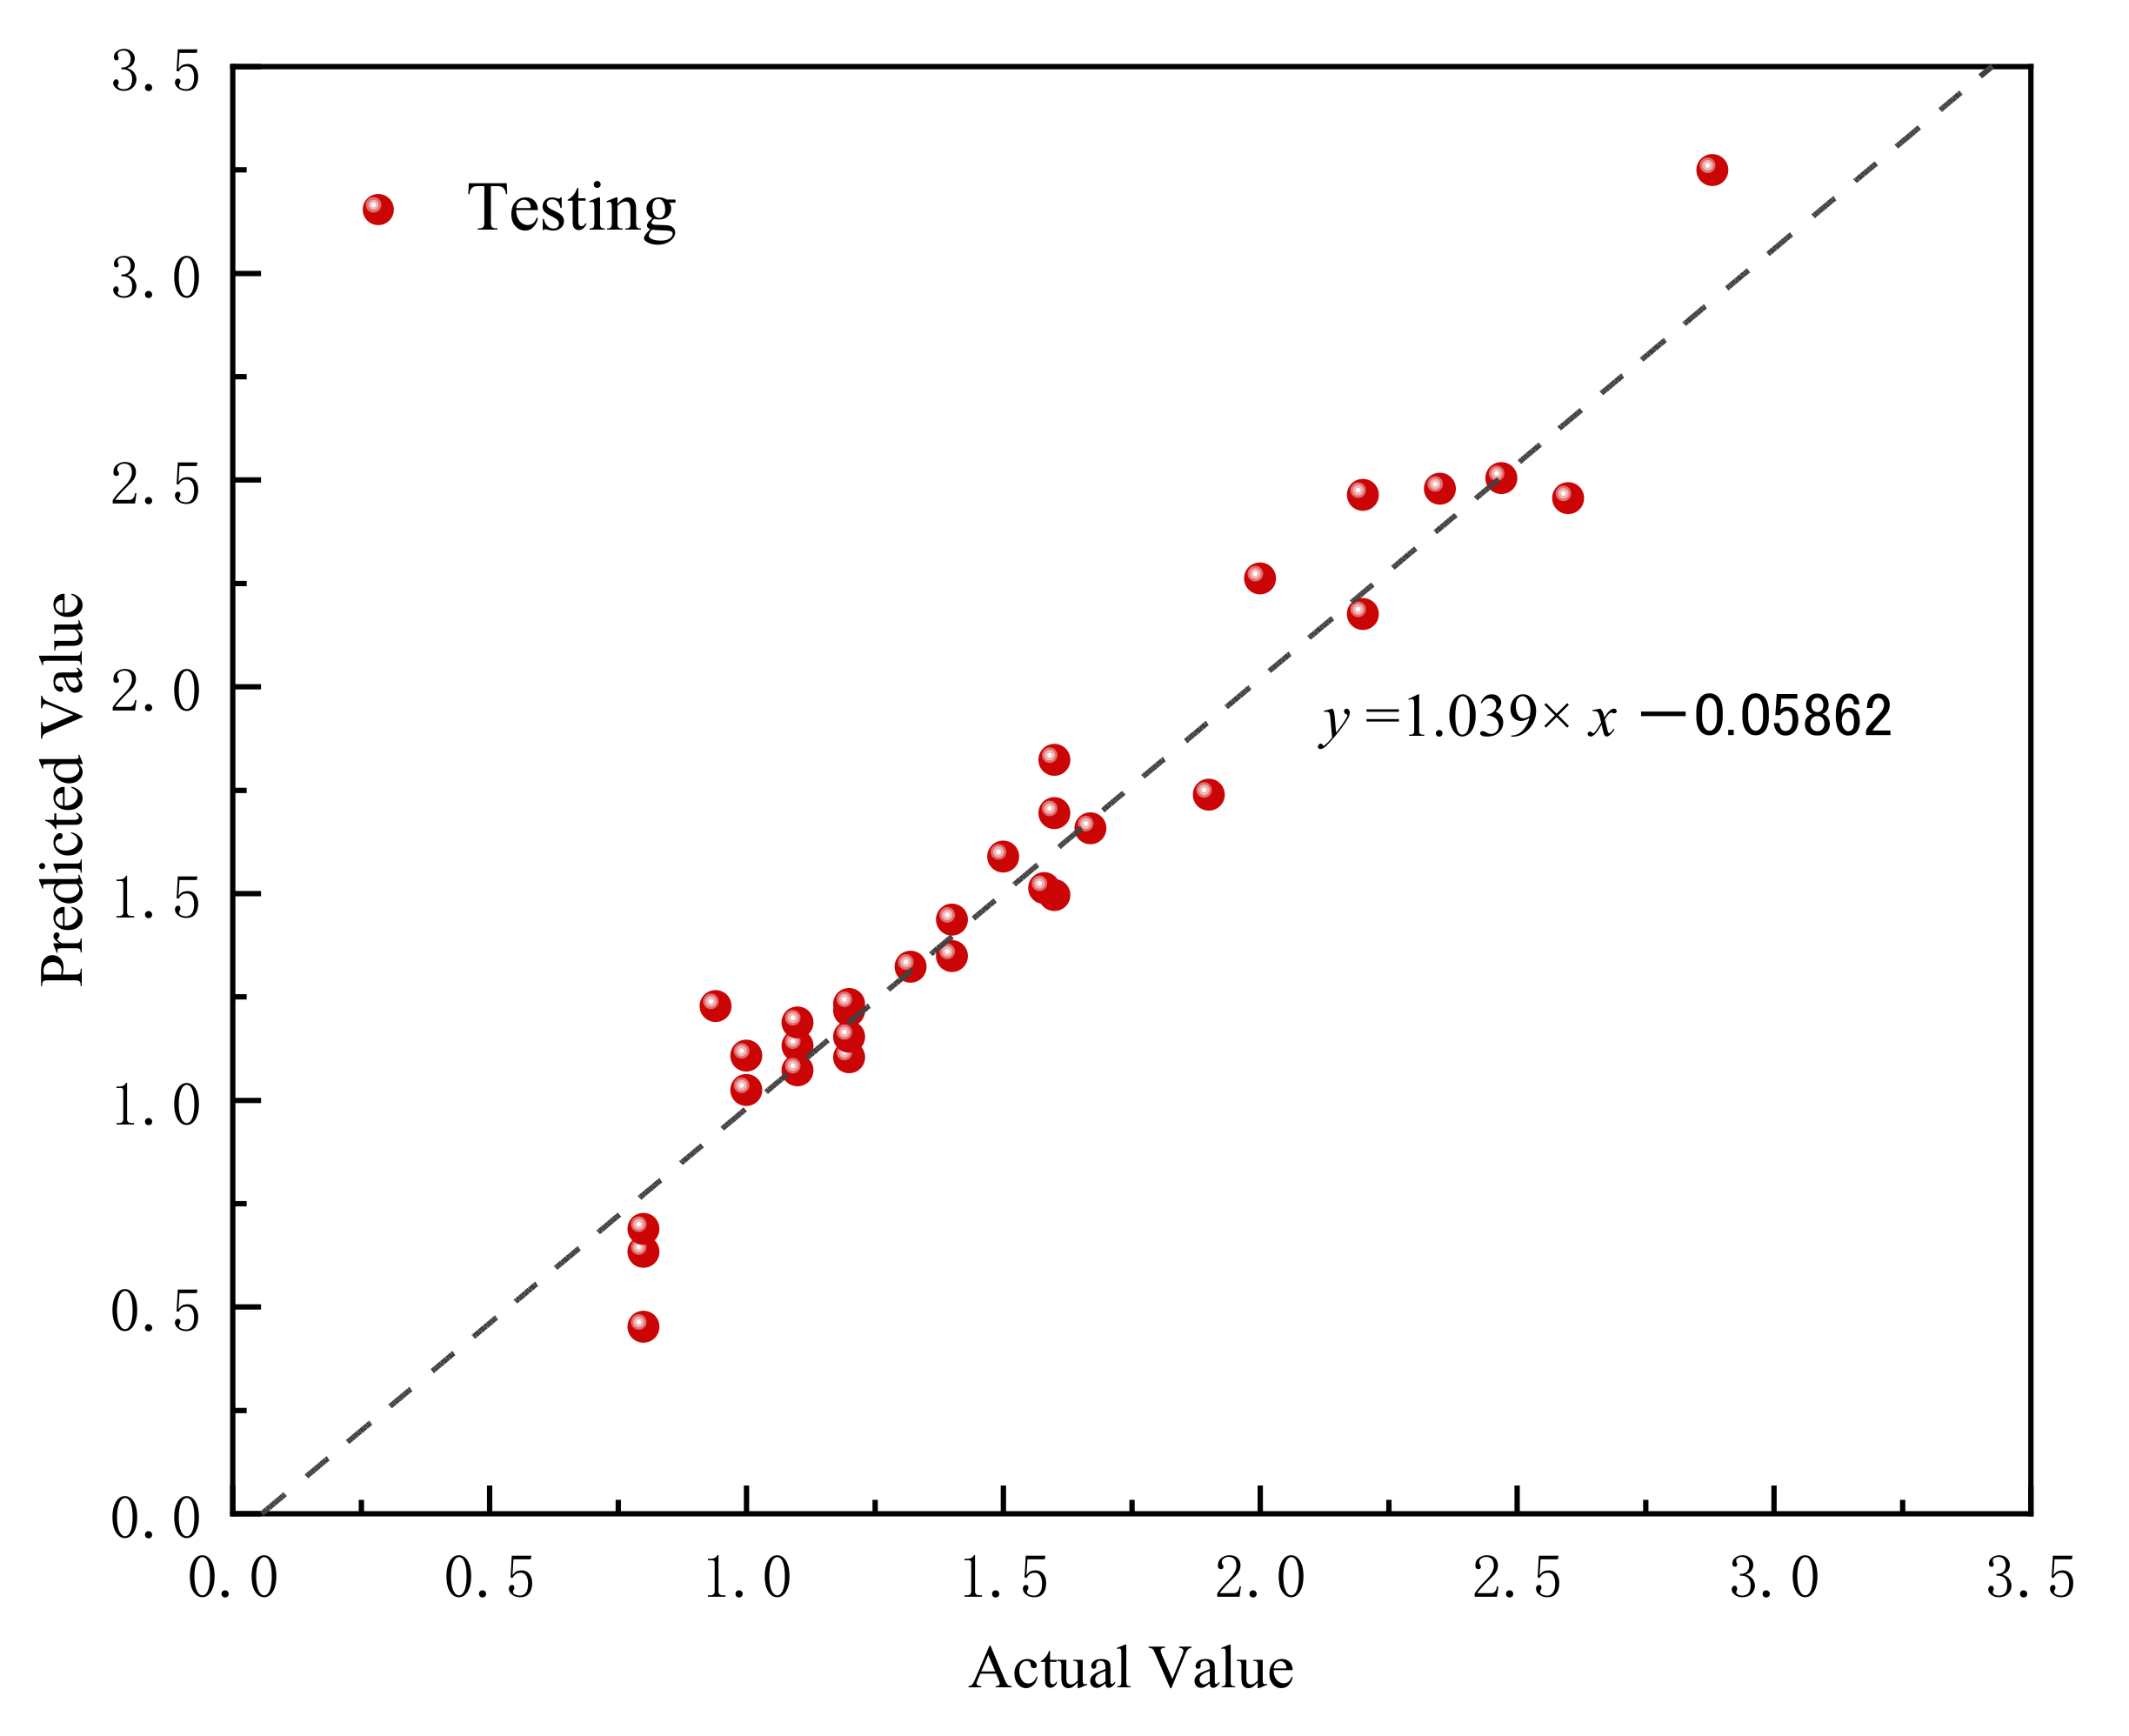
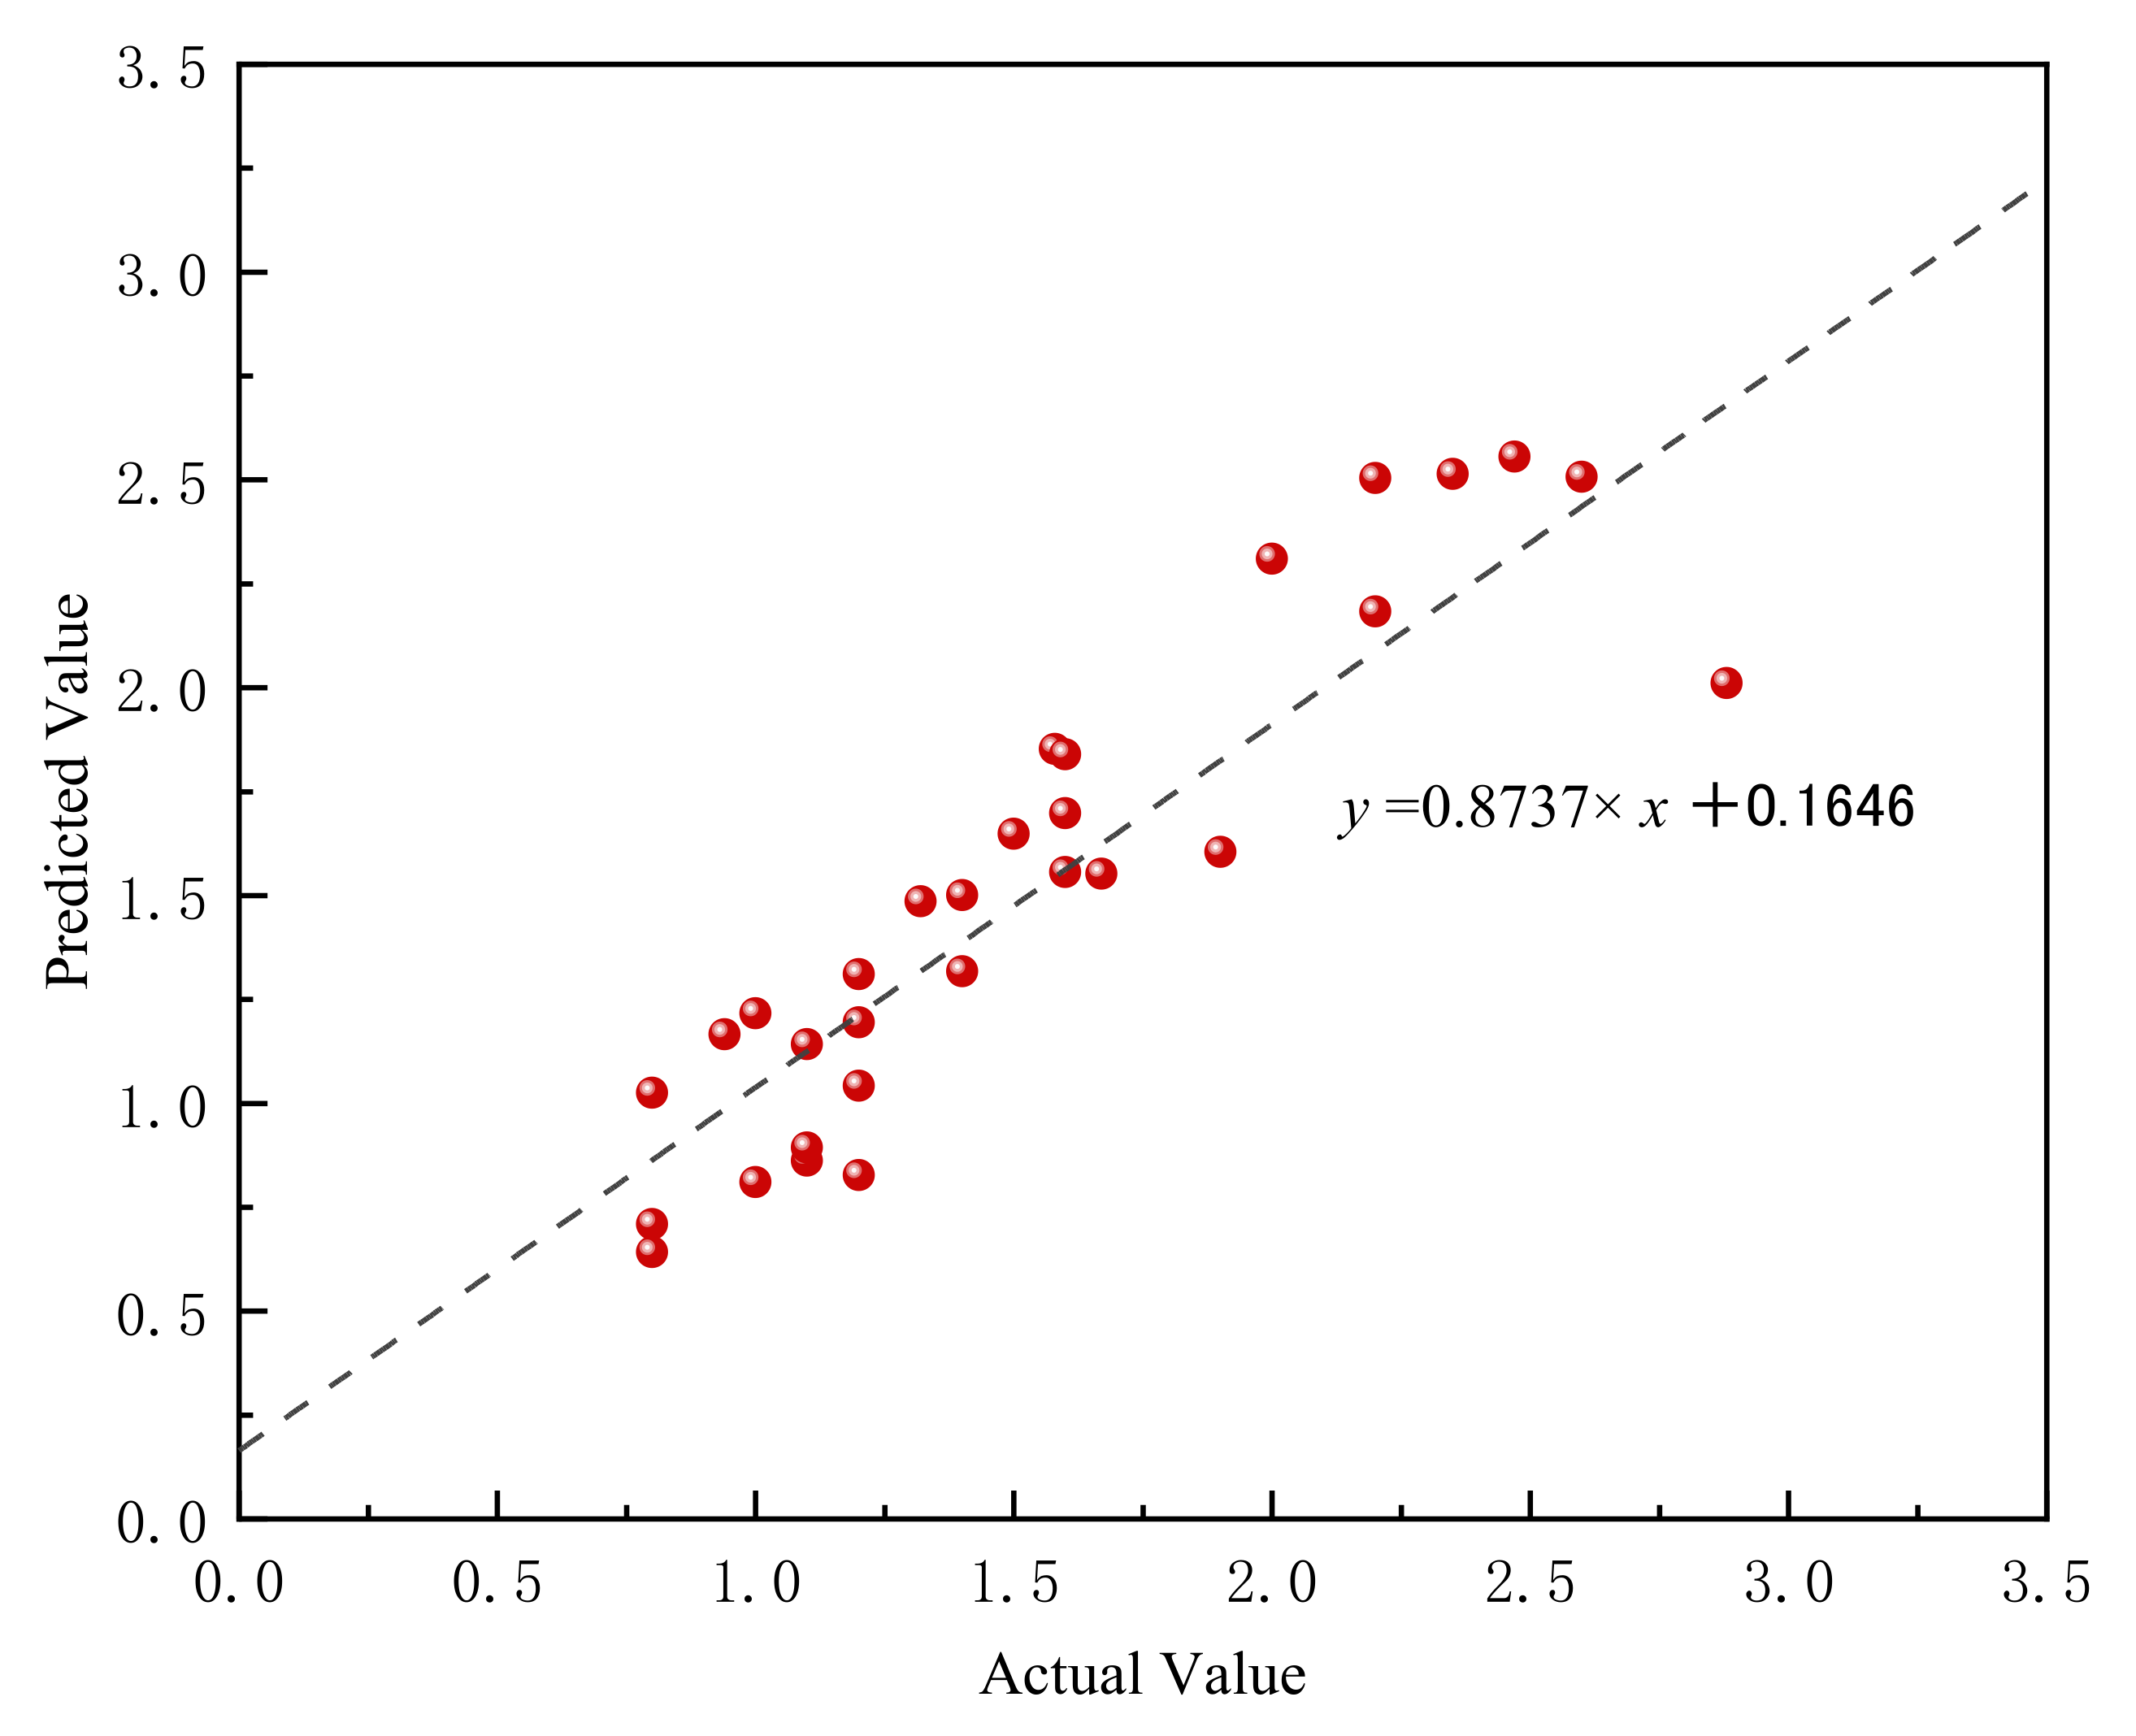
In addition, the predicted and actual values of each model were compared, as shown in
Figure 20. In the figure, it can be seen that the predicted results of the SSA-BPNN model were closer to the actual value. Combined with the scoring principle, we determined that the SSA-BPNN model had the highest accuracy.
In order to further verify the reliability of the proposed model, it was necessary to compare it with the empirical-formula method. Zhao et al. [
21] proposed an empirical formula to determine the thickness of an EDZ as follows:
where
is the unit weight of rock and
is the maximum horizontal principal stress.
This empirical formula adopts six indicators, such as
,
,
,
,
, and
. Because some of its indicators are the same as those in this study, this empirical formula could be adopted to compare with the proposed model. The data in reference [
21] were used to evaluate the predictive performance, and the predicted results are shown in
Table 6. It can be seen that the overall prediction performance of the SSA-BPNN model was better than that of the empirical formula.
Although the proposed models could obtain satisfactory results, there were still some limitations:
- (1)
The dataset of EDZ cases was relatively small. The accuracy of a regression model heavily relies on the quantity and quality of the dataset. If the dataset is small, the model may overfit, which will affect its generalization and reliability. Although this study integrated most of the cases in the existing literature, the dataset was still relatively small. Therefore, establishing a more comprehensive EDZ database would be helpful to predict the thickness of an EDZ more efficiently using the proposed models.
- (2)
Only four indicators were selected for the thickness prediction of an EDZ. Due to the complexity of EDZ formation, the thickness of an EDZ is affected by various factors. Other indicators, such as the roadway shape, the presence of underground water, and the excavation method, may also have influences on the prediction results. Therefore, it is necessary to investigate the influences of more indicators in the future.
6. Conclusions
Determining the thickness of an EDZ is a crucial issue in the design of roadway support. This study proposed SSA-BPNN, SSA-ENN, and SSA-SVR models for the thickness prediction of EDZ. A dataset including 209 cases from 34 mines was collected to establish the predictive models. An SSA was used to optimize the parameters of the BPNN, ENN, and SVR models. MAE, R2, NSC, MAPE, Theil’s U value, RMSE, and SSE were used to evaluate model performance. According to these index values, the ranking result of each model was determined to be: SSA-BPNN > SSA-ENN > SSA-SVR > BPNN > ENN > SVR. Overall, the SSA improved the predictive performance of the traditional BPNN, ENN, and SVR models. The proposed models obtained satisfactory results and were more suitable for the thickness prediction of an EDZ. The SSA-BPNN model had the best comprehensive performance. The MAE, R2, NSC, MAPE, Theil’s U value, RMSE, and SSE were 0.1246, 0.9277, −1.2331, 8.4127%, 0.0084, 0.1636, and 1.1241, respectively. The prediction results provided an important reference for the determination of EDZ thickness.
In the future, a more comprehensive and higher-quality EDZ database should be developed. In addition, it is necessary to analyze the influences of other indicators, especially the excavation method, on the prediction results. Considering the complexity of an EDZ, other swarm-intelligence or ML algorithms can be used for comparison.


