Article

Evaluation Method of Highway Plant Slope Based on Rough Set Theory and Analytic Hierarchy Process: A Case Study in Taihang Mountain, Hebei, China

School of Civil and Transportation Engineering, Hebei University of Technology, Tianjin 300401, China
*
Author to whom correspondence should be addressed.
Mathematics 2022, 10(8), 1264; https://doi.org/10.3390/math10081264
Submission received: 27 February 2022 / Revised: 7 April 2022 / Accepted: 9 April 2022 / Published: 11 April 2022
(This article belongs to the Special Issue New Trends in Fuzzy Sets Theory and Their Extensions)

Abstract

:
The material foundation of soil and water conservation is built on the integrity of the highway plant slope. The proportional relevance of the components that affect slope quality was evaluated based on an environmental assessment and the actual characteristics of the highway slope. A system of four major indexes and twelve secondary indexes comprising plant traits, geometric factors, hydrological conditions, and vegetation conditions was developed to assess the stability of roadway plant slopes. The rough set theory approach and the analytic hierarchy process were used to solve the weights of the slope evaluation indexes. Based on a rough set and an analytic hierarchy process, an evaluation model is proposed. The model eliminates the inconsistency and uncertainty in the evaluated factors that are used to calculate the slope. The study was conducted in China. The highway plant slope of the Taihang Mountain highway in the Hebei province was evaluated using the assessment model after dividing the highway plant slope stability into four grades. According to the evaluation results, the model can be used as a reference highway plant slope stability study and provide technical help to prevent and lower slope safety accidents. The evaluation model can predict the slope quality of highway plants, demonstrating the efficacy and reliability of the evaluation methodology and approach.

1. Introduction

The construction of traffic foundations has rapidly expanded in recent years, and a large number of highway slopes have been constructed. At present, the research on highways mostly focuses on highway tunnels, project management, tourism, construction, and safety [1]. There are some interesting possible directions that could be worth pursuing [2]. Highway construction produces different degrees of risk to the natural geological environment of mountainous areas, culminating in many exposed slopes that damage the region’s biological ecology [3]. The highway plant slope is a complex system project influenced by many factors, and once the slope is damaged, this will bring losses. In order to repair damaged slopes in highway construction projects or develop the ecosystem of slopes, it is necessary to study the environmental engineering of slopes in combination with the national requirements of ecological protection and soil and water conservation [4,5,6]. Moreover, the evolution of real-world biological systems usually suffers from unavoidable random perturbations in the natural environment [7]. The highway plant slope plays an essential role in maintaining the balance of the ecosystem in terms of soil formation and improvement, soil and water conservation, and the ecohydrology of slopes. However, there is still little research carried out in the field. The study of highway plant slope covers geotechnical engineering, atmospheric science, soil science, botany, microbiology, and other aspects and is gradually becoming a new field with an interdisciplinary nature [8,9].
A damaged highway plant slope is a problem that can cause damage to civil infrastructure. However, there are few studies on highway plant slope evaluation. Therefore, it is crucial to conduct a scientific and reasonable slope evaluation. Existing studies demonstrate that the slope stability evaluation methods are qualitative, quantitative, and nonlinearity. Qualitative evaluations are based on a geological investigation and evaluation of the stability of slopes from a qualitative perspective by analyzing the factors influencing the stability of slopes and the existing damage characteristics. The nonlinear analysis uses mathematical calculation methods, such as a neural network evaluation, gray clustering evaluation, paradigm inference evaluation, fuzzy synthesis evaluation, reliability evaluation, and many regression evaluations [10]. In prior studies, many academics have studied each element that affects slope evaluation using principal component analysis, the expert questionnaire survey method, the hierarchical analysis method, and the entropy weighting method. The effectiveness of these methods needs to be further improved.
Furthermore, the rating of a highway plant slope is fuzzy and uncertain. The rough set theory has a unique advantage in dealing with fuzzy and uncertain problems. The rough set method and analytic hierarchy process have recently received considerable interest in the fields of physics, mechanics, and other dynamical areas [11]. As a new data analysis theory, the rough set theory is a powerful tool for dealing with uncertainty problems. It has been widely used in data mining, machine learning, artificial intelligence, and pattern recognition. Rough set theory and its applications are a relatively young discipline, and it has been more than four decades since Pawlak Z introduced the concept of rough sets in 1982 [12]. Since then, the rough set method has been further refined. Rough sets are capable of handling large amounts of incomplete and imprecise data. In practical applications, combining rough sets with various classification methods to extract useful information faster and more accurately is a future research hotspot [13]. Dai et al. [14] studied fuzzy rough sets in attribute reduction. Xue et al. [15] established the extension prediction model for slopes and studied the entropy weight method and rough set. Charles et al. [16] studied the theory and mechanism of vegetation interactions and pointed out that plants can improve the stability of slopes under rainfall conditions.
Highway plant slope evaluation uses basic disciplines such as solid mechanics, geomechanics, fracture mechanics, and computational mechanics. However, it also needs to introduce and absorb theories from multiple disciplines. Some results were achieved by using the rough set theory and analytic hierarchy process (AHP) for highway plant slope evaluation [17]. This paper aims to introduce a slope evaluation method based on rough set and AHP [18]. In order to make full use of highway slope resources to reasonably determine the stability of the slope, the slope evaluation should be scientific and reasonable.
The Taihang Mountain is a Chinese mountain range running down the eastern edge of the Loess Plateau in Shanxi, Henan, and Hebei provinces, as shown in Figure 1 [19]. Our study aims to find a more suitable evaluation model for the highway plant slope of Taihang Mountain.
The highway plant slope is constrained on many levels and uses different factors, and the degree of influence of each component on the slope varies. As a result, establishing a slope evaluation index system that meets the actual situation of the study area, determining the weights of each influencing factor, and constructing a suitable evaluation mathematical model is an essential foundation for ensuring the reliability of evaluation results.
In order to evaluate and grade the ecological slopes of highways, the determination of index weights in the evaluation model uses a combination of subjective weights and objective weights, which can overcome the shortcomings of a single method. To ensure the accuracy of the slope stability evaluation, the weight value of each evaluation index must be accurately determined. The rough set theory is based on the original data. This can overcome the shortcomings of the human subjective determination of weights and can genuinely discover the importance of the evaluation indexes to the stability of slopes. Therefore, the rough set theory is used in this research. A variety of factors need to be considered when evaluating the stability of slopes. Slope instability results from the continuous evolution of the interaction of geological and environmental conditions in a specific area. A variety of factors need to be considered when evaluating the stability of slopes [20].
Due to the importance of plant slope in the environment and civil infrastructure, the evaluation of plant slope is of great significance for the highway. The objective of this paper is to develop an evaluation model to evaluate the highway plant slope. It is also essential to consider a new model for evaluating highway plant slope. The applied rough set will open up new ways to break through the difficulties in slope evaluation. A new model for evaluating highway plant slope grades is proposed on the basis of the rough set and AHP. Based on the research plant slopes in the Handan section of the Taihang Mountain highway in the Hebei province, the article established a highway plant slope evaluation model that combined subjective and objective methods, a model based on rough set theory and analytic hierarchy process. This model can consider the differences and discrete degrees between data and the influence of expert experience, ecological environment, soil, water conservation, and other factors.

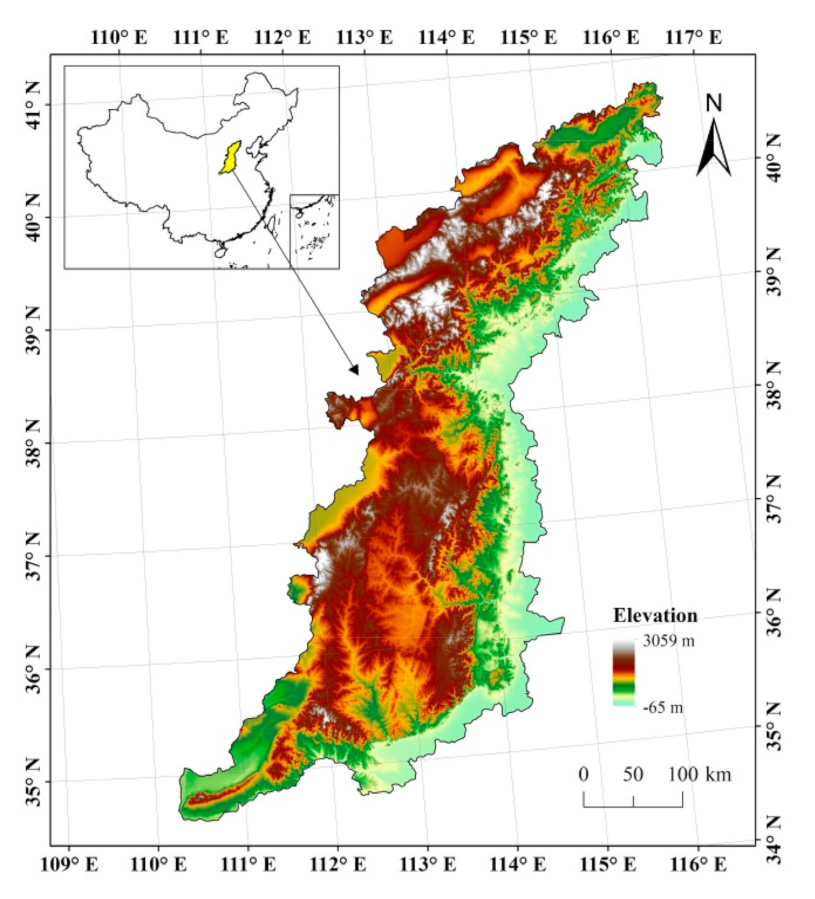
2. Study Site Description

Based on the current research results, the slope is an integral part of the highway and plays a vital role in protecting roadbeds and ensuring traffic safety. Green highway plant slope protection is a popular environmental and ecological slope protection method. Green highway plant slope protection can prevent the slope surface from being exposed, slow down soil erosion, reduce rain erosion, reduce the wind and sunshine that reach the slope, and purify the air. The soil conditions of the slope are indispensable for plant growth. Based on a summary of the existing literature, field survey statistics were conducted on the relevant requirements of the Handan section of Taihang Mountain Highway in Hebei Province. When considering the influence of soil environment on soil loss, the slopes in the areas of the Tuling interchange, Shangjiaoji parking area, and Linglow tunnel in the Handan section of Taihang Mountain Highway were studied from three dimensions, slope gradient, slope defects, and geological environment, as shown in Table 1. Taihang Mountain Highway is located in a mountainous area with vegetation, rainfall, deep valleys, and hills. According to the vegetation survey in July 2018, arbor species in the region mainly include platycladus orientalis, pinus tabulaeformis, ziziphus jujuba, ailanthus altissima, robinia pseudoacacia, haloxylon amabilis, betula platyphylla, populus canadensis, hawthorn, walnut, torch tree, etc. Shrubs mainly include vitex negundo, Lespedeza bicolor, rosa xanthina, forsythia suspense, euonymus japonicus, and hippophae rhamnoides herbs, mainly including artemisia, bermudagrass, wild grass, tall fescue, fine handle grass, chamomile, and elymus [21].
The studied highway plant slope is located in the Handan section of Taihang Mountain Highway in Hebei Province, with coordinates from 114.10, 36.83 to 113.88, 36.35; elevation from 503 m to 586 m; pressure from 94 KPa to 98 KPa. Handan is a warm, temperate, continental monsoon climate. Through the analysis of rainfall in the region, rainfall is concentrated in July and August. The monthly average maximum rainfall is 140 mm. The average annual precipitation is 510.5 mm, and the average precipitation in the flood season (June and September) is 373 mm, accounting for 73% of the total annual precipitation.

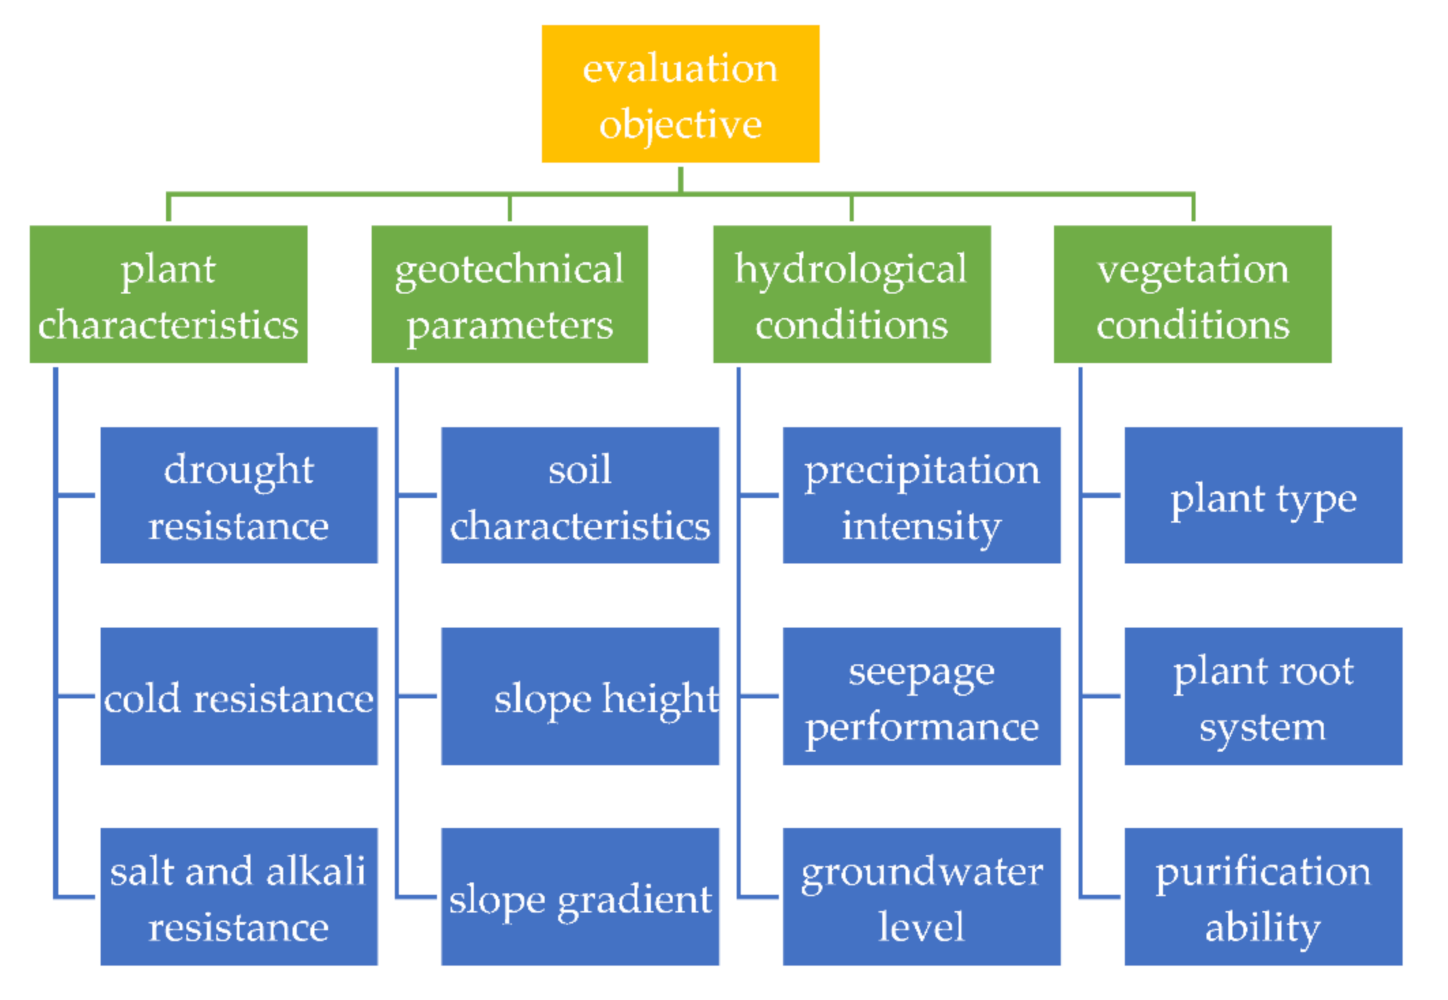
3. Construction of Performance Evaluation Index System of the Slope

The soil condition of the slope and the ecological environment of the slope have their own characteristics, and the research on highway plant slopes needs to be further developed and improved. Grass planting decreases the kinetic energy of raindrops, slows the water flow rate, and improves the shear strength of soils with deep penetrating roots [22]. Many techniques have proven effective for gully prevention and control, including vegetation cover [23]. The ground cover showed the most capacity to conserve water and soil at slopes between 10 and 15°, with a tendency to lose effectiveness when field slopes were greater than 15° [24]. The development of highway plant slope is affected by many factors, such as topography, geomorphology, geotechnical characteristics, and hydrogeology [25].
Based on careful consideration of the overall performance of the slope, a set of performance evaluation index systems suitable for the slope’s characteristics is proposed. Some experts and scholars have conducted extensive and in-depth research on slopes at home and abroad [26]. The methods used to study common slopes are fuzzy theory, particle swarm, entropy power, finite element, discrete element, neural network, etc. These methods vary, and the considered influencing factors are different. AHP is one of the most popular methods. Kubler et al. [27] used the Fuzzy AHP method to effectively evaluate highway slope stability during operation. There are not many methods that can be used to study ecological slope stability. Nadi et al. [28] studied the ecological slope stability of solid soil structures by conducting a foot-rule test model of slopes. Ponti et al. [29] studied the soil consolidation mechanism and the displacement of ecological slopes based on the morphological characteristics of plant roots using fractal theory. Prakasam et al. [30] looked at the stability of road slopes through model tests of natural rainfall. These research slope studies [31] used various methods and different influencing factors, but few studies have been conducted on highway plant slope stability.
Several factors may affect the highway plant slope. Few studies examine the effect of plant species on soil and water losses [32]. Relatively fewer studies have been conducted on the soil erosion problems of highway construction [33]. Plants influence hydrological and erosional processes [15]. The developed vegetation reduces soil erosion and surface runoff [34]. It has been shown that soil loss linearly depends on rainfall intensity and slope inclination [35]. One study examined the effects of clover (Trifolium repens) and oats (Avena sativa) on interrill erosion. Vegetation has a significant impact on the soil erosion rate [36]. Soil loss is significantly correlated to slope [37]. Runoff and soil erosion evaluations under different soil covers and plant species are paramount to properly managing ecosystems. Some scholars examined the effects of plant roots on soil’s physical properties and the amounts of runoff. In the Sierra de Enguera shrubland, 92% of soil erosion is caused by rainfall events [32]. The rainfall intensity significantly affected runoff on the slope, and the runoff showed an increasing trend as the rainfall intensity and slope gradient increased. The results showed that the runoff per unit area was controlled by rainfall intensity on all tested plots. Rainfall intensity explained more than 98% of the runoff variation, and soil bulk density had a more significant effect on runoff than slope [4].
Research has confirmed that soil bulk density positively affects the runoff rate and the slope effect on runoff rate changes with rainfall intensity [33]. Soil erosion can be minimized by selecting a prevention method, considering the type of soil, because the prevention effect on soil erosion is different depending on the type of soil. The slope angle effectively reduces the runoff of coarse contents, and the soil compaction effectively minimizes that of acceptable ranges. Forest melioration and alkaline slope erosion in the Lugansk region (south-eastern Ukraine) are helped by creating soil-protective legumes and grass crops on the slopes [32]. The metal mesh strengthens the stability of the slope. The fixation function of plant roots gradually replaces metal mesh, and the main factors affecting this process include soil contents, soil electrochemical properties, and soil bacteria [38]. Slop protection of concrete is used for its large scale and high construction efficiency. This takes the ecological system’s protection into account. Ecological concrete revetment can properly combine slope sclerosis with green areas. The revetment of a hexagonal concrete tile is suitable, with excellent resistance to water washing and good soil-fixing abilities [39]. Twill weave geomesh is preferred over silty clay loam at lower and medium slope angles [40]. The most common means of reinforcing slopes is the use of geosynthetics [41]. Geosynthetic erosion mats are widely used to control erosion processes in slopes [26]. Furthermore, the groundwater table’s height in the soil slope is critical for stability [21,42].
Based on a summary of the existing domestic, an evaluation index system was established. The system takes the four dimensions of plant characteristics, geotechnical parameters, hydrological conditions, and vegetation conditions as the first-level indicators, and 12 main indicators of drought resistance, cold resistance, salt and alkali resistance, soil characteristics, slope height, slope gradient, precipitation intensity, seepage performance, groundwater level, plant type, plant root system and purification ability as the second-level indicators. Figure 2 shows the performance evaluation index system. This system served as a reference when regulating engineering practice or similar events [43].
The flowchart of the application of rough set theory and analytic hierarchy process is shown in Figure 3. The main steps are shown as follows:
Step 1: Highway plant slope investigation and analyzing the conditions of the slope.
Step 2: Evaluation indicator preparation and determining the index system.
Step 3: The rough set theory is employed in the proposed flowchart. Adopt the rough set method to determine the objective weight of each classification index attribute. Highway plant slope data should be processed. Establish the classification interval table of comparison criteria. Calculate the conditional attribute and the decision attribute values. Determine the weight values of each slope assessment index.
Step 4: The AHP is employed in the proposed flowchart. Adopt the AHP to determine the subjective weight of each evaluation index. Establish the judgment matrix. Calculate the feature vectors and then normalize them to obtain the weight of each index.
Step 5: Integrating the rough set method and AHP and calculating the comprehensive weight based on the rough set and AHP. Combining subjective and objective weights can make the evaluation results more comprehensive and reasonable. The paper obtains comprehensive weight.
Step 6: Establishment of the extension evaluation model. The paper establishes the evaluation model of a highway plant slope using the extension evaluation method.
Step 7: According to the maximum certainty principle, the evaluation grade of the slope is divided. Finally, evaluate a case of highway plant slope. We will study more methods in future studies.
The index weight determination and evaluation model can provide some references for future evaluations of highway plant slope [44,45].

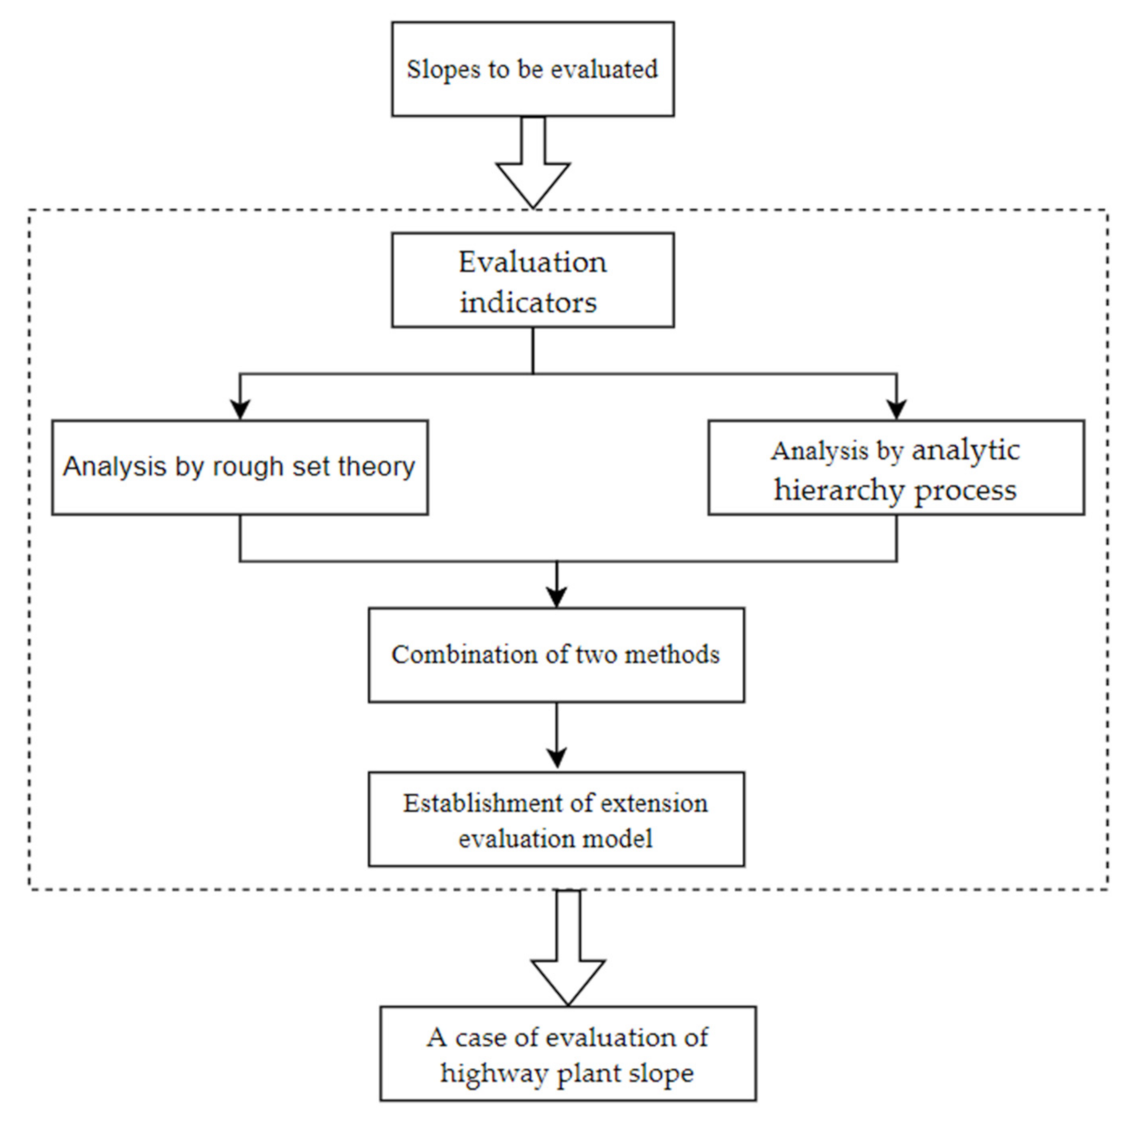
4. Construct the Evaluation Model of Highway Plant Slope

The index weight plays a very important role in the evaluation of target objects. To achieve this, it is essential to appropriately determine the weight of each evaluation indicator to assure the accuracy of the slope evaluation results. The amount of information obtained is a significant factor in the assessment of decision-making accuracy when evaluating decision-making.

4.1. Calculation Steps of Rough Set Theory

The rough set theory (RS) is a novel data analysis theory proposed in 1982 by Polish mathematician Z. Pawlak to cope with ambiguous and uncertain knowledge. It can effectively analyze and deal with various types of incomplete information, such as imprecision, inconsistency, and incompleteness, without providing any a priori information other than the dataset and directly discover the potential laws of the data from a set of descriptions of a given problem, making it particularly suitable for data-mining in complex systems.
In order to calculate the indicator weights, the weight value of each assessment indication must be precisely determined for the findings of slope stability evaluation to be reliable. Rough set theory is used to calculate the index weights because it is based on real data, overcomes the drawbacks of human subjective weight determination, and can truly uncover the value of evaluation indexes for slope stability. S is the decision table format (U, C, D, V). U represents the thesis domain, which is a nonempty finite set; C represents the ensemble of conditional characteristics, and D represents the collection of decision attributes. Among them, CD =   , D   ,   R = C D represents a collection of attribute values. V denotes the set of all attribute value fields.
Assume R and U have an equivalence connection. Consider subset X, U/R of the domain U to be the set containing all R equivalence classes. R representative contains the R equivalence class for xU if P     R and P   .
This means that P belongs to an equivalence relation on U, which is denoted as ind (P). The set consisting of some subsets connected to the family of equivalence relations P in the argument domain U is denoted by U/ind(P). Assume the argument domain contains two equivalence relations, P and J, and define POSpJ as the P positive domain of J, where POSpJ =   x U / J P X , POSpJ denotes those in the argument domain U.
The decision information table S in the rough set is a collection of all the facts from this information system, as well as the importance of various assessment indicators. In the decision information decision table, C is different. Rough set theory can predict the change in decision attribute table S categorization after removing a specific characteristic C. If an attribute C is eliminated following a significant change in the information table categorization, this indicates that the attribute C is a more important attribute; however, it indicates that the attribute relevance is low. Given the significant differences in the original data values of different indicators, the single-factor indicators are quantified to facilitate data processing, in accordance with relevant national standards, industry norms, and existing research results, and combined with the geological and climatic characteristics of mountain roads, as shown in Table 2 [46,47,48,49,50,51,52].
The weight of indicators significantly impacts the slope stability evaluation results and is directly related to prediction accuracy. For example, the stability of slopes is determined by both internal and external influences, with the internal factor generally acting as the regulating factor. As an internal element, the mechanical qualities of the soil have a more significant influence on slope stability than other external factors, such as groundwater. The key to improving the accuracy of the evaluation method is to consider the degree of influence of different parameters while implementing the evaluation method for slope stability evaluation. The scores of these indicators were represented on diagrams, indicating the strengths and the weaknesses of plant traits in relation to erosion control. The scoring of plants based on these criteria was based on multi-criteria analysis.
The rough set theory generates the weight coefficients by determining the relevance of the evaluation item by analyzing the judgment technique without any a priori information. However, the simple application of rough set theory may not effectively express imprecise or uncertain problems. The index data must be discretized when calculating the evaluation index weights using rough set theory. According to the stability condition level of the slope, the decision attribute set is divided into four evaluation levels: very stable, stable, unstable, and severely unstable [49,50,51,52,53,54,55]. The classification is based on the genuine characteristics of the slope according to the four interval grades {C} of {1, 2, 3, 4}. The four interval grades’ corresponding range of values is [90, 100], [60, 90], [40, 60], and [0, 40], as shown in Table 3.
The decision attribute set {D} is divided into four classes {One, Two, Three, Four} according to the slope stability condition class, as shown in Table 4
The decision of index rating decision data is shown in Table 5. The 15 highway plant slopes investigated by the authors in the Taihang Mountains are indicated by U1–U15.
The formula for calculating the importance of an indicator is:
sig C i , C ; D = γ C i D γ C C i D = POS C D POS C C i D U
This denotes the relevance of the conditional attribute Ci in the set of conditional attributes C and the relevance of the conditional attribute Di in the set of conditional attributes D. It cannot reflect the importance of the conditional attributes in the system itself, and the conditional entropy method can compensate for this drawback, so the problem is solved by defining the conditional entropy, and the conditional entropy of the conditional attributes with respect to the decision attributes is
I D | C = i = 1 m | C | 2 | U | 2 j = 1 k D j C i C i 1 D j C i C i
The weight calculation formula for each secondary indicator is
w i = sig c i , C , D + I D | C i j = 1 n sig c j , C , D + I D | C j
The decision information is calculated according to the algorithm of this paper, which provides:
U D = u 1 , u 3 , u 9 , u 14 , u 2 , u 10 , u 12 , u 4 , u 5 , u 8 , u 11 , u 13 , u 15 , u 6 , u 7 U / C = u 1 , u 2 , u 3 , u 4 , u 5 , u 6 , u 7 , u 8 , u 9 , u 10 , u 11 , u 12 , u 13 , u 14 , u 15 U / C 1 = u 1 , u 2 , u 4 , u 5 , u 6 , u 7 , u 9 , u 11 , u 12 , u 13 , u 15 , u 3 , u 14 , u 8 , u 10 U / C C 1 = u 1 , u 6 , u 2 , u 3 , u 4 , u 5 , u 7 , u 8 , u 9 , u 10 , u 11 , u 12 , u 13 , u 14 , u 15 P O S C C 1 D = u 2 , u 3 , u 4 , u 5 , u 7 , u 8 , u 9 , u 10 , u 11 , u 12 , u 13 , u 14 , u 15
The rest is similar without further elaboration. Using Equations (1)–(3), the weight values of each slope assessment index are as follows:
0.0503, 0.0527, 0.0959, 0.0743, 0.0767, 0.0983, 0.0792, 0.0815, 0.1007, 0.1031, 0.0818, 0.1055.

4.2. Analytic Hierarchy Process Calculation Steps

In 1971, Professor Thomas L. Saaty of Pittsburgh University founded the analytic hierarchy process [53]. In the existing research, the analytic hierarchy process is commonly used to determine the weight and arrive at the final result. The analytic hierarchy process can be used to improve the weighting of evaluation indexes and more accurately determine the degree of importance of each. When this method is used for calculation, it can usually be carried out in four steps. The first step is to sort out complex problems, study the correlation between various factors of the problem content, and establish a hierarchical structure of system coordination. The second step is to establish a progressive level, construct a pairwise comparison judgment matrix, and assign values. The third step is the data processing and calculation of the relative weight of the completed matrix and the consistency test of the matrix. The fourth step is to derive the total ranking weight of each level.
The performance evaluation of the highway plant slope is considered the overarching goal. Based on the level analysis [56], we denoted this as A.
A = a i j n × n = a 11 a 1 n a n 1 a n n
When using the fuzzy mathematics theory method, the comparison standard shown in Table 6 can be obtained [56,57,58]. Traditional values two, four, six, and eight represent the intermediate values of two adjacent standard scale judgments.
If the matrix satisfies a i j > 0 and a i j = 1 / a j i , then A is a positive reciprocal matrix. In the comparison of two factors, if a common matrix A satisfies Formula (9):
a i j a j i = a i k ,   i , j , k = 1 , 2 , , n
then A is a consistency matrix. The sorting principle usually does not guarantee that the judgment matrix is a consistency matrix, and it is necessary to judge its consistency. Calculate the continuous product of each row of element data in the judgment matrix. When constructing a judgment matrix, if factor one is more important than factor two, factor two is more important than factor three, and factor three is more important than factor one, this violates common sense and requires a consistency test [54].
First, calculate the average random consistency index C 1
C 1 = λ max n n 1
If C 1 is not equal to 0, then the consistency ratio C R needs to be calculated
C R = C 1 R 1
If C R < 0.1 , the judgment matrix A satisfies consistency. Many quantitative models have been developed in the highway plant slope field to explore slope complexity. A judgment matrix whose value is not sufficient should be re-adjusted to solve the maximum eigenvalue, weight vector, consistency index, and consistency ratio of the constructed comparative judgment matrix until the consistency test is satisfied [55].

4.3. Weight Results of First-Level Indicators

We took plant characteristics A1, logistics geotechnical parameter A2, hydrological condition A3, and vegetation condition A4 as the first-level target layer. Twelve indicators, such as “soil characteristics” and “slope height,” represented by C, were used as the secondary target layer. By evaluating the relative importance of each indicator using the expert scoring method and generalizing the results by establishing an eigenvalue and eigenvector of each matrix, a consistency test could determine the largest eigenvalue for each level of indicators. The first-level index weight calculation results were obtained, as shown in Table 7. The consistency ratio was CR < 0.1. The calculation results of each weight were less than 0.1, so it can be determined that the total ranking of the judgment matrix level is consistent, and the judgment matrix does not need to be corrected [50].

4.4. Secondary Index Weight Results

We then determined the relative value of each indicator based on expert scoring and generalized the expert rankings. The eigenvalues and the corresponding eigenvectors of each matrix could then be determined and then subjected to a consistency test to determine their maximum eigenvalues. When combined with the sample data obtained from the survey, the weight of the secondary index was calculated using the above formula. Assume that the second-grade index weight matrix S obtained by the rough set theory method is {S1, S2, S3, S4, S5, S6, S7, S8, S9, S10, S11, S12}, and the index weight matrix B obtained by analytic hierarchy process is {B1, B2, B3, B4, B5, B6, B7, B8, B9, B10, B11, B12}. The product of the two matrices and the weight processing can obtain the coupling weight of the rough set theory method and the analytic hierarchy process, as shown in Table 8 [57].

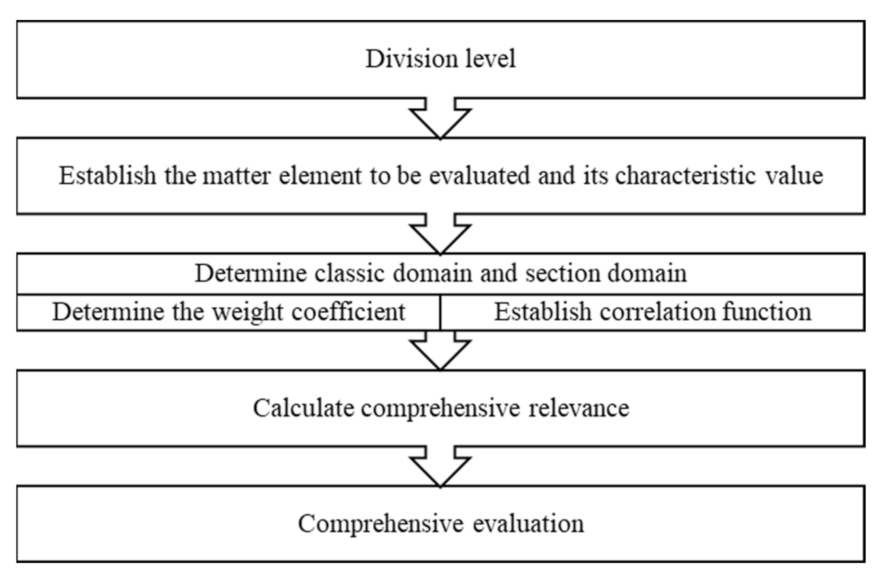
4.5. Establishment of Evaluation Model

Extension evaluation was founded by a Chinese scholar in the 1980s [56]. It is a new discipline formed of mathematics, philosophy, and engineering. The study integrates matter–element theory and extension set theory examines matter–elements and their changing trends, studies the laws of complicated issues quantitatively as well as qualitatively, and provides qualitative answers. The object element expansion evaluation model is usually divided into several levels. The degree of the items and the related level will be established in the collection of each level, and the larger the degree to which the objects are related to the specified level, the better the objects in the set fit. The primary purpose of the matter element is to describe the fundamental elements of things.
Suppose the plant slope is N, and its quantitative value is for features C and V. As a result, this ternary ordered group is known as the essential element of things, referred to as the matter element [59,60], denoted as R = (N, c, v), the matter element I = (d, c, v) and relation element Q = (a, c, v) (collectively referred to as the base element), serving as the basic element to describe matter, matter, and relation [32]. The matter element is the logical cell of extenics, and it is the basic element used to formally describe things, with R = (things, characteristics, values) = (N, c, v). In this essay, we suppose that the logistics service supply chain is R. Its performance can be measured using n parameters [58,61]. Therefore, according to a few previous studies, the matter–element matrix is as follows:
R = N , C , V = N c 1 v 1 c 2 v 2 c n v n
The assessment index system and extenics theory are discussed above. We are capable of establishing an extenics evaluation model of highway plant slope performance. The evaluation criteria of the highway plant slope of Taihang Mountain highway are divided into four evaluation grades. The seriousness of the highway plant slope increases step by step as the risk level proceeds from very stable to extremely unstable. Stable indicates that the slope can still function normally. Unstable indicates that some fault is present, and corresponding measures should be taken. Therefore, this paper adopts the comments set [56,58,59,61]:
M = {M1, M2, M3, M4} = {very stable, stable, unstable, to extremely unstable}
The correlation function is a method for analyzing a specific indicator in a highway plant slope performance evaluation model. The correlation degree of the evaluation grade of the evaluated highway plant slope is calculated by the correlation function, as shown in the following formula [59]:
K j v i = ρ v i , V j i V j i     v i V j i ρ v i , V j i ρ v i , V p i ρ v i , V j i   v i V j i   a n d   ρ v i , V j i 0 ρ v i , V j i 1     v i V j i   a n d   ρ v i , V j i = 0
ρ v i , V j i = v i a i j + b j i 2 b i j a j i 2
ρ v i , V p i = v i a i i + b p i 2 b i i a i i ˙ 2
where K j v i represents the correlation degree of each index in the evaluation process; ρ v i , V j i represents the distance between v i and the finite interval V j i ; ρ v i , V p i represents the distance between v i and the finite interval V p i ; V j i = a j i , b j i denotes the range of N j for any index defined in the index set C. a j i , b j i   denotes the lower limit and upper limit of the evaluation index c i in the j risk evaluation level. V j i denotes the b j i subtraction a j i . v i is the actual measurement value of N p with respect to the index c i , namely, the specific value of each evaluation index of the matter element R to be evaluated. The value of the i   i = 1 , 2 , , n   c i denotes the i evaluation index [55,57].
The weighted and summed correlation degrees between each assessment indicator and the grade standard of the highway plant slope, as described in the formula below, are used to compute the comprehensive correlation degree [56,60]:
K j R = i = 1 n W i K j v i
According to the comprehensive correlation degree [62,63], the evaluation grade of highway plant slope can be obtained according to the maximum principle.

5. A Case of Evaluation of Highway Plant Slope

According to the extension evaluation model of rough set theory hierarchy analysis that was established above, the highway plant slope of the highway in Taihang Mountain was evaluated. To determine the system analysis sequence, we can construct Figure 4 depending on the processes for the extension evaluation of highway plant slope performance discussed above.
Taihang Mountain highway plant slope height is 8 m; the side slope grade is 1:1.25. The soil from the slope was classified as calcaric regosols in the WRB reference system [64]. The soil is a form of Late Pleistocene Malan loess, classified as silty clay according to its grain size characteristics. The cohesion of soil is 13 KPa; the internal friction angle of soil is 0.72. The ecological slope is protected by geonet. Combined with the slope data obtained above and the coupling weights obtained by the formula, the comprehensive correlation degree {M1, M2, M3, M4} of the highway plant slope can be obtained as {−0.3564, −0.1529, −0.1797,−0.3308 } by using the extension model theory, and the maximum comprehensive correlation degree is −0.1529. Therefore, the evaluation grade of the slope is secondary. The entropy weight method (EWM) stands out as an excellent and well-studied approach [15]. Combined with the EWM approach, the comprehensive correlation degree {M1, M2, M3, M4} of the highway plant slope can be obtained as {0.0283, 0.0491, 0.0353, 0.0043} by using the extension model theory, and the maximum comprehensive correlation degree is 0.0491, the evaluation grade of the slope is secondary. The results show that the evaluated results agree with the practical slope, which implies that the proposed method is feasible and reliable.

6. Conclusions

In summary, the integration of rough set analysis, analytic hierarchy process, and extension evaluation can be regarded as a new research method used in highway plant slope. The development of roadway infrastructure is hampered by uncertainty and danger in the external environment. Most earlier highway plant slope rating indices were created by professionals who directly assigned weights, and this phenomenon was influenced by subjective variables. The evaluation index system of highway plant slope was studied in this article, and the weights of twelve indicators in the evaluation system were derived using rough set theory and analytic hierarchy process. This approach to generating the evaluation index weights overcomes the high subjectivity in the traditional complete evaluation of slopes.
The main goal of the current study was to evaluate the highway plant slope. The present contribution, combining the qualitative and quantitative indicators, is an applied science approach for the better management of the highway plant slope. Data processing was performed by combining qualitative research on highway slopes in the Taihang mountain area with learning about the rules of things that influence them to find solutions to complex issues by learning about the rules of things and their influencing forces. The established extension evaluation model was used to evaluate the highway plant slope in the Handan section of the Taihang Mountain highway, providing a future reference for evaluating the highway plant slope.
This new overall understanding opens opportunities for evaluation of highway plant slope based on the rough set theory and analytic hierarchy process. Although evaluation method of highway plant slope based on rough set theory and analytic hierarchy process achieved satisfactory results. However, this approach also has some subjective influence on calculating the discrete values. In the discretization of the rough set, a limitation of this study is that there were four discrete values. These discrete values have certain limitations. The evaluation of highway plant slope is based on data. All of the data used in this paper were obtained from statistics of the region being studied. Although this evaluation method based on rough set theory and analytic hierarchy process can provide a technical reference for the development and design of highway plant slope, the potential for discrete values has yet to be tapped.
In a future study, using more attributes should result in the ability to provide more indicators for the slopes. For future work, introduce the entropy weight method to evaluate the data based on discrete values. Combine other methods with the rough set method to extend the proposed methods to various other slopes in the future. Furthermore, it is necessary to continuously consider the slope from multiple aspects and perspectives to enrich the research topics continuously.

Author Contributions

Conceptualization, L.L.; methodology, L.L.; validation, L.L., Y.D. and J.Q.; formal analysis, L.L.; resources, Y.D. and J.Q.; data curation, L.L.; writing—original draft preparation, L.L. writing—review and editing, L.L.; project administration, L.L.; funding acquisition, Y.D. and J.Q. All authors have read and agreed to the published version of the manuscript.

Funding

This research was funded by the Ministry of Transportation Science and Technology Project, grant number 01804063.

Institutional Review Board Statement

Not applicable.

Informed Consent Statement

Not applicable.

Data Availability Statement

The figure and table data used to support the findings of this study are available from the corresponding author upon request.

Conflicts of Interest

The authors declare no conflict of interest.

References

  1. Pandit, D.; Kaushik, K.; Cirillo, C. Coupling National Performance Management Research Data Set and the Highway Performance Monitoring System Datasets on a Geospatial Level. Transp. Res. Rec. 2019, 2673, 583–592. [Google Scholar] [CrossRef]
  2. Al-Hmouz, R.; Pedrycz, W.; Awadallah, M.; Al-Hmouz, A. Fuzzy relational representation, modeling and interpretation of temporal data. Knowl.-Based Syst. 2022, 244, 108548. [Google Scholar] [CrossRef]
  3. Le, C.; Jeong, H.; Damnjanovic, I. Network Theory–Driven Construction Logic Knowledge Network: Process Modeling and Application in Highway Projects. J. Constr. Eng. Manag. 2021, 147, 04021114. [Google Scholar] [CrossRef]
  4. Koteleva, N.; Frenkel, I. Digital Processing of Seismic Data from Open-Pit Mining Blasts. Appl. Sci. 2021, 11, 383. [Google Scholar] [CrossRef]
  5. Mokarram, M.; Pourghasemi, H.; Tiefenbacher, J. Comparison analytic network and analytical hierarchical process ap-proaches with feature selection algorithm to predict groundwater quality. Environ. Earth Sci. 2019, 78, 625. [Google Scholar] [CrossRef]
  6. Sakkas, G.; Misailidis, I.; Sakellariou, N.; Kouskouna, V.; Kaviris, G. Modeling landslide susceptibility in Greece: A weighted linear combination approach using analytic hierarchical process, validated with spatial and statistical analysis. Nat. Hazards 2016, 84, 1873–1904. [Google Scholar] [CrossRef]
  7. Jia, W.; Xu, Y.; Li, D.; Hu, R. Stochastic Analysis of Predator–Prey Models under Combined Gaussian and Poisson White Noise via Stochastic Averaging Method. Entropy 2021, 23, 1208. [Google Scholar] [CrossRef]
  8. Alemu, M.; Birhanu Wubneh, Z.; Adugna Ayanaw, M. Antidiarrheal Effect of 80% Methanol Extract and Fractions of the Roasted Seed of Coffea arabica Linn (Rubiaceae) in Swiss Albino Mice. Evid.-Based Complementary Altern. Med. 2022, 2022, 9914936. [Google Scholar] [CrossRef]
  9. Liu, W.; Yan, X.; Huang, S.; Yang, C.; Wang, G. Advanced Control for Singular Systems with Applications. Math. Probl. Eng. 2018, 2018, 1819540. [Google Scholar] [CrossRef]
  10. Chen, Z.S.; Liu, X.L.; Chin, K.S.; Pedrycz, W.; Tsui, K.L.; Skibniewski, M.J. Online-review analysis based large-scale group decision-making for determining passenger demands and evaluating passenger satisfaction: Case study of high-speed rail system in China. Inf. Fusion 2021, 69, 22–39. [Google Scholar] [CrossRef]
  11. Pham, V.; Volos, C.; Jafari, S.; Kapitaniak, T. Coexistence of hidden chaotic attractors in a novel no-equilibrium sys-tem. Nonlinear Dyn. 2016, 87, 2001–2010. [Google Scholar] [CrossRef]
  12. Pawlak, Z. Rough sets. Int. J. Comput. Inf. Sci. 1982, 11, 341–356. [Google Scholar] [CrossRef]
  13. Pawlak, Z.; Skowron, A. Rudiments of rough sets. Inf. Sci. 2007, 1, 3–27. [Google Scholar] [CrossRef]
  14. Dai, J.; Hu, H.; Wu, W.; Qian, Y.; Huang, D. Maximal-Discernibility-Pair-Based Approach to Attribute Reduction in Fuzzy Rough Sets. IEEE Trans. Fuzzy Syst. 2018, 26, 2174–2187. [Google Scholar] [CrossRef]
  15. Xue, Y.; Liu, H.; Bai, C.; Su, M.; Qiu, D.; Zhou, B.; Yu, Y.; Jiang, X. Extension prediction model of soft rock tunnel deformation grade based on entropy weight method and rough set. Environ. Earth Sci. 2021, 81, 24. [Google Scholar] [CrossRef]
  16. Charles, W.N. Atmosphere-plant-soil interactions: Theories and mechanisms. Chin. J. Geotech. Eng. 2017, 39, 1–47. [Google Scholar] [CrossRef]
  17. Qiao, J.; Sun, X. Extension Stability Evaluation Model of Soil-rock Mixture Slope of Mountain Roads Based on Rough Set Weighting. J. Beijing Univ. Technol. 2020, 46, 508–514. [Google Scholar] [CrossRef]
  18. Abu-Gdairi, R.; El-Gayar, M.A.; Al-shami, T.M.; Nawar, A.S.; El-Bably, M.K. Some Topological Approaches for Generalized Rough Sets and Their Decision-Making Applications. Symmetry 2022, 14, 95. [Google Scholar] [CrossRef]
  19. Geng, S.; Shi, P.; Zong, N.; Zhu, W. Using Soil Survey Database to Assess Soil Quality in the Heterogeneous Taihang Mountains, North China. Sustainability 2018, 10, 3443. [Google Scholar] [CrossRef] [Green Version]
  20. Volpe, E.; Ciabatta, L.; Salciarini, D.; Camici, S.; Cattoni, E.; Brocca, L. The Impact of Probability Density Functions Assessment on Model Performance for Slope Stability Analysis. Geosciences 2021, 11, 322. [Google Scholar] [CrossRef]
  21. Theocharis, A.I.; Zevgolis, I.E.; Deliveris, A.V.; Karametou, R.; Koukouzas, N.C. From Climate Conditions to the Numerical Slope Stability Analysis of Surface Coal Mines. Appl. Sci. 2022, 12, 1538. [Google Scholar] [CrossRef]
  22. Wu, L.; Liu, X.; Yu, Y.; Ma, X. Biochar, grass, and cross-ridge reshaped the surface runoff nitrogen under consecutive rainstorms in loessial sloping lands. Agric. Water Manag. 2022, 261, 107354. [Google Scholar] [CrossRef]
  23. Valentin, C.; Poesen, J.; Li, Y. Gully erosion: Impacts, factors and control. CATENA 2005, 63, 132–153. [Google Scholar] [CrossRef]
  24. Liu, R.; Thomas, B.; Shi, X.; Zhang, X.; Wang, Z.; Zhang, Y. Effects of ground cover management on improving water and soil conservation in tree crop systems: A meta-analysis. CATENA 2021, 199, 105085. [Google Scholar] [CrossRef]
  25. Tong, D.; Tan, F.; Ma, B.; Jiao, Y.-Y.; Wang, J. A Suitability Evaluation Method of Urban Underground Space Based on Rough Set Theory and Conditional Entropy: A Case Study in Wuhan Changjiang New Town. Appl. Sci. 2022, 12, 1347. [Google Scholar] [CrossRef]
  26. da Luz, M.P.; Aparicio Ardila, M.A.; dos Santos Junior, R.D.; Valentin, C.A.; Schliewe, M.S.; Coelho, A.T.; Lins da Silva, J. Geomats Used to Control Erosion on Reservoir Margins in Brazilian Hydroelectric Power Plants. Water 2021, 13, 1444. [Google Scholar] [CrossRef]
  27. Kubler, S.; Robert, J.; Derigent, W.; Voisin, A.; Le Traon, Y. A state-of the-art survey & testbed of fuzzy AHP (FAHP) appli-cations. Expert Syst. Appl. 2016, 65, 398–422. [Google Scholar] [CrossRef]
  28. Nadi, B.; Askari, F.; Farzaneh, O.; Fatolahzadeh, S.; Mehdizadeh, R. Reliability Evaluation of Regression Model for Estimating Co-seismic Landslide Displacement. Iran. J. Sci. Technol. Trans. Civ. Eng. 2020, 44, 165–173. [Google Scholar] [CrossRef]
  29. Ponti, S.; Cannone, N.; Guglielmin, M. A new simple topo-climatic model to predict surface displacement in paraglacial and periglacial mountains of the European Alps: The importance of ground heating index and floristic components as ecological indicators. Ecol. Indic. 2021, 120, 106889. [Google Scholar] [CrossRef]
  30. Prakasam, C.; Aravinth, R.; Nagarajan, B.; Kanwar, V.S. Site-specific geological and geotechnical investigation of a debris landslide along unstable road cut slopes in the Himalayan region, India. Geomat. Nat. Hazards Risk 2020, 11, 1827–1848. [Google Scholar] [CrossRef]
  31. Li, B.; Li, T.; Xu, N.; Dai, F.; Chen, W.; Tan, Y. Stability assessment of the left bank slope of the Baihetan Hydropower Station, Southwest China. Int. J. Rock Mech. Min. Sci. 2018, 104, 34–44. [Google Scholar] [CrossRef]
  32. Cerdà, A.; Lucas-Borja, M.; Franch-Pardo, I.; Úbeda, X.; Novara, A.; López-Vicente, M.; Popović, Z.; Pulido, M. The role of plant species on runoff and soil erosion in a Mediterranean shrubland. Sci. Total Environ. 2021, 799, 149218. [Google Scholar] [CrossRef] [PubMed]
  33. Dong, J.; Zhang, K.; Guo, Z. Runoff and soil erosion from highway construction spoil deposits: A rainfall simulation study. Transp. Res. Part D Transp. Environ. 2012, 17, 8–14. [Google Scholar] [CrossRef]
  34. Xu, Y.-Q.; Jin, L.-S.; Chen, Z.-S.; Yager, R.R.; Špirková, J.; Kalina, M.; Borkotokey, S. Weight Vector Generation in Multi-Criteria Decision-Making with Basic Uncertain Information. Mathematics 2022, 10, 572. [Google Scholar] [CrossRef]
  35. Sobol, N.; Gabbasova, I.; Komissarov, M. Effect of rainfall intensity and slope steepness on the development of soil erosion in the Southern Cis-Ural region (A model experiment). Eurasian Soil Sci. 2017, 50, 1098–1104. [Google Scholar] [CrossRef]
  36. Shinohara, Y.; Otani, S.; Kubota, T.; Otsuki, K.; Nanko, K. Effects of plant roots on the soil erosion rate under simulated rainfall with high kinetic energy. Hydrol. Sci. J. 2016, 61, 2435–2442. [Google Scholar] [CrossRef] [Green Version]
  37. Durán Zuazo, V.; Rodríguez Pleguezuelo, C. Soil-erosion and runoff prevention by plant covers. A review. Agron. Sustain. Dev. 2008, 28, 65–86. [Google Scholar] [CrossRef] [Green Version]
  38. Chen, J.; Ai, S.; Liu, J.; Yang, H.; Wang, L.; Zhu, M.; Fu, D.; Yang, S.; Ai, X.; Ai, Y. The life span and influencing factors of metal mesh in artificial soil on railway rock-cut slopes in humid areas. Sci. Total Environ. 2019, 671, 41–51. [Google Scholar] [CrossRef]
  39. Xing, Z.; Wang, Y.; Zong, Q. Test of Ecological Riverbank Protection with Concrete. Appl. Mech. Mater. 2013, 438–439, 194–196. [Google Scholar] [CrossRef]
  40. Verma, S.; Midha, V.; Choudhary, A. Runoff erosion control performance of structurally modified coir geomeshes on different soil type and slope angle. J. Nat. Fibers 2021, 1–13. [Google Scholar] [CrossRef]
  41. Rossi, N.; Bačić, M.; Kovačević, M.S.; Librić, L. Fragility Curves for Slope Stability of Geogrid Reinforced River Levees. Water 2021, 13, 2615. [Google Scholar] [CrossRef]
  42. Kleyner, A. Effect of field stress variance on test to field correlation in accelerated reliability demonstration testing. Eng. Int. 2015, 31, 783–788. [Google Scholar] [CrossRef]
  43. Wei, X.; Fan, X.; Li, F.; Liu, X.; Liang, L.; Li, Q. Uncertainty analysis of hydraulic fracture height containment in a layered formation. Environ. Earth Sci. 2018, 77, 664. [Google Scholar] [CrossRef]
  44. Zhou, J.; Zhang, B.; Tan, R.; Tseng, M.-L.; Lin, R.C.-W.; Lim, M.K. Using Neighborhood Rough Set Theory to Address the Smart Elderly Care in Multi-Level Attributes. Symmetry 2020, 12, 297. [Google Scholar] [CrossRef] [Green Version]
  45. Ouma, Y.O.; Tateishi, R. Urban Flood Vulnerability and Risk Mapping Using Integrated Multi-Parametric AHP and GIS: Methodological Overview and Case Study Assessment. Water 2014, 6, 1515–1545. [Google Scholar] [CrossRef]
  46. Ministry of Transport of the People’s Republic of China. Specifications for Design of Highway Subgrades: JTG D30-2004; China Communications Press: Beijing, China, 2004.
  47. Casquilho, J. A methodology to determine the maximum value of weighted Gini–Simpson index. SpringerPlus 2016, 5, 1143. [Google Scholar] [CrossRef] [Green Version]
  48. Chen, X.; Luo, G. Grey system analysis and evaluation of slope stability based on experience. Chin. J. Geotech-Nical Eng. 1999, 21, 34–44. [Google Scholar]
  49. Gu, X.; Wu, S.; Ji, X.; Zhu, Y. The Risk Assessment of Debris Flow Hazards in Banshanmen Gully Based on the Entropy Weight-Normal Cloud Method. Adv. Civ. Eng. 2021, 2021, 8841310. [Google Scholar] [CrossRef]
  50. Rodríguez, R.M.; Labella, Á.; Nuñez-Cacho, P.; Molina-Moreno, V.; Martínez, L. A comprehensive minimum cost consensus model for large scale group decision making for circular economy measurement. Technol. Forecast. Soc. Change 2022, 175, 121391. [Google Scholar] [CrossRef]
  51. Liu, L.; Qiao, J.; Dou, Y. Tensile performance of PE-HD vegetation net and single-layer geonet. Eng. Plast. Appl. 2021, 49, 110–114. [Google Scholar] [CrossRef]
  52. Ulén, B.; Aronsson, H.; Bechmann, M.; Krogstad, T.; Øygarden, L.; Stenberg, M. Soil tillage methods to control phosphorus loss and potential side-effects: A Scandinavian review. Soil Use Manag. 2010, 26, 94–107. [Google Scholar] [CrossRef]
  53. Saaty, T.L. How to Make a Decision Analytic Hierarchy Process. Eur. J. Oper. Res. 1990, 48, 9–16. [Google Scholar] [CrossRef]
  54. Nurnaini, R.; Wijayanto, D.; Fitri, A. Analysis of small-scale fish handling development in rembang waters. Russ. J. Agric. Socio-Econ. Sci. 2019, 90, 130–134. [Google Scholar] [CrossRef]
  55. Hu, C.; Ma, Y.; Chen, T. Application on Online Process Learning Evaluation Based on Optimal Discrete Hopfield Neural Network and Entropy Weight TOPSIS Method. Complexity 2021, 2021, 2857244. [Google Scholar] [CrossRef]
  56. Cai, W. Matter-Element Analysis; Guangdong Higher Education Press: Guangzhou, China, 1987. [Google Scholar]
  57. Saaty, T.L. Decision Making with the Analytic Hierarchy Process. Int. J. Serv. Sci. 2008, 1, 83–98. [Google Scholar] [CrossRef] [Green Version]
  58. Cheng, J.; Yang, Q.; Lu, L. Study on Performance Evaluation of Service Supply Chain by Extension Method. Discret. Dyn. Nat. Soc. 2021, 2021, 1223577. [Google Scholar] [CrossRef]
  59. Xiaoxiao, L.; Zhengnan, H.; Ming, T.; Shengxian, Z. Engineering Internal Control Analysis Based on AHP-FCE Taking Wind Power Enterprise as an Example. E3S Web Conf. 2021, 253, 03048. [Google Scholar] [CrossRef]
  60. Mishra, P.; Vasudeva Reddy, C.; Satish Kumar, U. An evaluation of furrows for managing soil and water loss from a shallow Alfisol under simulated rainfall. Soil Use Manag. 2008, 24, 171–180. [Google Scholar] [CrossRef]
  61. Luo, X.; Wang, Z.; Lu, L.; Guan, Y. Supply Chain Flexibility Evaluation Based on Matter-Element Extension. Complexity 2020, 2020, 8057924. [Google Scholar] [CrossRef]
  62. Fu, K.; Xu, Y.; Yang, J.; Zhang, W. System Availability Test Procedure with Minimum Operating Time. Adv. Mater. Res. 2013, 706–708, 2053–2056. [Google Scholar] [CrossRef]
  63. Mirauda, D.; De Vincenzo, A.; Pannone, M. Statistical characterization of flow field structure in evolving braided gravel beds. Spat. Stat. 2019, 34, 100268. [Google Scholar] [CrossRef]
  64. IUSS Working Group WRB. World Reference Base for Soil Resources 2014, update 2015 International soil classification system for naming soils and creating legends for soil maps. In World Soil Resources Reports No. 106; FAO: Rome, Italy, 2015. [Google Scholar]
Figure 1. The study area of Taihang Mountain.
Mathematics 10 01264 g001
Figure 2. Performance evaluation index system of highway plant slope.
Mathematics 10 01264 g002
Figure 3. Flowchart describing the methodology applied for highway plant slope.
Mathematics 10 01264 g003
Figure 4. The evaluation process of extension evaluation method.
Mathematics 10 01264 g004
Table 1. Geological survey of highway slope.
RegionSide Slope GradeSlope DefectsGeologic Environment
Tuling1:1.5There are valleys on the right side of the slope, the catchment area is large, the valley mouth of the lower river is comprehensive, and there are signs of ancient debris flowSilty clay soil, stone
Shangjiaosi1:1.25Medium soil collapse degreeLoess-like silt, with gravel
Lingdi1:1Strongly weathered collapsed rubble visible on both sidesRed clay deposit, poor geology.Artificial fill, block stone, weathered marl, silt, and other combinations
Table 2. The classification interval table of the comparison criteria.
IndicatorsNotationsCorresponding GradeDiscrete Values
Drought resistanceC1Excellent1
Good2
Average3
Poor4
Cold resistanceC2Excellent1
Good2
Average3
Poor4
Salt and alkali resistanceC3Excellent1
Good2
Average3
Poor4
Soil characteristicsC4Excellent1
Good2
Average3
Poor4
Slope height/mC50–51
5–102
10–153
>154
Slope gradient/(°)C60–201
20–402
40–603
>604
Precipitation intensity/mmC70–201
20–602
60–1203
>1204
Seepage performanceC8Excellent1
Good2
Average3
Poor4
Groundwater levelC9Dry1
Wet2
Dripping3
Bubbling4
Plant typeC10Trees, shrubs and herbs are reasonable1
Fewer trees, reasonable shrubs and herbs2
Few trees, reasonable shrubs, more reasonable herbs3
No trees, few shrubs, more reasonable herbs4
Purification abilityC11Excellent1
Good2
Average3
Poor4
Vegetation coverC1285–100%1
65–85%2
45–65%3
10–45%4
Table 3. Membership degree of qualitative indicators.
RankRange of Values
1[90, 100]
2[60, 90)
3[40, 60)
4[0, 40)
Table 4. Grade classification of slope decision attributes.
RankSlope Stability Condition
Onevery stable
Twostable
Threeunstable
Fourseverely unstable
Table 5. Decision table of index rating decision data.
UC1C2C3C4C5C6C7C8C9C10C11C12D
U1231234324333Four
U2233231323443Three
U3344242313434Four
U4223234132332Two
U5234223321123Two
U6431234324333One
U7223231323443One
U8142122322321Two
U9234223321223Four
U10234223323123Three
U11224234132332Two
U12344242313234Three
U13233221412323Two
U14223234134332Four
U15342242313434Two
Table 6. Decision table of index rating decision data.
Canonical ScaleDefinitionExplanation
1Equally importantOne factor is as important as the other
3A little importantOne factor is slightly more important than the other
5Clearly importantThe importance of one factor outweighs the other
7Strongly importantOne factor is significantly more important than the other
9Absolutely importantOne factor is more essential than the other
Table 7. Calculation results of primary index weight.
A0A1A2A3A4WeightOther Values
A112430.4427 λ max = 4.2295
CR = 0.0859
A21/21540.3545
A31/41/5120.1123
A41/31/41/210.0905
Table 8. Evaluation index coupling weight.
IndicatorAnalytic Hierarchy
Process Weight
Rough Set
Weight
Coupling Weight
W10.30250.05030.2086
W20.08850.05270.0639
W30.05170.09590.0680
W40.09210.07430.0938
W50.14630.07670.1538
W60.11610.09830.1564
W70.07800.07920.0847
W80.01070.08150.0120
W90.02360.10070.0326
W100.05160.10310.0729
W110.00880.08180.0098
W120.03010.10550.0435
Publisher’s Note: MDPI stays neutral with regard to jurisdictional claims in published maps and institutional affiliations.

