Article

Enhanced Fuzzy Elephant Herding Optimization-Based OTSU Segmentation and Deep Learning for Alzheimer’s Disease Diagnosis

by
Afnan M. Alhassan
*,
The Alzheimer’s Disease Neuroimaging Initiative
and
The Australian Imaging Biomarkers and Lifestyle Flagship Study of Ageing
College of Computing and Information Technology, Shaqra University, Shaqra 11961, Saudi Arabia
*
Author to whom correspondence should be addressed.
Data used in preparation of this article were obtained from the Alzheimer’s Disease Neuroimaging Initiative (ADNI) database (adni.loni.usc.edu). As such, the investigators within the ADNI contributed to the design and implementation of ADNI and/or provided data but did not participate in analysis or writing of this report. A complete listing of ADNI investigators can be found at: http://adni.loni.usc.edu/wp-content/uploads/how_to_apply/ADNI_Acknowledgement_List.pdf.
Data used in the preparation of this article was obtained from the Australian Imaging Biomarkers and Lifestyle flagship study of ageing (AIBL) funded by the Commonwealth Scientific and Industrial Research Organisation (CSIRO) which was made available at the ADNI database (www.loni.usc.edu/ADNI). The AIBL researchers contributed data but did not participate in analysis or writing of this report. AIBL researchers are listed at www.aibl.csiro.au.
Mathematics 2022, 10(8), 1259; https://doi.org/10.3390/math10081259
Submission received: 4 March 2022 / Revised: 24 March 2022 / Accepted: 7 April 2022 / Published: 11 April 2022

Abstract

:
Several neurological illnesses and diseased sites have been studied, along with the anatomical framework of the brain, using structural MRI (sMRI). It is critical to diagnose Alzheimer’s disease (AD) patients in a timely manner to implement preventative treatments. The segmentation of brain anatomy and categorization of AD have received increased attention since they can deliver good findings spanning a vast range of information. The first research gap considered in this work is the real-time efficiency of OTSU segmentation, which is not high, despite its simplicity and good accuracy. A second issue is that feature extraction could be automated by implementing deep learning techniques. To improve picture segmentation’s real-timeliness, enhanced fuzzy elephant herding optimization (EFEHO) was used for OTSU segmentation, and named EFEHO-OTSU. The main contribution of this work is twofold. One is utilizing EFEHO in the recommended technique to seek the optimal segmentation threshold for the OTSU method. Second, dual attention multi-instance deep learning network (DA-MIDL) is recommended for the timely diagnosis of AD and its prodromal phase, mild cognitive impairment (MCI). Tests show that this technique converges faster and takes less time than the classic OTSU approach without reducing segmentation performance. This study develops a valuable tool for quick picture segmentation with good real-time efficiency. Compared to numerous conventional techniques, the suggested study attains improved categorization performance regarding accuracy and transferability.
MSC:
62H35; 68U10

1. Introduction

The most prominent type of dementia is Alzheimer’s disease (AD), accompanied by a gradual decline in cognitive capabilities. Its symptoms range from forgetfulness in the early phases to speech loss and immobility in the late phases. Alzheimer’s, on the other hand, differs from other geriatric diseases in that its initial symptoms are frequently confounded with those of old age, and its commencement is commonly missed. According to the Alzheimer’s and Related Disorders Society of India (ARDSI)’s Dementia India Report 2010, around 3.7 million Indians had dementia in 2010, with the number expected to climb to 7.6 million by 2030 [1]. As a result, correct AD diagnosis is critical, especially in its early phases. Traditionally, AD diagnosis is made using a neuropsychological test in conjunction with structural imaging [2].
MCI and AD are linked to brain grey matter loss, and therefore neuropathology changes might be detected years before AD is diagnosed [3]. Predicting MCI-to-AD conversion has been performed using neuroimaging biomarkers [4]. The non-invasiveness, excellent resolution, and low cost of structural MRI make it a popular imaging technique in this research. MCI is similar to AD and NC, but milder, and pathological differences are observed between converters and non-converters. Thus, converting/non-converting is more complex than AD/NC.
A random classifier is the best predictor of MCI-to-AD conversion among eleven MRI-based approaches [5]. MRI images are recorded in a shared space to reduce inter-subject variability [6]. However, the registration may alter the AD pathophysiology and lose some relevant details. The categorization performance was improved by removing the age-related impact [7].
Machine learning (ML) strategies detect MCI-to-AD conversion effectively [8]. It has recently become possible to discover and classify patterns in photos using deep learning [9]. CNNs are the most extensively used deep learning architecture due to their image categorization and analysis [10]. This encouraged us to create a CNN-based AD conversion diagnosis system. As a result of using the same template space, most existing deep learning techniques for AD diagnosis still use manual pre-defined ROIs with expert knowledge to develop detection concepts using CNNs.
This means that deep learning-based sMRI diagnosis has to improve the diagnosis of discriminative characteristics, such as instructive micro-structures inside local areas and critical areas in a global image that may include segmentation mistakes. The main contributions of this work are as follows:
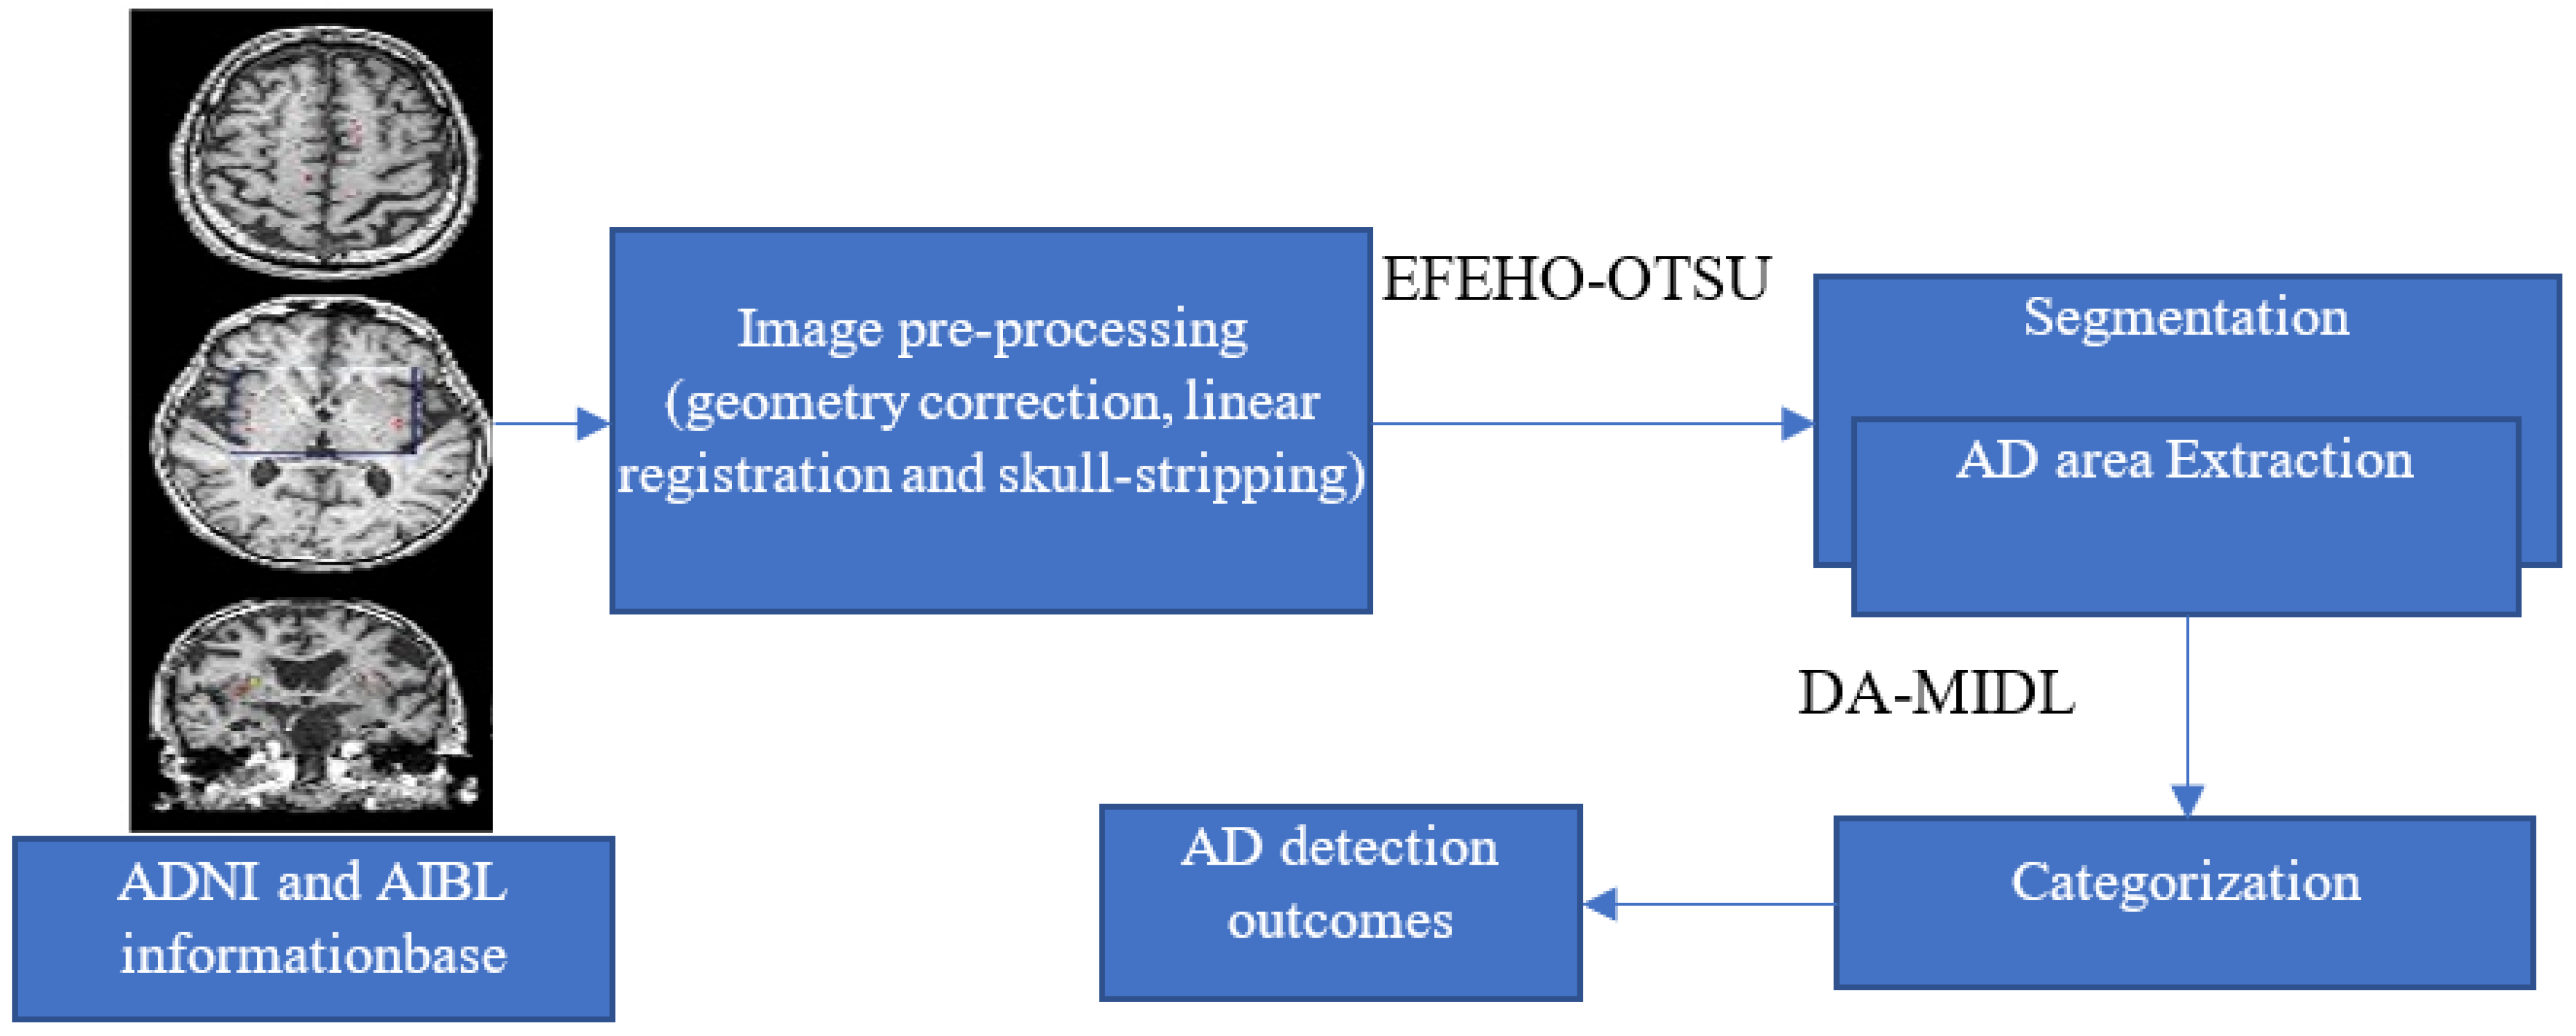
  • Initially, the two AD database such as ADNI and AIBL are taken as the input.
  • Then, the pre-processing steps such as geometry correction, linear registration and skull-stripping are done.
  • Third, EFEHO to OTSU is suggested for segmentation.
  • Finally, the findings show that our DA-MIDL technique beats numerous existing techniques regarding reliability and generality.
The remaining article is structured as: Section 2 discusses conventional approaches, Section 3 briefs the suggested segmentation technique and DA-MIDL technique, Section 4 depicts the experimental findings and outcomes for various AD diagnosis tasks, and Section 5 concludes with future directions.

2. Related Work

Numerous studies in the literature were committed to building automatic strategies to monitor AD-related functional and structural brain abnormalities.

2.1. Meta-Heuristic Algorithms

Mirjalili et al. [11] proposed Grey Wolf Optimizer inspired by grey wolves, and the findings on the unimodal functions demonstrate the way in which GWO is used efficiently. The exploration capability of GWO is corroborated by the results on multimodal functions. The results achieved with semi-real and actual issues show the practical performance of GWO.
Zamani et al. [12] presented an innovative bio-inspired algorithm based on starlings’ behaviors during their exciting murmuration referred to as starling murmuration optimizer (SMO), which helps in solving complicated and engineering optimization issues to be the best appropriate application for metaheuristic algorithms.
Nadimi-Shahraki et al. [13] proposed a migration-based moth–flame optimization (M-MFO) algorithm. M-MFO is chiefly focused on enhancing the location of unfortunate moths by migrating them at random during the initial iterations utilizing a random migration (RM) operator, maintaining the solution’s versatility by saving new qualified solutions individually in a guiding repository, and, finally, working around the positions stored in the guiding repository, applying a guided migration (GM) operator.
Therefore, various kinds of metaheuristic algorithms are required for the approximation of the best solutions for various optimization problems, and this represents the basic inspiration for scholars to enhance the present metaheuristic algorithms or propose innovative techniques specifically for segmentation.

2.2. Machine Learning and Deep Learning Algorithms

Fan et al. [14] and Magnin et al. [15] used an SVM approach to categorize and forecast distinct AD operations using structural brain magnetic resonance imaging (MRI) information. The SVM technique and extracted MRI information are integrated into this paper to improve categorization diagnosis outcomes.
Liu et al. [16] explicitly modelled structural information in multi-template information, as is recommended for automatic detection of AD and its premonitory phase, MCI. Finally, an ensemble categorization is utilized to integrate the outputs of all SVM classifiers. Li et al. [17] developed a powerful deep learning procedure to recognize AD progression phases using MRI and PET information. The dropout strategy improved deep classical learning by eliminating weight coadaptation, a common cause of overfitting. The deep learning framework includes stability picking, adaptive learning, and multitask learning.
Using brain network connectivity pattern analysis, Wang et al. [18] provided a robust technique for AD, MCI, and standard control subject categorization in size constrained fMRI information samples. The suggested regularized LDA is then used to project the feature vectors onto a one-dimensional axis. Lastly, to complete the categorization task, an AdaBoost classifier is used.
LeNet, as with most DNN techniques, employs a MaxPooling layer to reduce dimensionality by removing information from minimum valued elements. To maintain the network’s minimal valued elements, we constructed an individual layer that performs the Min-Pooling function by Hazarika et al. [19]. Zhu et al. [20] presented a DA-MIDL for the timely detection of AD and MCI in its premonitory phase.
Song et al. [21] suggested an AMGNN technique for AD diagnosis. First, a metric-based meta-learning technique for independent testing is introduced. To improve performance under minor sample size conditions, tiny graphs are used in the meta-tasks. However, it is not easy to apply CNNs for AD diagnosis due to the scarcity of imaging information. We devise a revolutionary deep learning framework by Feng et al. [22]. As a comparison approach, the HFCN paradigm was used by Liu et al. [23]. Lian et al. [24] built a DMIL framework utilizing patch-wise input information. In addition to diagnosis, AD segmentation gives structural information about aberrant and normal tissues. It is regarded as a texture categorization issue.

2.3. Hybrid Model

Abuhmed et al. [25] designed and assessed two new hybrid deep learning models for AD progression detection. These models depend on the combination of several deep bidirectional long short-term memory (BiLSTM) frameworks.
Basheera et al. [26] studied a new multiclass classification of Alzheimer’s disease that employs convolution neural network. A total of 18,017 magnetic resonance imaging fragments are gathered from 1820 T2-MRI volumes. Hybrid enhanced independent component analysis was utilized to carry out the segmentation. Segmented gravy matter was considered for the classification process. The proposed technique performs better both in the form of a binary classifier and multiclass classifier.
Although the above-discussed techniques attained good results in the detection of AD. The SVM has a limitation in that the feature extraction step needs a human expert, and this thus reduces the accuracy as wel1. Although the above-discussed DL methods are good in automatic feature extraction, all are good in a small dataset. So, this work focused on solving these two main issues through the proposed DA-MIDL method.

3. Proposed Methodology for AD Detection

Usually, medical images have inhomogeneity, strange noise, and a complex structure. Thus, medical image segmentation is a difficult task for denoising and deblurring. Applying EFEHO to the OTSU strategy is employed for image segmentation. Figure 1 depicts the proposed AD detection’s basic outline. Then, we present the DA-MIDL AD detection technique.

3.1. Input Database and Image Pre-Processing

The Alzheimer’s Disease Neuroimaging Initiative (ADNI) database (http://adni.loni.usc.edu (accessed on 3 January 2022)) was utilized to compile the data for this article (adni.loni.usc.edu). The principal investigator Michael W. Weiner, MD, founded the ADNI in 2003 as a public-private cooperation. The major purpose of ADNI was to see whether serial MRI, PET, other biological markers, and clinical and neuropsychological assessments could be used to track the evolution of mild cognitive impairment (MCI) and early Alzheimer’s disease (AD). Visit www.adni-info.org (accessed on 3 January 2022) for the most up-to-date information. The Australian Imaging, Biomarker and Lifestyle Flagship Work of Ageing (AIBL) database (https://aibl.csiro.au (accessed on 3 January 2022)) was used in this study. The data were collected by the AIBL study group. The AIBL study’s methodology has been reported previously [27].
There are 1193 1.5T/3T T1-weighted structural MRI (sMRI) scans in the ADNI dataset from participants during their own baseline/screening visit (i.e., the first examination) (i.e., ADNI-1, ADNI-2, and ADNI-3). The participants can be classified as AD, MCI, or NC (standard control) based on conventional clinical criteria such as MMSE scores and Clinical Dementia Rating (CDR). The AIBL dataset includes baseline sMRI scans from 496 individuals: 79 AD, 17 pMCI, 93 sMCI, and 307 NC.

3.2. Segmentation Using EFEHO to OTSU Technique

Owing to its simplicity and precision, OTSU segmentation is inefficient in real-time. This study introduces EFEHO to OTSU segmentation, establishing an EFEHO-OTSU segmentation procedure. The suggested procedure searches for the appropriate OTSU threshold for segmentation, effectively segmenting the image’s background and target, resulting in the best effect and lowest calculation cost. Each metaheuristic algorithm discussed in related work has specific advantages and weaknesses. If one algorithm uses minimum memory, less running time, and has improved final function value then that algorithm is considered as the best algorithm for the given dataset. By means of the comparison process [28], the best optimization algorithm EHO is chosen for segmentation.
OTSU image segmentation technique: The OTSU technique uses a single threshold to divide an image into the foreground and background. If the total amount of pixels in the image is T, the probability P of all pixel points for a given greyscale value is
P i = T i T
In which i is the grey value, and T i is the amount of pixels. Considering the image to be segmented as per the threshold t h , the probability P i of the number of pixels k occurring in the foreground Ω 0 and background areas Ω 1 is
Ω 0 = i = 0 k P i = Ω k ;   Ω 1 = i = k + 1 L 1 P i = 1 Ω k
Additionally, the interclass variance Υ of the two areas segmented by the threshold t h is
Υ t h = Ω 0 μ 0 μ 2 + Ω 1 μ 1 μ 2
where μ is the mean value of the image, and μ 0 and μ 1 are the mean value of the target area and the background area, respectively. Assuming that the image grey level is S and that the threshold group t h 1 , t h 2 , , t h n 0 t h 1 t h 2 t h n S 1 divides the image into t + 1 individual intervals, the total variance between classes is
Υ t h 1 , t h 2 , , t h n = i = 0 t 1 j = i + 1 t Ω i Ω j μ i μ j 2
where Ω i and Ω j are the probability of two areas. μ i and μ j are the means of two portions.
Elephant herding optimization: The EHO technique was suggested by [29] and is a SI technique. It is inspired by elephant herding behavior in nature. This behavior is summarized as follows. Elephants are divided into subgroups called clans, each with several elephants. A matriarch leads each clan, while adult male elephants leave their clans and live alone. In EHO, these actions are led by two operators: clan update and clan separation Clan update shifts elephants and matriarchs around in each clan, while separation increases population variety later in the search phase.
Separating operator and clan updating operator are EHO behavior categorizations. EHO beats existing procedures for pattern matching. EHO procedure is defined as follows. An elephant El group is led by a matriarch, usually the eldest cow. Each member ‘ j ’ of clan ‘ i ’ shifts according to the matriarch where the matriarch is the elephant c l i with the best fitness value in a generation:
F i t n e s s = E l n e w c l i , j = E l c l i , j + α E l b e s t , c l i × r
In clan i , E l n e w , c l i , j depicts an elephant j in its present location and E l c l i , j is its previous location. The best solution of clan c l i is the E l b e s t c l i , where α 0 ,   1 is a scale factor of the procedure that recognizes the matriarch position of the best elephant in clan E l b e r t , c l i :
E l b e s t c l i = β × E l c e n t e r c l i
where β     0 ,   1 is the second parameter of the procedure that controls the influence of the E l c e n t e r c l i defined as the clan-updating process:
E l c e n t e r c l i = 1 n c l i × j = 1 n c l i E l c l i , j , d
where 1     d     D is the dimension of the d th term and denotes the dimension total space, and n c l i recognizes an unlimited number of elephants in clan i . In each clan i elephants, which is shifted to the fresh positions as per the below equation (separating process):
E l w o r s t c l i = E l m i n + E l m a x E l m i n + 1 × r a n d  
where E l m i n and E l m a x are the minimum and maximum bound of the search space, and rand [0, 1] is a stochastic distribution between 0 and 1.
EFEHO: To distinguish EHO from other population-based evolutionary procedures, each candidate solution is linked to a matriarch. Here, “member” and “clan” are possible solutions through the search space. A population of elephants is formed to build the EHO procedure. The matriarch position of each elephant is then altered based on the elephant’s and the clan’s experiences. The elephants should move towards better solutions. Every elephant’s fitness can be assessed using an optimization problem’s objective function. The authors employed a fuzzy system called Fuzzy PSO (FPSO) to propose stabilized fitness of the recent best position of ith elephant (SFRBP (Eli)). This input is:
S F R B P E l i = F i t n e s s E l b e s t i k F i t n e s s K N F i t n e s s E l b e s t i 1 F i t n e s s K N
where F i t n e s s E l b e s t i k is the fitness of the best previous position of i th elephant in kth iteration, F i t n e s s K N is the known real optimal solution value, and F i t n e s s E l b e s t i 1 is the fitness of the of i th in 1st iteration. The second fuzzy input is the current value of the scale factor for i th elephant E l i . The fuzzy output is a variation of factor c l i . Each fuzzy variable has three membership functions, namely small ( S m ), medium ( M e ) and large ( L a ), as below:
μ S m = 1 i f   E l < c l 1   c l 2 E l c l 2 c l 1   i f   c l 1 E l c l 2 0 i f   c l 2 < E l
μ M e = 0 i f   E l < c l 1   E l c l 1 c l 2 c l 1 i f   c l 1 E l c l 2 1 i f   c l 2 < E l
μ L a = 0 i f   E l < c l 1   2 E l c l 1 c l 2 c l 1 i f   c l 1 E l c l 1 + c l 2 2 2 c l 2 c l c l 2 c l 1 i f   c l 1 + c l 2 2 E l c l 2 0 i f   c l 2 < E l
where μ denotes the membership function, and c l 1 and c l 2 are the crisp inputs of clan of elephants. The improved fuzzy rules are shown in Table 1.
To analyse the effectiveness of the above techniques, we detect an inconstant nonlinear system
c l 1 k + 1 = θ 1 c l 1 k c l 2 k ,   c l 1 0 = 1
c l 2 k + 1 = θ 2 c l 1 2 k + u k ,   c l 2 0 = 1
y k = θ 3 c l 2 k θ 4 c l 1 2 k
where the real parameters are assumed to be θ = θ 1 , θ 2 , θ 3 , θ 4 = [0.5, 0.3, 1.8, 0.9]. The known optimal value F i t n e s s K N is set to zero for the EFEHO. The optimization is repeated 20 times. To optimise the parameters θ1, θ2, θ3 and θ4, the EFEHO procedure is used. The EFHEO achieves great precision and fast convergence without premature convergence. The goal is to apply the EFHEO technique to recognize system parameters (optimal elephants) used for OTSU segmentation. The EFHEO-OTSU image segmentation procedure steps are discussed below and illustrated in Figure 2:
(1)
The image must be retrieved and pre-processed.
(2)
Set the elephant’s and clan population’s initial positions at random.
(3)
Use fuzzy by determining the scale factor for each particle based on the elephant’s state.
(4)
Rank the population based on individual fitness and carry out the upgrading and segregation processes.
(5)
Assess the population based on the most recently revised position.
(6)
Assess each individual elephant based on its location.
(7)
Iteration lengthens.
(8)
Complete the procedure and return optimal elephants as an OTSU threshold value.
(9)
Image segmentation based on a predefined threshold.

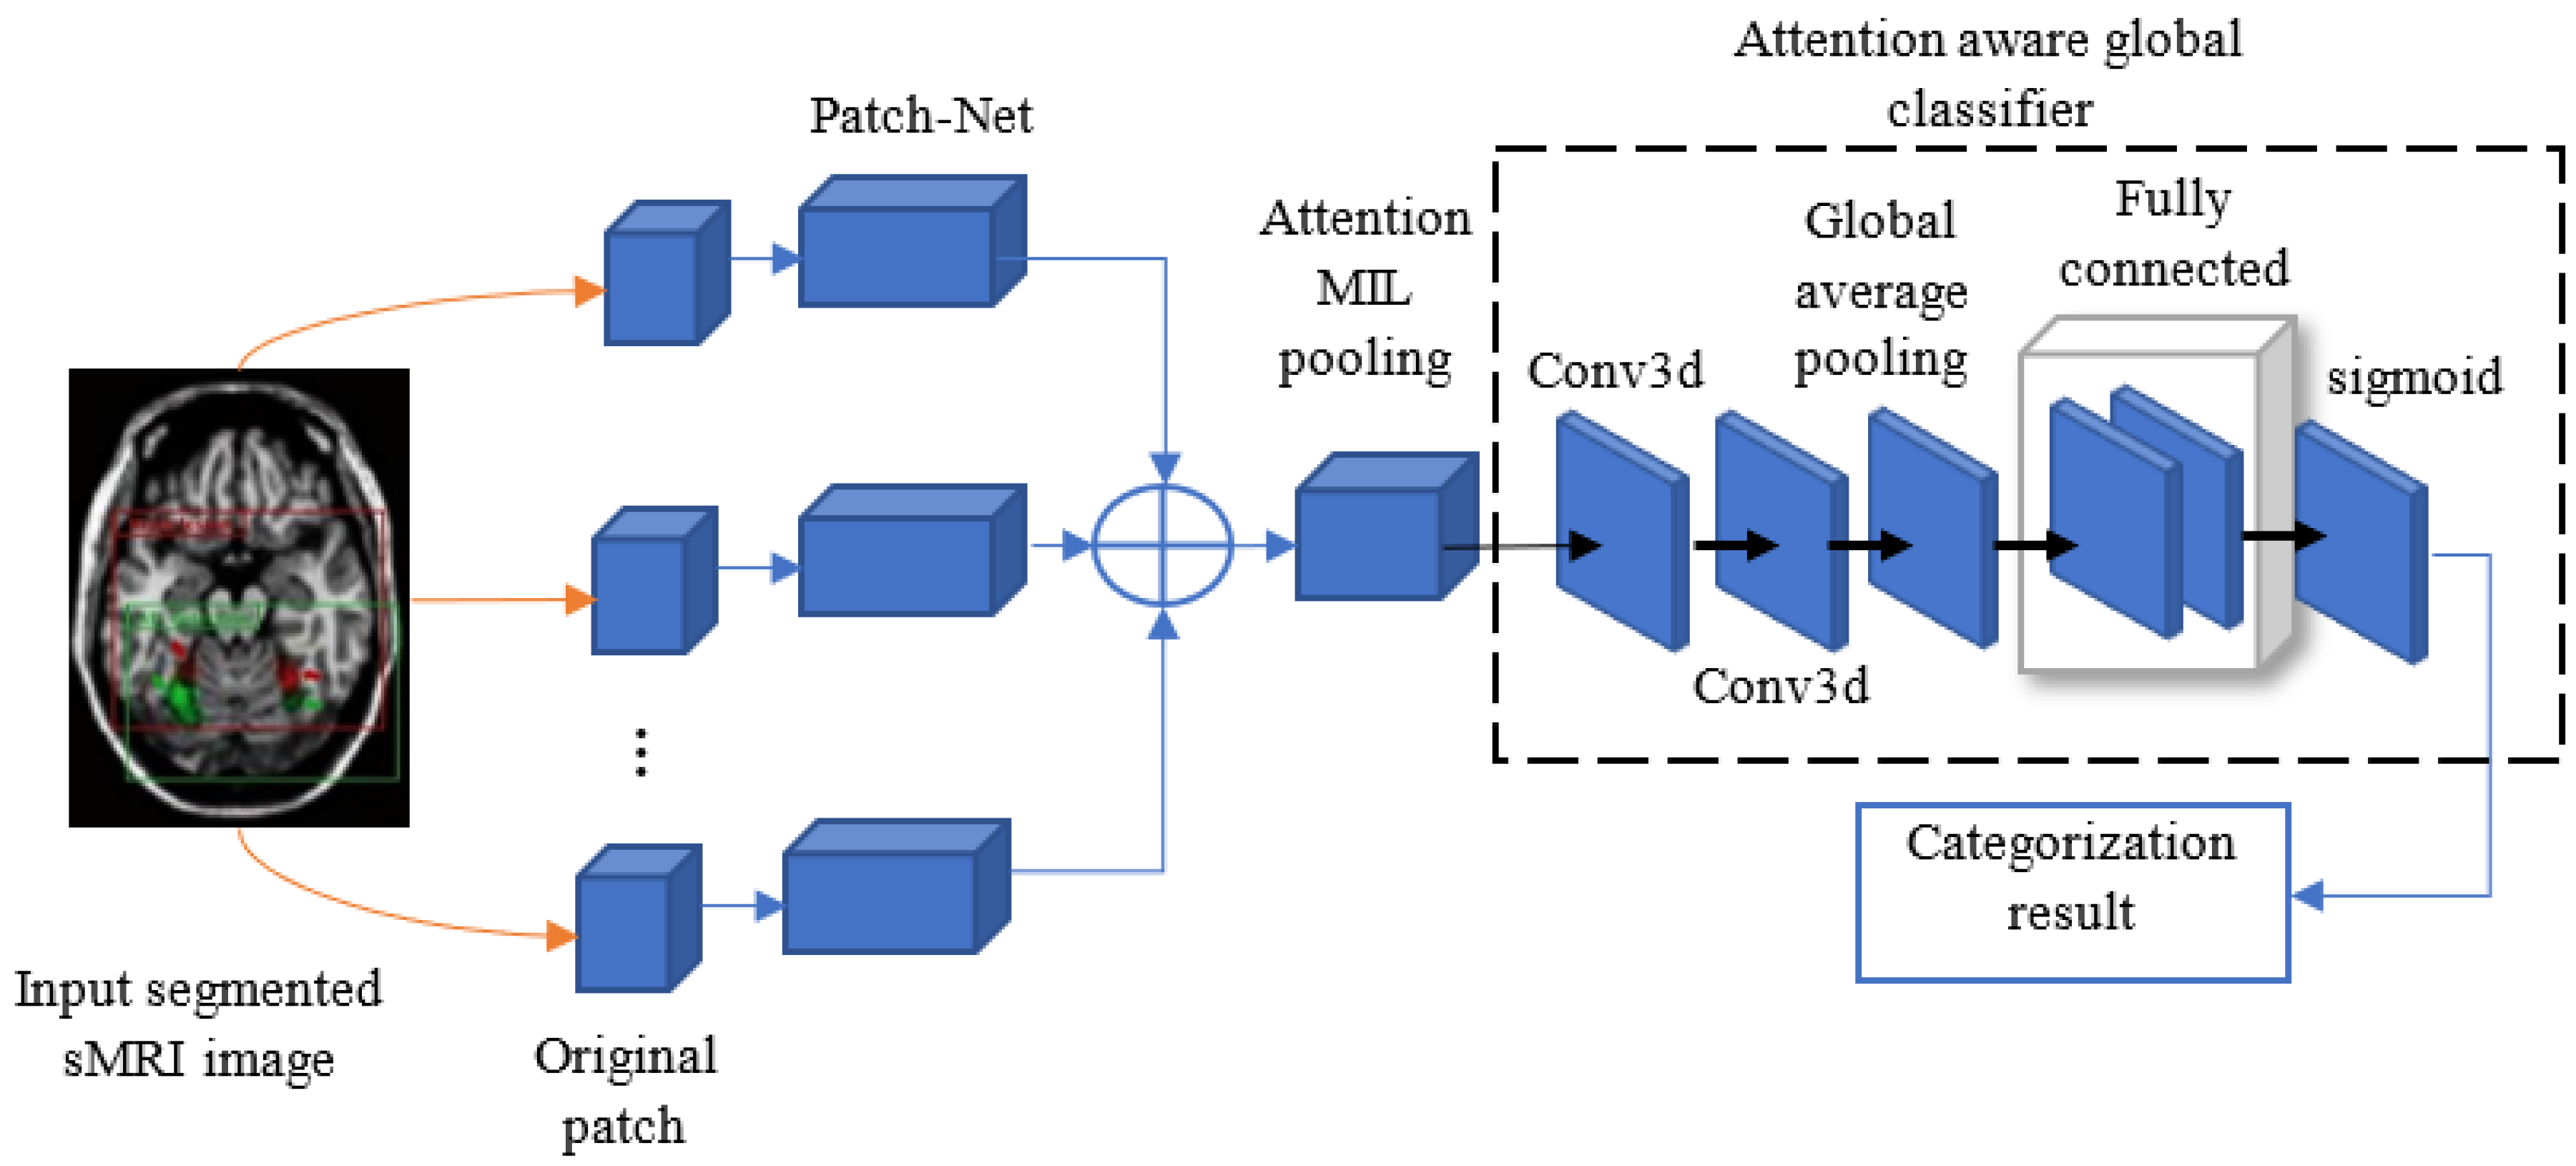
3.3. AD Detection Using DA-MIDL

Our technique is based on multi-instance learning. Bags are used to represent training information in MIL. The bag-level label of each sample/bag is stored in the bag-level label of each bag. X_i = {I_(i,j) }_(j = 1)^(N_i), where I (i,j) is the j-th instance and N i is the number of occurrences in X_i. Y_i = 0 only when ∑_(j = 0)^(N_i)▒y_(i,j) = 0, otherwise Y_i = 1. Localized brain atrophy occurs early in AD. We consider a patient’s MR patch bag to be a positive bag to this aim. The hyper parameter is given in Table 2.
Similarly, we put standard control patches in a harmful bag. Thus, many patch bags with bag-level labels replace huge photos as training information for AD diagnosis. In the recommended DA-MIDL technique (Figure 3), four phases are involved: selecting instances for a bag X, transforming instance-level features (Patch-Net), combining altered illustrations (Attention MIL Pooling), and classifying the combined bag-level features (G) (i.e., Attention-Aware Global Classifier).

4. Experimental Outcomes and Discussions

The outcomes of our DA-MIDL with a segmentation approach and the competing techniques on the test set from the ADNI AIBL dataset for AD categorization and MCI conversion diagnosis are shown below. The recommended DA-MIDL technique with optimal OTSU surpasses the other competing techniques (DA-MIDL [20], HFCN [23], and proposed DA-MIDL with segmentation). The DA-MIDL technique with segmentation has been validated on a variety of AD-related diagnosis tasks, including AD categorization (AD vs. NC), MCI conversion diagnosis (pMCI vs. sMCI), and MCI categorization (pMCI vs. NC and sMCI vs. NC). In this case, three measures are used to evaluate categorization effectiveness: accuracy, sensitivity, and specificity. The measurements are described as follows:
a c c u a r c y = T P + T N T P + T N + F P + F N  
s e n s i t i v i t y =   T P T P + F N
s p e c i f i c i t y =   T N T N + F P  
TP, TN, FP, and FN are indicated as true positive, true negative, false positive, and false negative values. ACC, SEN, and SPE are computed utilizing the default threshold of 0.5. AUC is computed on all pairs of actual favorable rates T P R = s e n s i t i v i t y and false-positive rates ( F P R = 1 s p e c i f i c i t y ) by altering the thresholds on the diagnosis outcomes from the trained DA-MIDL with a better odds OTSU network.

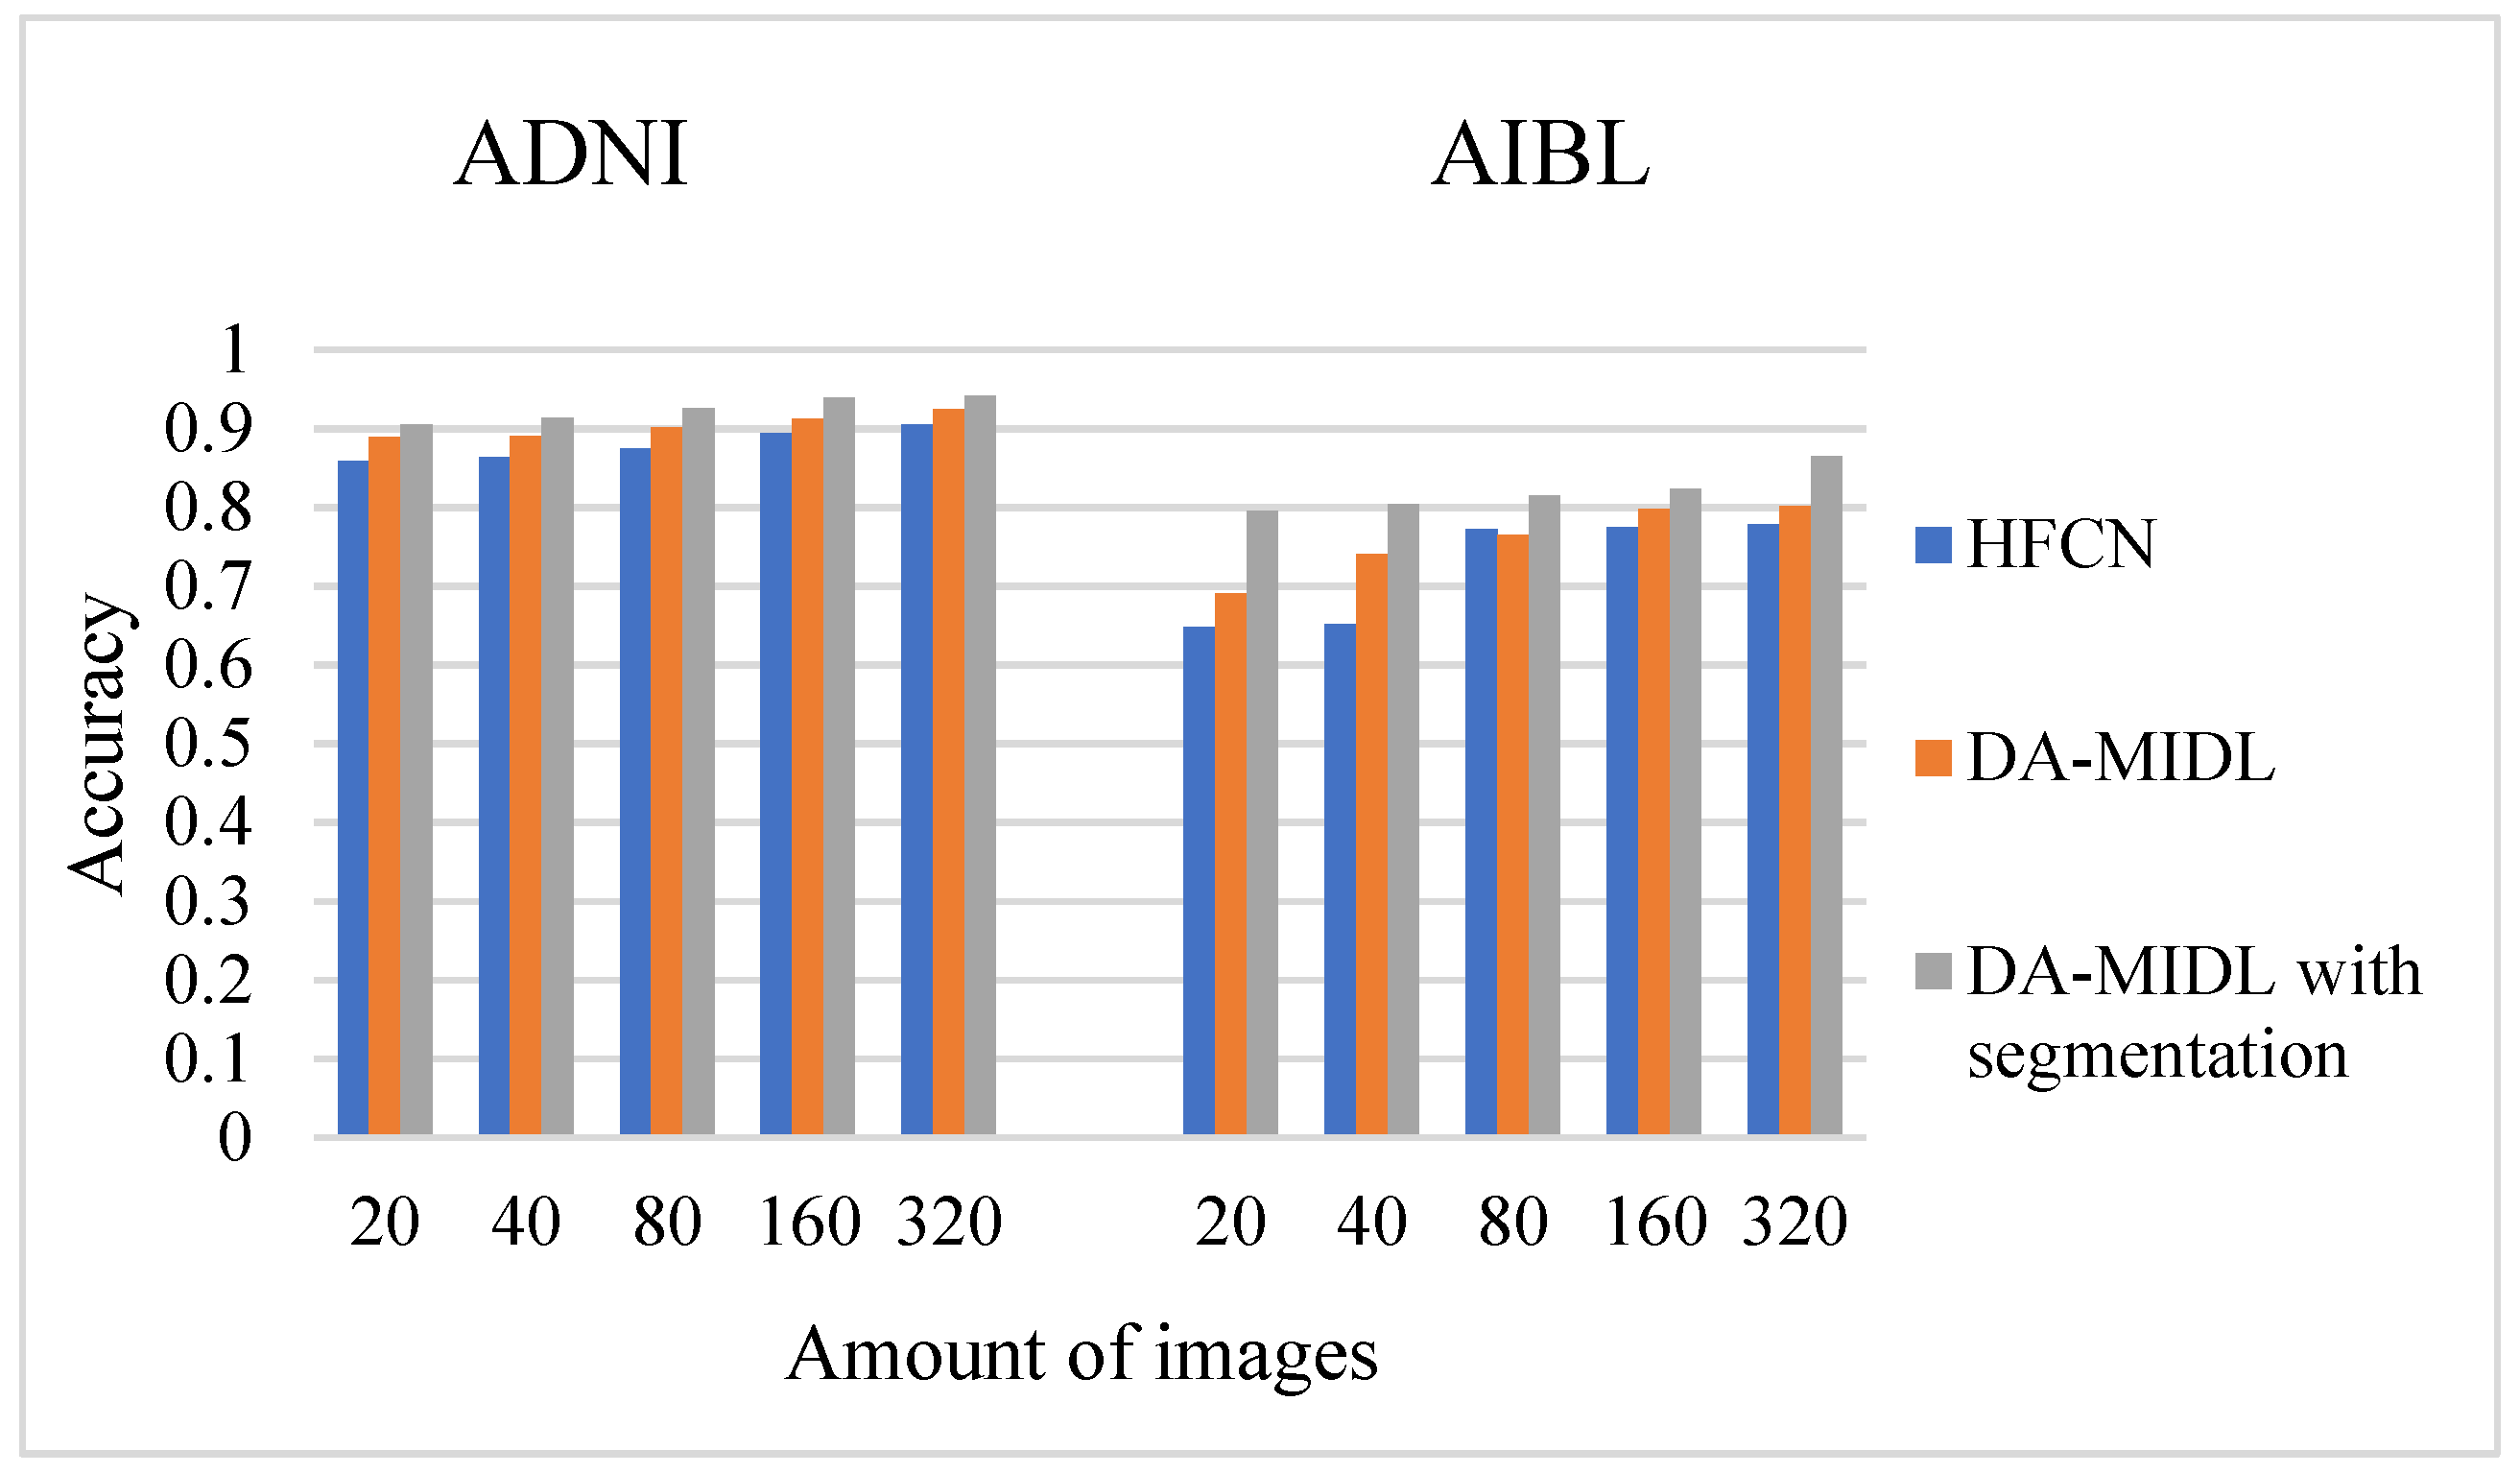
4.1. Accuracy Comparison Outcomes

The recommended technique has superior qualities regarding consistent convergence characteristics and good computational exactness. As demonstrated in Figure 4, the suggested DA-MIDL technique with segmentation usually beats the other DMIL and HFCN in both AD-related diagnosis tasks. For illustration, the DA-MIDL with segmentation achieves the best accuracy of 0.942 on the ADNI dataset, greater than DA-MIDL and HFCN. For the AIBL categorization challenge, the DA-MIDL with segmentation technique also produces a higher outcome of 0.865, which is higher than those of the previous techniques. This finding suggests that DA-MIDL with the segmentation technique can deliver robust performance across multiple databases.

4.2. Sensitivity Comparison Outcomes

As shown in Figure 5, the recommended DA-MIDL technique with segmentation basically beats the other DA-MIDL and HFCN in both AD-related diagnosis tasks. For example, the DA-MIDL with segmentation attains better sensitivity (0.923) on the ADNI dataset, which is better than DA-MIDL, and HFCN. For the AIBL categorization task, the DA-MIDL with the segmentation technique also obtains better outcomes of 0.93, superior to the existing process. These outcomes suggest that the DA-MIDL segmentation technique can improve robust performance across different datasets.

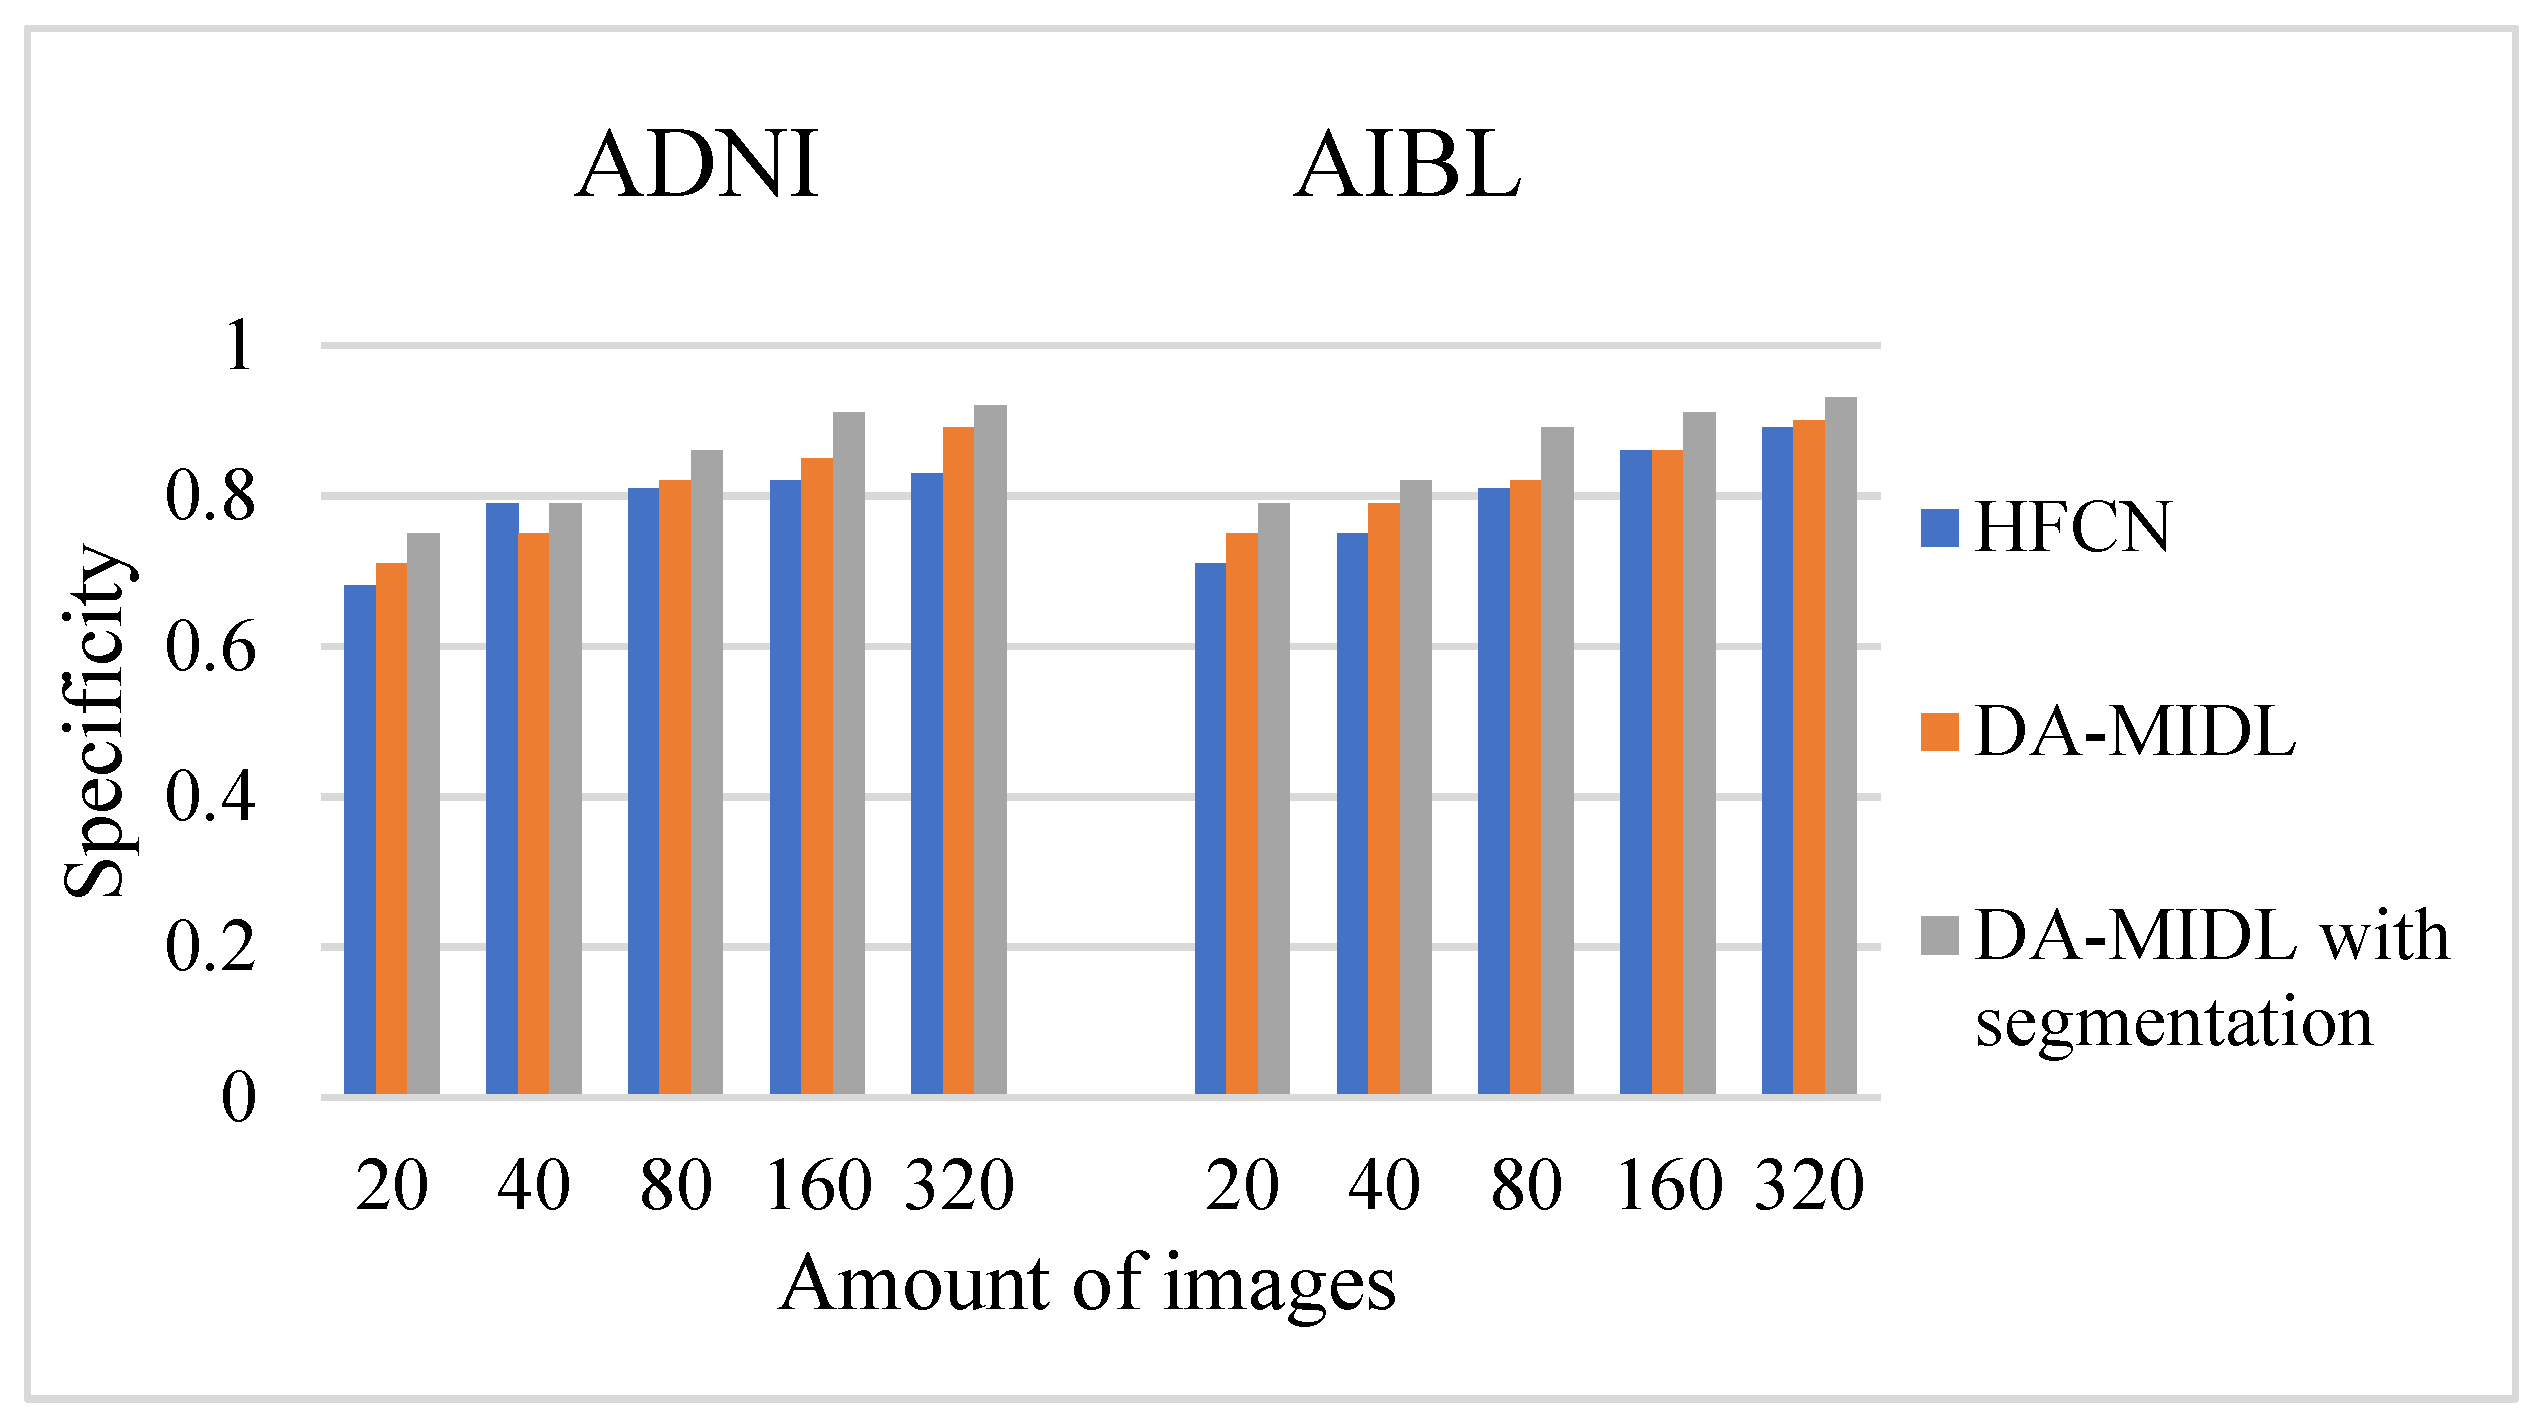
4.3. Specificity Comparison Outcomes

As shown in Figure 6, the recommended DA-MIDL technique with segmentation basically outperforms the other DA-MIDL and HFCN in both AD-related diagnosis tasks. For example, the DA-MIDL with segmentation achieves the best sensitivity 0.92 on the ADNI dataset, which is better than DA-MIDL and HFCN. For the AIBL categorization task, the DA-MIDL with the segmentation technique also obtains a better outcome of 0.93, superior to the existing process. From the overall performance of specificity outcomes, the recommended DA-MIDL with segmentation attained high specificity mainly because integrating fuzzy and EHO procedures helped to reach a global optimum without getting stuck at a local optimum. The segmented AD area is initially sent to the feature extraction module, where the features are extracted. The categorization module uses the DA-MIDL classifier to detect the AD.

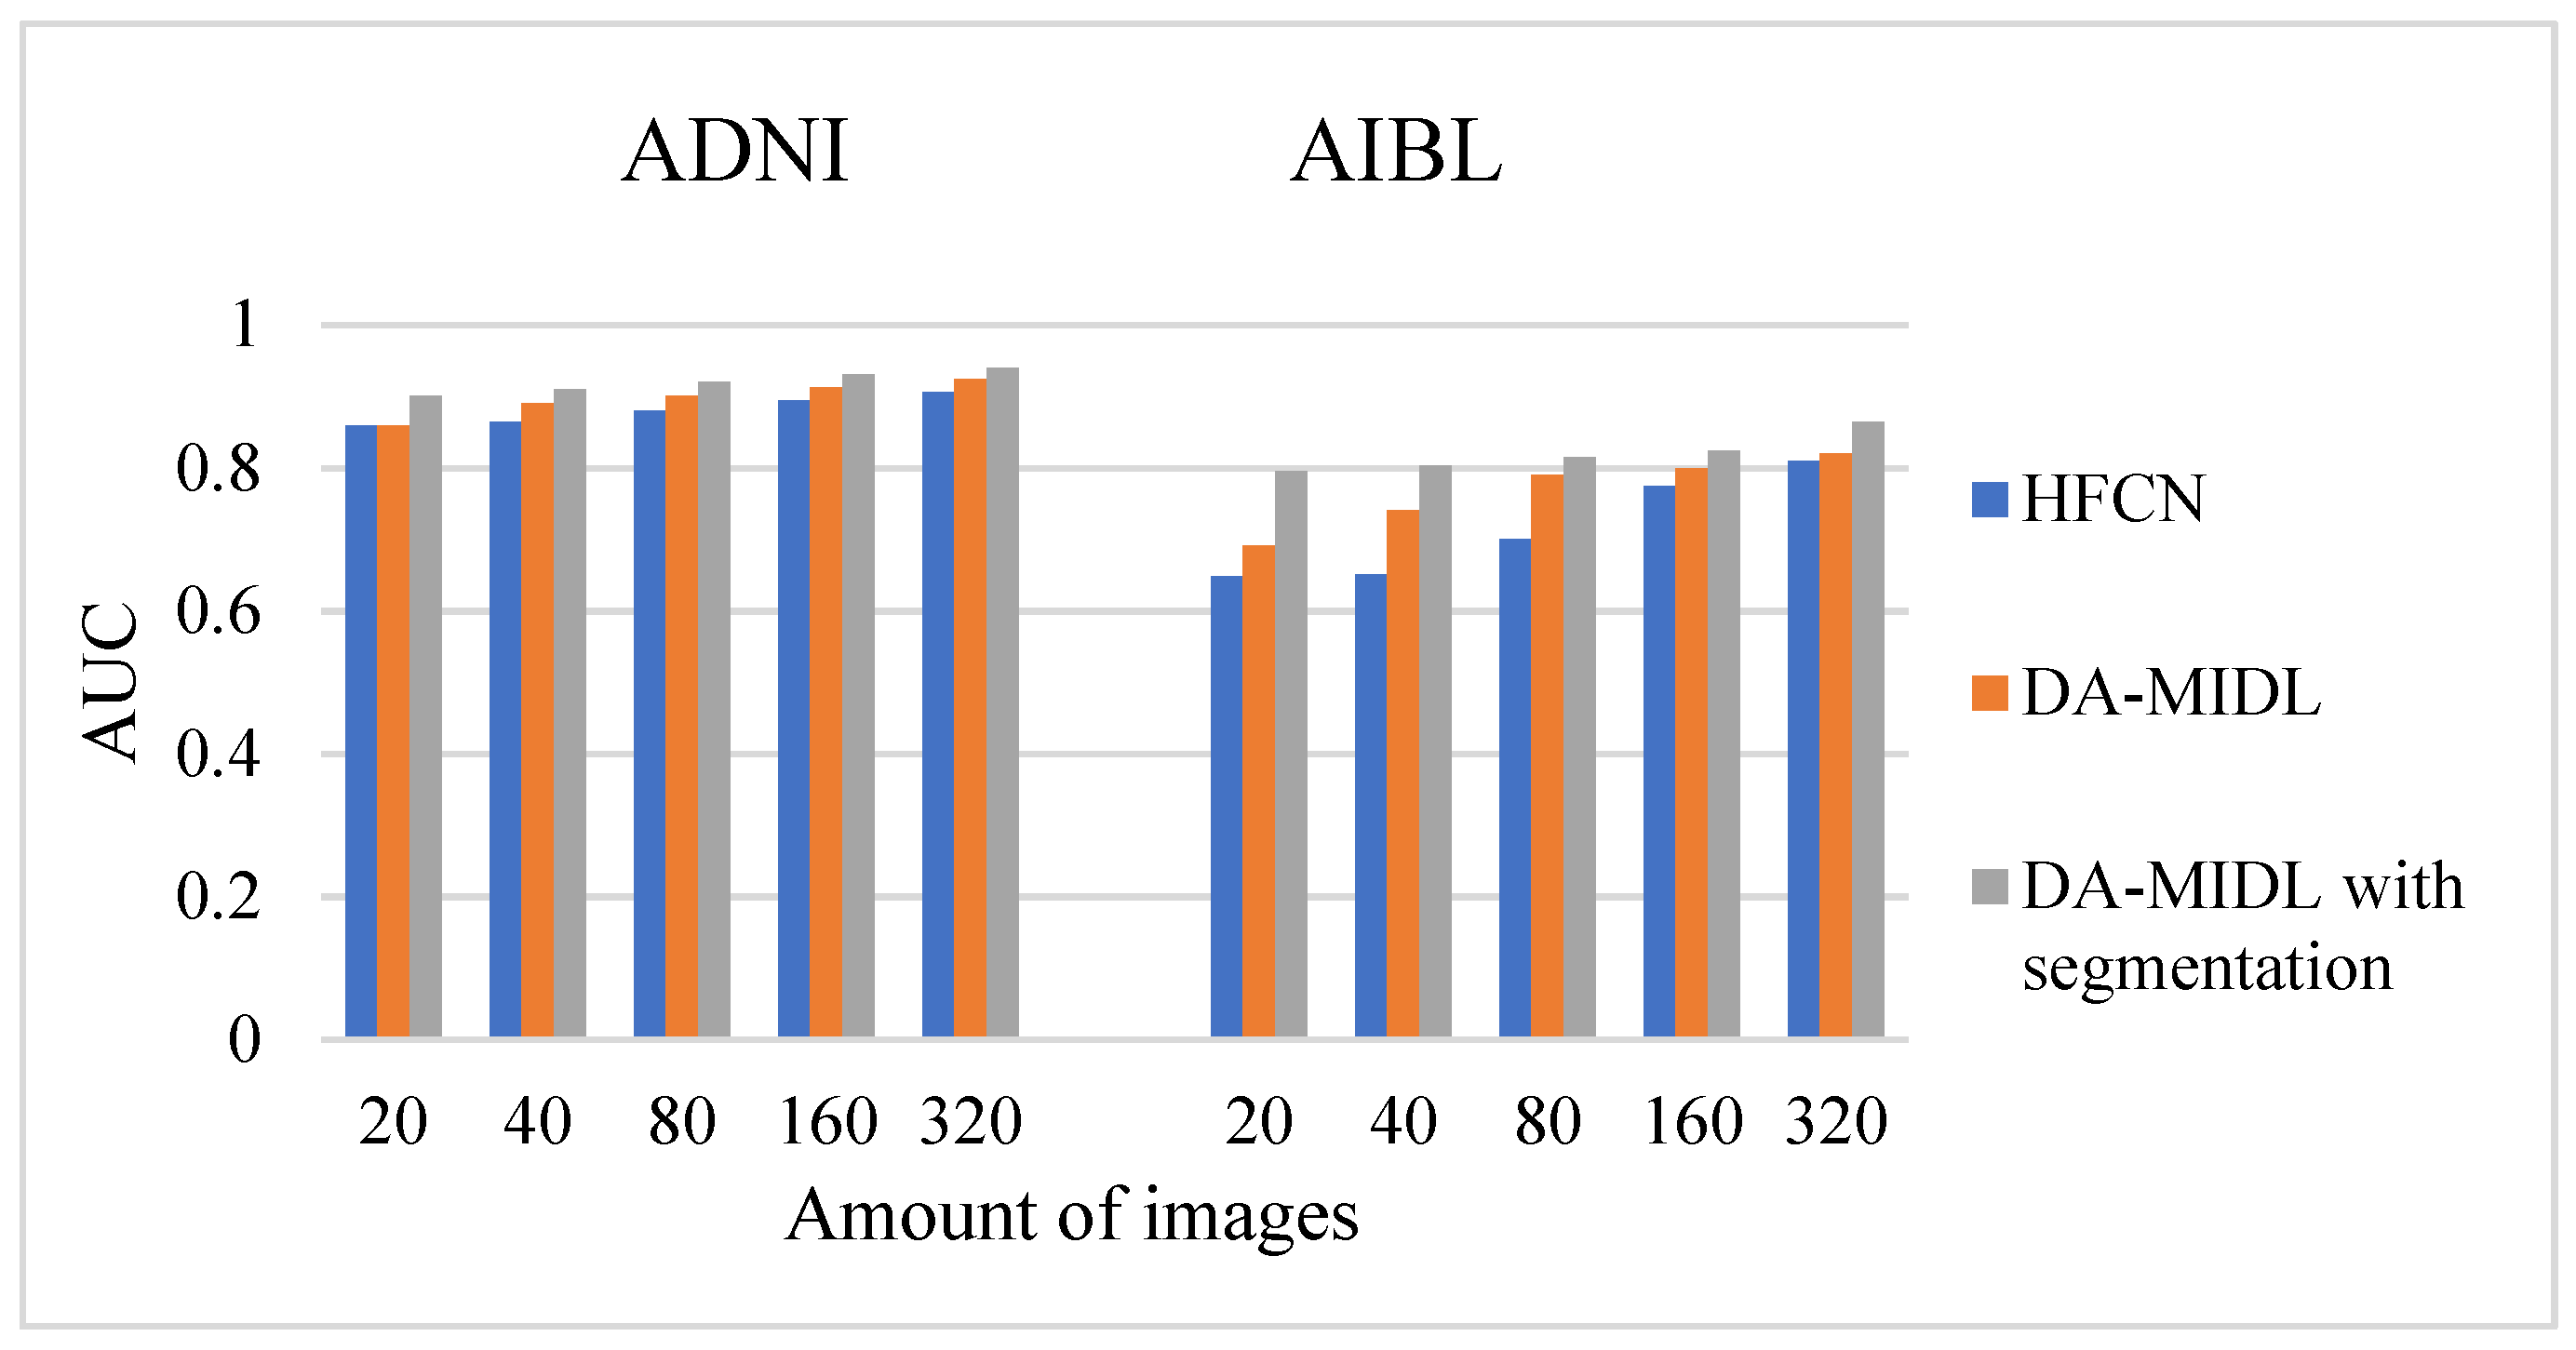
4.4. AUC Comparison Outcomes

The findings show that the recommended technique attains high AUC because optimized OTSU multi-threshold segmentation based on EFEHO does not easily fall into the optimal local solution, and its stability is better. As shown in Figure 7, the recommended DA-MIDL technique with segmentation basically outperforms the other DMIL and HFCN in both AD-related diagnosis tasks. For example, the DA-MIDL with segmentation achieves the best sensitivity 0.923 on the ADNI dataset, which is better than DA-MIDL and HFCN. For the AIBL categorization task, the DA-MIDL with the segmentation technique also acquires a good outcome of 0.93, superior to the existing process.

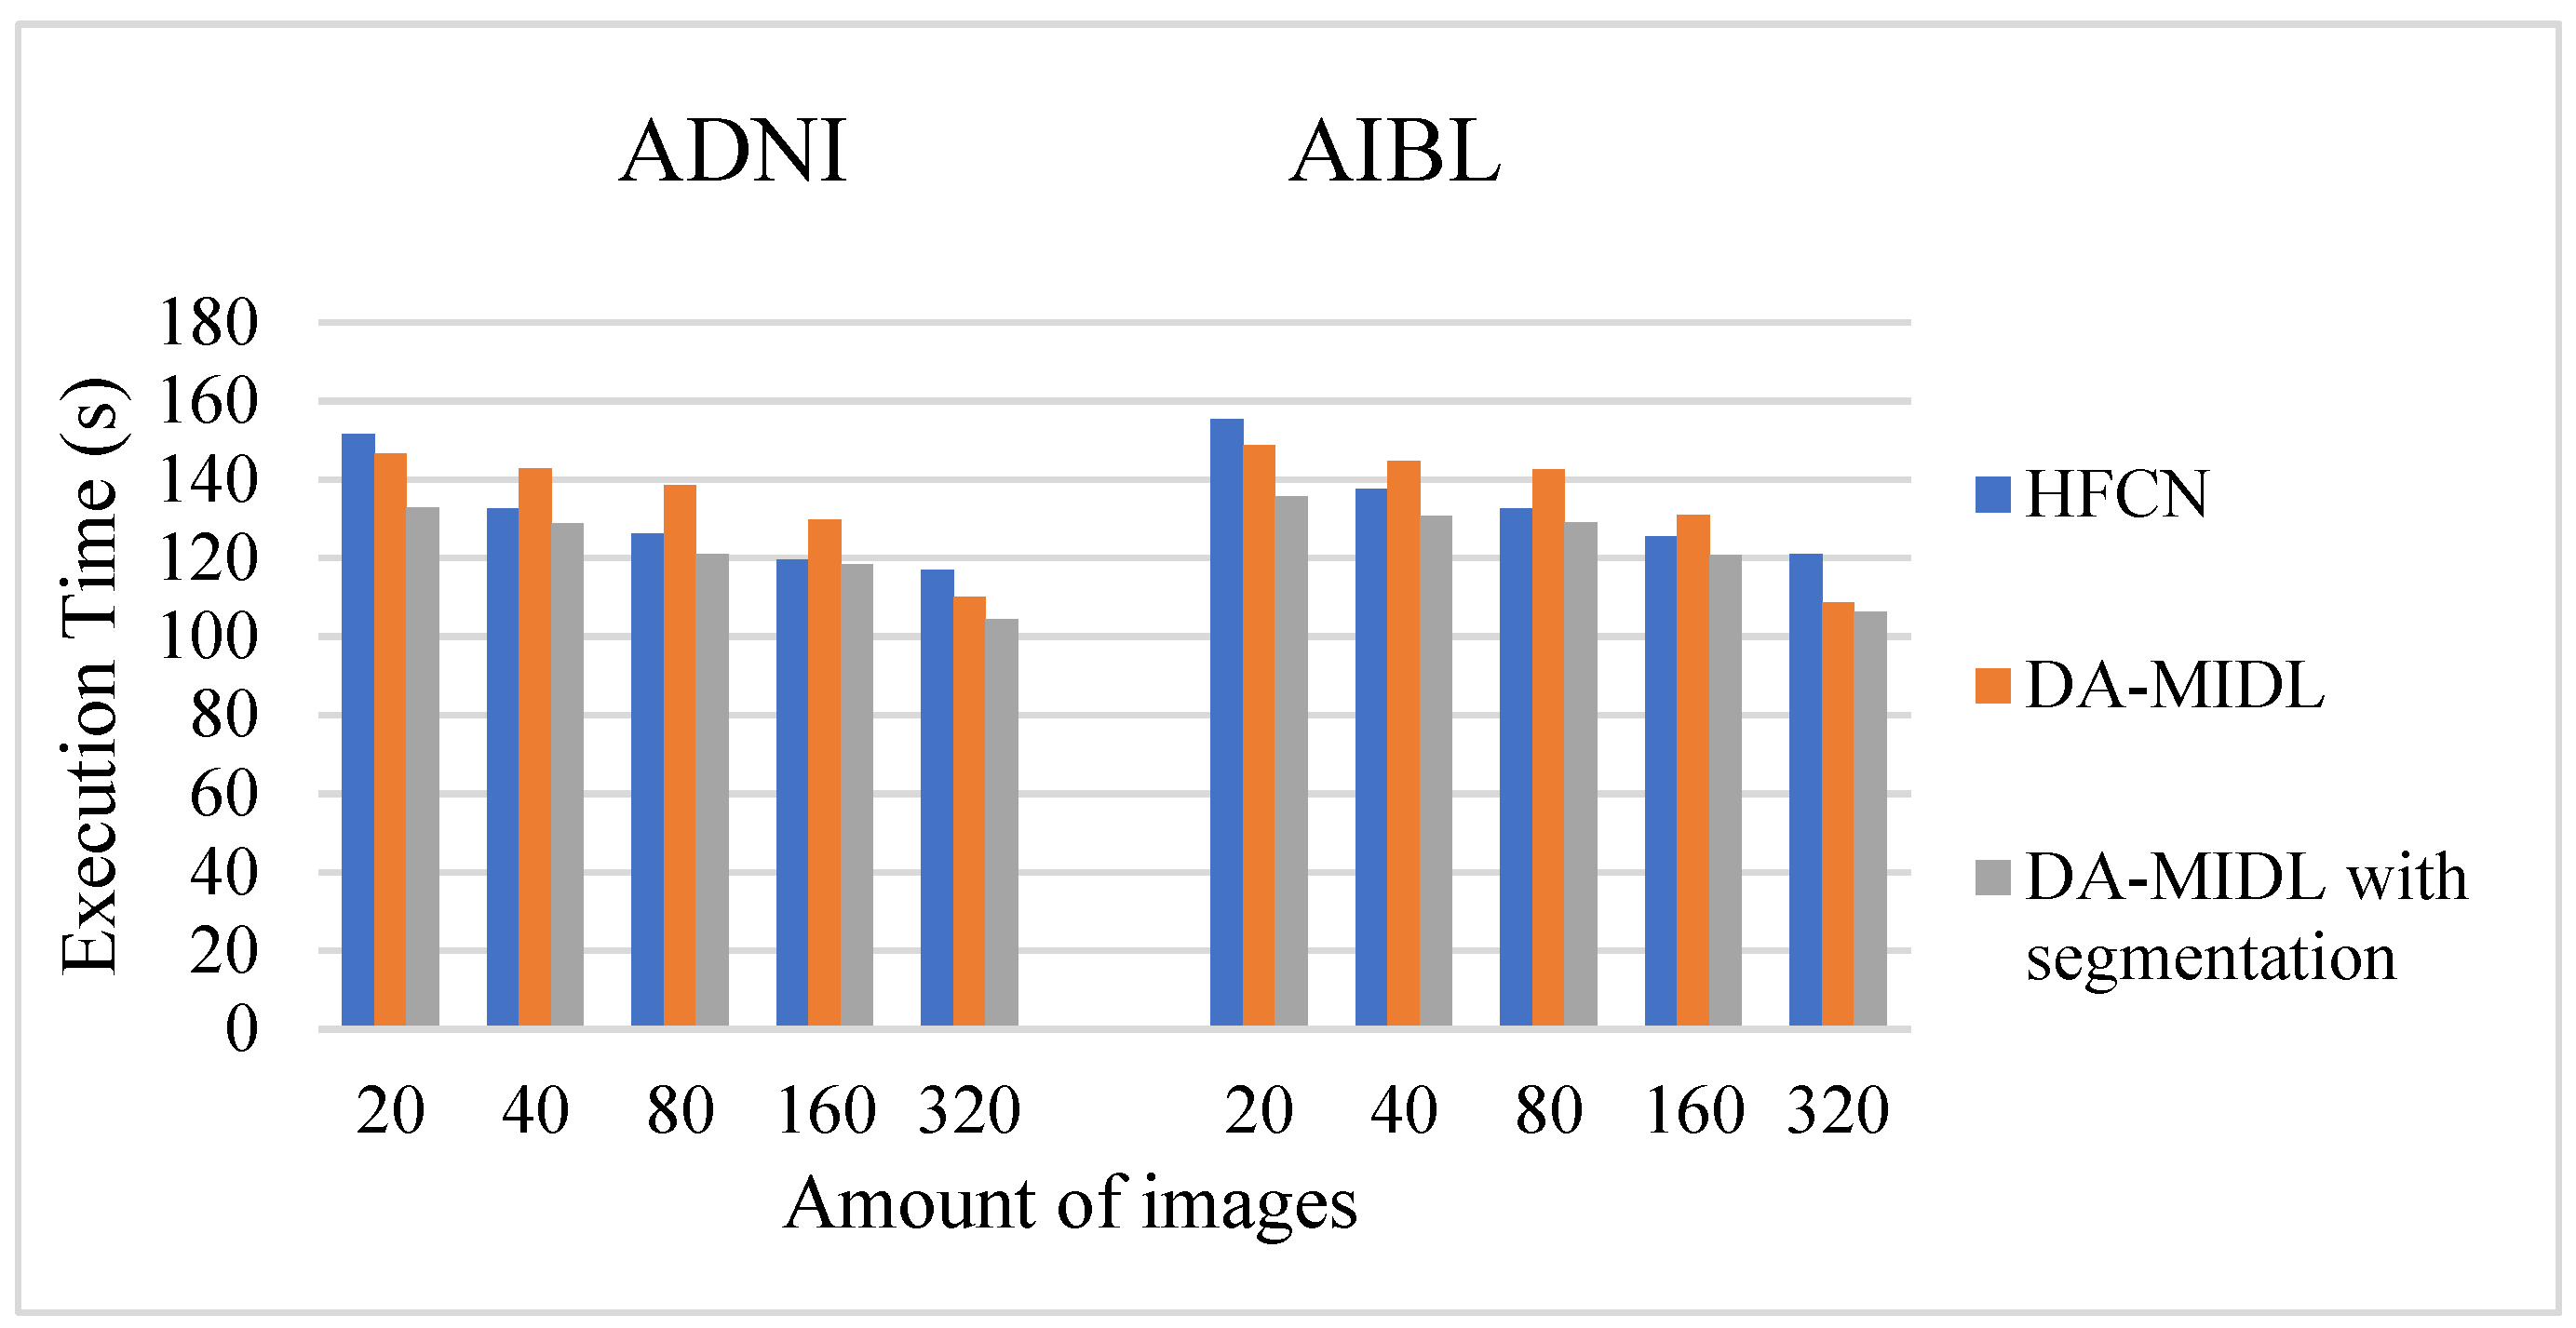
4.5. Execution Time Comparison Outcome

The validation phase execution time is provided in Figure 8 in accordance with current studies in the process of evaluating the performance of the proposed model. Over the course of 20 epochs, the suggested model took around 100 s to train. The time it took to compute DA-MIDL and HFCN did not decrease significantly. Other performance evolution indicators such as sensitivity, specificity, and accuracy showed that DA-MIDL with segmentation had a superior prediction accuracy.

5. Conclusions and Future Work

The timely screening of AD and MCI is critical for patient care and research. It is commonly acknowledged that preventive actions are critical in delaying or reducing the onset of AD. The primary problems for the categorization task of distinct phases of AD progression are the smaller number of training samples and the greater number of feature representations. This work uses computer image processing techniques to address this issue. It combines an optimized OTSU multi-threshold segmentation based on EFEHO with a DA-MIDL for computer-aided AD diagnosis. Our recommended DA-MIDL technique was tested on 1689 patients from two separate datasets in several AD-related diagnosis tests. The impact of picture segmentation means that the identification retains its original accuracy, considerably enhancing image segmentation speed and matching real-time processing needs. The test outcomes show that our technique can detect discriminative abnormal areas in sMRI scans and outperform various conventional approaches.
Research is being done to increase accuracy by developing classifiers, potentially using an ensemble technique and feature selection. In addition, we will investigate the implementation of automatic hyperparameter tweaking, utilizing the deep learning technique and various optimization techniques, in future work.

Funding

This research received no external funding.

Institutional Review Board Statement

Not applicable.

Informed Consent Statement

Not applicable.

Data Availability Statement

Not applicable.

Acknowledgments

The author would like to thank the Deanship of Scientific Research at Shaqra University for supporting this work. Data collection and sharing for this project was funded by the Alzheimer’s Disease Neuroimaging Initiative (ADNI) (National Institutes of Health Grant U01 AG024904) and DOD ADNI (Department of Defense award number W81XWH-12-2-0012). ADNI is funded by the National Institute on Aging, the National Institute of Biomedical Imaging and Bioengineering, and through generous contributions from the following: AbbVie, Alzheimer’s Association; Alzheimer’s Drug Discovery Foundation; Araclon Biotech; BioClinica, Inc.; Biogen; Bristol-Myers Squibb Company; CereSpir, Inc.; Cogstate; Eisai Inc.; Elan Pharmaceuticals, Inc.; Eli Lilly and Company; EuroImmun; F. Hoffmann-La Roche Ltd. and its affiliated company Genentech, Inc.; Fujirebio; GE Healthcare; IXICO Ltd.; Janssen Alzheimer Immunotherapy Research & Development, LLC.; Johnson & Johnson Pharmaceutical Research & Development LLC.; Lumosity; Lundbeck; Merck & Co., Inc.; Meso Scale Diagnostics, LLC.; NeuroRx Research; Neurotrack Technologies; Novartis Pharmaceuticals Corporation; Pfizer Inc.; Piramal Imaging; Servier; Takeda Pharmaceutical Company; and Transition Therapeutics. The Canadian Institute of Health Research is providing funds to support ADNI clinical sites in Canada. Private sector contributions are facilitated by the Foundation for the National Institutes of Health (www.fnih.org, accessed on 3 January 2022). The grantee organization is the Northern California Institute for Research and Education, and the study is coordinated by the Alzheimer’s Therapeutic Research Institute at the University of Southern California. ADNI data are disseminated by the Laboratory for Neuro Imaging at the University of Southern California.

Conflicts of Interest

The author declares no conflict of interest.

References

  1. Rosow, K.; Holzapfel, A.; Karlawish, J.H.; Baumgart, M.; Bain, L.J.; Khachaturian, A.S. Countrywide strategic plans on Alzheimer’s disease: Developing the framework for the international battle against Alzheimer’s disease. Alzheimer’s Dement. 2011, 7, 615–621. [Google Scholar] [CrossRef] [PubMed]
  2. Frisoni, G.B. Structural imaging in the clinical diagnosis of Alzheimer’s disease: Problems and tools. J. Neurol. Neurosurg. Psychiatry 2001, 70, 711–718. [Google Scholar] [CrossRef] [PubMed] [Green Version]
  3. Moradi, E.; Pepe, A.; Gaser, C.; Huttunen, H.; Tohka, J. ADNeuroimaging Initiative. Machine learning framework for timely MRI-based Alzheimer’s conversion diagnosis in MCI subjects. Neuroimage 2015, 104, 398–412. [Google Scholar] [CrossRef] [PubMed] [Green Version]
  4. Forouzannezhad, P.; Abbaspour, A.; Fang, C.; Cabrerizo, M.; Loewenstein, D.; Duara, R.; Adjouadi, M. A survey on applications and analysis techniques of functional magnetic resonance imaging for Alzheimer’s disease. J. Neurosci. Methods 2019, 317, 121–140. [Google Scholar] [CrossRef]
  5. Cuingnet, R.; Gerardin, E.; Tessieras, J.; Auzias, G.; Lehéricy, S.; Habert, M.-O.; Chupina, M.; Benali, H.; Colliot, O.; The Alzheimer’s Disease Neuroimaging Initiative1. Automatic categorization of patients with ADfrom structural MRI: Comparing ten techniques using the ADNI database. Neuroimage 2011, 56, 766–781. [Google Scholar] [CrossRef] [Green Version]
  6. Coupe, P.; Eskildsen, S.F.; Manjon, J.V.; Fonov, V.S.; Pruessner, J.C.; Allard, M.; The Alzheimer’s Disease Neuroimaging Initiative. Scoring by nonlocal image patch estimator for timely detection of Alzheimer’s disease. Neuroimage 2012, 1, 141–152. [Google Scholar] [CrossRef]
  7. Dukart, J.; Schroeter, M.L.; Mueller, K.; ADNeuroimaging. Age correction in dementia–matching to a healthy brain. PLoS ONE 2011, 6, e22193. [Google Scholar] [CrossRef]
  8. Tanveer, M.; Richhariya, B.; Khan, R.U.; Rashid, A.H.; Khanna, P.; Prasad, M.; Lin, C.T. Machine learning techniques for the diagnosis of Alzheimer’s disease: A review. ACM Trans. Multimed. Comput. Commun. Appl. 2020, 16, 1–35. [Google Scholar] [CrossRef]
  9. Noor, M.B.T.; Zenia, N.Z.; Kaiser, M.S.; Al Mamun, S.; Mahmud, M. Application of deep learning in detecting neurological disorders from magnetic resonance images: A survey on detecting Alzheimer’s disease, Parkinson’s disease and schizophrenia. Brain Inform. 2020, 7, 11. [Google Scholar] [CrossRef]
  10. Lin, W.; Tong, T.; Gao, Q.; Guo, D.; Du, X.; Yang, Y.; Guo, G.; Xiao, M.; Du, M.; Qu, X.; et al. Convolutional neural networks-based MRI image analysis for the ADdiagnosis from mild cognitive impairment. Front. Neurosci. 2018, 12, 777. [Google Scholar] [CrossRef]
  11. Mirjalili, S.; Mirjalili, S.M.; Lewis, A. Grey wolf optimizer. Adv. Eng. Softw. 2014, 69, 46–61. [Google Scholar] [CrossRef] [Green Version]
  12. Zamani, H.; Nadimi-Shahraki, M.H.; Gandomi, A.H. Starling murmuration optimizer: A novel bio-inspired algorithm for global and engineering optimization. Comput. Methods Appl. Mech. Eng. 2022, 392, 114616. [Google Scholar] [CrossRef]
  13. Nadimi-Shahraki, M.H.; Fatahi, A.; Zamani, H.; Mirjalili, S.; Abualigah, L.; Abd Elaziz, M. Migration-based moth-flame optimization algorithm. Processes 2021, 9, 2276. [Google Scholar] [CrossRef]
  14. Fan, Z.; Xu, F.; Qi, X.; Li, C.; Yao, L. Categorization of AD based on brain MRI and machine learning. Neural Comput. Appl. 2020, 32, 1927–1936. [Google Scholar] [CrossRef]
  15. Magnin, B.; Mesrob, L.; Kinkingnéhun, S.; Pélégrini-Issac, M.; Colliot, O.; Sarazin, M.; Dubois, B.; Lehéricy, S.; Benali, H. Support vector machine-based categorization of ADfrom whole-brain anatomical MRI. Neuroradiology 2009, 51, 73–83. [Google Scholar] [CrossRef]
  16. Liu, M.; Zhang, D.; Shen, D. Relationship induced multi-template learning for diagnosis of ADand mild cognitive impairment. IEEE Trans. Med. Imaging 2016, 35, 1463–1474. [Google Scholar] [CrossRef] [Green Version]
  17. Li, F.; Tran, L.; Thung, K.H.; Ji, S.; Shen, D.; Li, J. A robust deep technique for improved categorization of AD/MCI patients. IEEE J. Biomed. Health Inform. 2015, 19, 1610–1616. [Google Scholar] [CrossRef] [Green Version]
  18. Wang, Z.; Zheng, Y.; Zhu, D.C.; Bozoki, A.C.; Li, T. Categorization of Alzheimer’s disease, mild cognitive impairment and normal control subjects using resting-state fMRI based network connectivity analysis. IEEE J. Transl. Eng. Health Med. 2018, 6, 1801009. [Google Scholar] [CrossRef]
  19. Hazarika, R.A.; Abraham, A.; Kandar, D.; Maji, A.K. An improved LeNet-Deep Neural Network technique for ADcategorization using Brain Magnetic Resonance Images. IEEE Access 2021, 9, 161194–161207. [Google Scholar] [CrossRef]
  20. Zhu 2021, W.; Sun, L.; Huang, J.; Han, L.; Zhang, D. Dual Attention Multi-Instance Deep Learning for ADDiagnosis with Structural MRI. IEEE Trans. Med. Imaging 2021, 40, 2354–2366. [Google Scholar] [CrossRef]
  21. Song, X.; Mao, M.; Qian, X. Auto-Metric Graph Neural Network Based on a Meta-learning Strategy for diagnosing Alzheimer’s disease. IEEE J. Biomed. Health Inform. 2021, 25, 3141–3152. [Google Scholar] [CrossRef] [PubMed]
  22. Feng, C.; Elazab, A.; Yang, P.; Wang, T.; Zhou, F.; Hu, H.; Xiao, X.; Lei, B. Deep learning framework for ADdiagnosis via 3D-CNN and FSBi-LSTM. IEEE Access 2019, 7, 63605–63618. [Google Scholar] [CrossRef]
  23. Liu, M.; Zhang, J.; Adeli, E.; Shen, D. Landmark-based deep multiinstance learning for brain disease diagnosis. Med. Image Anal. 2018, 43, 157–168. [Google Scholar] [CrossRef] [PubMed]
  24. Lian, C.; Liu, M.; Zhang, J.; Shen, D. Hierarchical fully convolutional network for joint atrophy localization and ADdiagnosis using structural MRI. IEEE Trans. Pattern Anal. Mach. Intell. 2020, 42, 880–893. [Google Scholar] [CrossRef] [PubMed]
  25. Abuhmed, T.; El-Sappagh, S.; Alonso, J.M. Robust hybrid deep learning models for Alzheimer’s progression detection. Knowl. Based Syst. 2021, 213, 106688. [Google Scholar] [CrossRef]
  26. Basheera, S.; Ram, M.S.S. Convolution neural network–based Alzheimer’s disease classification using hybrid enhanced independent component analysis based segmented gray matter of T2 weighted magnetic resonance imaging with clinical valuation. Alzheimer’s Dement. Transl. Res. Clin. Interv. 2019, 5, 974–986. [Google Scholar] [CrossRef]
  27. Ellis, K.A.; Bush, A.I.; Darby, D.; De Fazio, D.; Foster, J.; Hudson, P.; AIBL Research Group. The Australian Imaging, Biomarkers and Lifestyle (AIBL) study of aging: Methodology and baseline characteristics of 1112 individuals recruited for a longitudinal study of Alzheimer’s disease. Int. Psychogeriatr. 2009, 21, 672–687. [Google Scholar] [CrossRef] [Green Version]
  28. Murugan, T.M.; Baburaj, E. Comparison of Hybrid Elephant Herding Optimization with Different Evolutionary Optimization Algorithms. ICTACT J. Soft Comput. 2020, 10, 2171–2182. [Google Scholar]
  29. Tuba, E.; Alihodzic, A.; Tuba, M. Multilevel image thresholding using elephant herding optimization procedure. In Proceedings of the 2017 14th International Conference on the Engineering of Modern Electric Systems (EMES), Oradea, Romania, 1–2 June 2017; pp. 240–243. [Google Scholar]
Figure 1. The basic structure of the suggested approach for AD detection.
Mathematics 10 01259 g001
Figure 2. Flow chart of EFEHO to OTSU.
Mathematics 10 01259 g002
Figure 3. Illustration of the DA-MIDL [20]. Reprinted with permission from ref. [20]. Copyright 2021 IEEE.
Mathematics 10 01259 g003
Figure 4. Accuracy comparison outcomes between DA-MIDL, HFCN, and the proposed DA-MIDL with segmentation.
Mathematics 10 01259 g004
Figure 5. Sensitivity comparison outcomes between DA-MIDL, HFCN, and proposed DA-MIDL with segmentation.
Mathematics 10 01259 g005
Figure 6. Specificity comparison outcomes between DA-MIDL, HFCN, and proposed DA-MIDL with segmentation.
Mathematics 10 01259 g006
Figure 7. AUC comparison outcomes between DA-MIDL, HFCN, and proposed DA-MIDL with segmentation.
Mathematics 10 01259 g007
Figure 8. Execution time comparison outcomes between DA-MIDL, HFCN, and the proposed DA-MIDL with segmentation.
Mathematics 10 01259 g008
Table 1. Improved fuzzy rules.
SFRBPScale Factor
SmMeLa
SmLaSmSm
MeLaMeSm
LaLaMeSm
Table 2. Hyper parameter values of DA-MIDL.
Hyper ParameterValues
Number of features (c)512
Learning rate0.1
epochs60
Patch (k)64,000
loss hyper-parameters (weight is λ and temperature parameter is τ)0.5 and 1.0, respectively
Publisher’s Note: MDPI stays neutral with regard to jurisdictional claims in published maps and institutional affiliations.

