Article

Optimizing PV Microgrid Isolated Electrification Projects—A Case Study in Ecuador

1
Supply Chain and Operations Management Research Group, Escola Tècnica Superior d’Enginyeria Industrial, Universitat Politècnica de Catalunya-BarcelonaTech, 08028 Barcelona, Spain
2
Department of Management, Universitat Politècnica de Catalunya-BarcelonaTech, 08028 Barcelona, Spain
3
Department of Mechanical Engineering, Universitat Politècnica de Catalunya-BarcelonaTech, 08028 Barcelona, Spain
4
Catalan Association of Engineering Without Borders, 08027 Barcelona, Spain
*
Author to whom correspondence should be addressed.
Mathematics 2022, 10(8), 1226; https://doi.org/10.3390/math10081226
Submission received: 16 December 2021 / Revised: 1 April 2022 / Accepted: 5 April 2022 / Published: 8 April 2022

Abstract

:
Access to electricity for the rural and indigenous population of Ecuador’s Amazon Region (RAE) is considered a critical issue by the national authorities. The RAE is an isolated zone with communities scattered throughout the rainforest, where the expansion of the national grid is not a viable option. Therefore, autonomous electrification systems based on solar energy constitute an important solution, allowing the development of indigenous populations. This work proposes a tool for the design of stand-alone rural electrification systems based on photovoltaic technologies, including both microgrid or individual supply configurations. This tool is formulated as a Mixed Integer Linear Programming model including economic, technical and social aspects. This approach is used to design electrification systems (equipment location and sizing, microgrid configurations) in three real communities of the RAE. The results highlight the benefits of the developed tool and provide guidelines regarding RAE’s electrification.

1. Introduction

Currently, access to electricity remains a critical issue for around 1.1 billion people worldwide, generally affecting those living in rural contexts, where poverty levels are high. Indeed, both aspects (energy access and poverty) are closely connected, as proved by the Seventh Sustainable Development Goal stated by the United Nations (“ensure access to affordable, reliable sustainable and modern energy for all”) [1]. This goal explicitly views access to energy as key to improving the living conditions of the most underprivileged populations, “a backbone of any modern economy” [2]. In this sense, several recent studies highlight the fact that electricity access is linked to increased incomes and productivity (different to agricultural activities [3]), as well as benefits in education (increased study time) and health (decrease in respiratory diseases due to lower kerosene usage) [4]. In order to improve electricity coverage, the extension of the national grid has been the main strategy for providing access to electricity. However, in areas with rough topography or remote population centers, the expansion of the national distribution grid may become infeasible [5]. In those cases, the development of off-grid electrification systems and microgrids is among the most economical solutions and has been successfully adopted in many practical frameworks [6]. Besides this, for such stand-alone generation systems, the current concern about global warming and the resulting interest in alternative energy sources have led to the intensive use of renewable resources. In particular, solar energy remains one of the most widely employed sources [7].
In this framework, different kinds of electrification systems have been tackled in the devoted literature, in many distinct worldwide contexts. For instance, regarding large-scale electrification (national or regional), Ehsan and Yang [8] highlight the tendency to formulate the integration and planning of generation systems based on renewable energy as an optimization problem. The model proposed in [9] for renewable allocation planning in large-scale power systems considers a dynamic environment leading to the expansion/reduction of the current network. Hassan [10] uses simulation to optimize solar photovoltaic-based generation systems in Iraq, considering two configurations, namely off-grid and on-grid versions (when possible). Taye et al. [11] use Geographical Information Systems (GIS) and a multi-criteria decision-making technique for rural electrification planning, allowing for an evaluation of the adequacy of renewable energy in Ethiopia. Through the application of the Analytic Hierarchy Process, they conclude that wind and particularly solar energies should be preferred rather than grid extension. In addition, several computational tools were recently developed, in particular for rural electrification planning. For instance, the REM (Reference Electrification Model [12]) focuses on the use of off-grid generation systems in order to plan electricity networks and has been used in several countries (India, Colombia, Kenya, Rwanda, etc.). Furthermore, OnSSET [13] is an open-source tool using GIS that is designed to complement energy planning models not supported by geographical analysis and that quantifies the investment, technology type and geo-referencing of national electrification projects based either on conventional or renewable energy technologies. Also obeying an open-source philosophy, recently developed Python-based tools represent free access alternatives. For instance, PyPSA (Python for Power System Analysis [14]) is a free toolbox for simulating and optimizing modern power systems, accounting for alternative working modes (conventional generators, variable wind and solar generation, storage units, mixed alternating and direct current networks, etc.) and with an improved scalability for dealing with large networks and long time series. Another recent computational tool for microgrid design, Sandia’s Microgrid Design Toolkit [15], allows for the generation of design optimizations according to several criteria (investment and operation costs, reliability, performance levels) in order to produce a Pareto frontier of efficient configurations promoting the microgrid over individual supply systems. Based on advanced optimization and modeling approaches, it has been used to provide electricity in several military and public infrastructures worldwide.
At a local level, Bahramara et al. [16] review works using the well-established commercial tool HOMER [17], particularly focusing on the design of hybrid renewable energy systems. For instance, in [18], such a tool is used to design and analyze the robustness of environmental-friendly systems to be installed in Malaysian islands. In addition, interest is increasingly devoted to the design of microgrids, which are reduced-size grids connecting several users isolated from the national grid. Several applications have demonstrated that the design of self-sufficient microgrids produces higher benefits than those obtained by individual systems [19] and also reduces the life cycle environmental impact of the electrification systems [20]. Despite the additional complexity associated with the design of microgrid topologies, this strategy allows the energy supply to be independent from the resources available at demand points, cost savings thanks to economies of scale for shared equipment and supply flexibility in case of an increase in demand [21]. Accordingly, many studies have tackled the design of microgrid distribution structures around the world. The reader is referred to the recent surveys of Peters et al. [22] as well as Castilla et al. [23] for a perspective on the use of microgrids in Latin America, Mahomed et al. [24] in Uganda, Tenenbaum et al. [25] in sub-Saharan Africa or Lukuyu et al. [26] in East Africa. These studies insist on the need for adequate design and planning tools for microgrid-based electrification projects, supported by objective demand projection methodologies and developed in collaboration with local actors to account for the population’s specific requirements.
Regarding the solving procedures, mathematical models have been developed with the aim of providing effective configurations (in terms of cost or any other performance criterion). Indeed, these models are adapted to the particular application addressed and may involve distinct configurations (individual/microgrid), energy sources or other features specific to each case study and to the communities to be electrified [27]. For instance, Leithon et al. [28] develop a model for energy allocation policy that minimizes energy usage. In [29], an optimization approach is developed for the electrification of highland communities in Peru through a model integrating social constraints associated with system management and community benefits. Ranaboldo et al. [30] develop optimization models including the particular considerations of electrification systems in Cabo Verde. Heuristic procedures have also been used. For instance, several matheuristics are introduced in [31], representing computationally efficient tools to optimize rural electrification systems involving both microgrids and individual supply. Moreover, different multi-criteria approaches (VIKOR and AHP) are compared in [32] for microgrid design in Venezuela, including economic (investment, maintenance and operation costs), social and environmental criteria. Finally, Python-based free access libraries have also been developed in this context, such as MicrogridsPy [33]. This tool tackles the problem of generation equipment sizing (Li-ion batteries, diesel generators and PV panels) and energy dispatching in remote and isolated contexts by minimizing the Levelized Cost of Energy (LCOE).
The above-mentioned studies emphasize the possibility of designing economically efficient and environmentally resilient off-grid generation systems based on renewable energies. This is particularly relevant for the so-called “last-mile” electrification (as opposed to mass electrification, for which different strategies such as grid expansion may provide better results). “Last-mile” electrification projects are not only useful in the context of, for example, small islands [34], where diesel generators might be replaced by photovoltaic and wind energies, as they have a great impact on greenhouse gas emissions while producing significant economic benefits. In several Latin American countries, both the Amazon (rainforest) and Andean (highlands) regions typically show rough terrains and represent massive challenges, such as reported for Brazil [35], Colombia [36] or Bolivia, Peru and Argentina [37]. In this framework, Ecuador is a country with a wide-spread national grid and high global access to electricity, but the indigenous populations of the Amazon basin are scattered over large areas covered by rainforest, leading to prohibitive costs for expanding the national grid. Furthermore, the difficulty in reaching these isolated communities and their fragile economic resources make electrification projects neither profitable for private distributors nor sustainable for governments. So, the aforementioned stand-alone, renewable-based systems appear as a viable electrification strategy. To the best of our knowledge, only one study has reported on the design of such systems in Ecuador [38]. Carried out in the Santa Elena province, this work reports the design of hybrid wind–photovoltaic systems through HOMER, concluding that most of the energy is supplied by PV cells. However, the paper does not account for microgrid formation, although such configurations are promoted among the guidelines stated by Ecuador’s Ministry of Electricity and Renewable Energies (MEER) [39].
Thus, the present work addresses the development of autonomous electrification systems for isolated communities in the Amazon Region of Ecuador (RAE) by optimizing the design of PV-based systems involving microgrids. Thanks to a detailed analysis of the relevant local factors to be accounted for, a Mixed Integer Linear Program (MILP) is introduced as a computational tool for the automatic design of such electrification systems. This model extends several state-of-the-art approaches. In particular, Ferrer-Martí et al. [40] set out the basis of rural electrification system modeling involving hybrid generation and microgrids. Domenech et al. [29], in addition, include management and social constraints in the design phase. Despite considering some elements of these previous studies, our model accounts for characteristics that are specific to the RAE and therefore represents a novel design tool, which could yet be extrapolated to other contexts. In particular, the contribution in terms of new modeling features is threefold:
  • A set of potential connections is established, indicating impossible wiring between different geographical points. This new constraint, motivated by local factors (explained in the following sections), is addressed through a decomposition strategy of the original problems that allows a more efficient solution process.
  • A new objective function now incorporates the parametrized ponderation of the costs of microgrids versus individual systems. This novel feature is motivated by the electrification policies dictated by Ecuador’s national government, promoting microgrid configurations. However, the versatility of the formulation proposed here allows either one or the other configuration to be favored according to any policy makers’ decisions.
  • For cultural reasons in the RAE, items shared by the members of a community cannot be stored on private ground. This requirement is reflected in the model by new constraints, which prevent microgrid generation units from being located at demand points.
Thus, this model constitutes a tool adapted to RAE conditions for assisting project promoters in the design of electrification systems. Three case studies addressing the electrification of indigenous communities in the RAE are subsequently solved in order to validate the proposed tool.
The remainder of this work is organized as follows. Section 2 presents a context analysis regarding electrification processes in Ecuador, a description of the electrification systems accounted for and their specific conditioning features in the RAE. The proposed mathematical model is described in Section 3, while Section 4 presents the case studies addressed and the numerical results obtained. Finally, some conclusions and prospects for future works are provided in Section 5.

2. Context Analysis for the Design of Stand-Alone Electrification Systems in the RAE

2.1. Overview of the Electrification Process in Ecuador

The Republic of Ecuador is a Latin American country with an area of 283,561 km2 and about 17 million inhabitants. Despite the growth of its Gross Domestic Product, strong inequalities mean that more than 20% of Ecuadorians suffer from poverty, particularly in rural and indigenous communities. Besides, Ecuador has some of the greatest biodiversity in the world, meaning that environmental protection is a prominent feature of the country’s landscape. In this context, government policies for the development of the national electricity system must find a trade-off between socio-economic development and environmental conservation [41]. Accordingly, efforts have been made by national authorities to guarantee a reliable and competitive electricity supply, supervised by the Regulatory Agency and Electricity Control. These measures have led to a significant increase in the total electricity generated [42] and the expansion of the national grid, reaching one of the best coverages in the sub-continent: 97.33% national access and 94% of the rural population in 2017 [43]. However, the development of Ecuador’s electrification process still faces two important challenges.
First, some diversification is needed regarding the generation matrix. As stressed in [44], the only consistent trend in Ecuadorian energy policies has been the development of hydroelectricity, which represented more than 73% of the generation matrix in 2017 [42]. However, this strategy is criticized by indigenous communities and environmentalist associations due to its environmental impact [45]. Several studies have also emphasized the great potential of solar and wind energies and their advantages regarding socio-economic development and environmental conservation [41]. Adopting photovoltaic technologies may yield long-term benefits in terms of pollution abatement and climate change mitigation [39]. Accordingly, the Fund for Electrification of Rural and of Marginal Urban Areas (created in 2004, in order to improve electricity coverage in disadvantaged areas) initiated rural electrification programs relying on PV generation in the Amazonian and highland regions or hybrid systems in the Galapagos islands [46]. More recently, the current administration is promoting PV-powered microgrid designs for remote areas rather than individual systems [39]. Despite these efforts, solar and wind energies did not represent more than 0.5% of the primary sources used for electricity generation in 2017.
On the other hand, there are still some glaring inequalities in electricity access in the RAE. In spite of the efforts made to increase coverage in the corresponding provinces (Pastaza, Sucumbíos, Orellana, Napo, Morona and Zamora), their impact was undermined by the limited amount of economic resources. Indeed, the RAE (40% of Ecuador’s total area) is characterized by the highest poverty levels in Ecuador and has the lowest electrification rates, particularly in rural areas, since the grid expansion strategy has left a great part of this territory uncovered [43]. Renewable energy technologies have been promoted, but several electrification programs were not considered profitable by the distribution operators and were thus interrupted. Indeed, the maintenance operations of stand-alone systems in rough terrain (rainforest) would either be too costly or require training programs for community members. In addition, the scarce economic resources of these mainly indigenous communities mean that users often cannot afford the electricity service costs, making these projects unsustainable for governments.
Thus, the six RAE provinces produce electricity almost entirely by thermal generation. In the Pastaza province, where the present study was carried out, the electricity coverage currently equals 89.3% (compared to 97.33% at national level), but the rural electrification rate is much lower (65.9% in 2010 [42]). This situation is particularly unsustainable in one of the most prolific zones for solar energy, where the transportation, firewood consumption and electricity needs (more than 1000 GWh/year) could be entirely covered by PV technologies [47]. Accounting for these general considerations, the systemic approach introduced in this work aims to provide an automatic tool for the design of electrification systems in rural and disadvantaged areas of the RAE, taking advantage of the high PV potential available and promoting the formation of microgrid-based systems.

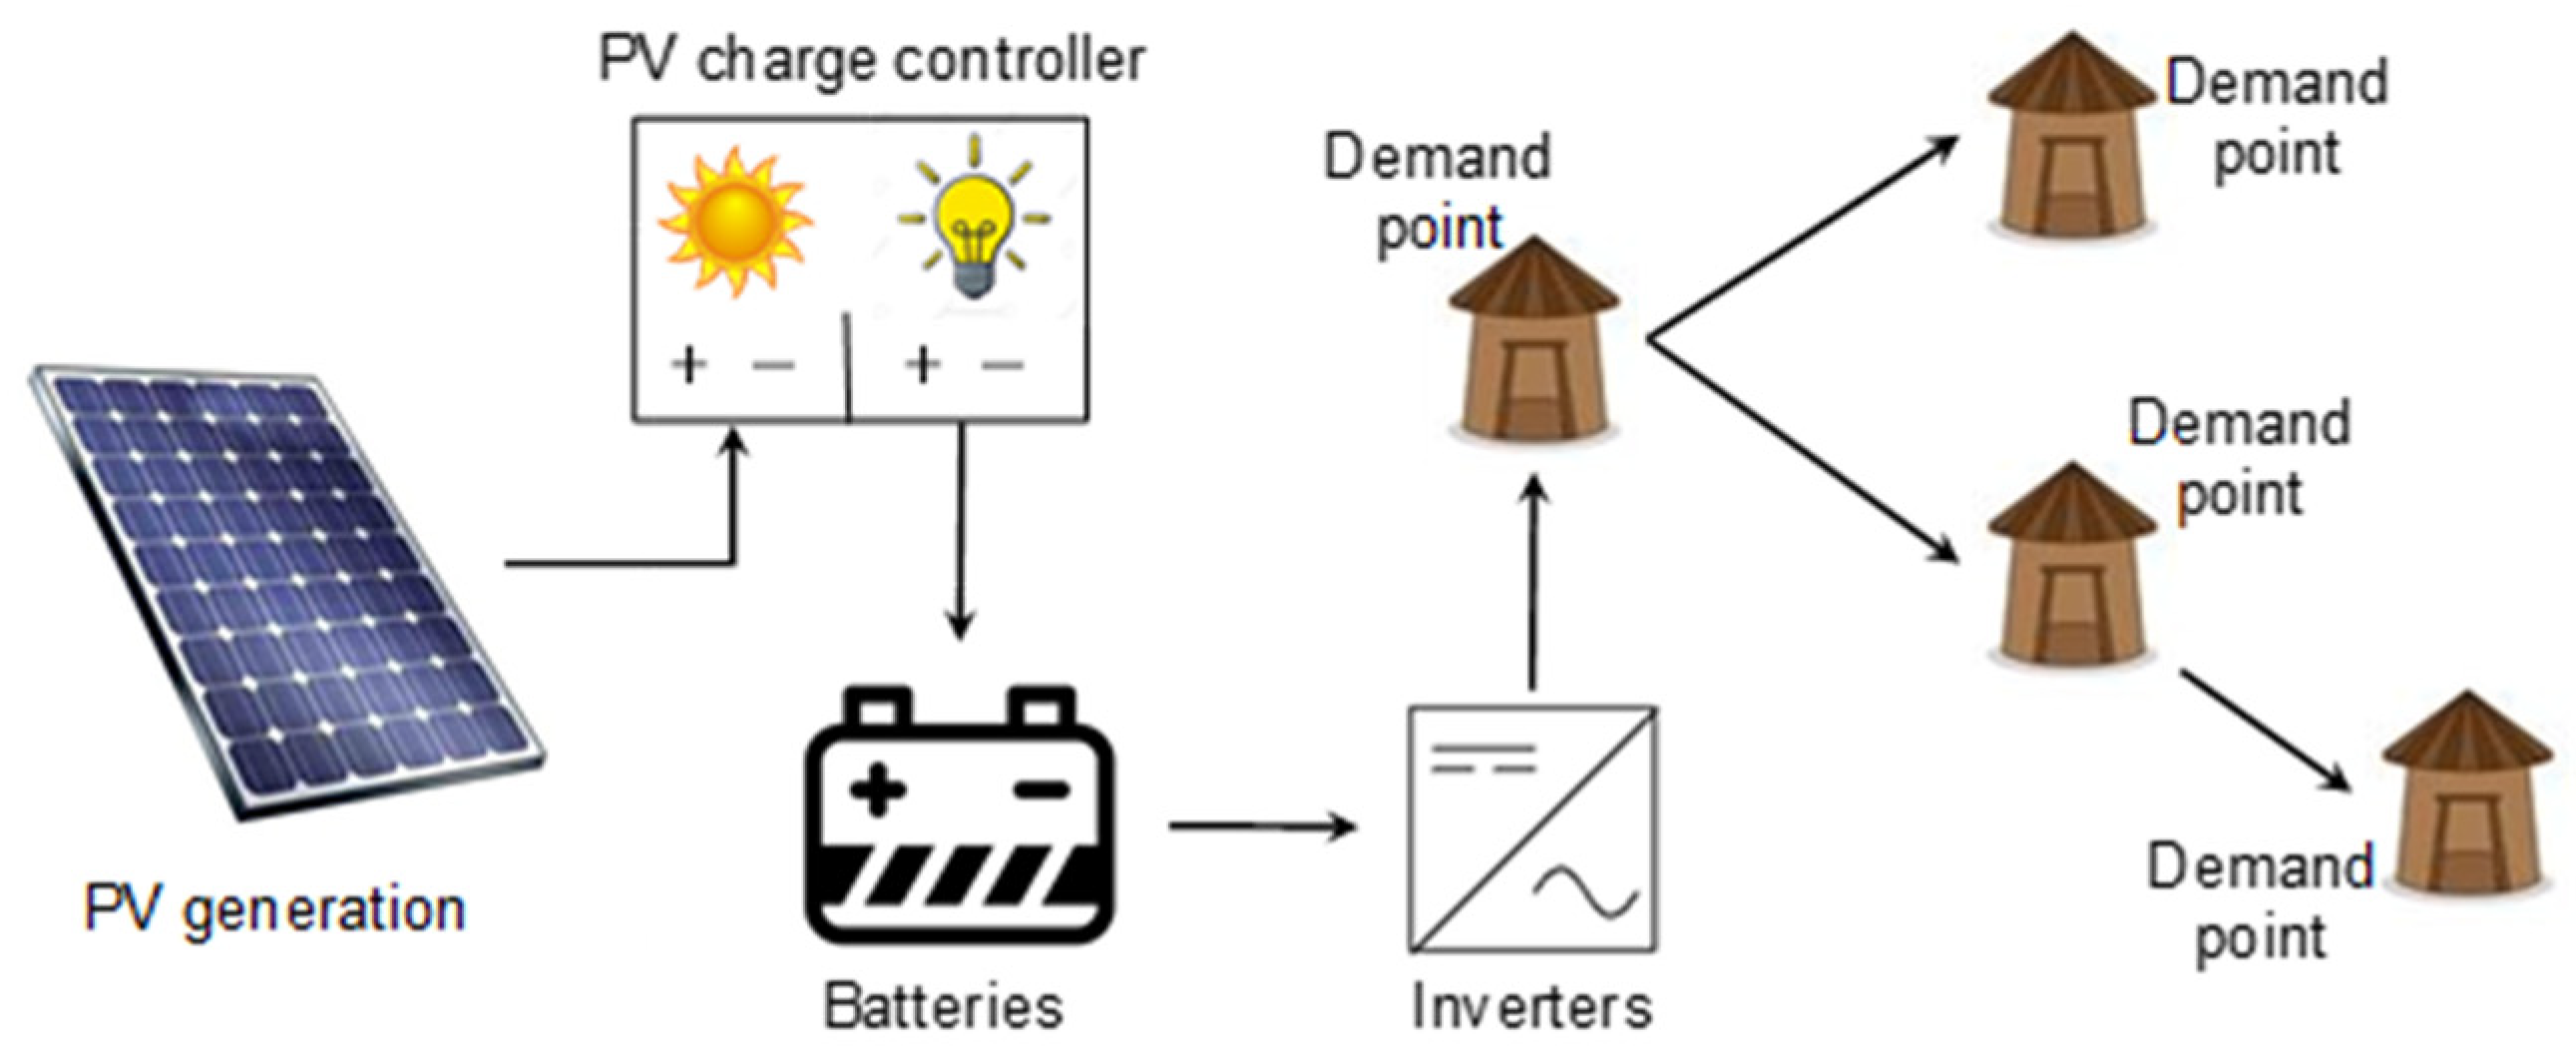
2.2. Technical Description of Stand-Alone Systems

In [47], the authors demonstrate that while the RAE benefits from high solar resources, on the contrary, wind does not constitute a promising energy source. Furthermore, due to the prevailing dense rainforest vegetation, the construction and installation of wind turbines raises practical issues. Therefore, the electrification systems represented here are only based on photovoltaic technology, as illustrated in Figure 1 (with microgrid-based distribution). The electricity is produced by the PV panels, while the controllers protect batteries from overloads and deep discharges. The electricity is then stored in batteries to bridge the gap between generation and consumption. Next, the inverters transform the direct current from batteries into alternating current, which is more suitable for most electrical appliances. Finally, the electricity is distributed to demand points (households, schools, health centers, etc.) via microgrids or individual systems (individual systems are devoted to supplying single-user consumption).
Regarding the microgrid topology, a structure ensuring minimal costs is chosen, respecting the following conditions [48]: (i) power generation is centralized at a single point and (ii) the microgrid has a radial structure (each user can receive electricity from only one point). This structure is illustrated in Figure 1, where the generation units deliver power to four users connected according to a tree-like configuration.

2.3. Conditioning Factors for Stand-Alone Electrification Systems in the RAE

This section analyzes the main features conditioning the design of rural electrification projects with PV technology for indigenous communities in the RAE. This analysis involved studying and understanding the concrete reality of the targeted communities through three main action lines. First, the information obtained from the literature was enhanced with technical documents [49,50] produced by Ecuador’s MEER in coordination with the NGO “Engineers Without Borders” (EWB). Second, information on the local context and needs was comprehensively collected through a 5-month field survey performed by some of the authors of this work. This stay allowed the indigenous population’s lifestyle to be observed as well as the economic, social, environmental or cultural features relevant to the installation of autonomous systems for these communities to be identified. It also made possible an evaluation of the logistics needed for equipment transportation within rainforest conditions. Third, several key actors of rural electrification in Ecuador were interviewed to identify and validate the conditioning features adapted to the RAE’s reality. This phase involved three technicians from the MEER, the leader of the renewable energies area in the power company Empresa Eléctrica Ambato S.A. (Pastaza province) and three coordinators, technicians and volunteers from the energy line of EWB.
The resulting list of conditioning factors encompasses all the features to be accounted for within the design process of electrification systems in the RAE. These considerations are captured in the mathematical model developed for the solution of the addressed problem (see next section).
(a)
National and regional policies contemplate social aspects, such as opting for electrification designs including microgrids rather than individual systems. Indeed, the community-based management of joint installations provides social benefits, such as the coordination and cooperation of families sharing the same objectives. In order to encourage microgrid formation, priority is given to designs including such configurations, even though they entail a higher cost than individual supply systems (up to 20% higher, as proposed by MEER).
(b)
The institutional framework of electrification projects may ensure economies of scale (for instance, when equipment is purchased for district or regional projects) but may also restrict the technical characteristics of power generation and distribution items. In the case study presented here, the limiter boxes allow only two output cables, which may have an impact on the microgrid structure.
(c)
The communication paths available (rivers, airways) and the transportation means to get to the community in question have an impact on the technical equipment employed. Moreover, the current state of these paths may also involve space and weight limitations for the equipment units to be shipped. For instance, the varying water depth in a river (or landing strip dimensions) can limit the size of canoes (or aircraft) that can be used.
(d)
The property concept in some indigenous communities means that the equipment shared by the community cannot be physically installed at a demand point, which is private ground. So, non-demand points should be identified for potential microgrid generation. Furthermore, this means the construction of sheds for electric equipment storage within the area where PV panels are to be located in order to protect batteries, inverters and regulators from weather or animals. This incurs additional costs associated with the purchase and installation of these buildings.
(e)
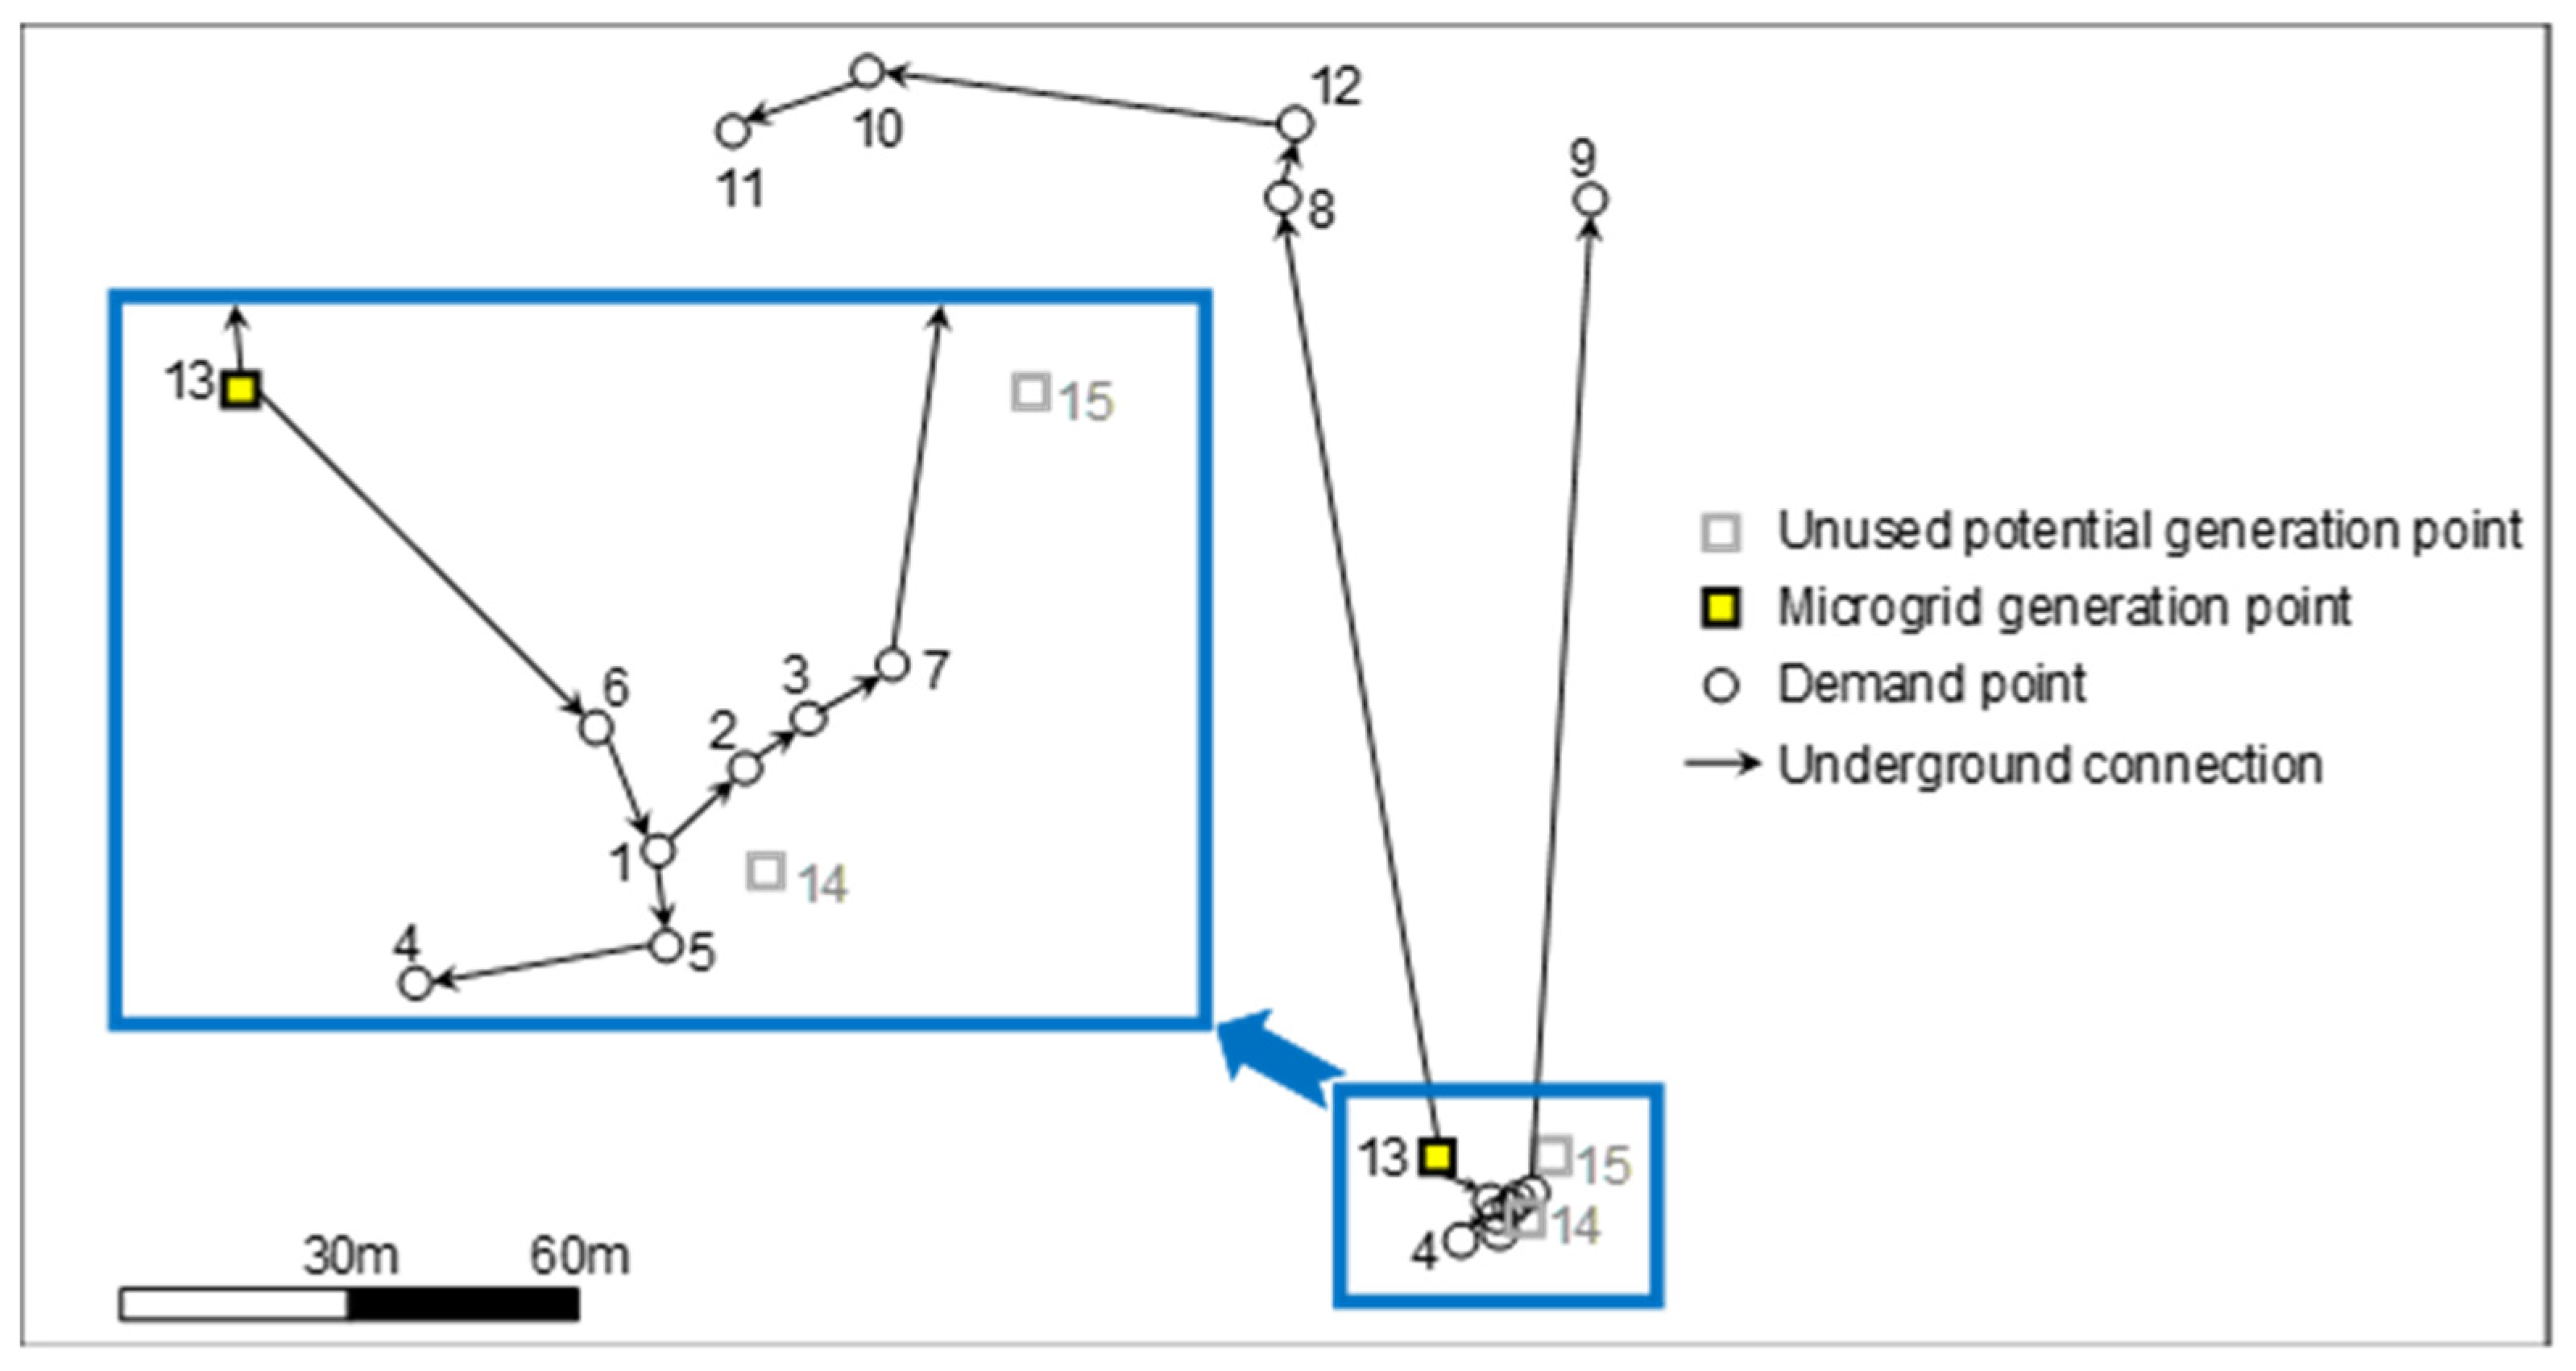
In the Low Amazon region, the increased concern for environmental aspects leads to the development of underground connections rather than air connections. Indeed, despite the advantages of air microgrids in both practical (avoiding obstacles such as rivers, small buildings, etc.) and economic (cheaper installation and maintenance) terms, they have a negative environmental impact due to tree clearing around the microgrid installations. Underground wiring is also better protected from external agents (rain, animals) and presents technical advantages [51]. However, this policy involves constraints due to physical obstacles (river, ravine, floodable area, landing strip, etc.) that may prevent cable installation.
It should be noted that, in the above-mentioned factors, the estimation of end-users’ demand is not mentioned. Evaluating the demand constitutes a critical phase in the design of electrification systems, since this parameter strongly influences the final system configuration [52]. An overestimated demand would lead to oversized systems, both wasting generation capacity and increasing electricity prices [53]. Several studies have highlighted the complexity of this estimation task, involving qualitative and quantitative assessments of the target community and its surroundings, an analysis of the energy sources used prior to electrification, the planned electricity usage and the projection of the demand growth [22,54,55]. In the RAE, the MEER performed such a study, as verified by the field survey carried out in Ecuador by some of the authors of this work. In order to guarantee equal opportunities to every family, the MEER decided to set standardized consumption levels for energy and peak power for all users. In this context, the demand values accounted for in the present study are those determined and imposed by the MEER (see Section 4.2). Note that these demands were conceived as a constant value, so projects may initially be slightly oversized but will be adequate in the medium term, when demand growth occurs during the first years of implementation.
Hence, this analysis identified the key elements ensuring the sustainability of electrification projects in the RAE. This phase sets the conceptual framework necessary for the development of a solution procedure for the design of stand-alone electrification systems in this region.

3. A Mathematical Model for the Design of Autonomous Rural Electrification Systems in the RAE

Since optimization approaches have proven their effectiveness in the framework of electrification system design [56], a mathematical model for stand-alone electrification systems, including the considerations analyzed above, is introduced in this section. The mathematical formulation proposed in this work includes parts of the procedure presented in [57] and further accounts for all the conditioning factors described in the previous section. The proposed method for the development of the mathematical tool introduced here is shown in Figure 2.
This new MILP aims to determine the details of the electrification design (individual and/or microgrid configurations, equipment location and selection, etc.) in order to minimize the project cost. To further highlight the original features of the tackled problem and the novelty of the model developed accordingly, their main characteristics are listed in Table 1, and the comparison with similar works emphasizes that no other approach considers all of them. In particular, the versatility in promoting either microgrid or individual supply configurations and the restriction on microgrid generation equipment being located at demand points are introduced for the first time in this work. Therefore, the electrification solutions obtained with the model proposed here, which responds to RAE’s social, cultural and environmental requirements, could not be obtained with other tools, thus confirming the contribution of the present work. At the same time, since these requirements may be found in plenty of contexts different from RAE’s, such as many isolated regions in Latin America [58] and Africa [24,26], and since the model proposed here also includes the classical features needed for the design of electrification systems based on renewables, it can be re-used for other applications in distinct contexts.
The numerical parameters of the model include information regarding demand point locations and requirements, the characteristics of the power generation and distribution equipment, as well as the data associated with the specific RAE features. These parameters are comprehensively defined in Table 2, but further explanations are provided here on the Matrix of Potential Connections.
As stated previously, only underground-wired microgrids are considered. However, the rainforest environment in which the indigenous communities live is normally characterized by floodable terrain. Besides this, obstacles such as rivers or landing strips can prevent underground wiring, thus impeding some direct connections between two points. Thus, all the allowed connections are concatenated in a binary matrix called the Matrix of Potential Connections (MPC), defined for each case study. This matrix of size |P| × |D| has elements equal to 1 if a connection is possible between the two points and 0 otherwise. It is worth mentioning that this matrix may highlight clusters of points completely isolated from the others (i.e., neither direct nor indirect connections can be established between any points of two different clusters).
This information offers two options: treating each community as a whole or breaking it down into several independently solved sub-problems. Indeed, there is no reason to simultaneously solve several physically separated zones, since they cannot be included in the same microgrid anyway. Additionally, due to the combinatorial nature of the MILP model presented hereafter, treating each sub-problem independently might allow significant CPU time savings when compared with solving the global problem. Thus, before using the optimization tool proposed here, a pre-processing step must be performed for each particular case in order to decide if the tackled community should be treated entirely or divided into isolated clusters to be solved independently one from another.
In addition, the decision variables have to account for the system configuration with its associated energy/power flows, as well as the number and type of equipment units to be used for power generation and distribution (see Table 3). The objective function consists in minimizing the total investment cost for wind turbines, PV panels, PV controllers, batteries, inverters, meters (to be installed at all the demand points in a microgrid, to grant equality of the provided services for all users) and wires. In addition, as stated in point d) of the conditioning factors (Section 2.3), a cultural requirement is that the generation equipment of (community-shared) microgrid systems cannot be set at demand points (private ground), meaning that additional costs corresponding to the installation of a shed for equipment storage have to be included.
Moreover, as explained in point (a) of Section 2.3, MEER’s policy prioritizes microgrid-based designs over individual systems. Therefore, configurations including microgrids will be preferred even if their cost is up to α% higher than individual supply systems. Practically, the cost associated with all the items belonging to a microgrid will be multiplied by 1/(1 + α/100), which is equivalent to reducing the corresponding cost by a factor α/(α + 100)%. The generation costs of individual systems (at demand points) can easily be distinguished from those of microgrid configurations by defining microgrid generation points as no-demand points. With regard to α, the MEER proposes 20%, but the influence of this value is also studied through a sensitivity analysis (see next section).
Taking into account these considerations, the objective function is formulated as indicated in Equation (1):
[ M I N ] Z = p D s = 1 S C S s x s p s + p D z = 1 Z C Z z x z p z + p D b = 1 B C B b x b p b + p D i = 1 I C I i x i p i + 1 1 + α 100 [ p P | p D s = 1 S C S s x s p s + p P | p D z = 1 Z C Z z x z p z + p P | p D b = 1 B C B b x b p b + p P | p D i = 1 I C I i x i p i + p P | p D C A x g p + p D C L x l p + p P d Q p c = 1 C L p d C C c x c p d c ]
Constraints (2) and (3) define the generation points (xgp = 1) and bound the number of PV panels (Equation (2)) that can be installed at the same point.
s = 1 S x s p s N S x g p     p P
s = 1 S x s p s x g p     p P
Constraints (4) to (7) aim to cover the daily electricity needs of consumption points and capture the relationship between energy and power. Since the energy demanded by users is not constantly consumed at the same power level, both aspects are modeled with different constraints, as shown in the literature [29,40,57,60]. Hence, constraints (4) and (5) define the daily energy available at each consumption point, bounded by the energy produced by the installed PV panels (either individually or through a microgrid). In particular, constraint (4) enforces the conditions of energy conservation and demand satisfaction (demand points only): the energy arriving at point p plus the energy generated at p itself must be greater than (or equal to) the energy consumed by p plus the energy dispatched. The constraint includes the battery, inverter and wire efficiencies. Constraint (5) is equivalent to constraint (4) for no-demand points.
q P | p Q q f e q p + s = 1 S E S s x s p s E D p η b η i ( 1 η c + ( 1 1 η c ) x g p ) + d Q p f e p d   p D
s = 1 S E S s x s p s d Q p f e p d   p P ; p D
Constraints (6) and (7) are analogous to constraints (4) and (5), but for power demand. The location, type and quantity of inverters are determined according to user’s demand and only consider the wires’ efficiency.
q P | p Q q f p q p + i = 1 I P I i x i p i P D p ( 1 η c + ( 1 1 η c ) x g p ) + d Q p f p p d   p D
i = 1 I P I i x i p i d Q p f p p d   p P ; p D
Constraint (8) and (9), associated with demand and no-demand points, respectively, force batteries to store enough energy to cover user demands, considering the required days of autonomy and the discharge factor.
b = 1 B E B b x b p b + ( D A D B j = 1 D E D j η b η i η c ) ( 1 x g p ) D A D B ( d Q p f e p d + E D p η b η i )   p D
b = 1 B E B b x b p b + ( D A D B j = 1 D E D j η b η i η c ) ( 1 x g p ) D A D B d Q p f e p d   p P ; p D
Constraints (10) and (11), respectively, relate the energy and power flows with the existence of wires. If there is no wire between two points, the energy and power flows are zero; otherwise, they can take some value defined through constraints (4) to (7). The microgrid radial scheme is imposed in constraint (12): each non-generation point can have at most one input wire. Constraint (13) establishes the voltage drop between two points, according to the type of wires. In constraint (14), the flow intensity between two points connected by a wire is bounded by a maximum admissible intensity depending on the wire type.
f e p d ( j D E D j η b η i η c ) c = 1 C x c p d c   p P ; d Q p
f p p d ( j D P D j η c ) c = 1 C x c p d c   p P ; d Q p
q P | p Q q c = 1 C x c q p c + x g p 1   p P
v p v d L p d R C c f p p d V n ( V m a x V m i n ) ( 1 x c p d c )   p P ; d Q p ; c C
f p p d V n ( j D P D j V m i n η c ) ( 1 x c p d c ) I C c   p P ; d Q p ; c C
The PV controllers must have an appropriate power determined by the maximum power of the PV panels installed at a certain point (15). Constraint (16) enforces the installation of inverters at generation points, while constraint (17) sets xlp = 1 for the demand points belonging to a microgrid with an input connection (due to the radial configuration and microgrid power generation performed at no-demand points).
z = 1 Z P Z z x z p z s = 1 S P S s x s p s   p P
i = 1 I x i p i j D P D j η c x g p   p P
q P | p Q q c = 1 C x c q p c x l p   p D
Finally, as mentioned in point (b) of Section 2.3, the characteristics of the equipment to be considered may depend either on the institutional framework of the electrification project or on local availability. Here, the limiter boxes only admit two output cables, meaning that the number of wires from any point p to any demand point of the microgrid is bounded by Cmax = 2 in constraint (18), therefore restricting the topology of potential microgrids.
d Q p c = 1 C x c p d c C max   p P

4. Case Study: Three Communities in the RAE

The mathematical tool developed in this work is used for the design of rural electrification projects in three communities of the RAE: Conambo, Suraka and Santa Rosa. First, the communities are described in socioeconomic terms, and their main features are determined according to the analysis presented in Section 2. Once all the relevant data and numerical parameters are comprehensively collected, the designed tool (based on the solution of a MILP) is employed to propose a specific electrification design for each case.

4.1. General Description of the Communities

The three communities studied have populations from the Sápara ethnicity and are located in the basin of the Conambo river. Figure 3 shows a map of Pastaza province, as well as the air/river routes available (in yellow) to reach the three communities from the district capital, Puyo. The straight red line indicates the linear distance (130 km) to the closest point reached by the national electric grid. Due to this geographical location and the rainforest vegetation predominant in this region, grid expansion has never been considered a viable option by the MEER, since it would predictably involve huge installation costs, severe technical issues and a negative environmental impact.
This map illustrates how Conambo, Suraka and Santa Rosa share comparable living standards and access to basic services, as well as very similar cultural features. With regards to basic services, none of the communities is provided with access to drinking water, drainage systems or electric energy. Santa Rosa is the only community with a small panel that feeds an internet-based communication system—the result of a recent national development program. On the other hand, Conambo and Suraka have radio stations to communicate with urban centers, in cases of medical emergency.

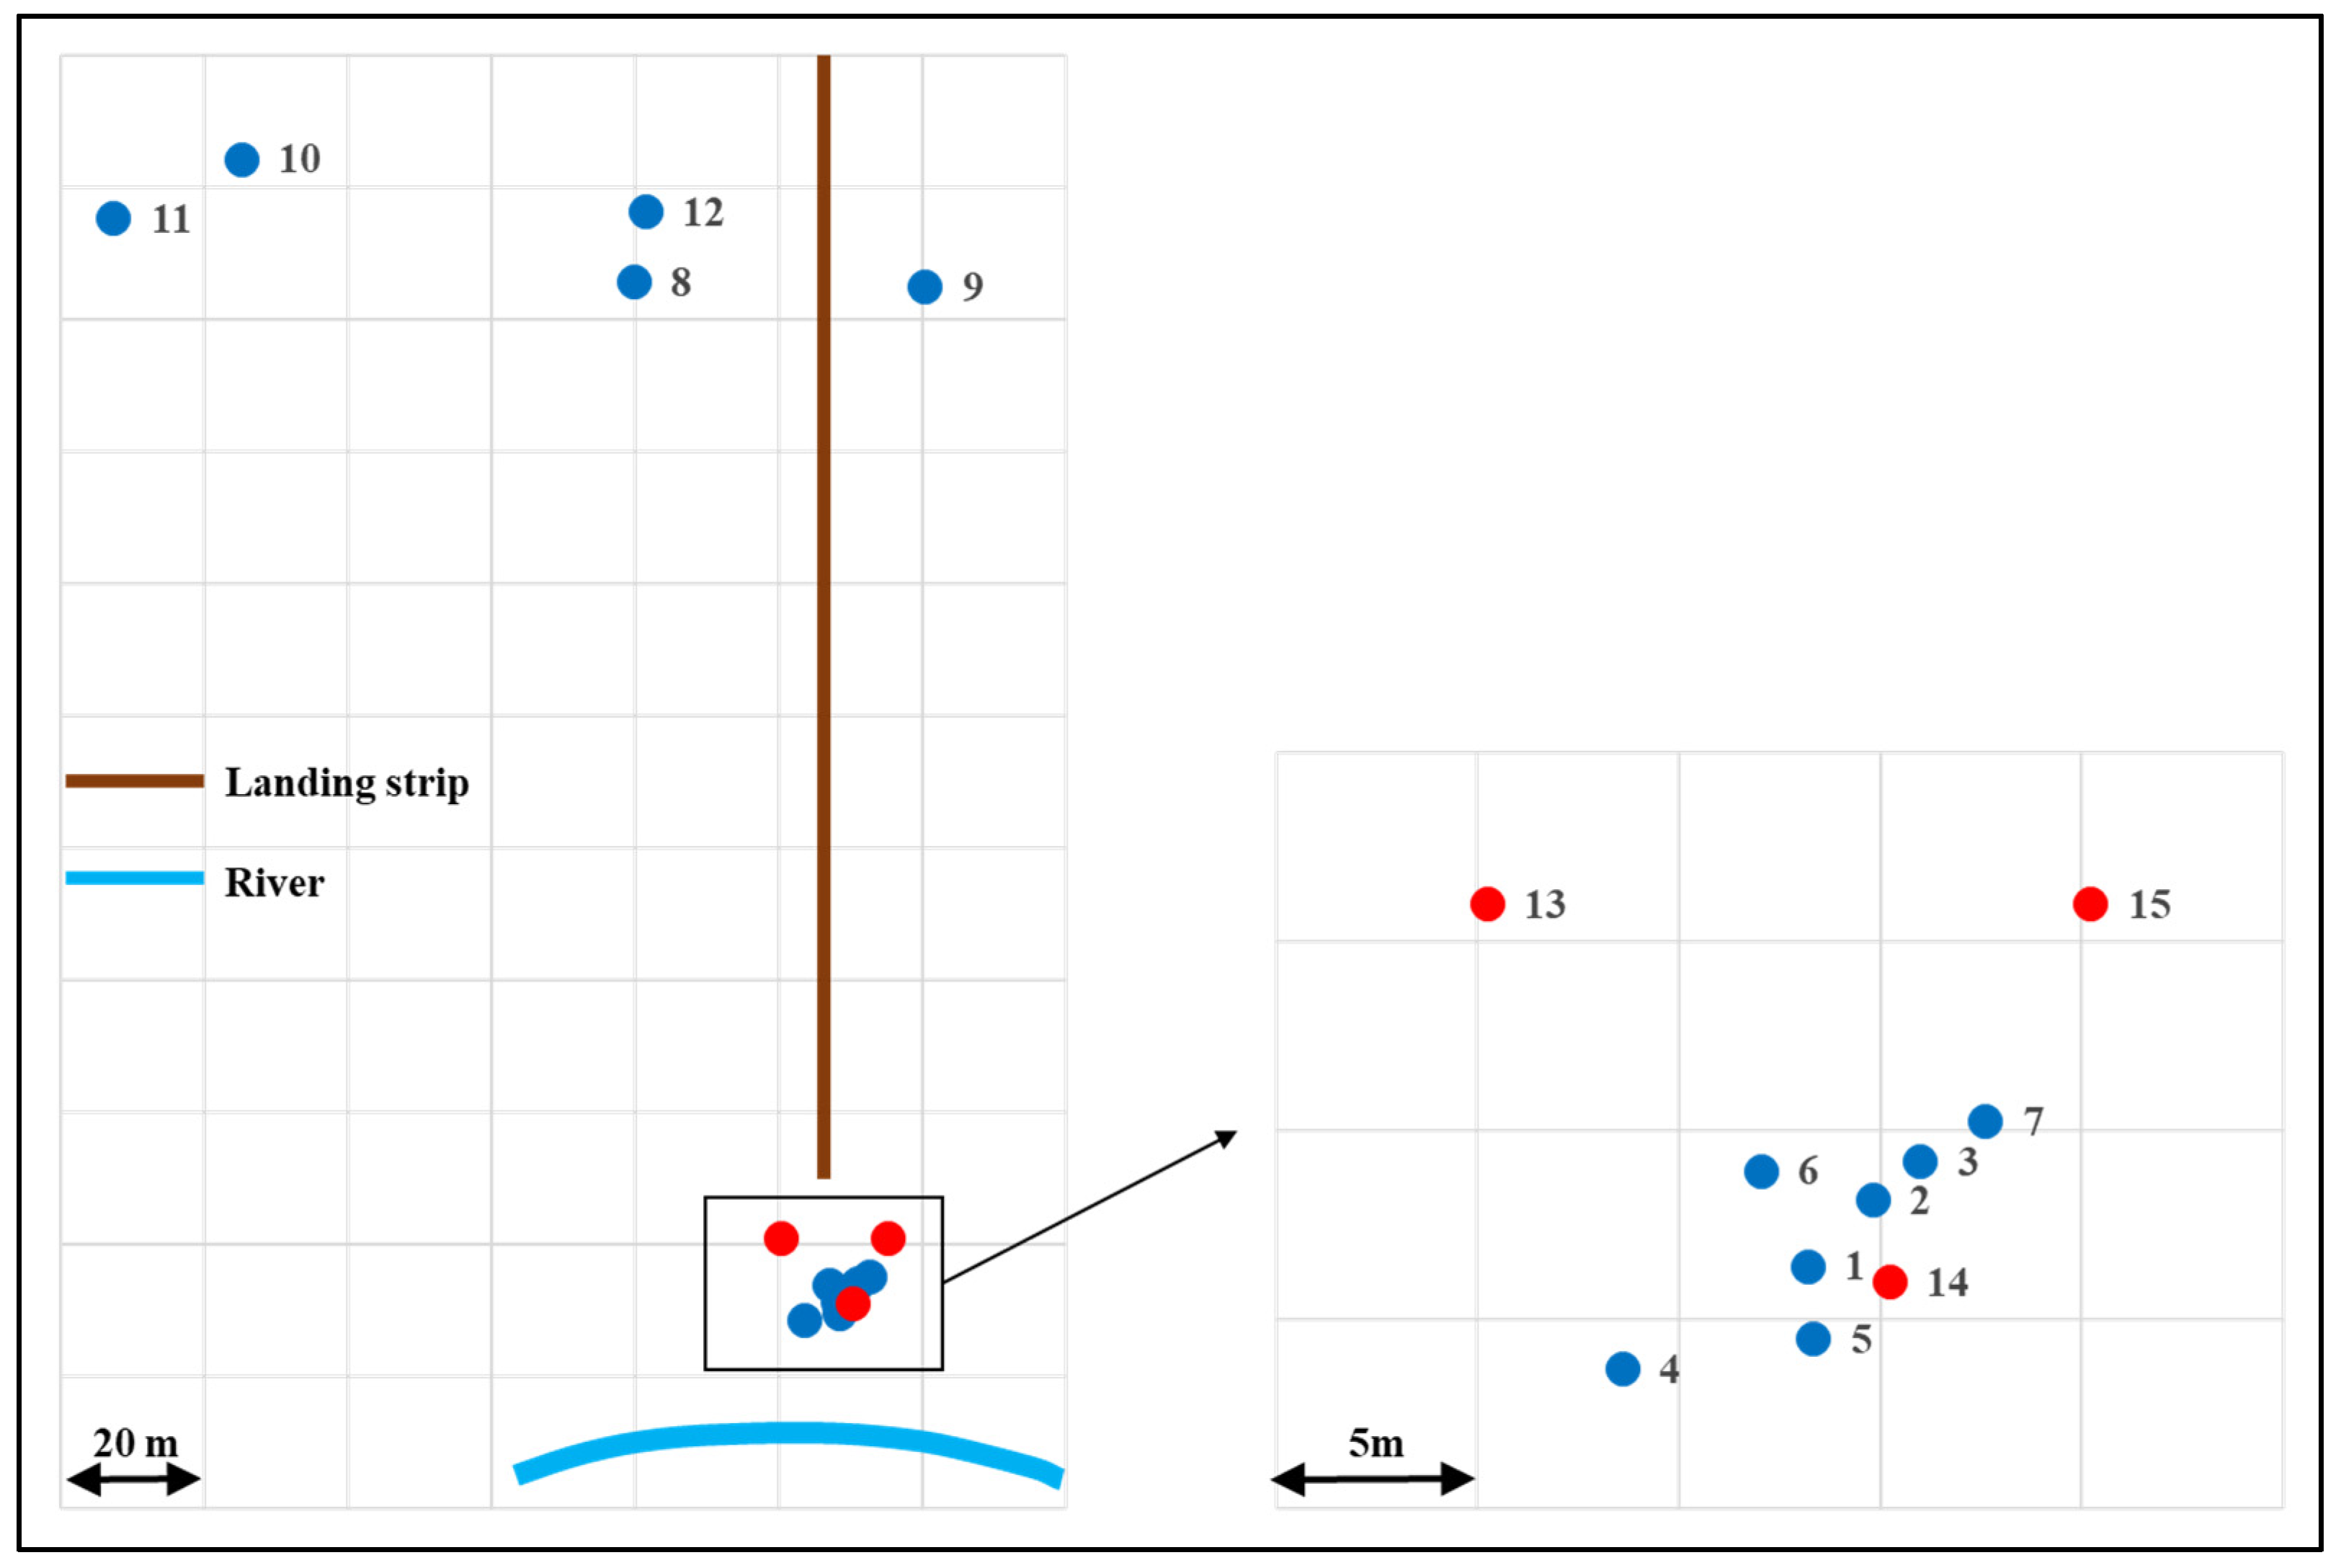
4.2. Problem Data, Point Distribution and Pre-Processing

The electrification of Conambo, Suraka and Santa Rosa is part of a global framework developed as a collaboration of different actors (EWB and MEER). As a consequence, all three communities share several conditioning features and numerical data. First, some guidelines set by Ecuador’s national government mean that several parameters are determined. For instance, as mentioned in Section 2.3, standardized consumption levels are imposed by the MEER for all users in the RAE in order to guarantee equal opportunities to every family. Thus, energy (1000 Wh/day) and power (600 W) demands are considered equal for all demand points (either housing or community centers). These values were established from surveys of the local populations, taking into account their needs for lighting, telecommunications and small household appliances. Besides, as explained in point c) of Section 2.3, the type of generation and distribution items is restricted by the size of the transportation means available for shipping equipment to the targeted communities. In particular, the aircraft only allows one wire type (thicker cables do not fit in the aircraft), which may have an impact on microgrid structures (as observed next), because the voltage drop depends on wiring characteristics and could make some points unreachable. The values for the remaining parameters common to all three communities are synthesized in Table 4. Note that, in this table, all the techno-economic parameters (generation and distribution equipment) were gathered from commercial catalogs locally available in Ecuador.
Then, the geographic coordinates of demand points and potential generation locations at each community are defined, implicitly determining the distances Lpd between points p, dP. Additionally, the specific obstacles at each community allow MPC to be deduced, and thus the set of neighboring points (p, dP). Suraka consists of 12 demand points (9 houses, 2 communal centers and 1 school) and 3 potential generation locations for microgrids (points 13, 14 and 15, see Figure 4). Santa Rosa has 15 demand points (12 houses, 1 communal center, 1 school and 1 waiting room for air passengers) and 4 potential generation points (points 16–9, see Figure 5). Finally, Conambo is a wider community, having 60 demand points (48 houses, 1 communal center, 8 school classrooms, 2 community canteens and 1 waiting room close to the landing strip) and 6 potential generation points (points 61–66, see Figure 6). Note that in Figure 4, Figure 5 and Figure 6, red points represent potential generation points, non-red points are for demand points, and the brown lines stand for landing strips.
It is now possible to set the elements of the matrix of potential connections (MPC). Due to the previously explained reasons, obstacles may hinder some connections, which necessitates a pre-processing stage to determine if each community should be treated as a whole or divided into several sub-problems to be solved independently. For Suraka, the landing strip blocks some direct connections, but any point may be indirectly connected to any other, so it can be considered as a single problem. On the other hand, Santa Rosa is settled on both sides of the river. Hence, two sub-problems can be naturally defined (see Figure 5):
  • Right side (SR-R), with 4 demand points and 1 potential generation point.
  • Left side (SR-L), with 11 demand points and 3 potential generation points.
Finally, Conambo is divided by the meanders formed by the Conambo river (Figure 6), and the landing strip also represents an obstacle, making some connections impossible through underground wiring. Consequently, the community is divided into five sub-problems (identified by different colors in Figure 6):
  • Left side (C-L: orange points), 9 demand points and 1 potential generation point.
  • Right side A (C-RA: green points), 10 demand points and 2 potential generation points.
  • Right side B (C-RB: grey points), 15 demand points and 1 potential generation point.
  • Right side C (C-RC: blue points), 20 demand points and 1 potential generation point.
  • Right side D (C-RD: lilac points), 6 demand points and 1 potential generation point.

4.3. Experimental Results

As indicated previously, one contribution of the mathematical tool developed in Section 3 is the parameter α which, in the objective function, denotes the percentage of cost overhead accepted per microgrid with regard to individual systems. The introduction of this parameter was due to MEER’s desire to promote grid formation, concretely proposing a value α of 20% (a microgrid configuration is preferred if its cost is up to 20% higher than the cost of individual systems). However, the aim is to design a versatile tool that may be used in both ways—i.e., either to promote or penalize microgrid formation over individual systems, depending on the policy makers’ decisions. In order to perform a sensitivity analysis using this parameter and compare the configurations obtained in different cases, three executions were performed for each community, with different α values: 20% (microgrid formation is promoted as proposed by the MEER), 0% (microgrids are neither penalized nor promoted) and −20% (microgrid formation is penalized, with an inverse amount compared to that proposed by the MEER). Note that other values could be chosen for α in order to further promote/penalize grid formation, but the three selected values (−20%, 0%, 20%) seem to be enough to demonstrate the ability of the proposed tool to produce different kinds of configurations.
The computational experiments presented here were carried out solving the previously described MILP problem, using IBM ILOG CPLEX 12.2, run on an IntelCore i7-6700 3.40 GHz processor (16 Gb RAM). The MILP solver employed in CPLEX is based on a Branch and Cut algorithm. The corresponding OPL code of our model, as well as complete input data (already available in Section 4.2) and the detailed solutions obtained in every optimization process (decision variables and objective function), are available from the following website (free public access): https://gitioc.upc.edu/ioc/2022_mathematics_equador (accessed on 6 April 2022). In this way, the validity of the solutions obtained can be checked by the reader, and this study is completely reproducible. All the executions are performed using a relative optimality gap of 10–6 with a 1 h time limit, which proved to be enough to solve all the tackled instances optimally except the C-RC sub-problem (independently from the value of α). Note that, for the Santa Rosa and Conambo communities, optimality could be obtained for the corresponding sub-problems thanks to the “divide-and-conquer” strategy proposed here, which decomposes communities into sub-problems solved independently and allows for a reduction of instance sizes. This is why a classical solution tool such as CPLEX could be applied here, despite the complexity of the MILP model, without the need to develop a new ad-hoc solution technique. In the case of sub-problem C-RC, the remoteness of certain demand points with regard to the potential generation location allowed the problem to be further divided. The partial solutions obtained were reused within the complete model to obtain good quality, feasible solutions whose optimality could be subsequently demonstrated. Specific comments regarding the microgrid structures obtained for this instance are provided next.
The results are presented in Table 5, which shows, in addition to the size of each sub-problem, the objective function value and the real cost of the solution obtained (which may be different from the objective function according to α value) as well a description of the proposed configuration. In addition, the microgrid topologies produced (for a value α = 20%, such as that proposed by the MEER) are presented in Figure 7, Figure 8 and Figure 9 for Suraka, Santa Rosa and Conambo, respectively. Please note that, in these three figures, yellow/white dots stand for demand points with/without individual generation systems. In addition, yellow squares represent the locations used as generation points for microgrids while gray-outlined white squares are for non-used potential generation points.
First, for every sub-problem, different configurations are determined depending on the value of α (see Table 5), proving the versatility of the formulation developed, which is capable of adapting to user’s preferences regarding microgrid or individual systems. However, apart from this global conclusion, different behaviors emerge from a closer analysis. For the Suraka and C-RA sub-problems, a microgrid involving all demand points is determined when α = 0 or 20%, while all users are supplied by individual systems when α = −20%. A comparable trend is observed in SR-L and C L (one-microgrid configuration when α = 0 or 20%), but, in these cases, some demand points located far away or isolated by obstacles are supplied by individual systems. In contrast, a different trend is observed in the remaining instances. For SR-R and C-RD, the minimum cost configurations only involve individual supplies when α = 0 or −20%, while microgrids are proposed for α = 20%. These microgrids may include all users (SR-R) or exclude users isolated by river meanders (C-RD). Finally, C-RB and C-RC further demonstrate the versatility of the computational tool developed, which proposes three different configurations according to the α value. When α = −20%, all users are supplied through individual systems; when α = 0, a combination of individual supplies and one microgrid is designed. The previous microgrid is expanded when α increases to 20%, including all users for C-RB and part of them for C-RC.
With respect to the microgrid topologies shown in Figure 7, Figure 8 and Figure 9, they illustrate behaviors clearly influenced by the conditions defined in Section 2.3. For instance, only one microgrid is formed in the solution obtained for Suraka, SR-L and C-RA, while another option would have been to create more independent microgrids (several potential generation points are available). Such two-grid configurations are discarded due to the shed required for equipment storage, which is more expensive than the additional wiring necessary to expand the microgrid. Besides, regarding C-RC, the configuration of the microgrid obtained with α = 20% (Figure 9) is restricted by the maximum number of output connections from limiter boxes, Cmax = 2 (using Cmax = 3 allows cheaper configurations). In addition, some connections are limited by the type of wires available (due to the space limitations in the aircraft transporting the equipment), which prevents further expansion of the microgrid while respecting the allowed voltage drop.
In short, the results highlight that, in four cases, using α > 0 allows microgrids to be created or expanded to replace the individual systems obtained when α = 0, which confirms the soundness of the incentive proposed by the MEER (in the four other cases, microgrids are already found for α = 0). Besides, the difference between the “real” cost of microgrid configurations obtained with α = 20% and the cost of individual systems (designed when α = 0) is on average lower than 5%. Therefore, the value proposed by the MEER (20%) seems high enough to promote the formation of microgrid-based systems. It might even be decreased in order to appear more attractive from an economic viewpoint without affecting the final results.
The comparison with classical processes for electrification systems such as those described in Section 1 further highlights the scientific contribution of the approach introduced here and the benefits obtained accordingly. Indeed, the particular features included in the mathematical model and derived from the conditioning factors proper to the RAE allowed the design of specific configurations. For example, in some instances for which several microgrids may have been installed, the requirement of building a shed for generation equipment led to a single microgrid. In addition, as mentioned before, thanks to the versatility of the design tool allowed by the α parameter, the systems proposed show more or larger microgrids than those that would have been obtained by generic tools. Therefore, the solution strategy developed here is justified by its contribution and, in turn, the new features introduced here may be included in standard tools in order to expand their application scope.

5. Conclusions

Despite global electrification rates roughly comparable to those of developed countries, Ecuador shows enormous disparities regarding access to this service, particularly in the rural areas of its Amazon basin. As a proposal to overcome these inequalities, this study presents a tool for the design of stand-alone electrification systems based on solar energy specially adapted to the case of the RAE. Developing this tool required a deep understanding of the considered community’s way-of-life, as well as close collaboration with national institutions and local actors involved in the rural electrification process. This first step led to the formulation of an MILP model to design systems adapted to the specific conditioning factors in the RAE, accounting for either individual systems, microgrids or a combination of both, as well as the location, type and size of the equipment employed.
This mathematical tool was used to determine minimal cost designs for three communities in the RAE, leading to several conclusions. First, a matrix of potential connections was introduced to allow the possible breaking-down of large problems into sub-problems, whose size is tractable through mathematical programming. Besides, the introduction of RAE-specific features had important consequences on the configurations proposed. In the first place, microgrid generation equipment cannot be located at demand points, and the number of output connections from limiter boxes is bounded, influencing the final microgrid structures. More significantly, the inclusion of preferences regarding microgrid or individual systems highlighted the versatility of the solution tool, which proposes different configurations when varying the corresponding parameter α. Numerical experiments provided general guidelines to support electrification policy making, in particular regarding the adequacy of microgrid promotion and the setting of α, which may be decreased with regard to MEER’s proposal (20%) to appear more attractive. In any case, the tool introduced here can be used to provide efficient solutions independent of the α value established by policy makers, with obvious benefits for the RAE’s isolated communities.
More generally, this work shows that electrification of the RAE is technically feasible, provides higher supplies than the benchmark references (1000 Wh/day instead of the International Energy Agency threshold of 685 kWh/day [5]) and is economically competitive, with costs ranging from 2500 to 3000 USD per consumer. Therefore, the tool introduced here for electrification systems design has a significant impact on the lifestyle of the target populations, improving their life quality through access to electricity services, while respecting their customs and social traditions since the proposed model accounts for these latter issues. In addition, the electrification systems designed here are based on environmentally friendly technologies based on renewable energies, thus representing a movement towards the Sustainable Development Goals stated by the United Nations [1]. Finally, even though the mathematical tool proposed for electrification systems design is developed according to RAE’s features, it is not limited to the case studies treated here. Rather, accounting for IEA’s projections that microgrid-based systems using renewables should account for 30% of the connections to be installed in the next years [61], the model is formulated and implemented in a generic manner to improve its versatility and allow its adaptation to distinct geographic contexts (in particular, rural areas of Latin America or Africa) and policy makers’ priorities.
Regarding perspectives for future work, a first guideline may be a study of the robustness of the configurations designed—sxin particular, accounting for possible variations of the energy and power demands. On the other hand, the environmental impacts should also be included in the evaluation of such small-scale electrification projects. Besides, it is worth recalling that, typically, different factors that play a role in the design of electrification systems are not always known with certainty. In particular, the amount of PV energy collected (which depends on meteorological factors) and user’s energy/power demands (which are often difficult to estimate) are the parameters most frequently considered as uncertain in the specialized literature. Therefore, accounting for this uncertainty (either through stochastic programming or fuzzy set theory) might allow the design of more robust systems and constitutes a promising perspective.

Author Contributions

Conceptualization, B.D., L.F.-M.; methodology, B.D., G.H.; investigation, B.D., G.H., A.P.; resources, F.G.; validation, L.F.-M., F.G., R.P.; project administration: L.F.-M.; writing—original draft preparation: G.H., A.P.; writing—reviewing and editing: A.P.; supervision, R.P. All authors have read and agreed to the published version of the manuscript.

Funding

This research was funded by the Spanish Ministry of Science and Innovation (RTI-2018-097962-B-I00) and the Centre for Cooperation Development (CCD) of the Universitat Politècnica de Catalunya-BarcelonaTech (UPC).

Institutional Review Board Statement

Not applicable.

Informed Consent Statement

Informed consent was obtained from all subjects involved in the study.

Data Availability Statement

The data used to support the findings of this study are available at https://gitioc.upc.edu/ioc/2022_mathematics_equador (accessed on 6 April 2022).

Acknowledgments

The authors are very grateful to the NGO Engineering Without Borders (Spain) and the Energy21 program of University College Dublin (UCD) for all the support and assistance given during the development of this research.

Conflicts of Interest

The authors declare no conflict of interest.

References

  1. United Nations. Transforming Our World: The 2030 Agenda for Sustainable Development. 2015. Available online: https://sdgs.un.org/goals (accessed on 18 January 2022).
  2. Blimpo, M.P.; Cosgrove-Davies, M. Electricity Access in Sub-Saharan Africa: Uptake, Reliability, and Complementary Factors for Economic Impact; World Bank, Africa Development Forum: Washington, DC, USA, 2019; Available online: https://openknowledge.worldbank.org/handle/10986/31333 (accessed on 18 January 2022).
  3. Jeuland, M.; Fetter, T.R.; Li, Y.; Pattanayak, S.K.; Usmani, F.; Bluffstone, R.A.; Chávez, C.; Girardeau, H.; Hassen, S.; Jagger, P.; et al. Is energy the golden thread? A systematic review of the impacts of modern and traditional energy use in low- and middle-income countries. Renew. Sustain. Energy Rev. 2021, 135, 110406. [Google Scholar] [CrossRef]
  4. Peters, J.; Sievert, M. Impacts of rural electrification revisited-the African context. J. Dev. Eff. 2016, 8, 327–345. [Google Scholar] [CrossRef] [Green Version]
  5. International Energy Agency World Energy Outlook: Electricity Access Database. 2017. Available online: https://www.iea.org/reports/world-energy-outlook-2017 (accessed on 19 January 2022).
  6. Sovacool, B.K. Deploying off-grid technology to eradicate energy poverty. Science 2012, 338, 47–48. [Google Scholar] [CrossRef] [PubMed]
  7. Hernández-Callejo, L.; Gallardo-Saavedra, S.; Alonso-Gómez, V. A review of photovoltaic systems: Design, operation and maintenance. Sol. Energy 2019, 188, 426–440. [Google Scholar] [CrossRef]
  8. Ehsan, A.; Yang, Q. Optimal integration and planning of renewable distributed generation in the power distribution networks: A review of analytical techniques. Appl. Energy 2018, 210, 44–59. [Google Scholar] [CrossRef]
  9. Slednev, V.; Bertsch, V.; Ruppert, M.; Fichtner, W. Highly resolved optimal renewable allocation planning in power systems under consideration of dynamic grid topology. Comput. Oper. Res. 2018, 96, 280–292. [Google Scholar] [CrossRef] [Green Version]
  10. Hassan, Q. Evaluation and optimization of off-grid and on-grid photovoltaic power system for typical household electrification. Renew. Energy 2021, 164, 375–390. [Google Scholar] [CrossRef]
  11. Taye, B.Z.; Workineh, T.G.; Nebey, A.H.; Kefale, H.A. Rural electrification planning using Geographic Information System (GIS). Cogent Eng. 2020, 7, 1836730. [Google Scholar] [CrossRef]
  12. Ellman, D. The Reference Electrification Model: A Computer Model for Planning Rural Electricity Access. Master’s Thesis, Massachusetts Institute of Technology, Boston, MA, USA, 2015. [Google Scholar]
  13. Mentis, D.; Howells, M.; Rogner, H.; Korkovelos, A.; Arderne, C.; Zepeda, E.; Siyal, S.H.; Taliotis, C.; Bazilian, M.; de Roo, A.; et al. Lighting the World, The first global application of an open source, spatial electrification tool (OnSSET), with a focus on Sub-Saharan Africa. Environ. Res. Lett. Focus Energy Access Sustain. Dev. 2017, 12, 085003. [Google Scholar]
  14. Brown, T.; Hörsch, J.; Schlachtberger, D. PyPSA: Python for Power System Analysis. J. Open Re. Soft. 2018, 6, 4. [Google Scholar] [CrossRef] [Green Version]
  15. Eddy, J.; Miner, N.E.; Stamp, J. Sandia’s Microgrid Design Toolkit. Electr. J. 2017, 30, 62–67. [Google Scholar] [CrossRef]
  16. Bahramara, S.; Parsa Moghaddam, M.; Haghifam, M.R. Optimal planning of hybrid renewable energy systems using HOMER: A review. Renew. Sustain. Energy Rev. 2016, 62, 609–620. [Google Scholar] [CrossRef]
  17. Lal, D.K.; Dash, B.B.; Akella, A.K. Optimization of PV/wind/micro-hydro/diesel hybrid power system in HOMER for the study area. Int. J. Electr. Eng. Inform. 2011, 3, 307–325. [Google Scholar]
  18. Rozlan, M.B.M.; Zobaa, A.F.; Abdel Aleem, S.H.E. The optimisation of stand-alone hybrid renewable energy systems using HOMER. Int. Rev. Electr. Eng. 2011, 6, 1802–1810. [Google Scholar]
  19. Hossain, E.; Kabalci, E.; Bayindir, R.; Perez, R. Microgrid testbeds around the world: State of art. Energy Convers. Manag. 2014, 86, 132–153. [Google Scholar] [CrossRef]
  20. Wang, R.; Lam, C.M.; Hsu, S.C.; Chen, J.H. Life cycle assessment and energy payback time of a standalone hybrid renewable energy commercial microgrid: A case study of Town Island in Hong Kong. Appl. Energy 2019, 250, 760–775. [Google Scholar] [CrossRef]
  21. Zhou, W.; Lou, C.; Li, Z.; Lu, L.; Yang, H. Current status of research on optimum sizing of stand-alone hybrid solar-wind power generation systems. Appl. Energy 2010, 87, 380–389. [Google Scholar] [CrossRef]
  22. Peters, J.; Sievert, M.; Toman, M.A. Rural electrification through mini-grids: Challenges ahead. Energy Policy 2019, 132, 27–31. [Google Scholar] [CrossRef] [Green Version]
  23. Castilla, M.; Gómez, M.; Mercado, P.; Moreira, C.; Negroni, J.J.; Sosa, J.; Zambroni de Sousa, A.C. The growing state of distributed generation and microgrids in the Ibero-American region: A view from the RIGMEI network. In Proceedings of the 2014 IEEE Power & Energy Society Transmission and Distribution Latin American Conference & Exposition, Medellín, Colombia, 10–13 September 2014. [Google Scholar]
  24. Mahomed, S.; Shirley, R.; Tice, D.; Phillips, J. Business Model Innovations for Utility and Mini-Grid Integration: Insights from the Utilities 2.0 Initiative in Uganda. Energy and Economic Growth, Energy Insight Report. 2020. Available online: https://www.energyeconomicgrowth.org/publication/business-model-innovations-utility-and-mini-grid-integration-insights-utilities-20 (accessed on 19 January 2022).
  25. Tenenbaum, B.; Greacen, C.; Siyambalapitiya, T.; Knuckles, J. From the Bottom Up: How Small Power Producers and Mini-Grids Can Deliver Electrification and Renewable Energy in Africa; World Bank Group Report; Directions in Development—Energy and Mining: Washington, DC, USA, 2014; Available online: https://openknowledge.worldbank.org/handle/10986/16571 (accessed on 19 January 2022).
  26. Lukuyu, J.; Fetter, R.; Krishnapriya, P.P.; Williams, N.; Taneja, J. Building the supply of demand: Experiments in mini-grid demand stimulation. Dev. Eng. 2021, 6, 100058. [Google Scholar] [CrossRef]
  27. Rezaei, M.; Dowlatabadi, H. Off-grid: Community energy and the pursuit self-sufficiency in British Columbia’s remote and First Nations communities. Local Environ. 2015, 21, 789–807. [Google Scholar] [CrossRef]
  28. Leithon, J.; Werner, S.; Koivunen, V. Energy optimization through cooperative storage management: A calculus of variations approach. Renew. Energy 2021, 171, 1357–1370. [Google Scholar] [CrossRef]
  29. Domenech, B.; Ferrer-Martí, L.; Pastor, R. Including management and security of supply constraints for designing stand-alone electrification systems in developing countries. Renew. Energy 2015, 80, 359–369. [Google Scholar] [CrossRef] [Green Version]
  30. Ranaboldo, M.; Domenech, B.; Vilar, D.; Ferrer-Martí, L.; Pastor, R.; García-Villoria, A. Renewable energy projects to electrify rural communities in Cape Verde. Appl. Energy 2014, 118, 280–291. [Google Scholar] [CrossRef]
  31. Triadó-Aymerich, J.; Ferrer-Martí, L.; García-Villoria, A.; Pastor, R. MILP-based heuristics for the design of rural community electrification projects. Comput. Oper. Res. 2016, 71, 90–99. [Google Scholar] [CrossRef]
  32. Rojas-Zerpa, J.C.; Yusta, J.M. Application of multicriteria decision methods for electric supply planning in rural and remote areas. Renew. Sustain. Energy Rev. 2015, 52, 557–571. [Google Scholar] [CrossRef]
  33. Balderrama, S.; Lombardi, F.; Riva, F.; Canedo, W.; Colombo, E.; Quoilin, S. A two-stage linear programming optimization framework for isolated hybrid microgrids in a rural context: The case study of the “El Espino” community. Energy 2019, 188, 116073. [Google Scholar] [CrossRef]
  34. Blechinger, P.; Cader, C.; Bertheau, P.; Huyskens, H.; Seguin, R.; Breyer, C. Global analysis of the techno-economic potential of renewable energy hybrid systems on small islands. Energy Policy 2016, 98, 674–687. [Google Scholar] [CrossRef]
  35. Gómez, M.F.; Silveira, S. The last mile in the Brazilian Amazon—A potential pathway for universal electricity access. Energy Policy 2015, 82, 23–37. [Google Scholar] [CrossRef]
  36. Garces, E.; Tomei, J.; Franco, C.J.; Dyner, I. Lessons from last mile electrification in Colombia: Examining the policy framework and outcomes for sustainability. Energy Res. Soc. Sci. 2021, 79, 102156. [Google Scholar] [CrossRef]
  37. Fernández-Fuentes, M.H.; Eras-Almeida, A.A.; Egido-Aguilera, M.A. Characterization of Technological Innovations in Photovoltaic Rural Electrification, Based on the Experiences of Bolivia, Peru, and Argentina: Third Generation Solar Home Systems. Sustainability 2021, 13, 3032. [Google Scholar] [CrossRef]
  38. Barzola, J.; Espinoza, M.; Pavón, C.; Cabrera, F. Solar-wind renewable energy system for off-grid rural electrification in Ecuador. In Proceedings of the 14th LACCEI International Multi-Conference for Engineering, Education, and Technology, “Engineering Innovations for Global Sustainability”, San José, Costa Rica, 20–22 July 2016. [Google Scholar]
  39. Feron, S.; Heinrichs, H.; Cordero, R.R. Are the electrification efforts in the Ecuadorian Amazon sustainable? Sustainability 2016, 8, 443. [Google Scholar] [CrossRef] [Green Version]
  40. Ferrer-Martí, L.; Domenech, B.; García-Villoria, A.; Pastor, R. A MILP model to design hybrid wind–photovoltaic isolated rural electrification projects in developing countries. Eur. J. Oper. Res. 2013, 226, 293–300. [Google Scholar] [CrossRef]
  41. Escribano, G. Ecuador’s energy policy mix: Development versus conservation and nationalism with Chinese loans. Energy Policy 2013, 57, 152–159. [Google Scholar] [CrossRef]
  42. Agencia de Regulación y Control de Electricidad de Ecuador (ARCONEL). Revista Digital: Estadística del Sector Eléctrico Ecuatoriano 2017; Ministerio de Electricidad y Energía Renovable: Quito, Ecuador, 2017. Available online: https://www.controlrecursosyenergia.gob.ec/estadisticas-del-sector-electrico-ecuatoriano-buscar (accessed on 19 January 2022). (In Spanish)
  43. Cortés Valencia, I.V. Regulatory and Planning Approach to Rural Electrification in Isolated Areas of the Amazon: Bolivia, Brazil, Colombia, Ecuador and Peru. Master’s Thesis, Escuela Técnica Superior de Ingeniería, Universidad Pontífica Comillas, Madrid, Spain, 2016. [Google Scholar]
  44. Peláez-Samaniego, M.R.; García-Pérez, M.; Cortez, L.A.B.; Oscullod, J.; Olmedo, G. Energy sector in Ecuador: Current status. Energy Policy 2007, 35, 4177–4189. [Google Scholar] [CrossRef]
  45. Finer, M.; Jenkins, C.N. Proliferation of hydroelectric dams in the Andean Amazon and implications for Andes-Amazon connectivity. PLoS ONE 2012, 7, e0035126. [Google Scholar] [CrossRef]
  46. Robalino-López, A.; Mena-Nieto, A.; García-Ramos, J.E. System dynamics modeling for renewable energy and CO2 emissions: A case study of Ecuador. Energy Sustain. Dev. 2014, 20, 11–20. [Google Scholar] [CrossRef] [Green Version]
  47. Posso, F.; Sánchez, J.; Espinoza, J.L.; Siguencia, J. Preliminary estimation of electrolytic hydrogen production potential from renewable energies in Ecuador. Int. J. Hydrogen Energy 2016, 41, 2326–2344. [Google Scholar] [CrossRef]
  48. Ferrer-Martí, L.; Garwood, A.; Chiroque, J.; Ramírez, B.; Marcelo, O.; Garfí, M.; Velo, E. Evaluating and comparing three community small-scale wind electrification projects. Renew. Sustain. Energy Rev. 2012, 16, 5379–5390. [Google Scholar] [CrossRef]
  49. Tratural (Cia. Ltda). Estudio Homologación de Unidades de Propiedad (UP) y Unidades de Construcción (UC) de Sistemas Fotovoltaicos No Conectados a la Red; Ministerio de Electricidad y Energía Renovable: Quito, Ecuador, 2016. (In Spanish) [Google Scholar]
  50. Enginyeria Sense Fronteres (ESF); Empresa Eléctrica Ambato, Sociedad Anónima. Conceptos para la Gestión de Sistemas Fotovoltaicos Aislados; Ministerio de Electricidad y Energías Renovables: Quito, Ecuador, 2016. (In Spanish) [Google Scholar]
  51. Khan, A.A.; Malik, N.; Al-Arainy, A.; Alghuwainem, S. A review of condition monitoring of underground power cables. In Proceedings of the 2012 IEEE International Conference on Condition Monitoring and Diagnosis, Bali, Indonesia, 23–27 September 2012; pp. 909–912. [Google Scholar]
  52. Trotter, P.A. A low-carbon way to increase energy access: How to scale mini-grids in developing countries. In Proceedings of the Applied Energy Symposium, MIT A+B, Boston, MA, USA, 22–24 May 2019. [Google Scholar]
  53. Taneja, J. If You Build It, Will They Consume? Key Challenges for Universal, Reliable, and Low-Cost Electricity Delivery in Kenya; Working Paper No. 491; Center for Global Development: Washington, DC, USA, 2018. [Google Scholar]
  54. Cader, C.; Blechinger, P.; Bertheau, P. Electrification planning with focus on hybrid mini-grids—A comprehensive modelling approach for the Global South. Enrgy. Proced. 2016, 99, 269–276. [Google Scholar] [CrossRef] [Green Version]
  55. Galleguillos-Pozo, R.; Domenech, B.; Ferrer-Martí, L.; Pastor, R. Design of stand-alone electrification systems using fuzzy mathematical programming approaches. Energy 2021, 228, 120639. [Google Scholar] [CrossRef]
  56. Baños, R.; Manzano-Agugliaro, F.; Montoya, F.G.; Gil, C.; Alcayde, A.; Gómez, J. Optimization methods applied to renewable and sustainable energy: A review. Renew. Sustain. Energy Rev. 2011, 15, 1753–1766. [Google Scholar] [CrossRef]
  57. Domenech, B.; Ranaboldo, M.; Ferrer-Martí, L.; Pastor, R.; Flynn, D. Local and regional microgrid models to optimise the design of isolated electrification projects. Renew. Energy 2018, 119, 795–808. [Google Scholar] [CrossRef]
  58. Tomei, J.; Cronin, J.; Agudelo Arias, H.D.; Córdoba Machado, S.; Mena Palacios, F.M.; Toro Ortiz, Y.M.; Borja Cuesta, Y.E.; Palomino Lemus, R.; Murillo López, W.; Anandarajah, G. Forgotten spaces: How reliability, affordability and engagement shape the outcomes of last-mile electrification in Chocó, Colombia. Energy Res. Soc. Sci. 2020, 59, 101302. [Google Scholar] [CrossRef]
  59. Lambert, T.W.; Hittle, D.C. Optimization of autonomous village electrification systems by simulated annealing. Sol. Energy 2000, 68, 121–132. [Google Scholar] [CrossRef]
  60. Ferrer-Martí, L.; Pastor, R.; Capó, G.M.; Velo, E. Optimizing microwind rural electrification projects. A case study in Peru. J. Glob. Opt. 2011, 50, 127–143. [Google Scholar] [CrossRef]
  61. International Energy Agency (IEA). World Energy Outlook: Electricity Access Database. 2021. Available online: https://www.iea.org/reports/world-energy-outlook-2021 (accessed on 19 January 2022).
Figure 1. Scheme of a PV system with microgrid distribution.
Mathematics 10 01226 g001
Figure 2. Flowchart of the proposed method.
Mathematics 10 01226 g002
Figure 3. Map of the Pastaza district.
Mathematics 10 01226 g003
Figure 4. Demand and potential generation points in Suraka. Numbers refer to the households (blue) and potential generation points (red).
Mathematics 10 01226 g004
Figure 5. Demand and potential generation points in Santa Rosa. Numbers refer to the households (blue) and potential generation points (red).
Mathematics 10 01226 g005
Figure 6. Demand and potential generation points in Conambo. Numbers refer to the households (blue) and potential generation points (red).
Mathematics 10 01226 g006
Figure 7. Microgrid obtained for Suraka.
Mathematics 10 01226 g007
Figure 8. Microgrid obtained for Santa Rosa.
Mathematics 10 01226 g008
Figure 9. Microgrid/individual supply obtained for Conambo.
Mathematics 10 01226 g009
Table 1. Comparison of main problem features addressed in this study and in previous related works.
Featurea.*b.*c.*d.*e.*f.*g.*h.*
PV generationX XXXXXX
Battery storageX XXXXXX
Microgrid distribution XXXXXXX
Several microgrids XXXXXX
Individual supply XXXX XX
Versatile (microgrids vs. individual) X
Forbidden connections X X
Restriction on microgrid generation points X
Demand/non-demand points X XX XX
Economic assessmentXXXXXXXX
Additional installation costsX XX X
* where a. HOMER [17]; b. ViPOR [59]; c. Ferrer-Martí et al. [40]; d. REM [12]; e. Domenech et al. [57]; f. MicrogridsPy [33]; g. Sandia’s Microgrid Design Toolkit [15]; h. The approach proposed in this work.
Table 2. Parameters of the mathematical model.
ParameterDescriptionUnit
Demand points
PSet of potential generation points, including the demand points.-
DSet of demand points, DP.-
LpdDistance between two points p and d (pP, dD).[m]
LmaxMaximum length of a wire segment of the microgrid.[m]
MPCpd(p,d)-element of the matrix of potential connections (pP, dD). ∀pP, ∀dD, MPCpd ∈ {0,1}.-
QpSubset of points to which point p can be directly connected with a wire segment (pP, dD: pd, MPCpd = 1, LpdLmax).-
EDpEnergy demand at p (pD).[Wh/day]
PDpPower demand at p, considering the simultaneity factor (pD).[W]
PV generation
S, NSSet of PV panel types and maximum number of PV panels that can be placed at a point, respectively.-
ESsEnergy generated by a PV panel of type s (sS).[Wh/day]
PSsMaximum power of a PV panel of type s (sS).[W]
CSsCost of a PV panel of type s (sS).[US$]
ZSet of PV controller types.-
PZzMaximum power of a PV controller of type z (zZ).[W]
CZzCost of a PV controller of type z (zZ).[US$]
Electric equipment
BSet of battery types.-
EBbCapacity of a battery of type b (bB).[Wh]
CBbCost of a battery of type b (bB).[US$]
ηbBattery efficiency.[%]
DBMaximum discharge proportion admitted for the batteries.[%]
DARequired autonomy of the batteries.[days]
ISet of inverter types.-
PIiMaximum power of an inverter of type i (iI).[W]
CIiCost of an inverter of type i (iI).[US$]
ηiInverter efficiency.[%]
CLCost of an electric meter device.[US$]
Electricity distribution
CSet of wire types.-
RCcElectric resistance (feed and return) of a wire of type c (cC).[Ω/m]
ICcMaximum intensity of a wire of type c (cC).[A]
CCcCost of a wire of type c (feed and return), including the infrastructure (cC).[US$/m]
VnNominal voltage.[V]
VminMinimum voltage.[V]
VmaxMaximum voltage.[V]
ηcWire efficiency.[%]
Specific features for RAE electrification
CACost of a shed for equipment storage.[$US]
αAccepted percentage of cost overhead of microgrids w.r.t. individual systems.[%]
CmaxMaximum number of output connections from a microgrid point.-
Table 3. Decision variables of the MILP formulation.
VariableDescriptionUnit
Integer non-negative variables
xspsNumber of PV panels of type s placed at point p (pP, sS).-
xzpzNumber of PV controllers of type z placed at point p (pP, zZ).-
xbpbNumber of batteries of type b placed at point p (pP, bB).-
xipiNumber of inverters of type i placed at point p (pP, iI).-
Float non-negative variables
fepdEnergy flow between points p and d (pP, dQp).[Wh/day]
fppdPower flow between points p and d (pP, dQp).[W]
vpVoltage at point p (vp ∈ [Vmin, Vmax], pP).[V]
Binary variables
xgp=1, if at least a wind turbine or PV panel is placed at point p (pP).-
xcpdc=1, if there is a wire of type c between the points p and d (pP, dQp, cC).-
xlp=1, if point p (pD) belongs to a microgrid (involving a meter device).-
Table 4. Numerical values of the parameters shared by the three communities.
DescriptionParameterValueUnit
Electric equipment
Batteries: types|B|2-
Batteries: capacityEBb (bB)1800; 3600[Wh]
Batteries: costCBb (bB)300; 850[US$]
Batteries: efficiencyηb85[%]
Batteries: maximum dischargeDB60[%]
Batteries: required autonomyDA3[days]
Inverters: types|I|2-
Inverters: maximum powerPIi (iI)600; 3600[W]
Inverters: costCIi (iI)400; 2000[US$]
Inverters: efficiencyηi85[%]
Meter devices: costCL50[US$]
Demand points
Maximum length of wire segmentsLmax300[m]
Energy demandEDp (pD)1000[Wh/day]
Power demandPDp (pD)600[W]
PV generation
PV panel: types|S|1-
PV panel: maximum numberNS40-
PV panel: energy generatedESs (sS)1178.8[Wh/day]
PV panel: maximum powerPSs (sS)330[W]
PV panel: costCSs (sS)350[US$]
PV controllers: types|Z|2-
PV controllers: maximum powerPZz (zZ)80; 2880[W]
PV controllers: costCZz (zZ)300; 700[US$]
Distribution equipment
Wires: types|C|1-
Wires: electric resistanceRCc (cC)0.0016[Ω/m]
Wires: maximum intensityICc (cC)60[A]
Wires: costCCc (cC)3.94[US$/m]
Nominal voltageVn110[V]
Minimum voltageVmin105[V]
Maximum voltageVmax116[V]
Wires: efficiencyηc90[%]
RAE’s specific features
Shed costCA1500[$US]
Cost overhead (microgrids vs. individual systems)α−20, 0, 20[%]
Maximum output connections in microgridsCmax2-
Table 5. Solutions obtained for the three communities.
CommunitySub-ProblemDemand Pointsα (%)Obj. Func. (USD)Real Cost (USD)Configuration
Suraka12−2034,80034,80012 individual systems
031,11031,110One microgrid (all 12 users)
2025,925
Santa
Rosa
SR-R4−2011,60011,6004 individual systems
0
2010,23112,277One microgrid (all 4 users)
SR-L11−2031,90031,90011 individual systems
029,84829,848One microgrid (9 users) and 2 individual systems
2025,840
ConamboC-L9−2026,10026,1009 individual systems
025,92525,925One microgrid (5 users) and 4 individual systems
2023,538
C-RA10−2029,00029,00010 individual systems
027,46327,463One microgrid (all 10 users)
2022,886
C-RB15−2043,50043,50015 individual systems
039,35339,353One microgrid (13 users) and 2 individual systems
2032,89739,477One microgrid (all 15 users)
C-RC20−2058,00058,00020 individual systems
053,64953,649One microgrid (15 users) and 5 individual systems
2046,78953,827One microgrid (16 users) and 4 individual systems
C-RD6−2017,40017,4006 individual systems
0
2017,25219,543One microgrid (4 users) and 2 individual systems
Publisher’s Note: MDPI stays neutral with regard to jurisdictional claims in published maps and institutional affiliations.

