
Metamorphoses of Earnings in the Transport Sector of the V4 Region


Abstract
:1. Introduction
2. Materials and Methods
- 1.
- Focus on the missing values.
- 2.
- Focus on the outlying values.
- 3.
- Focus on the computation of annual EBITDA and portraying its descriptive statistics.
- 4.
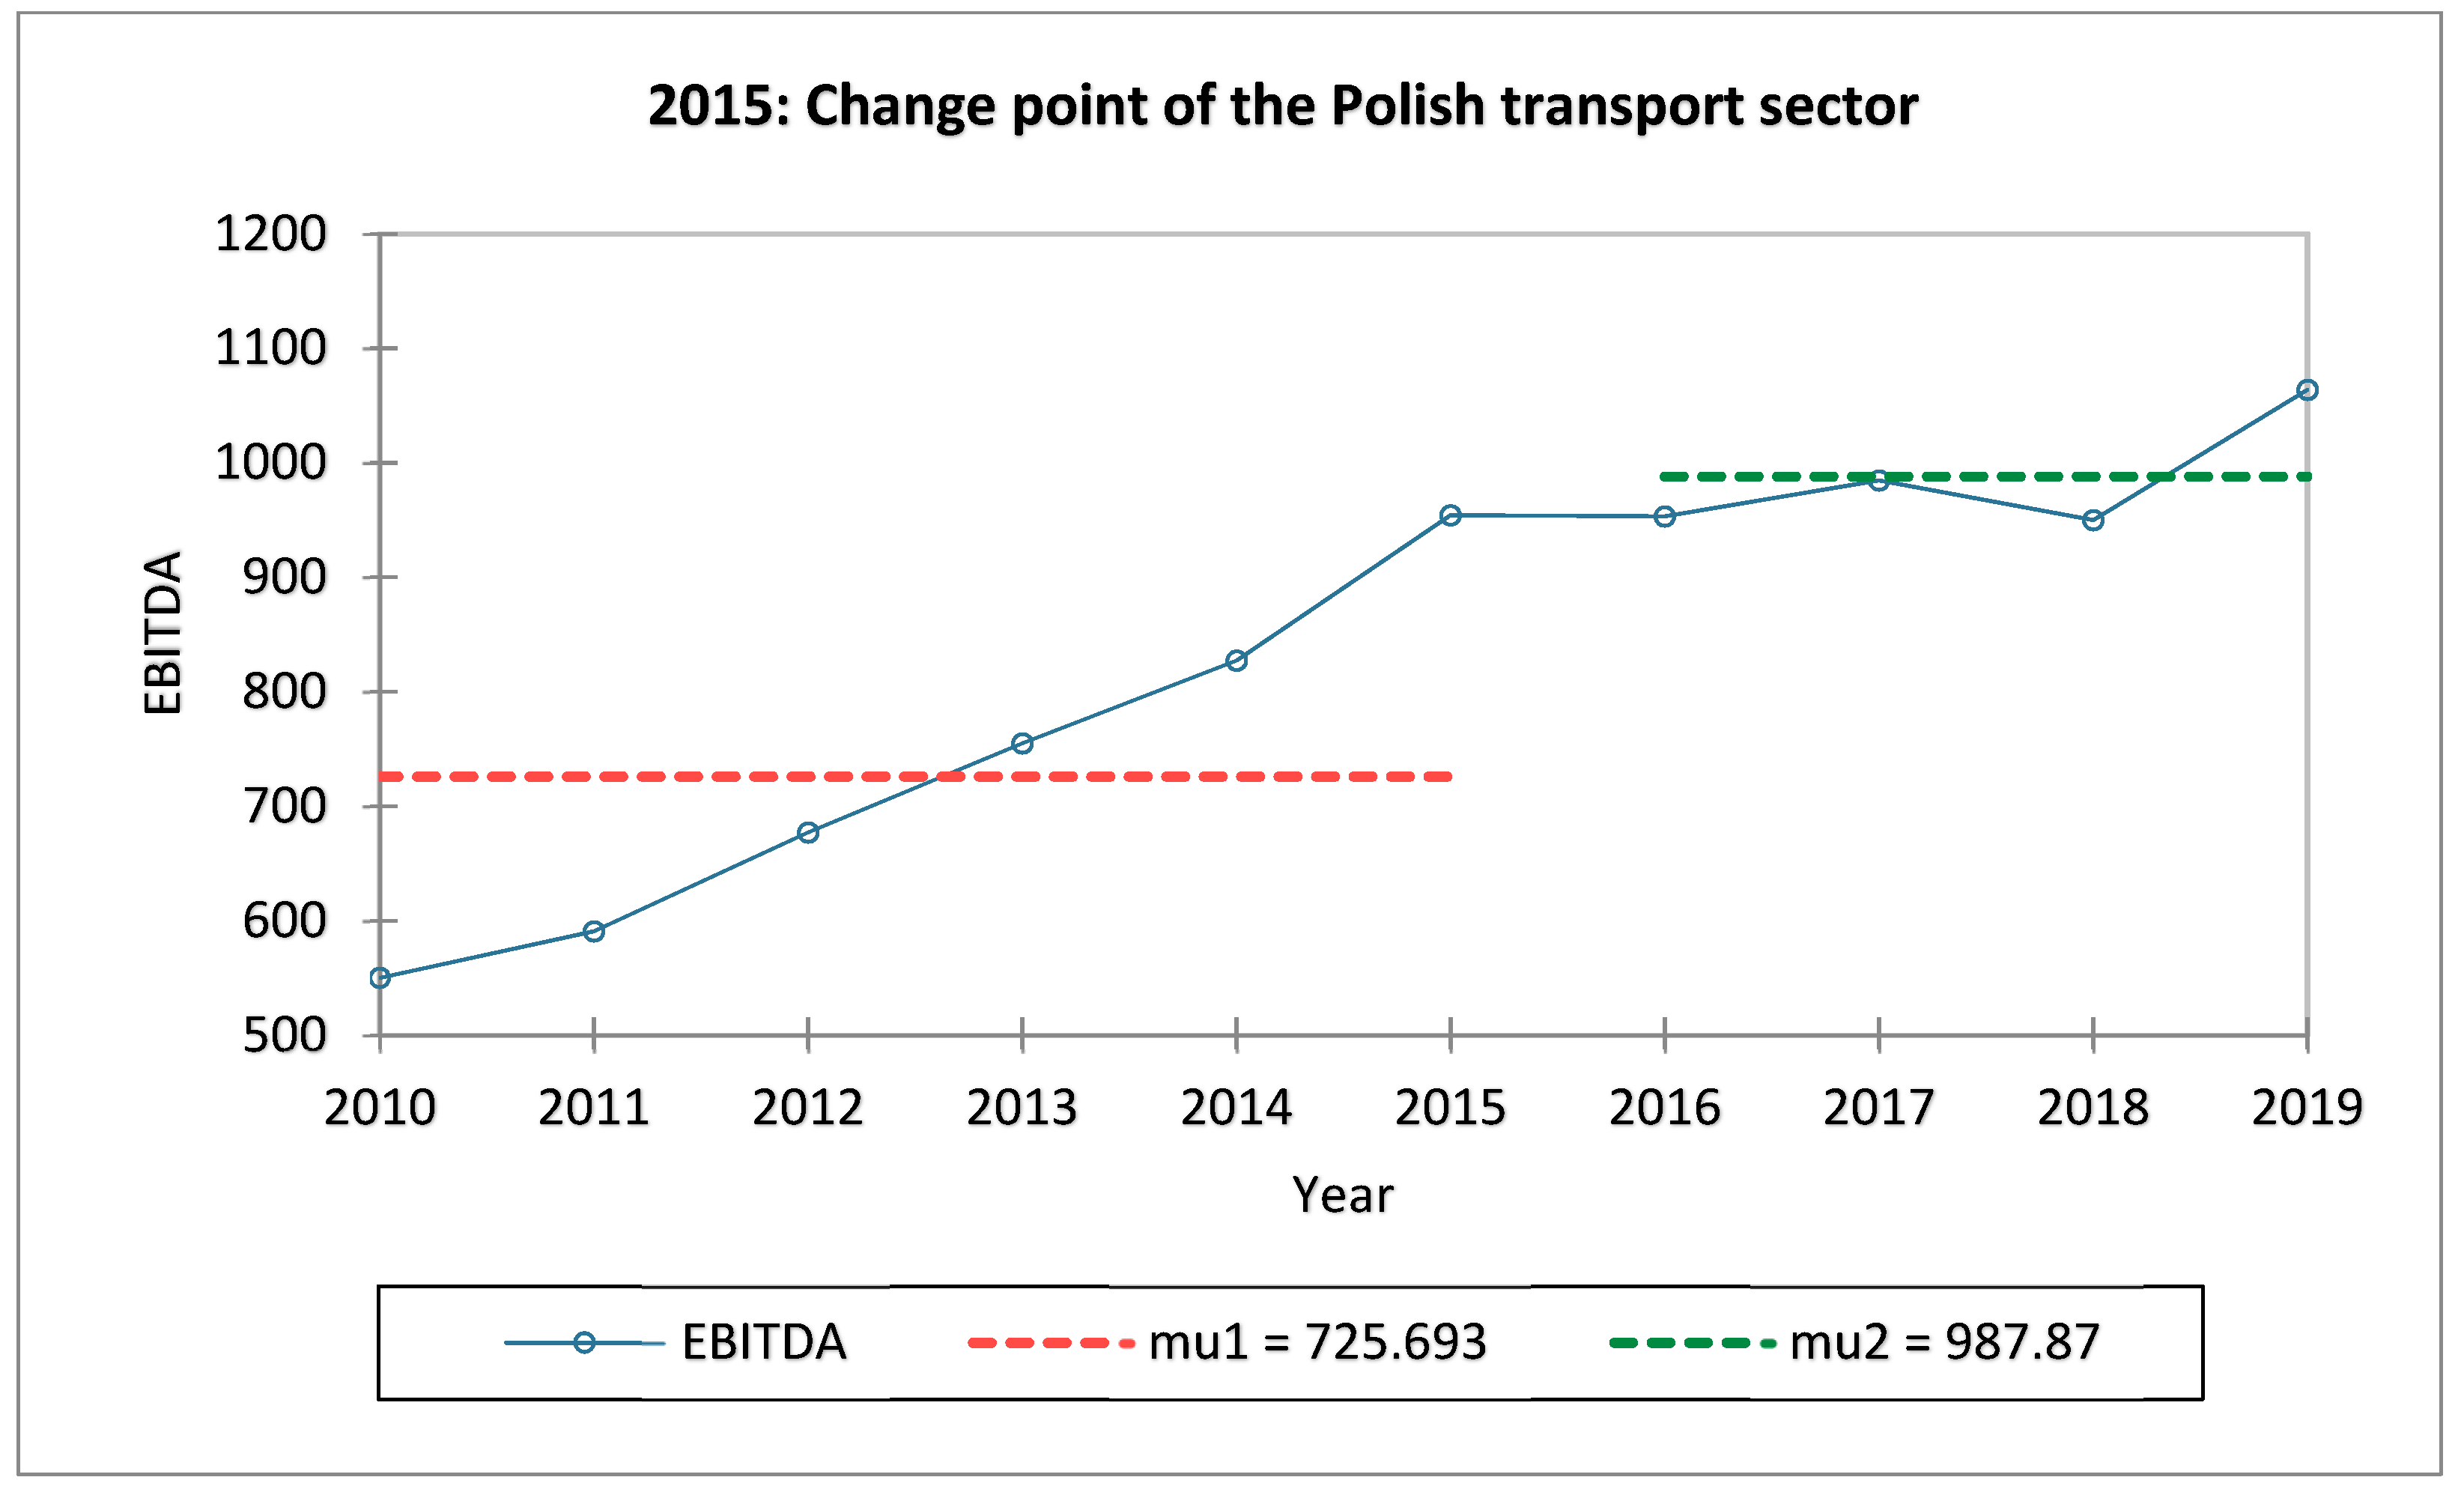
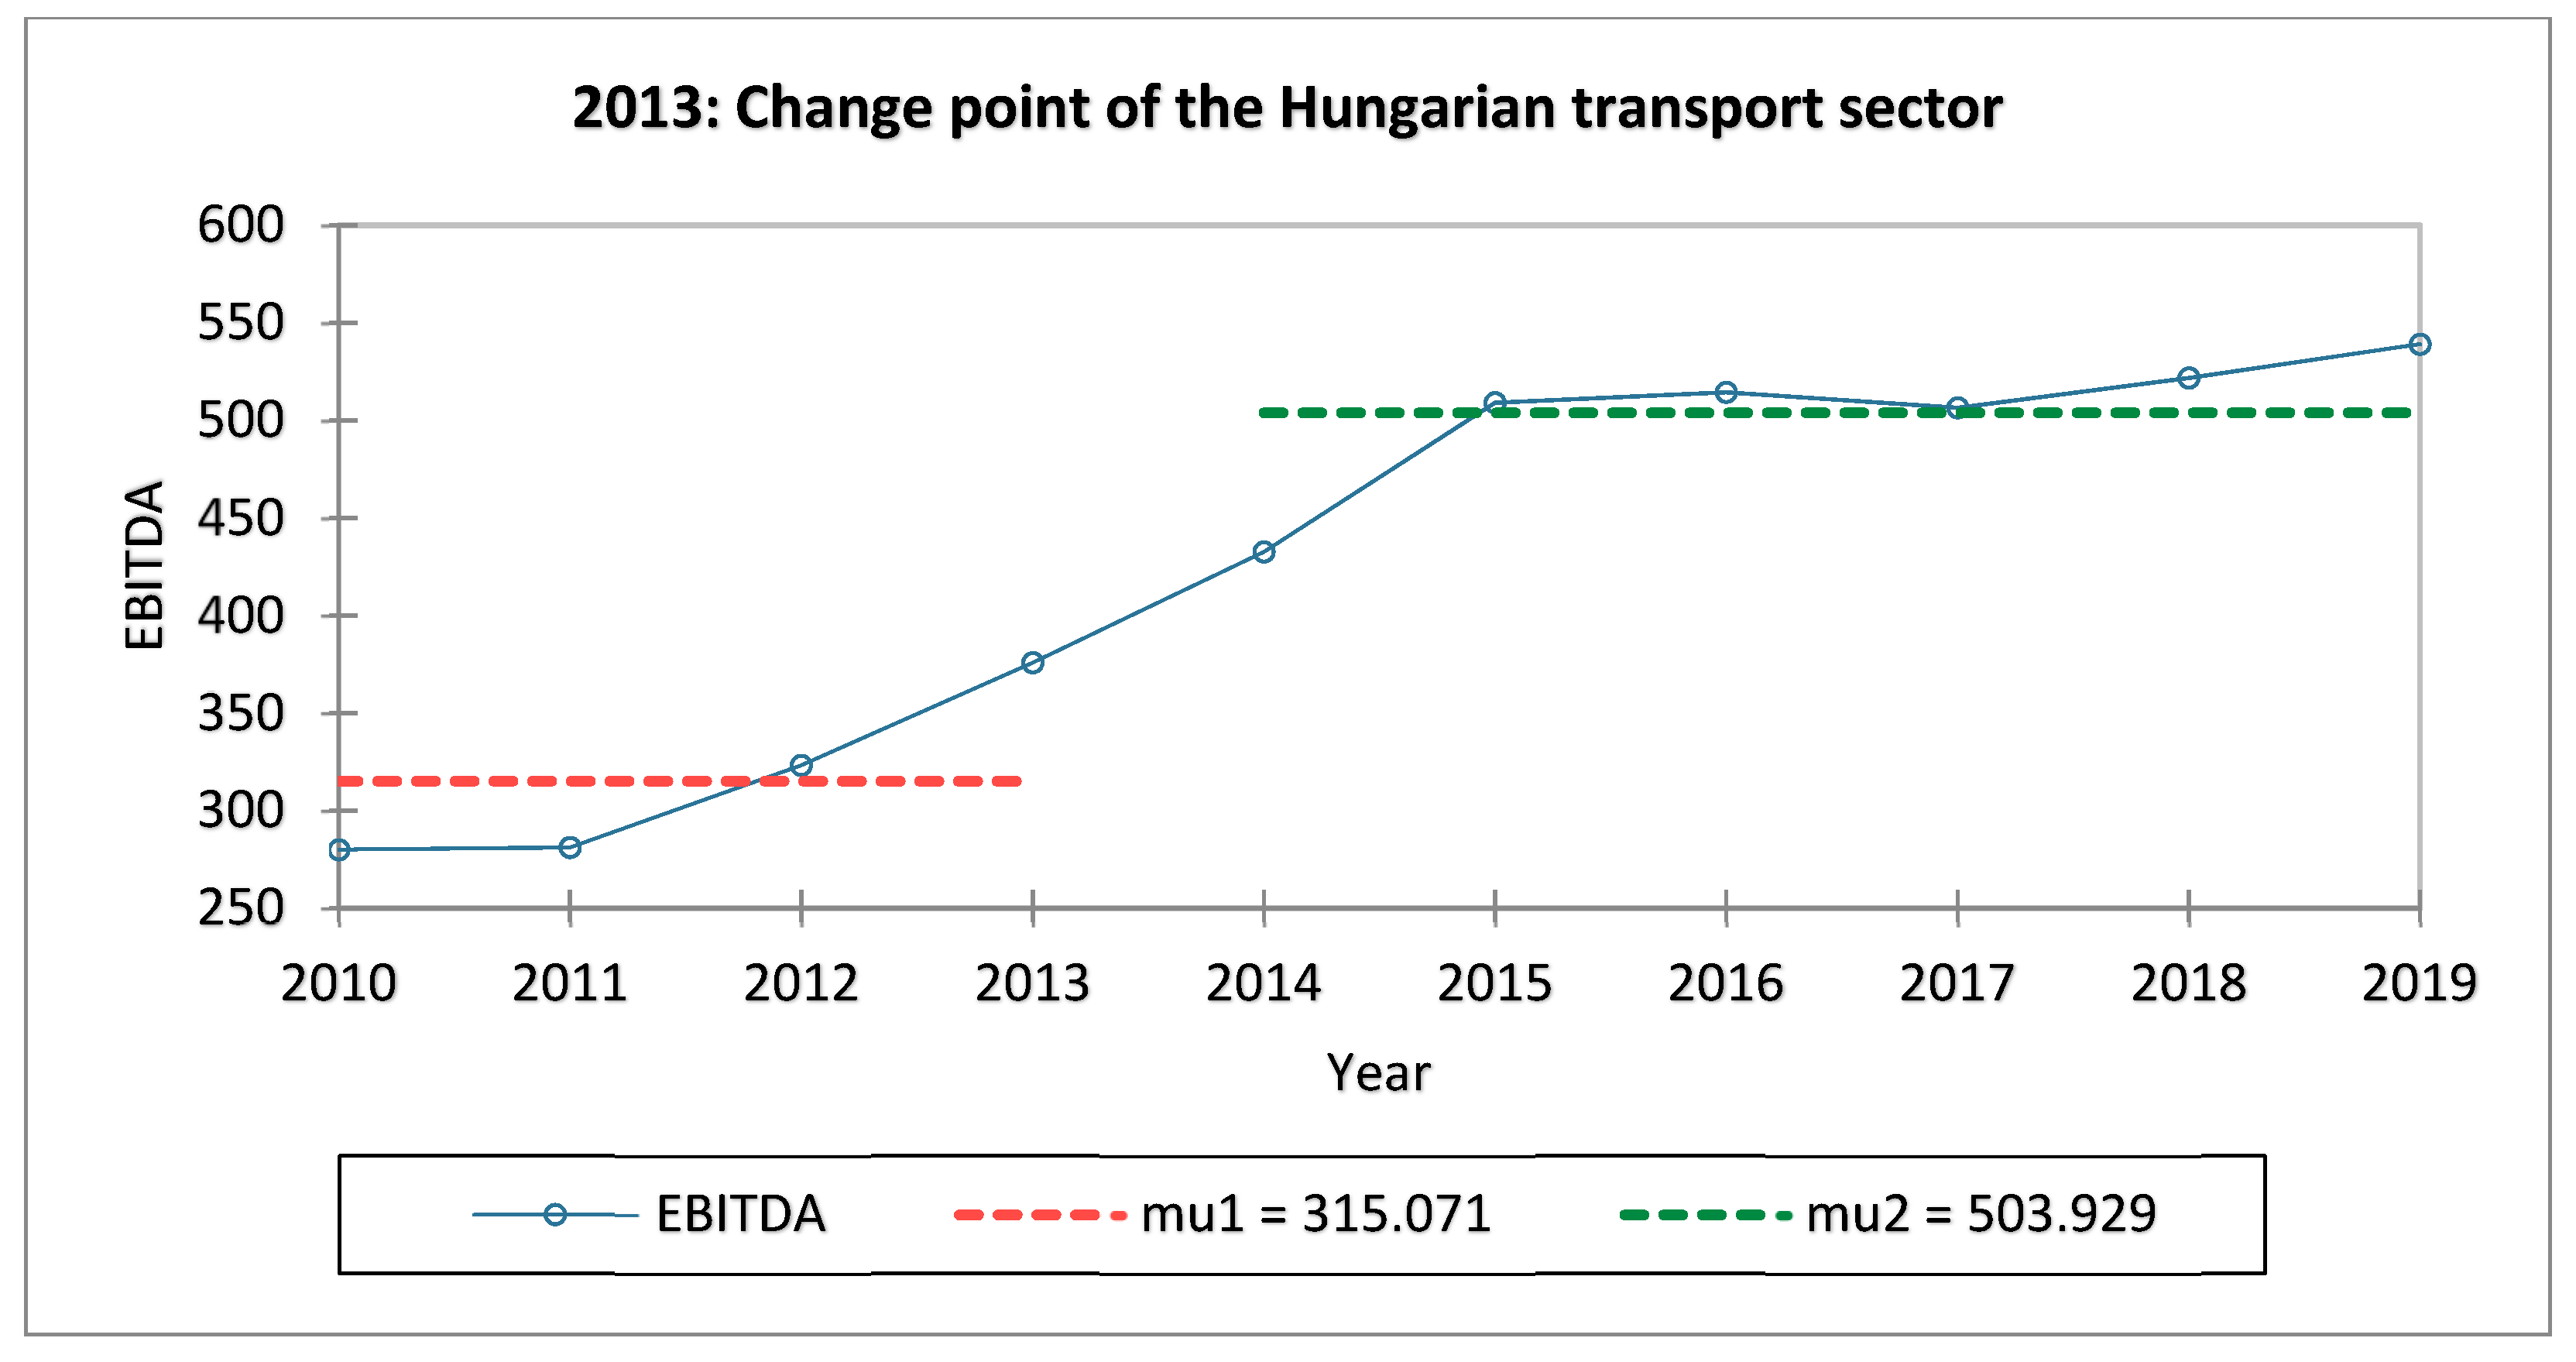
- Focus on the lever year.
- 5.
- Focus on the trend.
- 6.
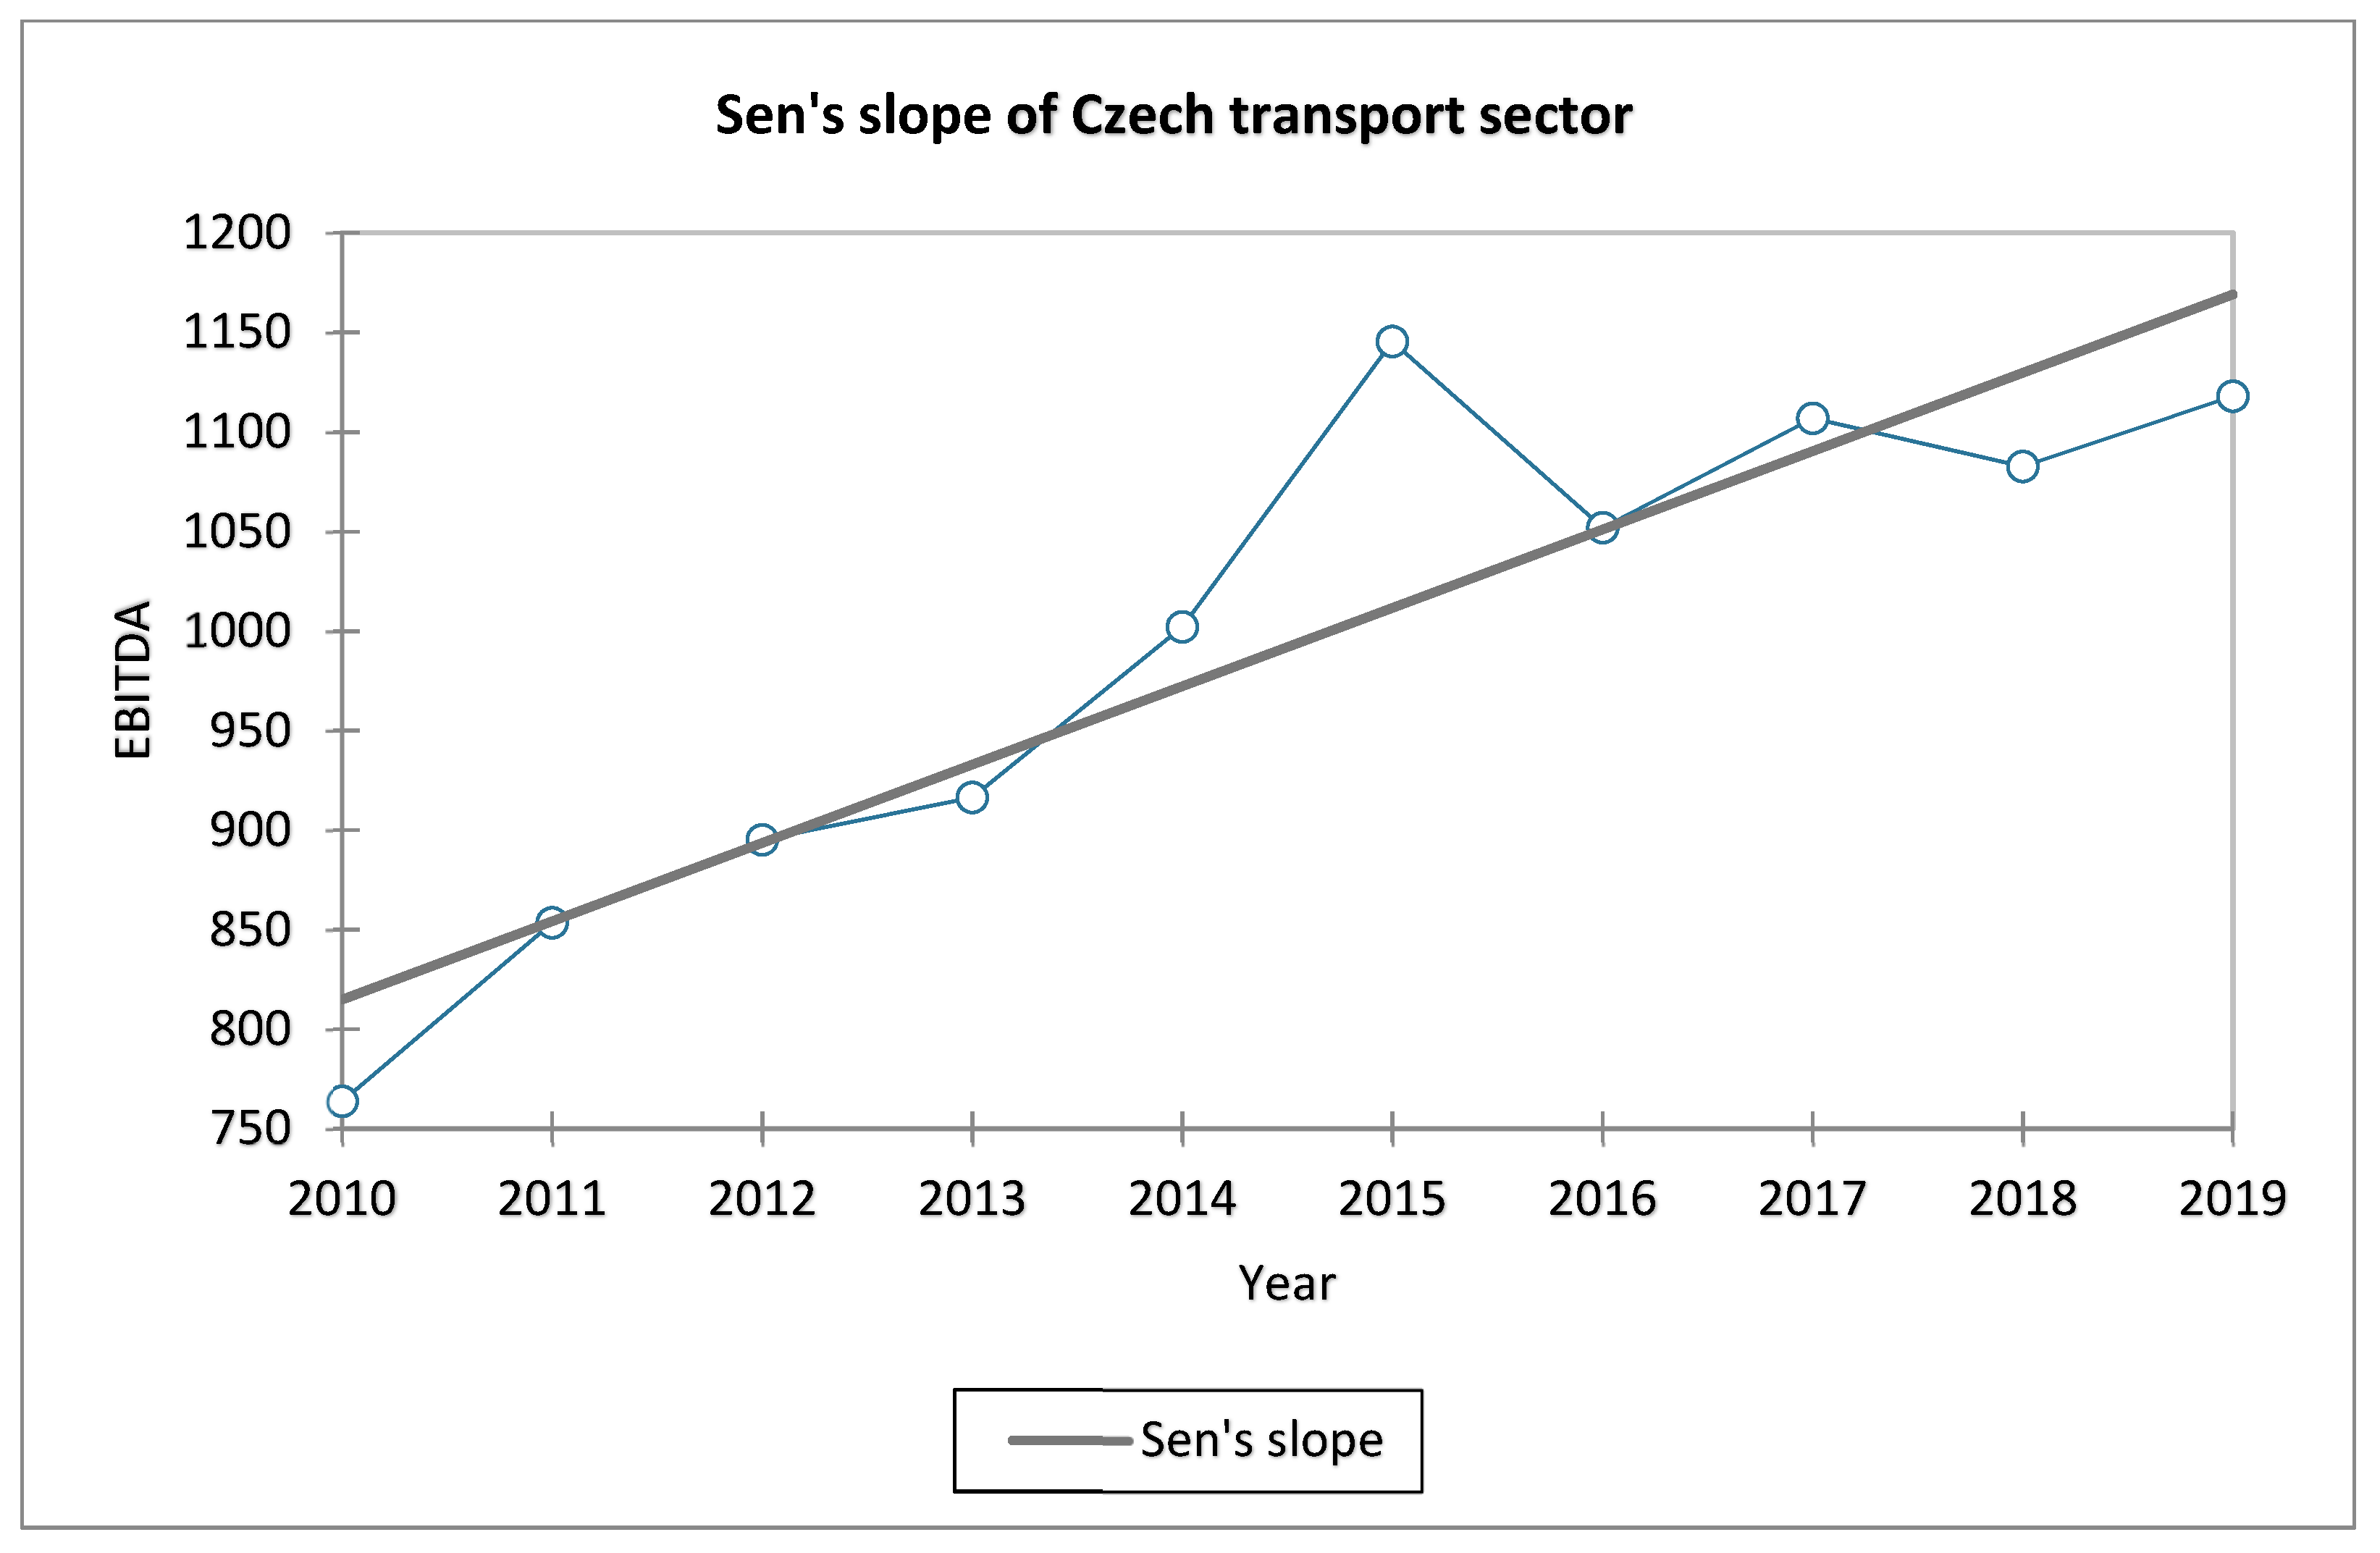
- Focus on the slope.
3. Results
4. Discussion
5. Conclusions
Author Contributions
Funding
Institutional Review Board Statement
Informed Consent Statement
Data Availability Statement
Acknowledgments
Conflicts of Interest
References
- Kramarova, K. Transfer pricing and controlled transactions in connection with earnings management and tax avoidance. SHS Web Conf. 2021, 92, 02031. [Google Scholar] [CrossRef]
- Savova, K. Differences in application of accounting standards—Current aspects. Ekon.-Manaz. Spektrum 2021, 15, 111–122. [Google Scholar] [CrossRef]
- Nemteanu, M.S.; Dabija, D.C. The influence of heavy work investment on job satisfaction and turnover intention in Romania. Amfiteatru Econ. 2020, 22, 993–1013. [Google Scholar] [CrossRef]
- Olah, J.; Hidayat, Y.A.; Popp, J.; Lakner, Z.; Kovacs, S. Integrative trust and innovation on financial performance in disruptive era. Econ. Sociol. 2021, 14, 111–136. [Google Scholar] [CrossRef]
- Zvarikova, K.; Rowland, M.; Krulicky, T. Sustainable Industry 4.0 wireless networks, smart factory performance, and cognitive automation in cyber-physical system-based manufacturing. J. Self-Gov. Manag. Econ. 2021, 9, 9–21. [Google Scholar]
- Horick, C. Industry 4.0 production networks: Cyber-physical system-based smart factories, real-time big data analytics, and sustainable product lifecycle management. J. Self-Gov. Manag. Econ. 2020, 8, 107–113. [Google Scholar]
- Hopkins, E.; Siekelova, A. Internet of things sensing networks, smart manufacturing big data, and digitized mass production in sustainable Industry 4.0. Econ. Manag. Financ. Mark. 2021, 16, 28–41. [Google Scholar]
- Konecny, V.; Barnett, C.; Poliak, M. Sensing and computing technologies, intelligent vehicular networks, and big data-driven algorithmic decision-making in smart sustainable urbanism. Contemp. Read. Law Soc. Justice 2021, 13, 30–39. [Google Scholar]
- Nastisin, L.; Gavurova, B.; Bacik, R.; Svetozarovova, N.; Fedorko, R. Sustainable performance of players in the global aviation industry in the light of multi-factor analysis of online reputation. Int. J. Entrep. Knowl. 2021, 9, 1–9. [Google Scholar] [CrossRef]
- Mezulanik, J.; Durda, L.; Civelek, M.; Malec, L. Ride-hailing vs. taxi services: A survey-based comparison. J. Tour. Serv. 2020, 20, 170–186. [Google Scholar] [CrossRef]
- Nica, E.; Stehel, V. Internet of things sensing networks, artificial intelligence-based decision-making algorithms, and real-time process monitoring in sustainable Industry 4.0. J. Self-Gov. Manag. Econ. 2021, 9, 35–47. [Google Scholar]
- Thai, V.H.; Dinh, V.T.; Nguyen, V.S.; Nguyen, M.H.; Nguyen, C.T.; Pham, T.L.P. The influence of earning management and surplus free cash flow on the banking sector performance. Pol. J. Manag. Stud. 2021, 23, 403–417. [Google Scholar] [CrossRef]
- Spinthiropoulos, K.; Tsiatsiou, E.; Garefalakis, A.; Chaitidis, G.; Stavropoulou, E. Greek economic crisis management program and its impact on public employees’ earnings: A case series and literature review. Pol. J. Manag. Stud. 2021, 24, 431–448. [Google Scholar] [CrossRef]
- Simonidesova, J.; Kudlova, Z.; Lukac, J.; Manova, E.; Culkova, K. Tax aspects of mining companies in V4 countries. Acta Montan. Slovaca 2021, 26, 35–46. [Google Scholar]
- Chovancova, J.; Tej, J. Decoupling economic growth from greenhouse gas emissions: The case of the energy sector in V4 countries. Equilib. Q. J. Econ. Econ. Policy 2020, 15, 235–251. [Google Scholar] [CrossRef]
- Lyulyov, O.; Lyeonov, S.; Tiutiunyk, I.; Podgorska, J. The impact of tax gap on macroeconomic stability: Assessment using panel VEC approach. J. Int. Stud. 2021, 14, 139–152. [Google Scholar] [CrossRef] [PubMed]
- Kowal-Pawul, A.; Przekota, G. Importance of VAT digitization for income disclosure in section F-construction—A case for Poland. J. Int. Stud. 2021, 14, 67–86. [Google Scholar] [CrossRef] [PubMed]
- Durana, P.; Zauskova, A.; Vagner, L.; Zadnanova, S. Earnings drivers of Slovak manufacturers: Efficiency assessment of innovation management. Appl. Sci. 2020, 10, 4251. [Google Scholar] [CrossRef]
- Stevanovic, S.; Minovic, J.; Marinkovic, G. Earnings and cash flow persistence—Case of medium agriculture enterprises in Serbia. Ekon. Poljopr.-Econ. Agric. 2021, 68, 141–153. [Google Scholar] [CrossRef]
- Cirella, G.T.; Bak, M.; Kozlak, A.; Pawlowska, B.; Borkowski, P. Transport innovations for elderly people. Res. Transp. Bus. Manag. 2019, 30, 100381. [Google Scholar] [CrossRef]
- Aldridge, S.; Stehel, V. Intelligent vehicular networks, deep learning-based sensing technologies, and big data-driven algorithmic decision-making in smart transportation systems. Contemp. Read. Law Soc. Justice 2021, 13, 107–120. [Google Scholar]
- Hlatka, M.; Stopka, O.; Bartuska, L.; Stopkova, M.; Yordanova, D.N.; Gross, P.; Sadlo, P. Draft methodology of the age management implementation in human resource management in a transport company. J. Risk Financ. Manag. 2021, 14, 183. [Google Scholar] [CrossRef]
- Nyulasziova, M.; Palova, D. Implementing a decision support system in the transport process management of a small Slovak transport company. J. Entrep. Manag. Innov. 2020, 16, 75–106. [Google Scholar] [CrossRef] [Green Version]
- Cichosz, M.; Pluta-Zaremba, A. How to improve freight transport emissions’ management? LogForum 2019, 15, 93–105. [Google Scholar] [CrossRef]
- Neverauskiene, L.O.; Novikova, M.; Kazlauskiene, E. Factors determining the development of intelligent transport systems. Bus. Manag. Econ. Eng. 2021, 19, 229–243. [Google Scholar] [CrossRef]
- Katiniene, A.; Jezerske, Z.; Vaiciute, K. Research on competencies of logistics specialists in transport organisations. J. Bus. Econ. Manag. 2021, 22, 1308–1322. [Google Scholar] [CrossRef]
- Kadlubek, M. Freight transport development forecasts in enterprises management. Glob. J. Environ. Sci. Manag. 2019, 5, 96–104. [Google Scholar]
- Hens, L.; Melnyk, L.H.; Matsenko, O.M.; Chyhryn, O.Y.; Gonzales, C.C. Transport economics and sustainable development in Ukraine. Mark. Manag. Innov. 2019, 3, 272–284. [Google Scholar] [CrossRef]
- Brizga, J.; Juruss, M.; Smite-Roke, B. Impact of the environmental taxes on reduction of emission from transport in Latvia. Post-Communist Econ. 2021. [Google Scholar] [CrossRef]
- Vrana, M.; Surmarova, S.; Hlisnikovsky, P.; Dujka, J. Transport in times of an epidemic: Public transport measures in the Czech Republic and its regions. Rev. Econ. Perspect. 2021, 21, 57–78. [Google Scholar] [CrossRef]
- Dementiev, A.; Han, H.J. A theory of deregulation in public transport. Res. Transp. Econ. 2020, 83, 100953. [Google Scholar] [CrossRef]
- Ionescu, L. Pricing carbon pollution: Reducing emissions or GDP growth? Econ. Manag. Financ. Mark. 2020, 15, 37–43. [Google Scholar]
- Navarro, P. Applying quality concepts to achieve environmental sustainability in the freight transport sector-reviewing process management and lean. Int. J. Qual. Serv. Sci. 2021, 13, 545–562. [Google Scholar] [CrossRef]
- Ishikawa, J.; Tarui, N. You can’t always get what you want: Protectionist policies with the transport sector. Econ. Lett. 2021, 207, 110009. [Google Scholar] [CrossRef]
- Rothengatter, W.; Zhang, J.; Hayashi, Y.; Nosach, A.; Wang, K.; Oum, T.H. Pandemic waves and the time after Covid-19-Consequences for the transport sector. Transp. Policy 2021, 110, 225–237. [Google Scholar] [CrossRef] [PubMed]
- Zhang, R.; Zhang, J. Long-term pathways to deep decarbonization of the transport sector in the post-COVID world. Transp. Policy 2021, 110, 28–36. [Google Scholar] [CrossRef] [PubMed]
- Nemteanu, M.S.; Dinu, V.; Dabija, D.C. Job insecurity, job instability, and job satisfaction in the context of the Covid-19 pandemic. J. Compet. 2021, 13, 65–82. [Google Scholar] [CrossRef]
- Nemteanu, M.S.; Dabija, D.C. The influence of internal marketing and job satisfaction on task performance and counterproductive work behavior in an emerging market during the COVID-19 pandemic. Int. J. Environ. Res. Public Health 2021, 18, 3670. [Google Scholar] [CrossRef] [PubMed]
- Santarromana, R.; Mendonca, J.; Dias, A.M. The effectiveness of decarbonizing the passenger transport sector through monetary incentives. Transp. Res. Part A Policy Pract. 2020, 138, 442–462. [Google Scholar] [CrossRef]
- Krawczyk, P.; Kokot-Stepien, P. The impact of the exchange rate on the financial result of enterprises in the transport sector. Ekon. Prawo. Econ. Law 2020, 19, 47–60. [Google Scholar] [CrossRef] [Green Version]
- Vavrek, R.; Becica, J. Population size and transport company efficiency—Evidence from Czech Republic. Transp. Res. Interdiscip. Perspect. 2020, 6, 100145. [Google Scholar] [CrossRef]
- Velinov, E.; Cincalova, S. Corporate Social Responsibility and internationalization of Czech transport enterprises. In Proceedings of the 19th International Scientific Conference on Hradec Economic Days, Hradec Kralove, Czech Republic, 25–26 March 2021; Volume 11, pp. 842–848. [Google Scholar]
- Hudakova, M.; Gabrysova, M.; Petrakova, Z.; Buganova, K.; Krajcik, V. The perception of market and economic risks by owners and managers of enterprises in the V4 Countries. J. Compet. 2021, 13, 60–77. [Google Scholar] [CrossRef]
- Stefko, R.; Fedorko, R.; Bacik, R.; Rigelsky, M.; Olearova, M. Effect of service quality assessment on perception of TOP hotels in terms of sentiment polarity in the Visegrad group countries. Oeconomia Copernic. 2020, 11, 721–742. [Google Scholar] [CrossRef]
- Gavurova, B.; Cepel, M.; Belas, J.; Dvorsky, J. Strategic Management in SMEs and its significance for enhancing the competitiveness in the V4 countries—A comparative analysis. Manag. Mark. Chall. Knowl. Soc. 2020, 15, 557–569. [Google Scholar] [CrossRef]
- Svabova, L.; Valaskova, K.; Durana, P.; Kliestik, T. Dependency analysis between various profit measures and corporate total assets for Visegrad group’s business entities. Organizacija 2020, 53, 80–90. [Google Scholar] [CrossRef] [Green Version]
- Bouwens, J.; De Kok, T.; Verriest, A. The prevalence and validity of EBITDA as a performance measure. Comptab. Controle Audit 2019, 25, 55–105. [Google Scholar] [CrossRef]
- Rozenbaum, O. EBITDA and managers’ investment and leverage choices. Contemp. Account. Res. 2019, 36, 513–546. [Google Scholar] [CrossRef] [Green Version]
- Sierpinska-Sawicz, A.; Sierpinska, M.; Krolikowska, E. Where the EBITDA metric is used in coal companies. Gospod. Surowcami Miner.-Miner. Resour. Manag. 2020, 36, 109–126. [Google Scholar]
- Svabova, L.; Michalkova, L. Pre-processing of data in earnings management. Bus. Econ. Manag. 2018, 3, 65–72. [Google Scholar]
- Valaskova, K.; Kliestik, T.; Gajdosikova, D. Distinctive determinants of financial indebtedness: Evidence from Slovak and Czech enterprises. Equilib. Q. J. Econ. Econ. Policy 2021, 16, 639–659. [Google Scholar] [CrossRef]
- Belas, J.; Cepel, M. Market risk in the SMEs segment in the Visegrad Group countries. Transform. Bus. Econ. 2020, 19, 678–693. [Google Scholar]
- Kliestik, T.; Valaskova, K.; Nica, E.; Kovacova, M.; Lazaroiu, G. Advanced methods of earnings management: Monotonic trends and change-points under spotlight in the Visegrad countries. Oeconomia Copernic. 2020, 11, 371–400. [Google Scholar] [CrossRef]
- Dimitrova, M.; Treapat, L.M.; Tulaykova, I. Value at Risk as a tool for economic-managerial decision-making in the process of trading in the financial market. Ekon.-Manaz. Spektrum 2021, 15, 13–26. [Google Scholar] [CrossRef]
- Shkolnyk, I.; Kozmenko, O.; Nowacki, R.; Mershchii, B. Dependence of the state of public finances on their transparency and the level of corruption in a country. Econ. Sociol. 2020, 13, 281–296. [Google Scholar] [CrossRef] [PubMed]
- Fraczek, B.; Urbanek, A. Financial inclusion as an important factor influencing digital payments in passenger transport: A case study of EU countries. Res. Transp. Bus. Manag. 2021, 41, 100691. [Google Scholar] [CrossRef]
- Popkova, E.G.; Sergi, B.S.; Rezaei, M.; Ferraris, A. Digitalisation in transport and logistics: A roadmap for entrepreneurship in Russia. Int. J. Technol. Manag. 2021, 87, 7–28. [Google Scholar] [CrossRef]
- Griffin, K.; Krastev, V. Smart traffic planning and analytics, autonomous mobility technologies, and algorithm-driven sensing devices in urban transportation systems. Contemp. Read. Law Soc. Justice 2021, 13, 65–78. [Google Scholar]
- Kovac, I.; Vuletic, A.; Mlinaric, D. Environmental responsibility of Croatian road freight transport enterprises. Int. J. Retail. Distrib. Manag. 2020, 48, 1023–1035. [Google Scholar] [CrossRef]
- Poliak, M.; Svabova, L.; Konecny, V.; Zhuravleva, N.A.; Culik, K. New paradigms of quantification of economic efficiency in the transport sector. Oeconomia Copernic. 2021, 12, 193–212. [Google Scholar] [CrossRef]
- Rozic, T.; Rogic, K.; Ivankovic, B. Modelling inland terminal locations based on transport cost optimisation. Int. J. Shipp. Transp. Logist. 2020, 12, 487–503. [Google Scholar] [CrossRef]
- Poliak, M.; Poliakova, A.; Svabova, L.; Zhuravleva, A.; Nica, E. Competitiveness of price in international road freight transport. J. Compet. 2021, 13, 83–98. [Google Scholar] [CrossRef]
- Oliveira, R.R.; Schirrmeister, R.; Zatta, F.N.; Freitas, R.R.; Goncalves, W. Road transport infrastructure: A longitudinal case study (2009–2017). Indep. J. Manag. Prod. 2019, 10, 1556–1571. [Google Scholar] [CrossRef] [Green Version]
- Ali, Y.; Socci, C.; Pretaroli, R.; Severini, F. Economic and environmental impact of transport sector on Europe economy. Asia-Pac. J. Reg. Sci. 2018, 2, 361–397. [Google Scholar] [CrossRef]
- Varjan, P.; Gnap, J.; Durana, P.; Kostrzewski, M. Research on the relationship between transport performance in road freight transport and revenues from excise duty on diesel fuel in selected European countries. Transp. Res. Procedia 2019, 40, 1216–1223. [Google Scholar] [CrossRef]
- Gnap, J.; Varjan, P.; Durana, P.; Kostrzewski, M. Research on relationship between freight transport and transport infrastructure in selected European countries. Transp. Probl. 2019, 14, 63–74. [Google Scholar] [CrossRef] [Green Version]
- Lazaroiu, G.; Harrison, A. Internet of Things sensing infrastructures and data-driven planning technologies in smart sustainable city governance and management. Geopolit. Hist. Int. Relat. 2021, 13, 23–36. [Google Scholar]
- Woodward, B.; Kliestik, T. Intelligent transportation applications, autonomous vehicle perception sensor data, and decision-making self-driving car control algorithms in smart sustainable urban mobility systems. Contemp. Read. Law Soc. Justice 2021, 13, 51–64. [Google Scholar]
- Adams, D.; Novak, A.; Kliestik, T.; Potcovaru, A.-M. Sensor-based Big Data applications and environmentally sustainable urban development in Internet of Things-enabled smart cities. Geopolit. Hist. Int. Relat. 2021, 13, 108–118. [Google Scholar]
- Wallace, S.; Lazaroiu, G. Predictive control algorithms, real-world connected vehicle data, and smart mobility technologies in intelligent transportation planning and engineering. Contemp. Read. Law Soc. Justice 2021, 13, 79–92. [Google Scholar]


| Sample | Slovakia | Czechia | Poland | Hungary |
|---|---|---|---|---|
| Preprocessing | 830 | 775 | 1941 | 1450 |
| Missing values | 360 | 370 | 1167 | 394 |
| Outlying values | 7 | 8 | 17 | 14 |
| Processing | 463 | 397 | 757 | 1042 |
| Year | Slovakia | Czechia | Poland | Hungary |
|---|---|---|---|---|
| 2010 | 525.601 | 763.865 | 550.055 | 280.051 |
| 2011 | 566.141 | 853.448 | 590.841 | 281.186 |
| 2012 | 560.970 | 895.142 | 677.046 | 323.248 |
| 2013 | 586.439 | 916.422 | 754.779 | 375.798 |
| 2014 | 653.010 | 1002.046 | 827.336 | 432.666 |
| 2015 | 707.807 | 1145.390 | 954.103 | 509.153 |
| 2016 | 687.597 | 1051.878 | 953.027 | 514.486 |
| 2017 | 676.083 | 1106.885 | 984.679 | 506.459 |
| 2018 | 666.662 | 1082.634 | 949.975 | 521.709 |
| 2019 | 644.151 | 1117.969 | 1063.798 | 539.097 |
| Buishand’s R Test | Slovakia | Czechia | Poland | Hungary |
|---|---|---|---|---|
| R | 4.565 | 4.441 | 4.435 | 4.567 |
| p-value (Two-tailed) | 0.001 | 0.000 | 0.001 | <0.0001 |
| alpha | 0.05 | 0.05 | 0.05 | 0.05 |
| Buishand’s Q Test | Slovakia | Czechia | Poland | Hungary |
|---|---|---|---|---|
| Q | 4.565 | 4.441 | 4.435 | 4.567 |
| Change-point t | 2013 | 2014 | 2015 | 2013 |
| p-value (Two-tailed) | 0.000 | 0.005 | 0.004 | <0.0001 |
| alpha | 0.05 | 0.05 | 0.05 | 0.05 |
| mu1 [thousand €] | 559.788 | 886.184 | 725.693 | 315.071 |
| mu2 [thousand €] | 672.552 | 1100.951 | 987.870 | 503.929 |
| Mann–Kendall Trend Test | Slovakia | Czechia | Poland | Hungary |
|---|---|---|---|---|
| Kendall’s tau | 0.467 | 0.778 | 0.822 | 0.911 |
| S | 21.000 | 35.000 | 37.000 | 41.000 |
| Var(S) | 125.000 | 125.000 | 125.000 | 125.000 |
| p-value (one-tailed) | 0.037 | 0.001 | 0.001 | 0.000 |
| alpha | 0.050 | 0.050 | 0.050 | 0.050 |
| Value | Slovakia | Czechia | Poland | Hungary |
|---|---|---|---|---|
| Slope [thousand €] | 17.615 | 39.345 | 61.527 | 32.344 |
| Intercept [thousand €] | −34,865.895 | −78,268.202 | −123,114.453 | −64,732.306 |
Publisher’s Note: MDPI stays neutral with regard to jurisdictional claims in published maps and institutional affiliations. |
© 2022 by the authors. Licensee MDPI, Basel, Switzerland. This article is an open access article distributed under the terms and conditions of the Creative Commons Attribution (CC BY) license (https://creativecommons.org/licenses/by/4.0/).
Share and Cite
Durana, P.; Valaskova, K.; Blazek, R.; Palo, J. Metamorphoses of Earnings in the Transport Sector of the V4 Region. Mathematics 2022, 10, 1204. https://doi.org/10.3390/math10081204
Durana P, Valaskova K, Blazek R, Palo J. Metamorphoses of Earnings in the Transport Sector of the V4 Region. Mathematics. 2022; 10(8):1204. https://doi.org/10.3390/math10081204
Chicago/Turabian StyleDurana, Pavol, Katarina Valaskova, Roman Blazek, and Jozef Palo. 2022. "Metamorphoses of Earnings in the Transport Sector of the V4 Region" Mathematics 10, no. 8: 1204. https://doi.org/10.3390/math10081204
APA StyleDurana, P., Valaskova, K., Blazek, R., & Palo, J. (2022). Metamorphoses of Earnings in the Transport Sector of the V4 Region. Mathematics, 10(8), 1204. https://doi.org/10.3390/math10081204