Article

Modular Representation of Physiologically Based Pharmacokinetic Models: Nanoparticle Delivery to Solid Tumors in Mice as an Example

1
Department of Computational Biology, Sirius University of Science and Technology, 354340 Sochi, Russia
2
Bioinformatics Laboratory, Federal Research Center for Information and Computational Technologies, 630090 Novosibirsk, Russia
3
Biosoft.Ru, Ltd., 630058 Novosibirsk, Russia
4
Department of Natural Sciences, Novosibirsk State University, 630090 Novosibirsk, Russia
*
Author to whom correspondence should be addressed.
Mathematics 2022, 10(7), 1176; https://doi.org/10.3390/math10071176
Submission received: 4 March 2022 / Revised: 29 March 2022 / Accepted: 31 March 2022 / Published: 4 April 2022
(This article belongs to the Special Issue Mathematical and Computational Methods in Systems Biology)

Abstract

:
Here we describe a toolkit for presenting physiologically based pharmacokinetic (PBPK) models in a modular graphical view in the BioUML platform. Firstly, we demonstrate the BioUML capabilities for PBPK modeling tested on an existing model of nanoparticles delivery to solid tumors in mice. Secondly, we provide guidance on the conversion of the PBPK model code from a text modeling language like Berkeley Madonna to a visual modular diagram in the BioUML. We give step-by-step explanations of the model transformation and demonstrate that simulation results from the original model are exactly the same as numerical results obtained for the transformed model. The main advantage of the proposed approach is its clarity and ease of perception. Additionally, the modular representation serves as a simplified and convenient base for in silico investigation of the model and reduces the risk of technical errors during its reuse and extension by concomitant biochemical processes. In summary, this article demonstrates that BioUML can be used as an alternative and robust tool for PBPK modeling.

1. Introduction

The use of mathematical modeling methods has become an integral part of drug discovery and development [1]. Pharmacokinetic (PK) models can be applied to calculate the effective half-life of drugs after intravenous or oral administration to humans or animals, adjust the initial dose, and determine the alternative doses or dosing regimens in the target population.
Two main approaches can be used to analyze PK data [2]:
  • noncompartmental analysis estimates the exposure to a drug (such parameters as the area under the plasma drug concentration-time curve, maximum drug concentration, and time at maximum concentration) directly from observed individual profiles.
  • model-based compartmental analysis predicts the concentration-time curve using kinetic models.
The conceptual basis of the noncompartmental approach is that no assumptions are made about the underlying structure of the model. The main focus of the analysis is on the assessment of drug clearance and volume of distribution, rather than the mechanisms of drug disposition. The clearances and volumes calculated are numerically identical for both approaches. The major difference relates to the parameter used to describe how long a drug remains in the body. In the first approach, the mean residence time is calculated as the time that bisects the area under the plasma concentration-time curve. In the second approach, the elimination half-life (the time it takes for 50% of the administered drug to be eliminated from the body) is used [3].
The simplest form of the compartmental PK model is defined by one or two compartments [4]. The fundamental assumption behind the one-compartment model (representing the whole body) is that equilibrium is rapidly achieved within the body after the drug administration. In this case, the concentration profile is expressed as an exponential function of time. The two-compartment model (the first compartment is considered as a lumped sum of rapidly-perfused tissues, such as the liver, kidney, heart, and lung, while the second one represents a lumped sum of slowly-perfused tissues, such as the muscle, fat, and skin) can be used to describe two main phases, including the distribution and the elimination of drugs, which are also characterized by exponential dynamics.
More complex physiologically-based pharmacokinetic (PBPK) models consist of several compartments, each of which represents a specific part of the body: a group of organs or tissues (for example, tissue with slow perfusion), a single organ or tissue (e.g., liver, lungs, etc.) or some area of an organ or tissue (for example, intracellular space) [5,6]. These models are built using differential equations parameterized with known physiological variables, which can describe the absorption, distribution, metabolism, and excretion of drugs [1].
PBPK models are typically stipulated as a set of interconnected vessels with ideal mixing, where both biochemical and transport mechanisms are given as black-box, empirical relations. The kinetics of novel drugs can be studied more systematically with mechanistic biochemical models in entire organisms [7].
An application of molecular modeling techniques including molecular docking in the combination with PBPK models and high throughput experimental or clinical data is crucial in the process of drug discovery nowadays. The molecular docking approach, in particular, enables predicting the detailed interaction pattern between a chemical compound and its protein target or protein and protein, thereby providing the kinetic parameters for the PBPK model. The impact of the parameter values on the PBPK modeling results may be evaluated via sensitivity analysis. However, the molecular docking approach might not be accurate, and more advanced binding free energy calculation methods should be applied [8,9].
One of the applications for PBPK models is the study of nanoparticle delivery to tumors. Cancer is a major public health problem with millions of new cases each year resulting in hundreds of thousands of deaths. In the past three decades, significant efforts have been focused on the improvement of the targeted delivery of new highly effective therapeutic agents for the growing tumor. The development of multifunctional nanoparticles that can passively penetrate into tumor tissues without affecting healthy ones provides the most promising approach to solving the issue [10]. Despite these supposed benefits, the introduction of nanoparticles into clinical practice is still limited due to the low efficiency of delivering the administered dose to the tumor (0.70% according to the meta-analysis) [11].
Studying the biodistribution and interaction of engineered nanoparticles with cancer cells, as well as evaluating the effectiveness of treatment using these nanoparticles, covers a wide range of experimental approaches. Current technologies provide the following experimental techniques:
  • a combination of 2D and 3D optical tomography for in vivo imaging.
  • methods of fluorescent and traditional histology, spectroscopy, flow cytometry, and electron microscopy.
  • methods for obtaining transcriptomic and proteomic data to assess the expression of receptors for various compounds (sugars, lipids, albumin, etc.).
A synthesis of the methods provides multiscale heterogeneous qualitative and quantitative data [12,13,14,15], the integration of which can be based on the use of physiologically-based pharmacokinetic models [16,17,18,19].
The application of PBPK models in cancer nanomedicine is only at a premature stage to date [17,20]. However, in recent years, a number of models have already been created to study the delivery of properties of various types of nanoparticles in tumor-bearing mice [11,21,22]. The advantages of such nanomedicine-oriented PBPK models are that [20]:
  • they allow studying the distribution of nanoformulations at the site of their action in the body.
  • they provide tools to better understand the microenvironment complexity, phenotypic diversity, and genetic heterogeneity of tumors.
  • they may prove useful in nanomedicine development to achieve optimum nanoformulation concentration profiles needed in tumor-targeted cells.
  • they could directly be exploited for specific cancer patient groups (e.g., pediatric population) to help solve issues of specific drug development and administration dosage scheme protocols.
In this study, we consider a generic PBPK model describing nanoparticle distribution in tumor-bearing mice [11]. This model characterizes endocytic uptake in the liver, lungs, spleen, kidneys, muscles, and other tissues of the mice. The biodistribution of nanoparticles in each compartment is also regulated by the ability to cross the capillary membrane of the organs [19]. As an additional compartment, this model contains cancer cells that are also capable to absorb and accumulate nanoparticles.
The authors of the study provided a model as the code for the Berkeley Madonna platform (https://berkeley-madonna.myshopify.com/ accessed on 1 April 2022), which is not intended for visualization of biochemical systems. Such a representation complicates the understanding and analysis of the model for experts in biomedicine, and also complicates its use and development for mathematical modelers.
Herein, we describe the consistent transformation of the model [11] to a modular view using the Biological Universal Modelling Language (BioUML) platform, an integrated web framework for systems biology that provides a wide range of capabilities, including access to biological databases and tools for visual modeling, simulation, parameters fitting and model analysis [23]. The procedure comprises the transition from a system of differential-algebraic equations to a chain of biochemical reactions and translation of the common compartmental structure into the form of separate modules. The visually modified version of the model reproduces the simulation results presented in the original study confirming the correct transformation of the model performed in BioUML.
We also point out that the visual modeling of PBPK is a novelty in the research field. Previously, text-based software packages such as acslX, Berkeley Madonna, MATLAB, and R language were mostly used to build this type of model [24]. While tools with visual modeling support simplify the interpretation, edition, and extension of PBPK models reducing the risk of technical errors. In addition, PBPK models reconstructed in BioUML are consistent with existing modeling standards and can be exported to the COMBINE archive [25].
The obtained results are methodological (platform) prerequisites to effectively develop new technologies for targeted and personalized delivery of nanotherapeutic agents in the treatment of cancer (for example, breast cancer and prostate cancer). The proposed modular model will be used to study the mechanisms of the substance transport in tumors and the delivery of drugs to them, taking into account the processes of nanoparticle biodistribution depending on their material, as well as the growth and metabolism of the tumor.

2. Structure of the Nanoparticle Delivery Model

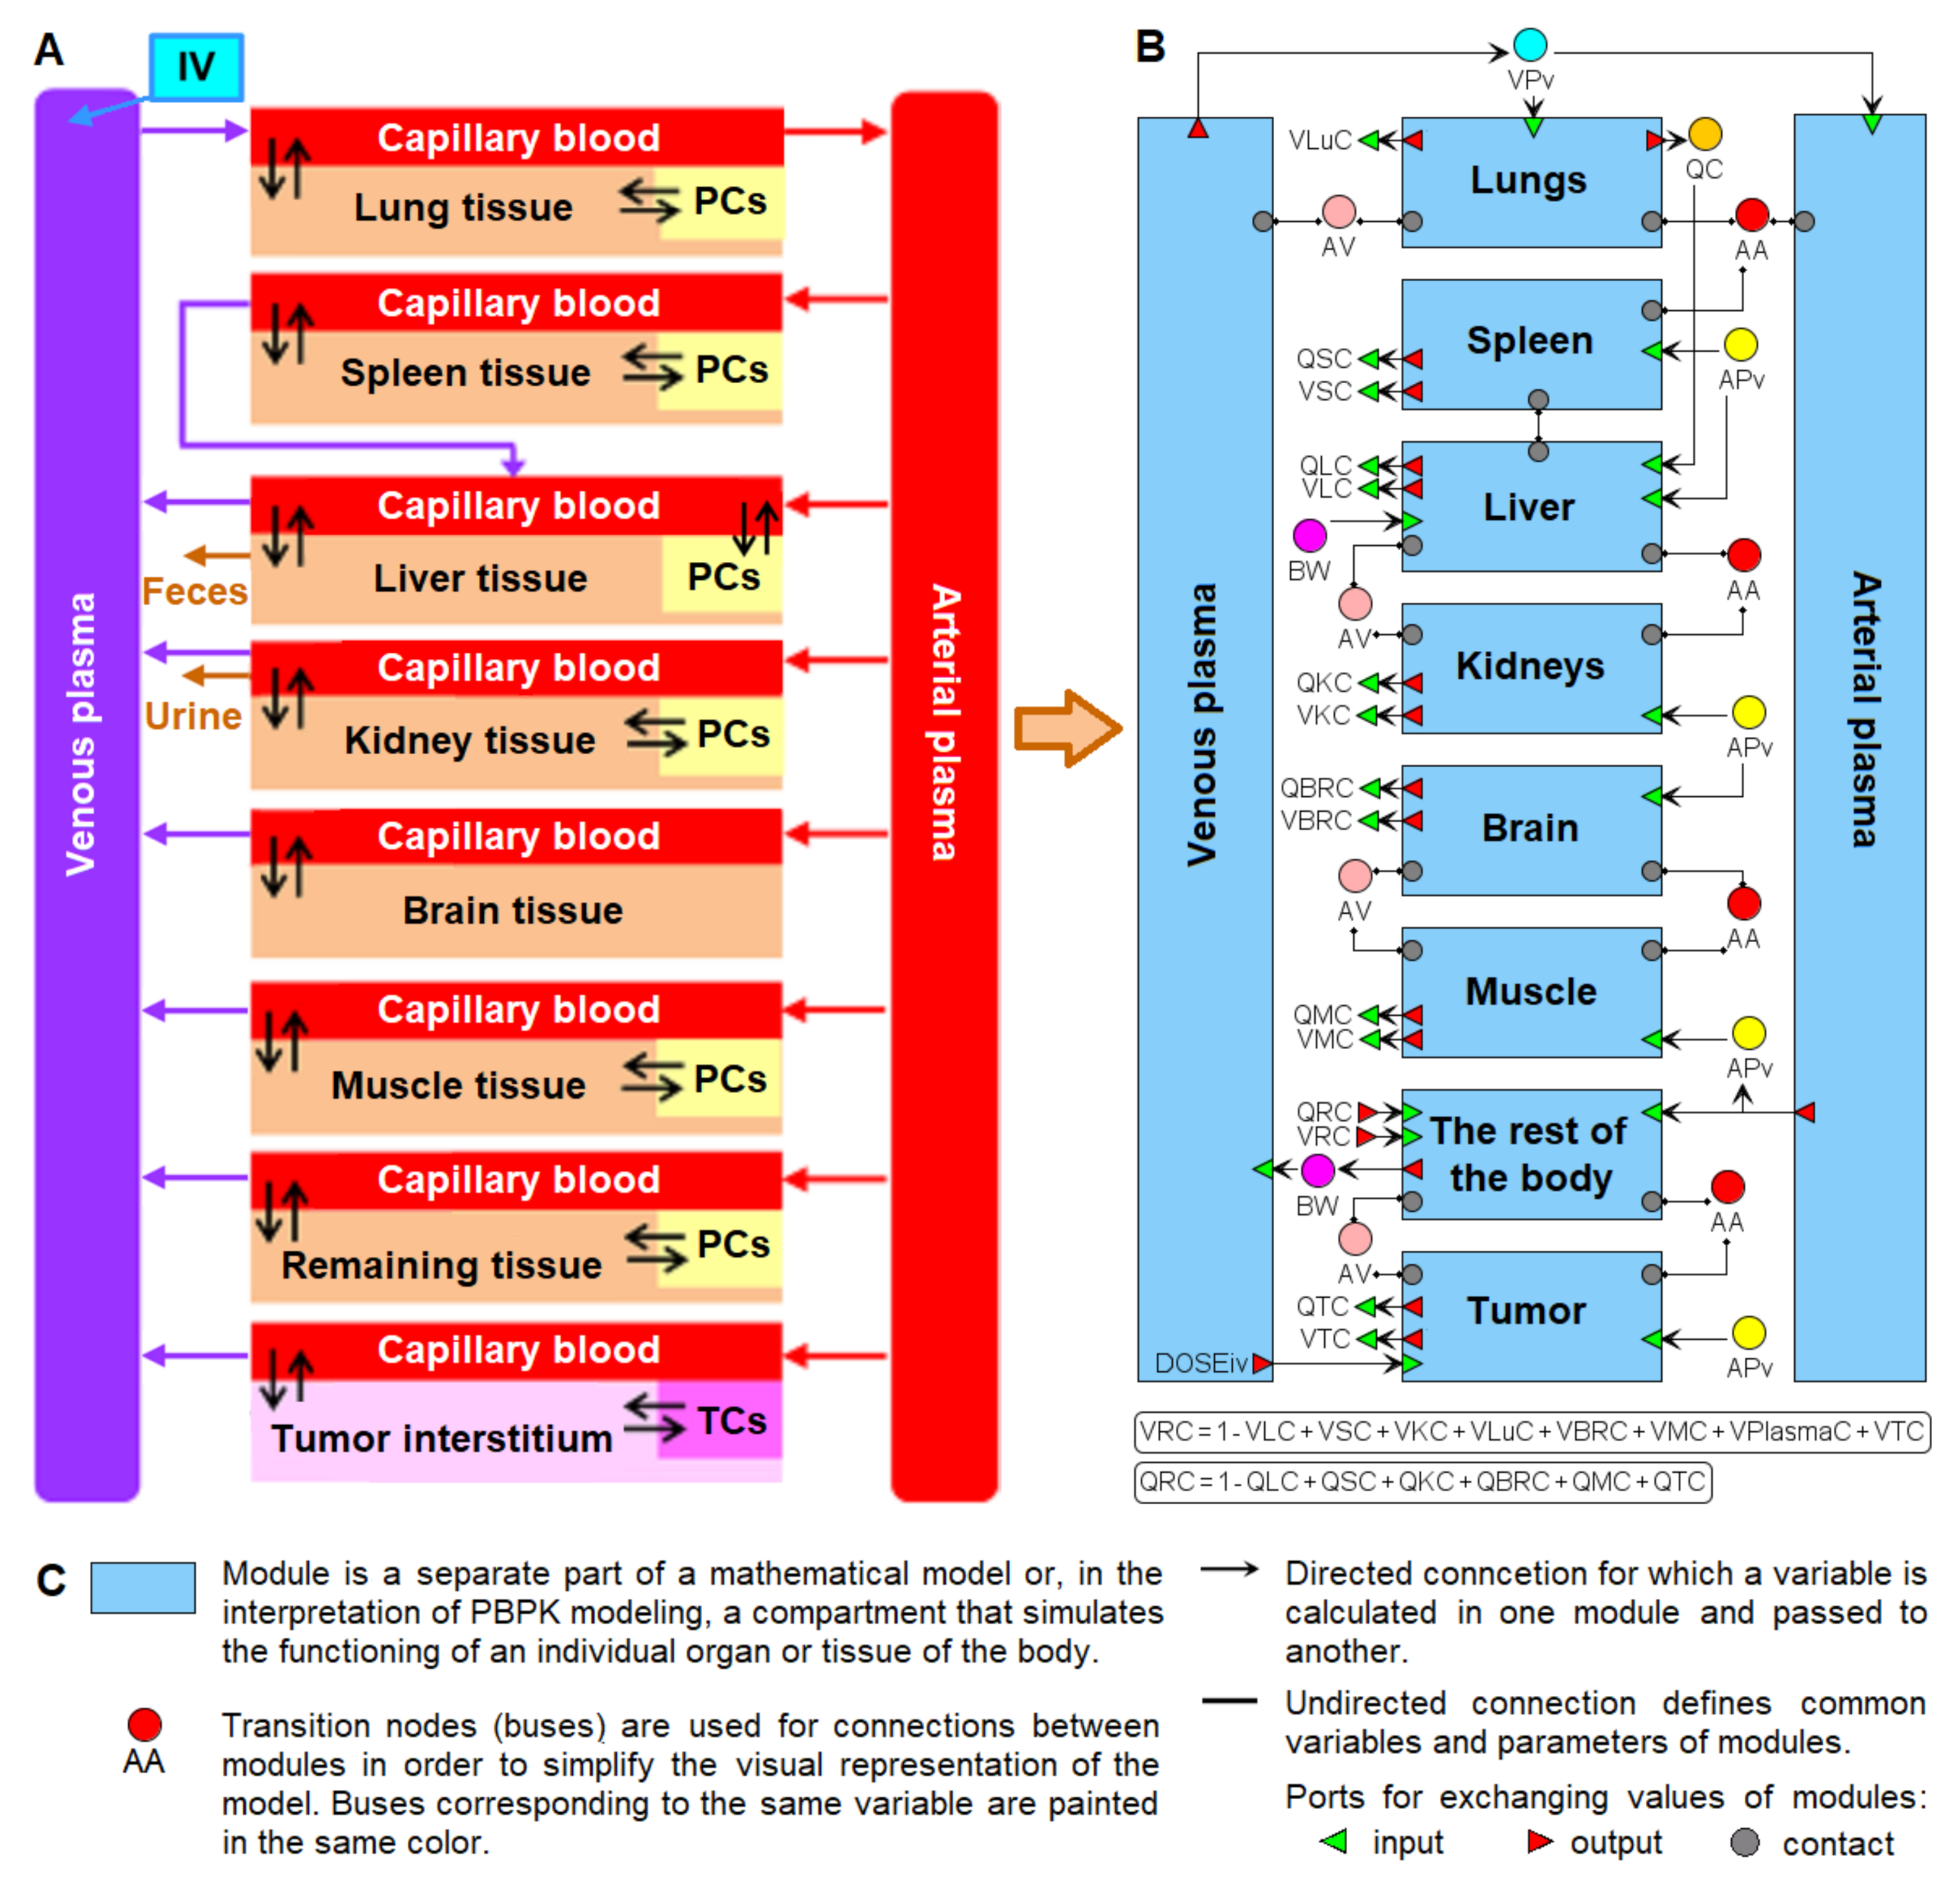
The model of nanoparticle delivery to solid tumors (Figure 1) [11] includes 10 compartments: arterial and venous plasma, lungs, spleen, liver, kidneys, brain, muscle, tumor, and remaining tissues. Besides plasma and brain, all compartments are divided into three subcompartments: capillary blood, tissue interstitium, and endocytic/phagocytic cells or tumor cells.
The diagram in Figure 1 demonstrates that after intravenous administration, nanoparticles enter the capillary blood of the lungs with the bloodstream then move to the arterial plasma and disperse to all other organs of the mice with excretion via both biliary and urinary pathways. The model takes into account the uneven distribution of injected nanoparticles between capillary blood and organ tissue, membrane-limited transcapillary transport, as well as nonlinear endocytic uptake, and first-order exocytic release.
The rate of intravenous administration of nanoparticles is calculated by the injection time (denoted by Timeiv), the injected dose (PDOSEiv), and the bodyweight (BW) according to the formula (all parameters in the current section have the same notation as in the original model, and are listed in Table 1 for convenience, including values and units):
v 0 = P D O S E i v · B W T i m e i v , if   t i m e < T i m e i v , 0 , otherwise .
Further distribution of nanoparticles over compartments is determined by the rate of blood flow and metabolic processes within them. Next, we consider the modeling of these processes using the lungs as an example.
One of the main parameters of the lung compartment is its volume VLu, calculated as a fraction VLuC = 0.007 of the weight:
VLu = BW · VLuC
It is assumed that the value of VLu is equally divided by the volume of capillary blood VLub and the volume of tissue interstitium VLut:
VLub = VLu · BVLu;      VLut = VLuVLub;     BVLu = 0.5.
Denoting the number of nanoparticles in these subcompartments by the parameters ALub and ALut, respectively, we obtain formulas for calculating the concentrations:
CVLu = ALub/VLub;     CLut = ALut/VLut.
Now let ALuRES be the amount of nanoparticles being taken up from the lung interstitium by phagocytosis. Then the total amount of nanoparticles in the lung compartment ALung is defined by the sum:
ALung = ALub + ALut + ALuRES.
Describe the reactions that affect the values ALub, ALut, and ALuRES. If CV is the concentration of nanoparticles in venous plasma and QC is cardiac output, then the rate of nanoparticle entry into the capillary blood of the lungs is determined by the product of these quantities (reaction r1 in Figure 2):
v 1 = Q C · C V
The next step in the distribution of nanoparticles is diffusion through the capillary wall into the tissue interstitium. This process depends on the membrane-limited permeability coefficient, PALuC (r2in, Figure 2):
v 2 i n = P A L u C · Q C · C V L u ,
while the rate of the reverse process is calculated by the formula (r2out, Figure 2):
v 2 o u t = P A L u C · Q C · C L u t P L u ,
where PLu is the tissue:plasma distribution coefficient of nanoparticles.
The endocytic/phagocytic uptake is described by the Hill function:
K L u R E S U P = K L u R E S m a x · t K L u R E S n K L u R E S 50 K L u R E S n + t K L u R E S n
with parameters KLuRESmax, KLuRES50, and KLuRESn, whereas the release from endocytic/phagocytic cells is determined by a constant coefficient KLuRESrelease. The rates of the corresponding reactions are given by the equations (r3in and r3out, Figure 2):
v 3 i n = K L u R E S U P · A L u t ,     v 3 o u t = K L u R E S r e l e a s e · A L u R E S .
The last reaction to consider is the outflow of nanoparticles from capillary blood into arterial plasma, which occurs at the rate (r4, Figure 2):
v 4 = Q C · C V L u .
Taking into account the rate equations above, we derive the system of ordinary differential equations representing nanoparticles distribution between subcompartments of the lungs:
d A L u b d t = v 1 v 2 i n + v 2 o u t v 4 ; d A L u t d t = v 2 i n v 2 o u t v 3 i n + v 3 o u t ; d A L u R E S d t = v 3 i n v 3 o u t
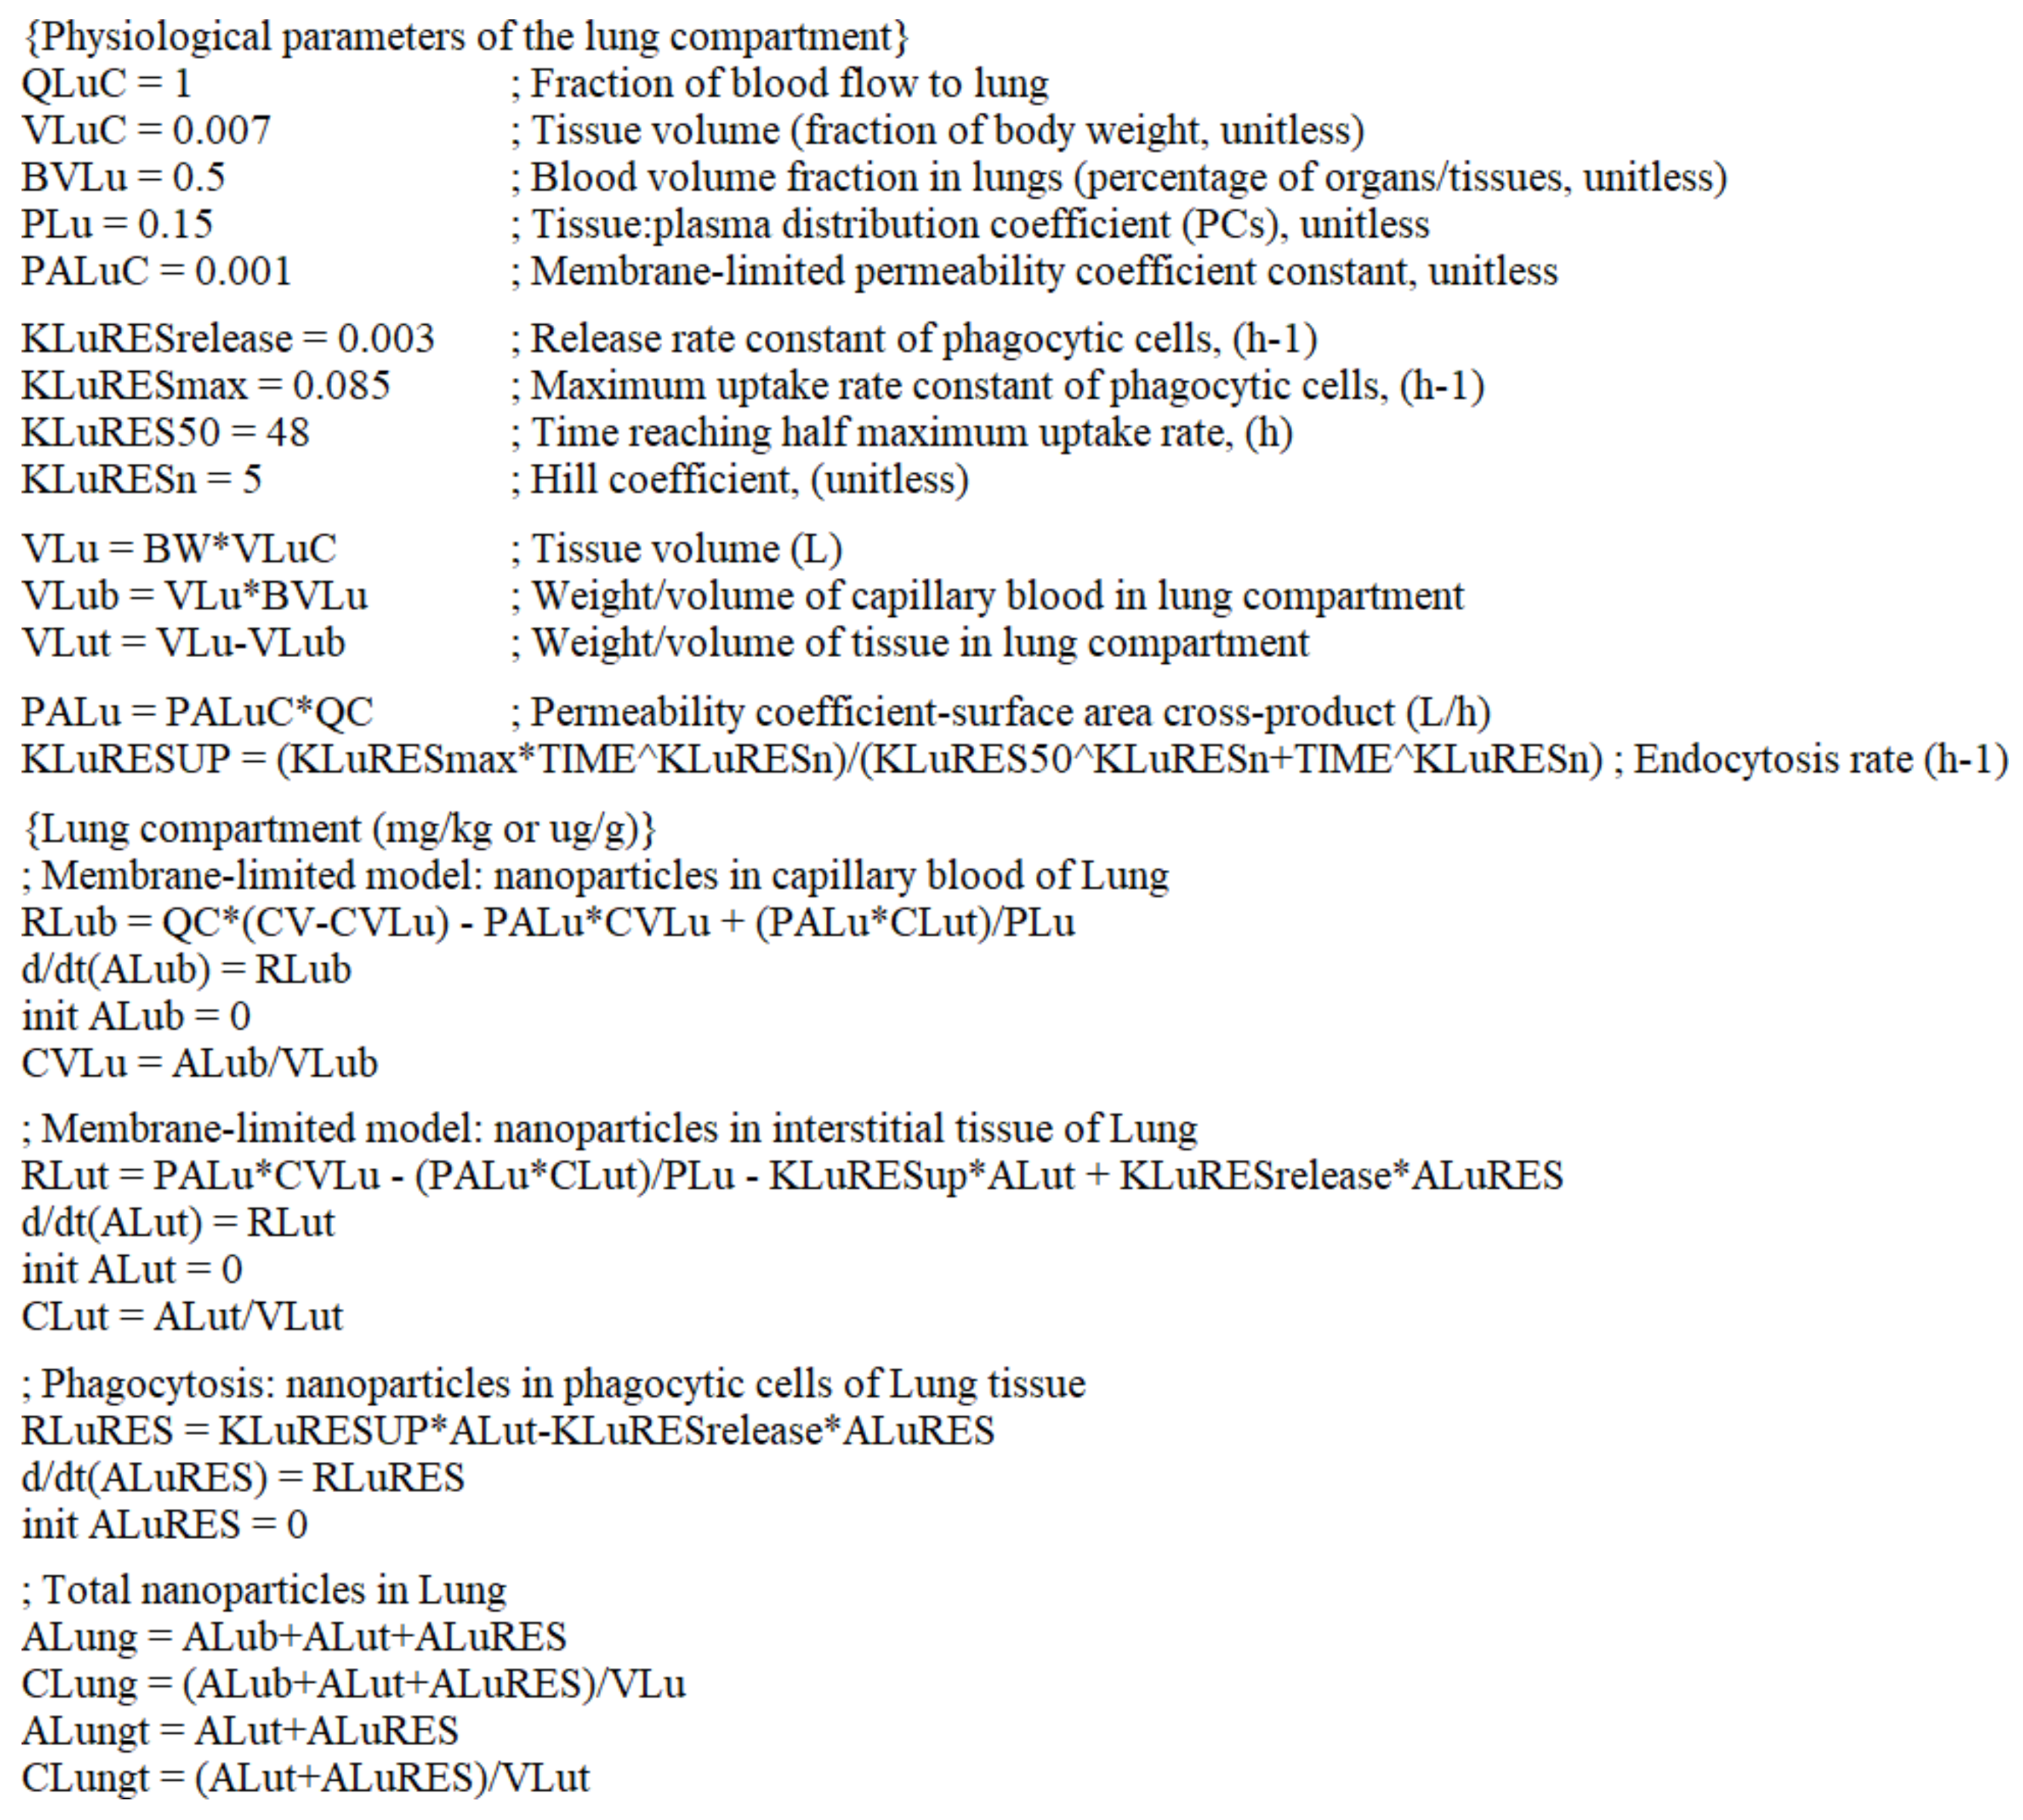
The implementation of these formulas in Berkeley Madonna, provided by the authors in the article [11], is shown in Figure 3.
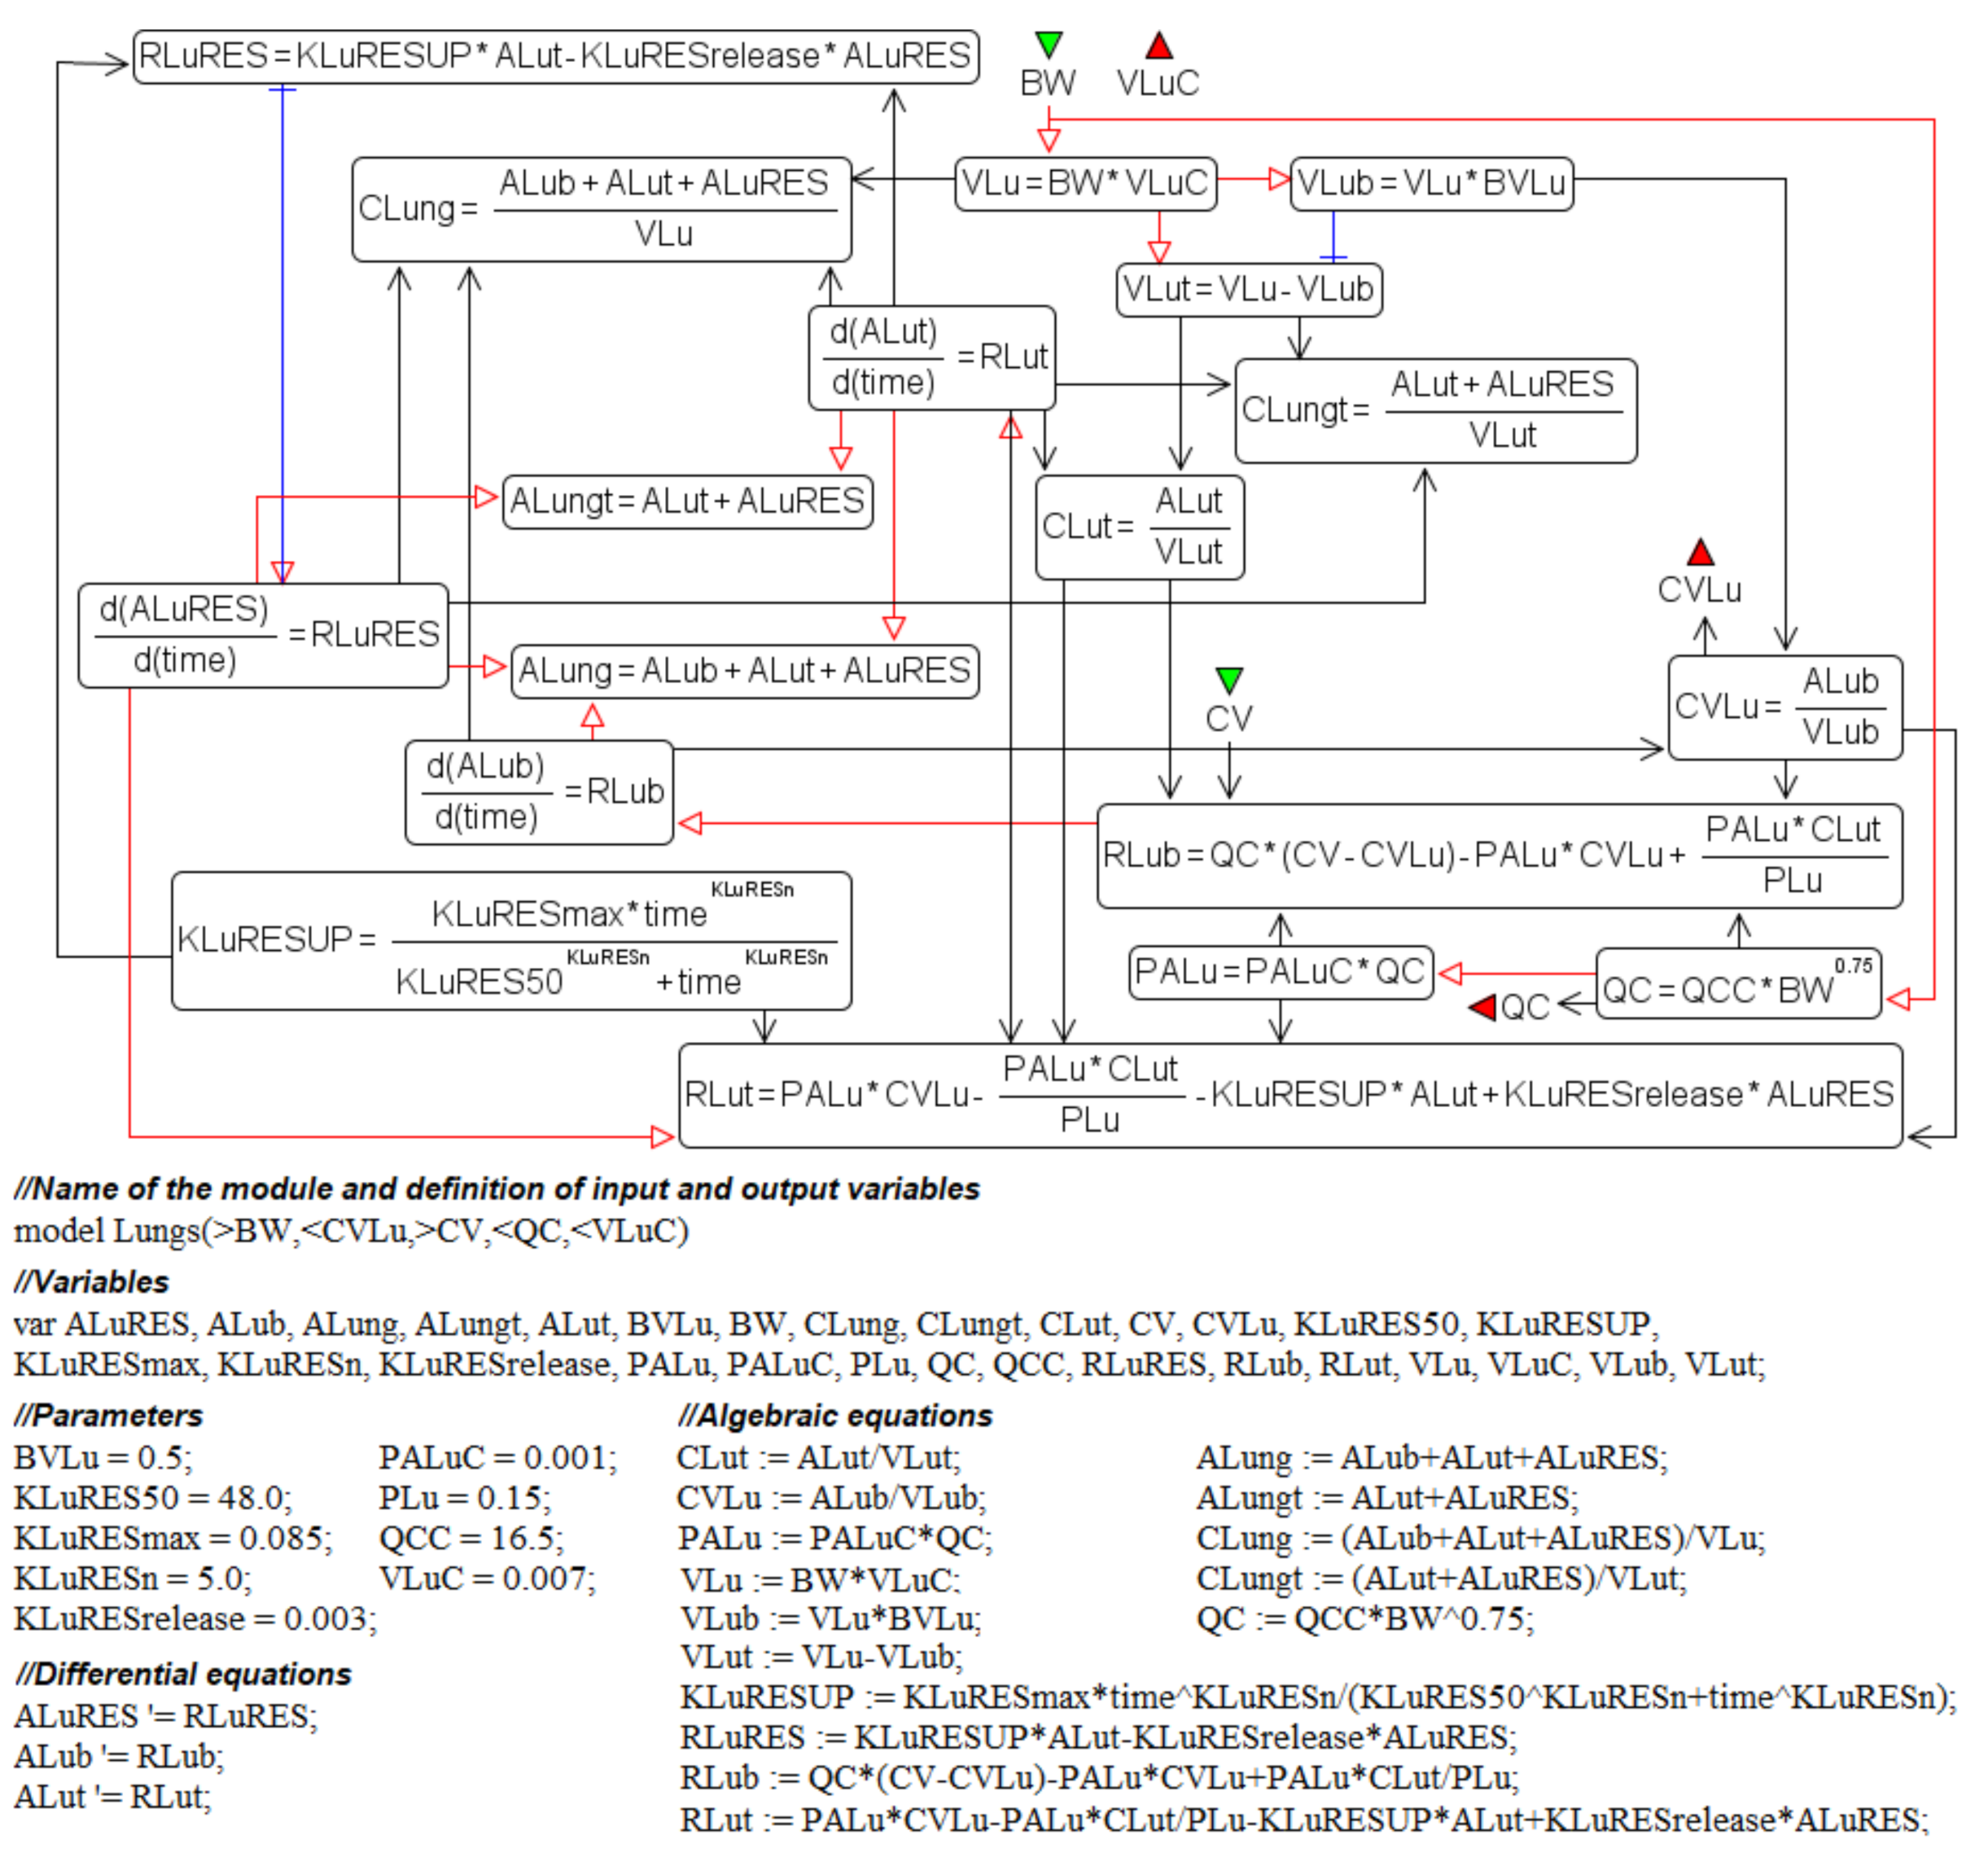
Despite the fact that this implementation contains comments describing parameters and expressions, it is difficult to understand the sense of the entire model. However, as follows from representation (6), the right side of the major equations provides a way to consider it as the sum of individual reaction rates. The representation makes the model view more explicit using the capabilities of the visual modeling in BioUML [23].
The next section includes a brief description of the methods that we used to convert the original model [11] to a modular form with a visual representation of the system of equations as a chain of biochemical reactions.

3. Methods of the Model Conversion

3.1. Visual Modeling

Representation of the biological system as a graphical diagram using a tool supporting visual modeling can significantly simplify the procedure of the mathematical model construction. According to the visual modeling paradigm, each component of the diagram corresponds to a certain mathematical object (variable, reaction, equation, etc.). A user can edit the properties of each element on the diagram: for instance, set initial values of the model variables or specify kinetic laws of enzymatic reactions. The BioUML platform (https://sirius-web.org/ accessed on 1 April 2022) [23] is based on the visual representation and certain properties of the diagram elements automatically generate a highly optimized Java code that is employed for numerical simulation of the model. Depending on the model type, BioUML provides a list of available simulation engines. For example, reaction pathways can be simulated as a system of ordinary differential equations (ODEs) or as a Gillespie-type stochastic model. Each simulation engine provides a list of suitable solvers, in particular, solvers for systems of ODEs include JVODE (a package CVODE ported from C to Java [26], which uses multistep Adams-Moulton method), RADAU5 solver [27], as well as classic algorithms (Euler, Dormand-Prince [28]).
An essential component of visual modeling is a graphical notation that enables formalizing and fully building the model of a biological process or phenomenon. The visual model can be reconstructed using several types of diagrams providing opportunities to describe different aspects of both structure and function of the complex biological systems considering diverse levels of their details.
As part of the visual modeling development in BioUML, an extension of the Systems Biology Graphical Notation (SBGN) standard [29] was suggested for comprehensive graphical representation of Systems Biology Markup Language (SBML) models [30] taking into account equations, discrete events, math functions, and constraints [31] (Table 2). There is also implementation to integrate table data into the model which may determine dynamics changes of variables. For example, a report of the treatment introduction and drug dose can be set as a table for pharmacokinetic models.

3.2. Modular Modeling

Modularity, as a principle of the complex biological systems organization [32], has served as a basis for the creation and intensive development of the modular approach to simulate such systems over the last two decades [33,34]. In the framework of this approach, a system is considered a set of interconnected subsystems (modules). Each module is a mathematical model and diverse numerical methods (simulation, parameter fitting, sensitivity analysis, etc.) can be independently applied to its analysis. Integration of these modules enables building a more complex modular model of the whole system. Modules may have different mathematical formalisms (discrete, deterministic, stochastic systems) in order to describe internal processes with different details’ extent of their mechanisms.
A special type of modular diagram has been suggested for their visual modeling in BioUML. This type enables specifying connections between modules. The subset of variables used for that is called the module interface and is represented by the corresponding ports [31] (Table 3):
  • input port–mathematical variable used in the module, but calculated outside;
  • output port–mathematical variable calculated in the module and may be used outside;
  • contact port–mathematical variable that can be modified both inside and outside the module.
Besides the ports listed above, modular diagrams also include all math elements and tabular data represented in Table 2.
Table 3. Designation of the model elements on modular diagrams in the BioUML. Adapted from https://doi.org/10.3390/ijms221910353 accessed on 1 April 2022.
Element NameGlyphDescription
Module Mathematics 10 01176 i007Module encapsulates the mathematical model (submodel) of a particular subsystem as an element of the hierarchical structure of the more complex model of the whole system.
Interface ports Mathematics 10 01176 i008Ports represent the interface of the module through which it can be connected with other modules or with the hierarchical model itself. The color of the port defines its type (the same as in Table 2).
Connection Mathematics 10 01176 i009Connections can be established between ports to aggregate modules with each other. Directed connections are established between output and input ports, while undirected connections are between contact ports.
Bus Mathematics 10 01176 i010Buses are auxiliary elements of the modular diagram that can be used as intermediate points in connections. They allow decreasing the number of intersections between connections and make the structure of the model clearer.

3.3. Antimony–Textual Representation of the Model

Antimony is a tool for numerical model construction as a convenient human-readable text format that supports most of the SBML features (Figure 4) [35].
An extension of the Antimony for specification of reaction components as well as for some other properties of SBGN diagrams has been implemented in the BioUML according to the next rule:
@ e n t i t y _ i d . p r o p e r t y = v a l u e
where entity_id–an identification of the particulate model element, property–property of the element, and value–value of the property.
The proposed extension is similar to the annotation principle in SBML format where SBML supporting software can store any auxiliary information in an XML file.
Currently, the BioUML supports the next structural properties for the annotation in text format:
  • sbgnType–defines the SBGN entity type (macromolecule, nucleic acid, simplex chemical or complex, unspecified);
  • sbgnViewTitle–defines additional properties of an SBGN entity (e.g., multimer). If an entity is complex, it also defines the inner elements. The Transpath database specification is used to denote entities and complexes in the BioUML (https://genexplain.com/wp-content/uploads/2017/04/TRANSPATH-Documentation_2012.2.pdf accessed on 1 April 2022). For instance:
    A:B–complex comprising two entities, A and B;
    A{p}–entity A in the phosphorylated state;
    (A)3–multimer A consisting of three subunits.
A precise representation of the model for a biological system as a graphical diagram considering extended functionality for SBGN notation or as a code using Antimony depends on the context and aim of the modeling. The BioUML platform supports both types of representation which are built in the platform and unambiguously correspond to each other meaning that a change in Antimony code leads to automatic modification of the diagram and vice versa.

4. Reconstruction of the Computational Modular Model

According to the modular approach [36], a biochemical system is considered a set of functioning interconnected subsystems. Such visualization adequately reflects the structure of biological objects at different levels of their organization from cell to organism [37,38]. PBPK models are usually parameterized taking into account the known physiology of the studied organisms [1]. The structure of the models is divided into compartments (organs and tissues in the body) connected by the circulating blood system and, therefore, can be easily represented using modular mathematical formalism. In this case, the modeling of individual compartments is based on the same differential-algebraic equations, with different values of the parameters. Therefore, a logical step is isolating the common equations as a separate module that receives input values specific to each compartment. To avoid errors in the reconstruction of the model [11] and obtain identical simulation results, we performed the model transformation in several steps:
  • transition to a modular structure.
  • transition from a system of differential-algebraic equations to a chain of biochemical reactions.
  • finding the common structure of compartments as a separate module
Below we describe the transformation procedure step-by-step in more detail.

4.1. Transition to a Modular Structure

To import the model [11] into BioUML, we used the Antimony language [35], supported by the platform and intended for textual definition of biochemical systems. The Antimony and Berkeley Madonna functions have a similar syntax, which, for example, is demonstrated by the formulas for intravenous administration of nanoparticles in Figure 5.
Translation of the model code into the Antimony language, divided into several parts corresponding to individual compartments, gave us a set of computational submodels, each of which was used as a separate module. Since BioUML supports Antimony integration with a diagram view of models, these submodels were automatically converted into visual diagrams (Figure 6). The intermediate version of the modular model, which we obtained by connecting the common variables of the modules, is similar to the final version (Figure 7B), except that the nanoparticle dosing formulas (Figure 5), initially placed into a separate module, were subsequently included into the module “Venous plasma” to fully comply with the scheme in Figure 1. Since this intermediate version is not essential, we omit its visualization in the current article and suggest referring to the web implementation of the model for details: https://sirius-web.org/bioumlweb/#de=data/Collaboration%20(git)/Nanoparticles/Diagrams/02/PBPK%20model accessed on 1 April 2022.

4.2. Transition from a System of Differential-Algebraic Equations to a Chain of Biochemical Reactions

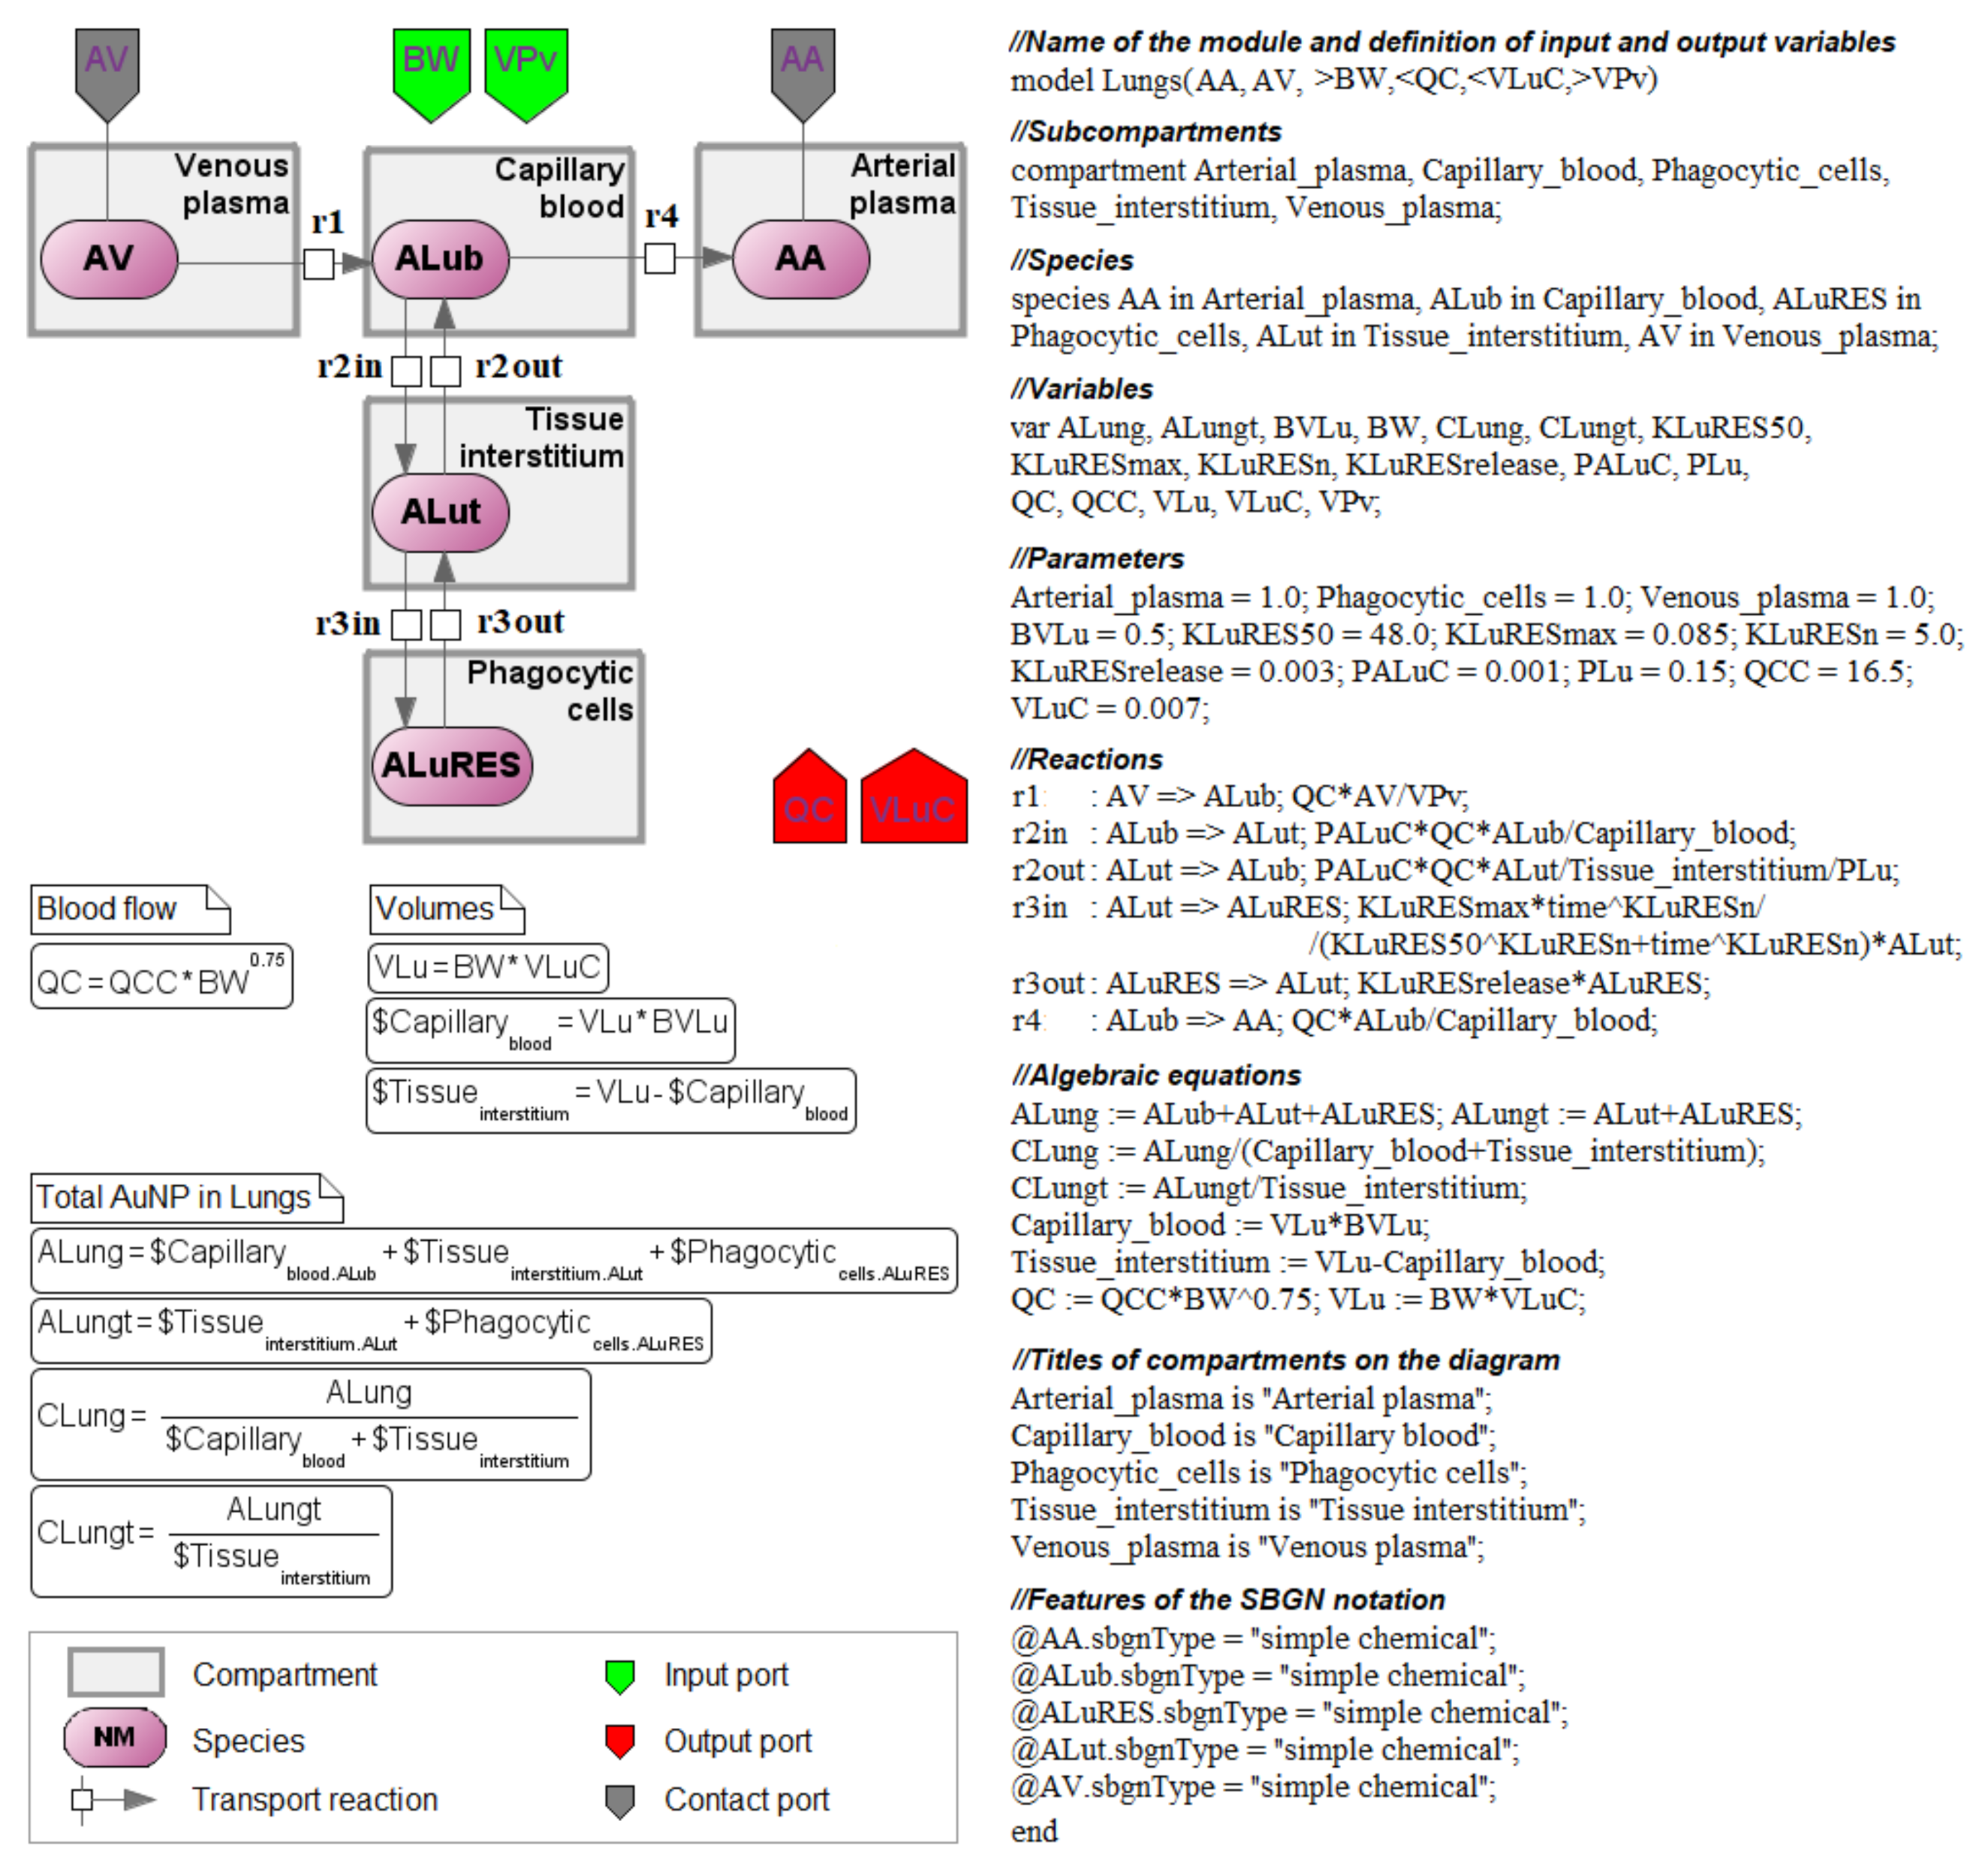
As mentioned above, the change in the amount of nanoparticles in different compartments and subcompartments of the model is based on the summation of local rates of their distribution. The system of Equation (6) with the amount of nanoparticles in venous (AV) and arterial (AA) plasma can be defined as a chain of reactions with the rates v 1 , v 2 i n , v 2 o u t , v 3 i n , v 3 o u t , and v 4 (1)–(5):
A V r 1 A L u b ;           A L u b r 2 i n ,       r 2 o u t A L u t r 3 i n ,       r 3 o u t A L u R E S ;           A L u b r 4 A A .
In such formulation, biochemical processes can be specified in the SBML format [30], as well as visualized using the graphical notation SBGN [29] (Figure 8).
A computational model with such an organization of modules can be found at: https://sirius-web.org/bioumlweb/#de=data/Collaboration%20(git)/Nanoparticles/Diagrams/03/PBPK%20model accessed on 1 April 2022.
Note that due to the change in the module’s structure, the general scheme of the entire model was also changed. While in the first version of the model, the concentrations of nanoparticles in arterial and venous plasma were transferred through directed connections, in the second version, these connections are undirected and correspond to the amount of nanoparticles in the plasma with the parallel transfer of plasma volumes to calculate concentrations directly in the compartments.

4.3. Finding the Common Structure of Compartments as a Separate Module

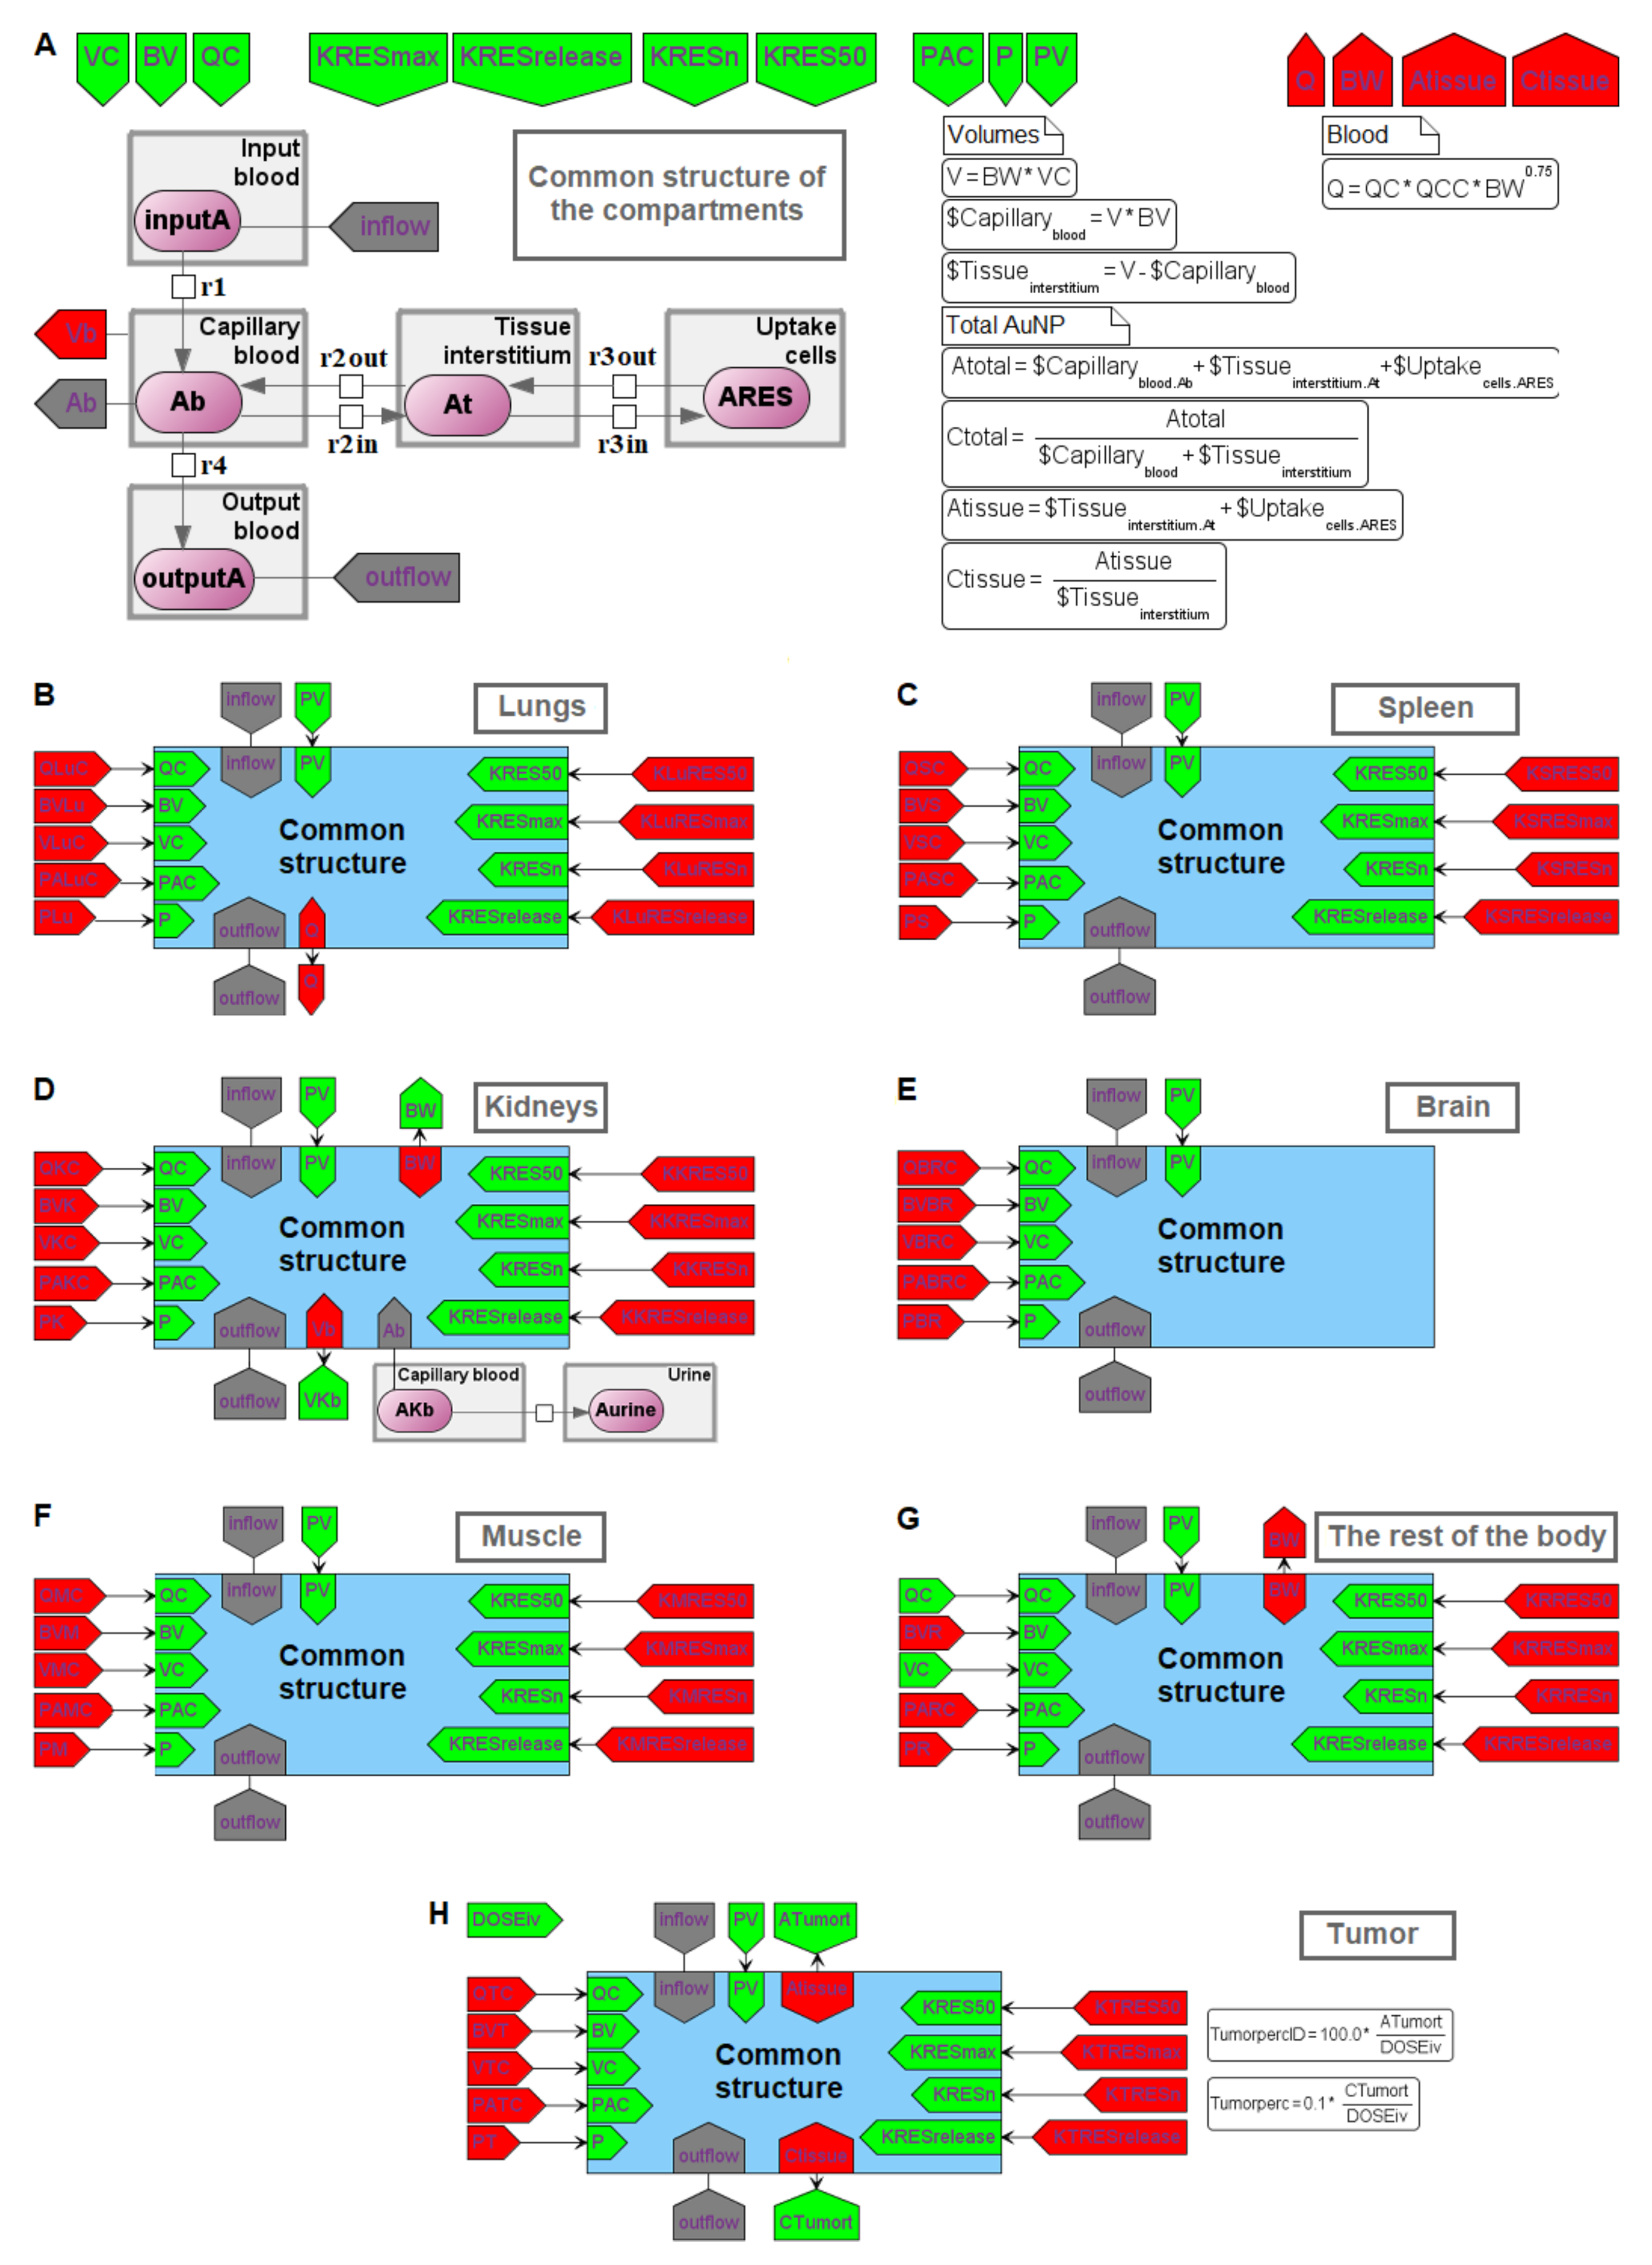
The formulas of membrane-limited transcapillary transport, endocytic uptake, and exocytic release of nanoparticles in different compartments have the same form (2)–(4), but different values of the kinetic constants. The distribution of nanoparticles between capillary blood, tissue interstitium, and endocytic/phagocytic (or tumor) cells for most compartments occurs according to the same scheme as for the lungs (Figure 8), with a difference in the incoming (arterial instead of venous) blood flow. Therefore, extracting the reactions of nanoparticle transport between subcompartments into a separate module (Figure 9A) and defining input ports for specific parameters and variables in this module results in a common structure module that can be used to model individual compartments. Using this structure, we designed the lungs, spleen, kidneys, brain, muscle, tumor, and the compartment responsible for the rest of the body (Figure 9B–H). This step resulted in the following differences:
  • inflow and outflow for the lungs are determined by the amount of nanoparticles in the venous and arterial plasma, respectively, while for the remaining compartments, these flows are determined vice versa;
  • to convert the amount of nanoparticles in plasma into their concentration and calculate rates of the form (1), we pass the value of plasma volume PV to the compartments of the model: we consider venous plasma volume VPv (Figure 7B) for the lungs and arterial plasma volume APv for other compartments;
  • input ports on the left and right side of the common structure module shown in Figure 9B–H correspond to the individual compartment constants (with the same notations as in Table 1 for the lungs); since in the model [11] the brain compartment does not contain the subcompartment of endocytic/phagocytic cells, the parameters associated with it are not transferred and their default values remain zero
  • in addition to the common equations, the kidney compartment includes the reaction of nanoparticles excretion through the urinary tract (Figure 9D), proceeding at a rate:
v u = K u r i n e C · B W 0.75 · A K b V K b ,
where AKb, VKb, and BW denote parameters, the values of which come from the common structure module and determine the amount of nanoparticles in the capillary blood of the kidneys, the volume of capillary blood, and bodyweight, respectively. KurineC is the rate constant of nanoparticles excretion through the urinary tract.
  • the tumor compartment contains formulas for calculating the amount (ATumort) and concentration (CTumort) of nanoparticles in the tissue as a percentage of the administered dose (DOSEiv):
T u m o r p e r c I D = 100 · A T u m o r t D O S E i v
T u m o r p e r c = 100 · 0.001 · C T u m o r t D O S E i v
where 0.001 is the coefficient for converting tissue volume units from liters to grams.
  • to use the cardiac output (equal to the blood flow in the lungs) and bodyweight outside the compartments shown in Figure 9, we provided for the transfer of these values from the common structure module, where they are determined, to the top level of the model (see modular representation in Figure 7B) via the lung compartment (Figure 9B, port Q at the bottom of the compartment) and the rest of the body compartment (Figure 9G, port BW at the top of the compartment), respectively.
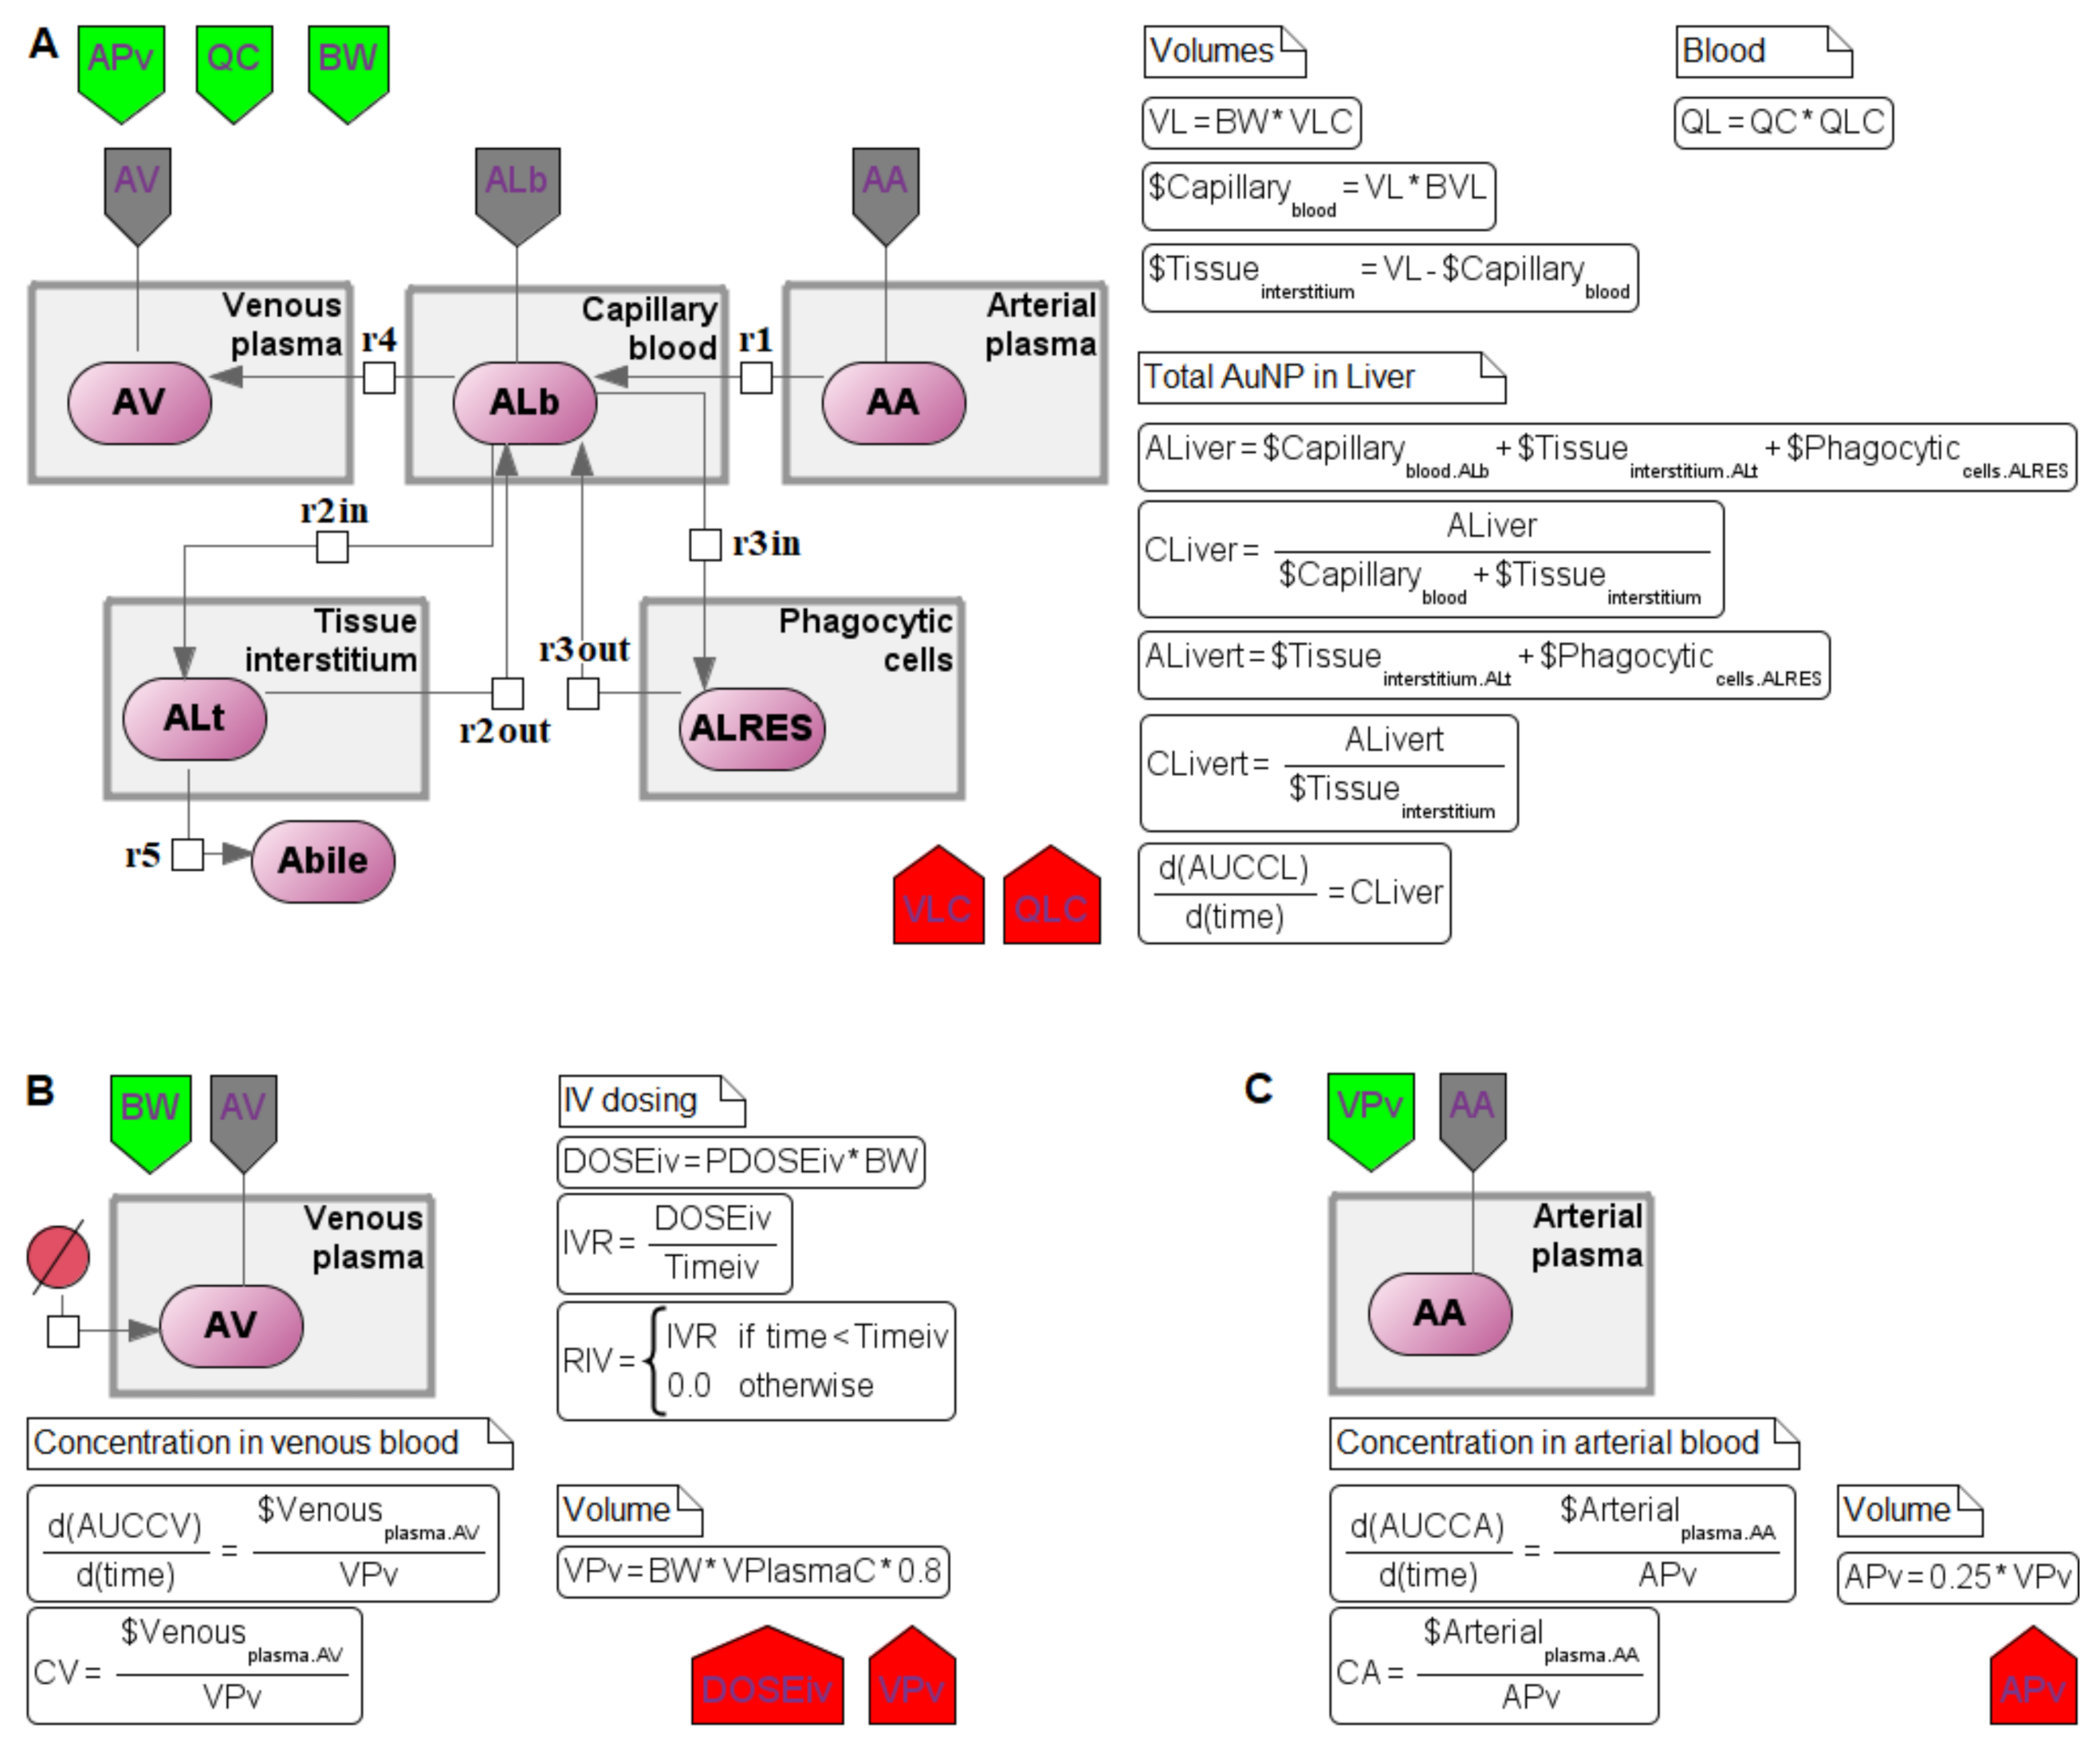
Only the liver cannot be expressed through the common system of reactions. The difference with other compartments is that this organ contains Kupffer cells, which are able to phagocytize nanoparticles directly from the capillary blood [11]. The sequence of reactions, in this case, is shown in Figure 10A. In addition to the processes r1, r2in, r2out, r3in, r3out, and r4 with equations similar to (1)–(5), this sequence includes the excretion of nanoparticles with bile (r5):
v b = K b i l e C · B W 0.75 · A L t V L t ,
where ALt is the amount of nanoparticles in the liver tissue, VLt is the tissue volume, BW is the body weight, and KbileC is the rate constant of nanoparticles excretion with bile.
To complete the description of the model, we should note the modules of venous and arterial plasma, which are presented in Figure 10B,C, respectively. The final version of the modular computational model is available at: https://sirius-web.org/bioumlweb/#de=data/Collaboration%20(git)/Nanoparticles/Diagrams/04/PBPK%20model accessed on 1 April 2022.

5. Testing the Model after the Modification

We benchmarked the modular version of the model using the next test cases: the case of the healthy mice in which the tumor compartment is omitted, and the case of tumor-bearing mice with the parameters of the tumor compartment given in Table 4. The model dynamics in the first case were calibrated by the authors using the biodistribution data for venous plasma, lungs, liver, spleen, and kidneys in healthy mice intravenously injected with 13 nm gold (Au) nanoparticles (AuNPs) [39]. In the second case, the parameters of the tumor compartment were originally identified using experimental data on tumor suppression in mice by photoacoustic treatment with gold nanorods (AuNRs) of 9–11 nm in diameter [40].
Figure 11 demonstrates an exact quantitative agreement between the simulation results of the original model [11] and the final modular model in both cases. As was observed in the original study by Cheng and coauthors, the model simulations show a gradual decrease in the concentrations of AuNPs in the venous plasma, lungs, and kidneys as they accumulate in the liver and spleen of healthy mice over 168 h after administration. The dynamics of AuNRs in tumor-bearing mice are similar, with the difference that the concentrations of AuNRs in all organs are higher (due to the higher injected dose: 20 versus 0.85 mg/kg), while accumulation of AuNRs also occurs in the tumor tissue, thereby successfully reproducing the experimental dataset [40] for AuNRs biodistribution for up to 7 days after the administration. This in silico result confirms that nanoparticles can effectively target cancer cells and increase their accumulation in tumors. An interactive reproduction of these results in a Jupyter document (https://jupyter.org/ accessed on 1 April 2022.) is available at: https://gitlab.sirius-web.org/nanoparticles/models accessed on 1 April 2022.

6. Conclusions

Herein, we describe in detail the sequential transformation of a physiologically based pharmacokinetic model of nanoparticles in mice with solid tumors to a modular computational form. The scheme of the original model included 10 compartments: arterial and venous plasma, lungs, spleen, liver, kidneys, brain, muscle, tumor, and remaining tissues. Therefore, the first logical step in the transformation was the definition of a separate computational module for each compartment and the indication of connections between modules in accordance with the movement of blood between organs and tissues of the body. All compartments in the original model, except plasma and brain, were initially divided into three subcompartments: capillary blood, tissue interstitium, and endocytic/phagocytic (or tumor) cells. The second step of the transformation was the transition from an explicit system of differential-algebraic equations to a chain of biochemical reactions and visualization of the resulting version of the model using the capabilities of the BioUML software. Finally, the nanoparticle transport equations in the original model had the same form for different organs, but a unique set of kinetic constants. Thus, the third step of the transformation was the allocation of the common structure of compartments into a separate module. Model versions obtained at each step reproduce the original simulation results and are available as SBML or COMBINE archive files in the web edition of BioUML (https://sirius-web.org/ accessed on 1 April 2022).
In summary, the present article focuses on the visual implementation of computational PBPK models using the BioUML software. We demonstrate that BioUML allows us to recode the published text-based model on the fly and simplify its representation for non-expert users based on the supported visual modeling and modular approach. This transformation of PBPK models actually enhances the ability of their application [24]. In this regard, we propose some thoughts to consider:
  • To share biological models (in particular, PBPK), it is important to make them available. The use of well-known biological standards is essential in this context. A translation of PBPK models from text-based formats (like acslX, Berkeley Madonna, MATLAB, and R language) to SBML and SBGN standards, which BioUML allows, makes these models accessible to a wide range of scientists and provides a quick start to work with them. Therefore, the presented description can be used as a guideline for the procedure.
  • Visual modeling serves as a convenient tool for exploring in silico models. This technique reduces the risk of technical errors during the model creation, use, and further development. In addition, the computational model in BioUML has the same view as the technical diagram of the model, which the developer can draw on paper to visualize the PBPK processes. This possibility is very useful for both beginners to learn PBPK modeling techniques and advanced developers. We believe that visual modeling is the future.
  • In this article, we not only demonstrate the BioUML capabilities for the PBPK modeling, but also transform the model of nanoparticle delivery to solid tumors in mice. In this respect, we consider the next possible roadmap for future research on this model:
    • model simulations and analysis depending on the initial concentration of the administered nanoparticles dose.
    • study the mechanisms of therapeutic nanoparticles transport taking into account their material and biodistribution depending on the tumor growth and metabolism.
This study was conducted as part of a project to develop new technologies for targeted and personalized delivery of nanotherapeutic agents in the treatment of cancer (https://rscf.ru/en/project/21-75-30020/ accessed on 1 April 2022).

Author Contributions

Investigation, E.K. and I.A.; methodology, E.K., I.A. and F.K.; software, I.K. and F.K.; formal analysis, R.S.; writing–original draft, E.K. and I.A.; writing–review & editing, E.K., I.A., I.K., R.S. and F.K.; project administration, F.K.; funding acquisition, F.K. All authors have read and agreed to the published version of the manuscript.

Funding

This research was funded by the Russian Science Foundation (project 21-75-30020).

Institutional Review Board Statement

Not applicable.

Informed Consent Statement

Not applicable.

Data Availability Statement

The data are available on Gitlab at https://gitlab.sirius-web.org/nanoparticles/models/ accessed on 1 April 2022.

Conflicts of Interest

The authors declare no conflict of interest.

References

  1. Jones, H.; Rowland-Yeo, K. Basic concepts in physiologically based pharmacokinetic modeling in drug discovery and development. CPT Pharmacomet. Syst. Pharmacol. 2013, 2, e63. [Google Scholar] [CrossRef]
  2. Buil-Bruna, N.; López-Picazo, J.M.; Martín-Algarra, S.; Trocóniz, I.F. Bringing Model-Based Prediction to Oncology Clinical Practice: A Review of Pharmacometrics Principles and Applications. Oncologist 2016, 21, 220–232. [Google Scholar] [CrossRef] [PubMed] [Green Version]
  3. Riviere, J.E. Basic principles and techniques of pharmacokinetic modeling. J. Zoo Wildl. Med. 1997, 28, 3–19. [Google Scholar] [PubMed]
  4. Sung, J.H.; Srinivasan, B.; Esch, M.B.; McLamb, W.T.; Bernabini, C.; Shuler, M.L.; Hickman, J.J. Using physiologically-based pharmacokinetic-guided “body-on-a-chip” systems to predict mammalian response to drug and chemical exposure. Exp. Biol. Med. 2014, 239, 1225–1239. [Google Scholar] [CrossRef] [PubMed] [Green Version]
  5. Bachler, G.; von Goetz, N.; Hungerbuhler, K. Using physiologically based pharmacokinetic (PBPK) modeling for dietary risk assessment of titanium dioxide (TiO2) nanoparticles. Nanotoxicology 2015, 9, 373–380. [Google Scholar] [CrossRef] [PubMed]
  6. Dogra, P.; Butner, J.D.; Ramírez, J.R.; Chuang, Y.L.; Noureddine, A.; Brinker, C.J.; Cristini, V.; Wang, Z. A mathematical model to predict nanomedicine pharmacokinetics and tumor delivery. Comput. Struct. Biotechnol. J. 2020, 18, 518–531. [Google Scholar] [CrossRef] [PubMed]
  7. Hall, C.; Lueshen, E.; Mošat’, A.; Linninger, A.A. Interspecies scaling in pharmacokinetics: A novel whole-body physiologically based modeling framework to discover drug biodistribution mechanisms in vivo. J. Pharm. Sci. 2012, 101, 1221–1241. [Google Scholar] [CrossRef] [PubMed]
  8. Ji, B.; Xue, Y.; Xu, Y.; Liu, S.; Gough, A.H.; Xie, X.Q.; Wang, J. Drug-Drug Interaction Between Oxycodone and Diazepam by a Combined in Silico Pharmacokinetic and Pharmacodynamic Modeling Approach. ACS Chem. Neurosci. 2021, 12, 1777–1790. [Google Scholar] [CrossRef]
  9. Razak, S.; Afsar, T.; Bibi, N.; Abulmeaty, M.; Qamar, W.; Almajwal, A.; Inam, A.; Al Disi, D.; Shabbir, M.; Bhat, M.A. Molecular docking, pharmacokinetic studies, and in vivo pharmacological study of indole derivative 2-(5-methoxy-2-methyl-1H-indole-3-yl)-N’-[(E)-(3-nitrophenyl) methylidene] acetohydrazide as a promising chemoprotective agent against cisplatin induced organ damage. Sci. Rep. 2021, 11, 6245. [Google Scholar] [CrossRef]
  10. Datta, N.R.; Krishnan, S.; Speiser, D.E.; Neufeld, E.; Kuster, N.; Bodis, S.; Hofmann, H. Magnetic nanoparticle-induced hyperthermia with appropriate payloads: Paul Ehrlich’s “magic (nano)bullet” for cancer theranostics? Cancer Treat. Rev. 2016, 50, 217–227. [Google Scholar] [CrossRef]
  11. Cheng, Y.H.; He, C.; Riviere, J.E.; Monteiro-Riviere, N.A.; Lin, Z. Meta-analysis of nanoparticle delivery to tumors using a physiologically based pharmacokinetic modeling and simulation approach. ACS Nano 2020, 14, 3075–3095. [Google Scholar] [CrossRef] [Green Version]
  12. Demina, P.A.; Sholina, N.V.; Akasov, R.A.; Khochenkov, D.A.; Arkharova, N.A.; Nechaev, A.V.; Khaydukov, E.V.; Generalova, A.N. A versatile platform for bioimaging based on colominic acid-decorated upconversion nanoparticles. Biomater. Sci. 2020, 8, 4570–4580. [Google Scholar] [CrossRef]
  13. Rocheva, V.; Savelyev, A.; Nechaev, A.; Generalova, A.; Semchishen, V.; Zvyagin, A.; Khaydukov, E. Three-dimensional luminescence tomographic visualization of biological tissues. Opt. Spectrosc. 2019, 126, 92–94. [Google Scholar] [CrossRef]
  14. Rudzińska, M.; Parodi, A.; Maslova, V.D.; Efremov, Y.M.; Gorokhovets, N.V.; Makarov, V.A.; Popkov, V.A.; Golovin, A.V.; Zernii, E.Y.; Zamyatnin, A.A. Cysteine cathepsins inhibition affects their expression and human renal cancer cell phenotype. Cancers 2020, 12, 1310. [Google Scholar] [CrossRef]
  15. Sevencan, C.; McCoy, R.S.A.; Ravisankar, P.; Liu, M.; Govindarajan, S.; Zhu, J.; Bay, B.H.; Leong, D.T. Cell membrane nanotherapeutics: From synthesis to applications emerging tools for personalized cancer therapy. Adv. Ther. 2020, 3, 1900201. [Google Scholar] [CrossRef]
  16. Li, M.; Al-Jamal, K.T.; Kostarelos, K.; Reineke, J. Physiologically based pharmacokinetic modeling of nanoparticles. ACS Nano 2010, 4, 6303–6317. [Google Scholar] [CrossRef]
  17. Dogra, P.; Butner, J.D.; Chuang, Y.L.; Caserta, S.; Goel, S.; Brinker, C.J.; Cristini, V.; Wang, Z. Mathematical modeling in cancer nanomedicine: A review. Biomed. Microdevices 2019, 21, 40. [Google Scholar] [CrossRef] [Green Version]
  18. Hassanzadeh, P.; Atyabi, F.; Dinarvand, R. Ignoring the modeling approaches: Towards the shadowy paths in nanomedicine. J. Control. Release 2018, 280, 58–75. [Google Scholar] [CrossRef]
  19. Lin, Z.; Monteiro-Riviere, N.A.; Riviere, J.E. A physiologically based pharmacokinetic model for polyethylene glycol-coated gold nanoparticles of different sizes in adult mice. Nanotoxicology 2016, 10, 162–172. [Google Scholar] [CrossRef]
  20. Vizirianakis, I.S.; Mystridis, G.A.; Avgoustakis, K.; Fatouros, D.G.; Spanakis, M. Enabling personalized cancer medicine decisions: The challenging pharmacological approach of PBPK models for nanomedicine and pharmacogenomics (Review). Oncol. Rep. 2016, 35, 1891–1904. [Google Scholar] [CrossRef] [Green Version]
  21. Opitz, A.W.; Wickstrom, E.; Thakur, M.L.; Wagner, N.J. Physiologically based pharmacokinetics of molecular imaging nanoparticles for mRNA detection determined in tumor-bearing mice. Oligonucleotides 2010, 20, 117–125. [Google Scholar] [CrossRef] [PubMed]
  22. Shalgunov, V.; Zaytseva-Zotova, D.; Zintchenko, A.; Levada, T.; Shilov, Y.; Andreyev, D.; Dzhumashev, D.; Metelkin, E.; Urusova, A.; Demin, O.; et al. Comprehensive study of the drug delivery properties of poly(l-lactide)-poly(ethylene glycol) nanoparticles in rats and tumor-bearing mice. J. Control. Release 2017, 261, 31–42. [Google Scholar] [CrossRef] [PubMed]
  23. Kolpakov, F.; Akberdin, I.; Kashapov, T.; Kiselev, I.; Kolmykov, S.; Kondrakhin, Y.; Kutumova, E.; Mandrik, N.; Pintus, S.; Ryabova, A.; et al. BioUML: An integrated environment for systems biology and collaborative analysis of biomedical data. Nucleic Acids Res. 2019, 47, W225–W233. [Google Scholar] [CrossRef] [PubMed]
  24. Lin, Z.; Jaberi-Douraki, M.; He, C.; Jin, S.; Yang, R.S.H.; Fisher, J.W.; Riviere, J.E. Performance Assessment and Translation of Physiologically Based Pharmacokinetic Models From acslX to Berkeley Madonna, MATLAB, and R Language: Oxytetracycline and Gold Nanoparticles As Case Examples. Toxicol. Sci. 2017, 158, 23–35. [Google Scholar] [CrossRef] [PubMed]
  25. Bergmann, F.T.; Adams, R.; Moodie, S.; Cooper, J.; Glont, M.; Golebiewski, M.; Hucka, M.; Laibe, C.; Miller, A.K.; Nickerson, D.P.; et al. COMBINE archive and OMEX format: One file to share all information to reproduce a modeling project. BMC Bioinform. 2014, 15, 369. [Google Scholar] [CrossRef]
  26. Hindmarsh, A.C.; Brown, P.N.; Grant, K.E.; Lee, S.L.; Serban, R.; Shumaker, D.E.; Woodward, C.S. SUNDIALS: Suite of nonlinear and differential/algebraic equation solvers. ACM Trans. Math. Softw. 2005, 31, 363–396. [Google Scholar] [CrossRef]
  27. Hairer, E.; Wanner, G. Solving Ordinary Differential Equations II. Stiff and Differential-Algebraic Problems, 2nd ed.; Springer: Berlin/Heidelberg, Germany, 1996. [Google Scholar]
  28. Dormand, J.R.; Prince, P.J. A family of embedded Runge-Kutta formulae. J. Comput. Appl. Math. 1980, 6, 19–26. [Google Scholar] [CrossRef] [Green Version]
  29. Le Novère, N.; Hucka, M.; Mi, H.; Moodie, S.; Schreiber, F.; Sorokin, A.; Demir, E.; Wegner, K.; Aladjem, M.I.; Wimalaratne, S.M.; et al. The Systems Biology Graphical Notation. Nat. Biotechnol. 2009, 27, 735–741. [Google Scholar] [CrossRef]
  30. Hucka, M.; Bergmann, F.T.; Chaouiya, C.; Dräger, A.; Hoops, S.; Keating, S.M.; König, M.; Le Novère, N.; Myers, C.J.; Olivier, B.G.; et al. The Systems Biology Markup Language (SBML): Language specification for level 3 version 2 core. J. Integr. Bioinform. 2019, 16, 20190021. [Google Scholar] [CrossRef]
  31. Akberdin, I.R.; Kiselev, I.N.; Pintus, S.S.; Sharipov, R.N.; Vertyshev, A.Y.; Vinogradova, O.L.; Popov, D.V.; Kolpakov, F.A. A Modular Mathematical Model of Exercise-Induced Changes in Metabolism, Signaling, and Gene Expression in Human Skeletal Muscle. Int. J. Mol. Sci. 2021, 22, 10353. [Google Scholar] [CrossRef]
  32. Alon, U. Biological networks: The tinkerer as an engineer. Science 2003, 301, 1866–1867. [Google Scholar] [CrossRef] [PubMed] [Green Version]
  33. Blinov, M.L.; Ruebenacker, O.; Moraru, I.I. Complexity and modularity of intracellular networks: A systematic approach for modelling and simulation. IET Syst. Biol. 2008, 2, 363–368. [Google Scholar] [CrossRef] [PubMed] [Green Version]
  34. Pan, M.; Gawthrop, P.J.; Cursons, J.; Crampin, E.J. Modular assembly of dynamic models in systems biology. PLoS Comput. Biol. 2021, 17, e1009513. [Google Scholar] [CrossRef] [PubMed]
  35. Smith, L.P.; Bergmann, F.T.; Chandran, D.; Sauro, M.H. Antimony: A modular model definition language. Bioinformatics 2009, 25, 2452–2454. [Google Scholar] [CrossRef] [Green Version]
  36. Kiselev, I.; Kolpakov, F. Modular modeling of biological systems. Virtual Biol. 2013, 1, e11. [Google Scholar] [CrossRef] [Green Version]
  37. Hartwell, L.H.; Hopfield, J.J.; Leibler, S.; Murray, A.W. From molecular to modular cell biology. Nature 1999, 402 (Suppl. 6761), C47–C52. [Google Scholar] [CrossRef]
  38. Snoep, J.L.; Bruggeman, F.; Olivier, B.G.; Westerhoff, H.V. Towards building the silicon cell: A modular approach. Biosystems 2006, 83, 207–216. [Google Scholar] [CrossRef]
  39. Cho, W.S.; Cho, M.; Jeong, J.; Choi, M.; Han, B.S.; Shin, H.S.; Hong, J.; Chung, B.H.; Jeong, J.; Cho, M.H. Size-dependent tissue kinetics of PEG-coated gold nanoparticles. Toxicol. Appl. Pharmacol. 2010, 245, 116–123. [Google Scholar] [CrossRef]
  40. Zhong, J.; Wen, L.; Yang, S.; Xiang, L.; Chen, Q.; Xing, D. Imaging-guided high-efficient photoacoustic tumor therapy with targeting gold nanorods. Nanomedicine 2015, 11, 1499–1509. [Google Scholar] [CrossRef]
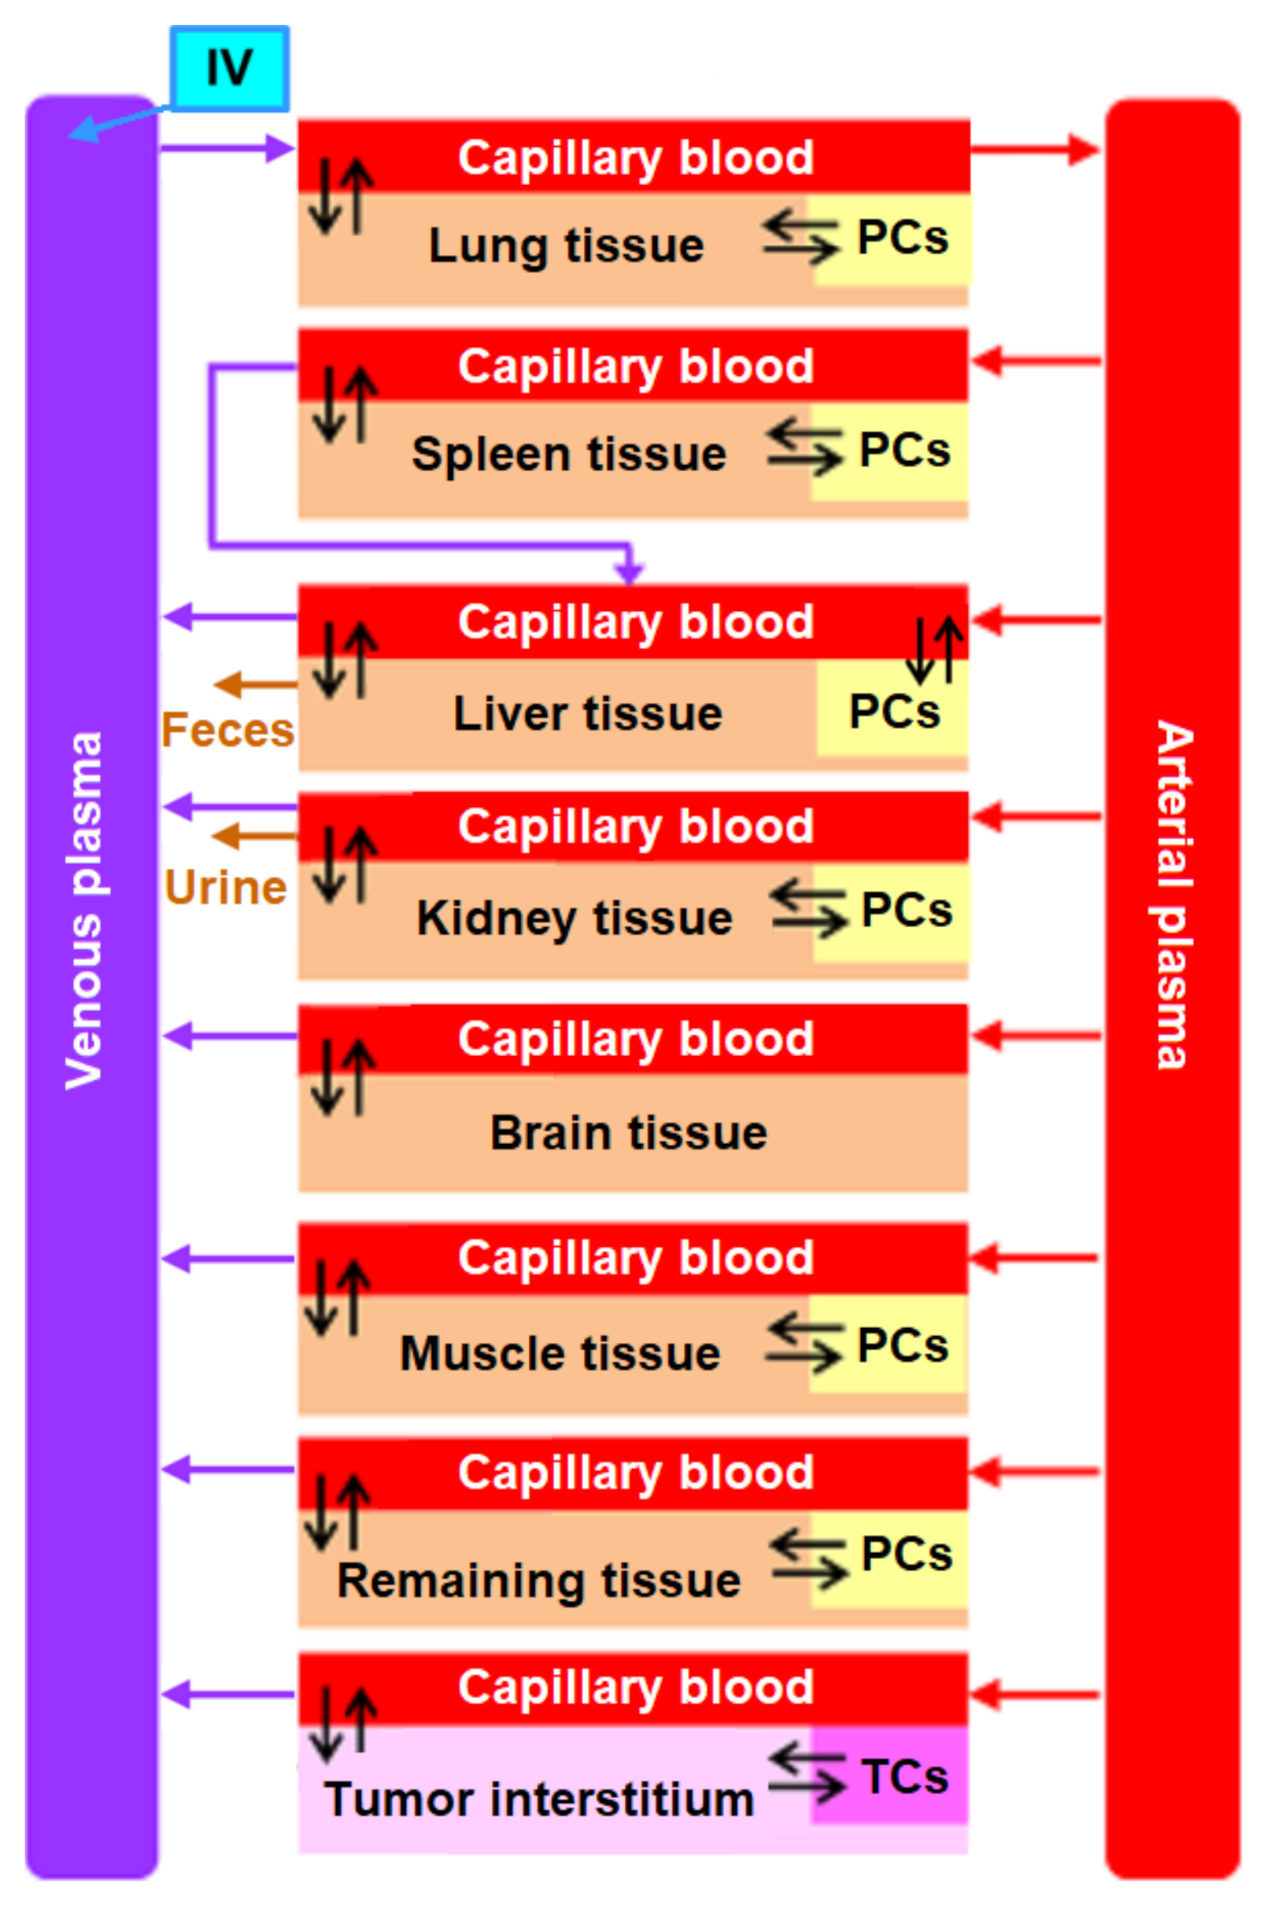
Figure 1. Schematic diagram of the physiologically based pharmacokinetic (PBPK) model of nanoparticle delivery to solid tumors in mice as presented by Cheng et al. Intravenously administered (IV) nanoparticles enter the arterial blood through the lungs, and then move to other organs and tissues of mice. Except plasma and the brain, each compartment of the model is divided into three major parts: capillary blood, tissue interstitium, and endocytic/phagocytic cells (PCs) or tumor cells (TCs). (Used with permission from https://pubs.acs.org/doi/10.1021/acsnano.9b08142 accessed on 1 April 2022. Copyright (2020) American Chemical Society. Further permissions related to the material excerpted should be directed to the American Chemical Society).
Mathematics 10 01176 g001
Figure 2. Reactions of nanoparticle transport between the lung subcompartments. (Adapted with permission from https://pubs.acs.org/doi/10.1021/acsnano.9b08142 accessed on 1 April 2022. Copyright (2020) American Chemical Society. Further permissions related to the material excerpted should be directed to the American Chemical Society).
Mathematics 10 01176 g002
Figure 3. Original representation of the lung compartment equations using the syntax of the Berkeley Madonna platform. (Adapted with permission from https://pubs.acs.org/doi/10.1021/acsnano.9b08142 accessed on 1 April 2022. Copyright (2020) American Chemical Society. Further permissions related to the material excerpted should be directed to the American Chemical Society).
Mathematics 10 01176 g003
Figure 4. An example of the simple model with one reaction of nanomaterial (NM) transport from capillary blood to tissue interstitium. (A). Visual representation of the model in SBGN. (B). The corresponding Antimony code which includes the definition of compartments (Capillary_blood and Tissue_interstitium), species (amounts of nanomaterial in capillary blood, Alub, and in tissue interstitium, Alut), parameters (PALuC and QC), reactions (R1) with the related kinetic laws (a math equation to the right of the reaction declaration), and properties for the visual model representation, including titles of the model elements, and specification of the SBGN notation.
Mathematics 10 01176 g004
Figure 5. Example code for nanoparticle dosing formulas in Berkeley Madonna and Antimony languages.
Mathematics 10 01176 g005
Figure 6. A diagram of the lung compartment automatically generated in BioUML using Antimony text representation.
Mathematics 10 01176 g006
Figure 7. The final BioUML representation of the PBPK model of nanoparticle delivery to solid tumors in mice. (A) Original schematic diagram by Cheng et al. (Used with permission from https://pubs.acs.org/doi/10.1021/acsnano.9b08142 accessed on 1 April 2022. Copyright (2020) American Chemical Society. Further permissions related to the material excerpted should be directed to the American Chemical Society). (B) Implementation of the modular computational model in BioUML by analogy with the scheme A (C) Graphical notation used in BioUML to represent the model.
Mathematics 10 01176 g007
Figure 8. The lung compartment in BioUML using Systems Biology Markup Language (SBML) and SBGN standards and Antimony code. Note that the “sbgnType” tag is not included in the Antimony syntax, as well as specifying the different types of ports (>BW, <QC). We added these extensions to the Antimony implementation to support SBGN objects and allow for modular modeling.
Mathematics 10 01176 g008
Figure 9. Determination of the PBPK model of nanoparticle delivery to solid tumors in mice based on the modular approach. (A) The common structure of the model compartments as a separate module in SBML format and SBGN notation. (BH) Representation of similar modules in BioUML. The interpretation of the parameters is the same as in Table 1, corrected for the corresponding module.
Mathematics 10 01176 g009
Figure 10. Determination of the PBPK model of nanoparticle delivery to solid tumors in mice based on the modular approach. (A) Module “Liver”. (B) Module “Venous plasma”. (C) Module “Arterial plasma”.
Mathematics 10 01176 g010
Figure 11. Simulation results of temporal changes in the concentration of the gold nanoparticles (AuNPs, 13 nm) in healthy mice and of the gold nanorods (AuNRs, 9–11 nm) in tumor-bearing mice, obtained for venous plasma, as well as lung, liver, spleen, kidney, and tumor tissues.
Mathematics 10 01176 g011
Table 1. The list of variables and parameters used in the model of nanoparticle delivery by Cheng et al.
NotationInterpretationValueUnits
ALubAmount of nanoparticles in the capillary blood of the lungsvariablemg
ALungAmount of nanoparticles in the lung compartmentvariablemg
ALuRESAmount of nanoparticles being taken up from the lung interstitium by phagocytosisvariablemg
ALutAmount of nanoparticles in the lung interstitiumvariablemg
BVLuFractional blood volume in the lungs0.5-
BWBodyweight of mice0.02kg
CLutConcentration of nanoparticles in the lung interstitiumvariablemg/L
CVConcentration of nanoparticles in the venous bloodvariablemg/L
CVLuConcentration of nanoparticles in the capillary blood of the lungsvariablemg/L
KLuRES50Time reaching a half-maximum uptake rate of nanoparticles by endocytic/phagocytic cells of the lungs48.0h
KLuRESmaxMaximum uptake rate of nanoparticles by endocytic/phagocytic cells of the lungs0.0851/h
KLuRESnHill coefficient in the lung compartment5.0-
KLuRESreleaseRate constant of nanoparticles released from endocytic/phagocytic cells of the lungs0.031/h
KLuRESUPRate of endocytosis in the lungsvariable1/h
PALuCMembrane-limited permeability coefficient in the lungs0.001-
PDOSEivInjected dose of nanoparticles8.17mg/kg
PLuTissue:plasma distribution coefficient for the lungs0.15-
QCCardiac output0.87752L/h
TimeivInjection time0.005h
VLuLung volume0.00014L
VLubVolume of the capillary blood in the lungs0.00007L
VLuCLung volume (fraction of the bodyweight)0.007-
VLutVolume of the lung interstitium0.00007L
Table 2. Extension of Systems Biology Graphical Notation (SBGN) in BioUML for representation of the model elements. Adapted from https://doi.org/10.3390/ijms221910353 accessed on 1 April 2022.
Element NameGlyphDescription
Equation Mathematics 10 01176 i001Mathematical equations of the model:
  • assignments
  • initial assignments
  • algebraic equations
  • differential equations
Discrete event Mathematics 10 01176 i002Events describe an instant change of the model variable when a specified condition is satisfied, e.g., the change of medication rate after a certain time point.
Function Mathematics 10 01176 i003Function receives argument values, calculates, and returns the result of the given expression.
Constraint Mathematics 10 01176 i004A condition set in the constraint is checked during the simulation. Depending on solver settings a simulation may be stopped or an error message will be shown if the condition is violated.
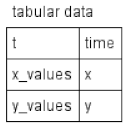
Table Mathematics 10 01176 i005Tabular elements are used to calculate model variables according to corresponding tabular data. Each row of the tabular element connects the table column with the model variable. In this case, the table column t is employed for the time variable, time, while the x_values and y_values columns serve to calculate the x and y variables, respectively. The tabular element is either translated to a spline approximating tabular data or a piecewise constant function.
Interface ports Mathematics 10 01176 i006There are three types of interface ports in the BioUML to support the visual representation of modular models (see subsection “Modular modeling” below): contact (gray), input (green), and output (red) ports.
Table 4. Values of the model parameters to simulate cases of distribution of the gold nanoparticles (AuNPs, 13 nm) in healthy mice and of the gold nanorods (AuNRs, 9–11 nm) in tumor-bearing mice.
ParametersInterpretationHealthy Mice
AuNPs, 13 nm
Tumor-Bearing Mice
AuNRs, 9–11 nm
Units
BVTBlood volume fraction in tumor (percentage of the tumor volume)-0.02-
KTRES50Time reaching a half maximum uptake rate of nanoparticles by tumor cells-0.5h
KTRESmaxMaximum uptake rate of nanoparticles by tumor cells-0.0551/h
KTRESnHill coefficient for the uptake by tumor cells-0.5-
KTRESreleaseRate constant of nanoparticles released from tumor cells-0.0011/h
PATCMembrane-limited permeability coefficient-0.01-
PDOSEivAdministered dose of nanoparticles0.8520mg/kg
PTTumor tissue:plasma distribution coefficient -0.265-
QTCBlood flow rate to the tumor (fraction of cardiac output)-0.01-
VTCTissue volume (fraction of the bodyweight)-0.006-
Publisher’s Note: MDPI stays neutral with regard to jurisdictional claims in published maps and institutional affiliations.