Article

Spiral Thermal Plumes in Water under Conventional Heating: Numerical Results on the Effect of Rotation

by
María Cruz Navarro
1,*,
Damián Castaño
2 and
Henar Herrero
1
1
Departamento de Matemáticas, Facultad de Ciencias y Tecnologías Químicas-IMACI, Universidad de Castilla-La Mancha, 13071 Ciudad Real, Spain
2
Departamento de Matemáticas, Escuela de Ingeniería Industrial y Aeroespacial-IMACI, Universidad, de Castilla-La, Mancha, 45004 Toledo, Spain
*
Author to whom correspondence should be addressed.
Mathematics 2022, 10(7), 1052; https://doi.org/10.3390/math10071052
Submission received: 28 February 2022 / Revised: 20 March 2022 / Accepted: 23 March 2022 / Published: 25 March 2022
(This article belongs to the Section Computational and Applied Mathematics)

Abstract

:
In this paper, we study numerically the effect of rotation within a sample of water in a cylindrical container subject to rotation which is heated with a constant temperature at the bottom and lateral wall. We analyze the temporal behavior of temperature and flow velocity of the solvent. The thermal plumes developed at lower levels, already observed in the case without rotation, begin to spiral spreading outwards by the effect of rotation, increasing the azimuthal velocity of the fluid. No significant increases in the radial and vertical velocity components are observed which do not favor the mixture of hotter and colder flows in the sample and a faster heating of the solvent. In the rotation range studied, the state loses the axisymmetry and becomes fully 3D earlier in time as the rotation rate increases. To perform simulations, we use a 3D temporal model that couples momentum and heat equations and is based on spectral element methods.
MSC:
80M22; 76U99

1. Introduction

Rayleigh-Bénard convection (RBC) is a classical system to study thermally driven flows in confined space where the fluid is cooled from above and heated from below [1,2].
In rotating Rayleigh-Bénard convection (RRBC) the fluid is, in addition, subject to background rotation about its vertical axis. Flows in RRBC are present in nature and technology, as geophysical flows [3,4], astrophysical flows [5,6], and flows in technological applications [7,8]. The wide range of applicability of rotating thermal convection is the reason this problem has been widely studied in laboratory experiments and numerical simulations, especially in turbulent regimes. In Refs. [9,10,11], experimental and numerical measurements of velocity and temperature fields in a cylindrical Rayleigh-Bénard convection cell in steady rotation are presented, describing the vortex sheets developed depending on the rotation rate.
Variations of RBC and RRBC include, besides the vertical gradient, horizontal temperature gradients which play a relevant role in the flow, being of particular importance in the development of thermoconvective vortices [12,13].
Thermal plumes are a key feature in both RBC and RRBC. Plumes are found in industrial applications [14] and in natural events, like in oceanic and atmospheric circulations [15,16,17,18], and mantle convection [19,20]. They have been studied in the case of turbulent flows [21,22,23] and also in laminar regimes [19,20,24].
In Ref. [24], we reported the development of thermal plumes in a cylindrical container filled with water subject to a fixed temperature in the lateral and bottom of the vessel. Thermal plumes qualitatively similar are shown experimentally in [25], who report measurements of a rising thermal plume in a cubical tank filled in with corn syrup. Experimental and numerical results in Ref. [26] show the formation of pure thermal plume structures in the near-hot-wall region very similar to those shown in Ref. [24].
The configuration formed by a cylindrical container filled in with a solvent subject to a fixed temperature in the lateral and bottom of the vessel is used in chemical devices to heat solvents by conventional heating. It typically used a bath or any other device that assures a fixed temperature at the bottom and lateral wall. Since the experiments in RBC and RRBC by Rossby [27], it is known that rotation can enhance heat transport. In this work, we add rotation to the system and study, in a vessel of sample-size typically used in chemical applications, the effect that moderate rotation has on thermal distribution and the velocity of heating. Results are of interest in the understanding and prediction of the thermal evolution of a solvent under conventional heating, with applications in physics and chemistry, where it is useful to have a full spatio-temporal description of the velocity and temperature in the flow.

2. Mathematical Model

We consider a rotating cylindrical container of height H = 0.022 m and radius R = 0.017 m filled with water, Ω being the rotation rate (Figure 1a). The dimensions chosen for the setup correspond to the common sample size in experimental studies in chemistry [28]. The bottom and lateral boundaries are at a fixed temperature T e . The upper surface is assumed to be isolated. In laboratory experiments the lost of heat through the top boundary is usually avoided by locating a Teflon piece.
The equations governing the system are [29,30]
ρ 0 C p T t + ρ 0 C p u · T = κ 2 T
· u = 0 ,
u t + u · u = α g T e z 1 ρ 0 p + ν 2 u + 2 u × Ω e z ,
where u is the velocity, T is the temperature, p is the hydrodynamic pressure, ρ 0 is the density, κ is the thermal conductivity, C p is the specific heat, ν is the kinematic viscosity, g is the gravity constant, Ω is the rotation rate and e z is the unit vector in the z direction. The operators are expressed in cylindrical coordinates ( r , ϕ , z ) .
Regarding boundary conditions, an insulating boundary condition is considered on the top, and at bottom and lateral walls, temperature is fixed at T e :
T z = 0 at z = H , T = T e at r = R and z = 0 .
Null velocity is imposed at the bottom, top and lateral walls,
u = 0 at r = R , z = 0 , and z = H .
We obtained boundary conditions for pressure from the projection of the momentum Equation (3) at r = R and z = H and the continuity Equation (2) at z = 0 . We consider the following initial conditions at t = 0 :
T = T 0 , u = 0 , p = p 0 ( z ) ,
being p 0 the initial pressure obtained from Equation (3) with T = T 0 and u = 0 .

Numerical Implementation

The time-dependent governing Equations (1)–(3) and boundary and initial conditions (4)–(6) were solved by direct numerical simulation (DNS) using a second-order time-splitting method based on spectral element methods developed and tested for a cylindrical configuration in [31,32]:
3 T n + 1 4 T n + T n 1 2 Δ t = 2 u n · T n + u n 1 · T n 1 + κ ρ 0 C p 2 T n + 1
· u n + 1 = 0
3 u n + 1 4 u n + u n 1 2 Δ t = 2 u n · u n + u n 1 · u n 1 1 ρ 0 p n + 1 α g T n + 1 e z + ν 2 u n + 1 + 2 ( 2 u n + 1 × Ω e z ) 2 u n × Ω e z
where n is the index for time.
The fractional steps of the method are the following:
  • T n + 1 is obtained from Equation (7).
  • Applying ∇ to Equation (9) and using Equation (8), a preliminary pressure field p ¯ is obtained.
  • A predictor velocity field u * is calculated from Equation (9) by including the predictor pressure p ¯ .
  • Finally, in the correction step, the system
    3 2 P r Δ t u n + 1 u * = p n + 1 p ¯ n + 1 ,
    · u n + 1 = 0 ,
    is solved to obtained u n + 1 and p n + 1 .
A pseudo-spectral method is used for the spatial discretization, with a Fourier expansion in the azimuthal coordinate ϕ and Chebyshev collocation in r and z. Each field is expanded in the following way
x ( r , ϕ , z ) = k = K / 2 K / 2 1 F k ( r , z ) e i k ϕ ,
where F 0 ( r , z ) and F K / 2 ( r , z ) are real and F k ( r , z ) = F ¯ k ( r , z ) for k = 1 , , K / 2 1 , where F ¯ k denotes the complex conjugate of F k .
The coefficients F k are expanded in Chebyshev polynomials
F k ( r , z ) = l = 0 L n = 0 N f l n T l ( r ) T n ( z ) ,
where T n is the nth Chebyshev polynomial. We evaluate at the Gauss–Lobatto collocation points r j = Γ cos π j L for j = 0 , , L and z j = cos π j N for j = 0 , , N .
We considered 41 grid points in the radial and vertical directions and 32 in the azimuthal. The time step used in our computations is Δ t = 0.001 s. We used the scientific software package Matlab (R2021b, The MathWorks, Inc.: Natick, MA, USA). Table 1 summarizes thermal properties and input parameters used for computations.

3. Results and Discussion

3.1. State-Character Depending on Ω

The initial conditions are T 0 = 20 °C and u = 0 m/s. We study the evolution of this initial unstable axisymmetric state depending on the rotation rate Ω and the time t. In Figure 2, it is displayed the evolution of the character of the flow (axisymmetric or non-axisymmetric) for T e = 40 °C when Ω and t are varied. As observed, the loss of axisymmetry occurs earlier in time as larger the rotation rate is.
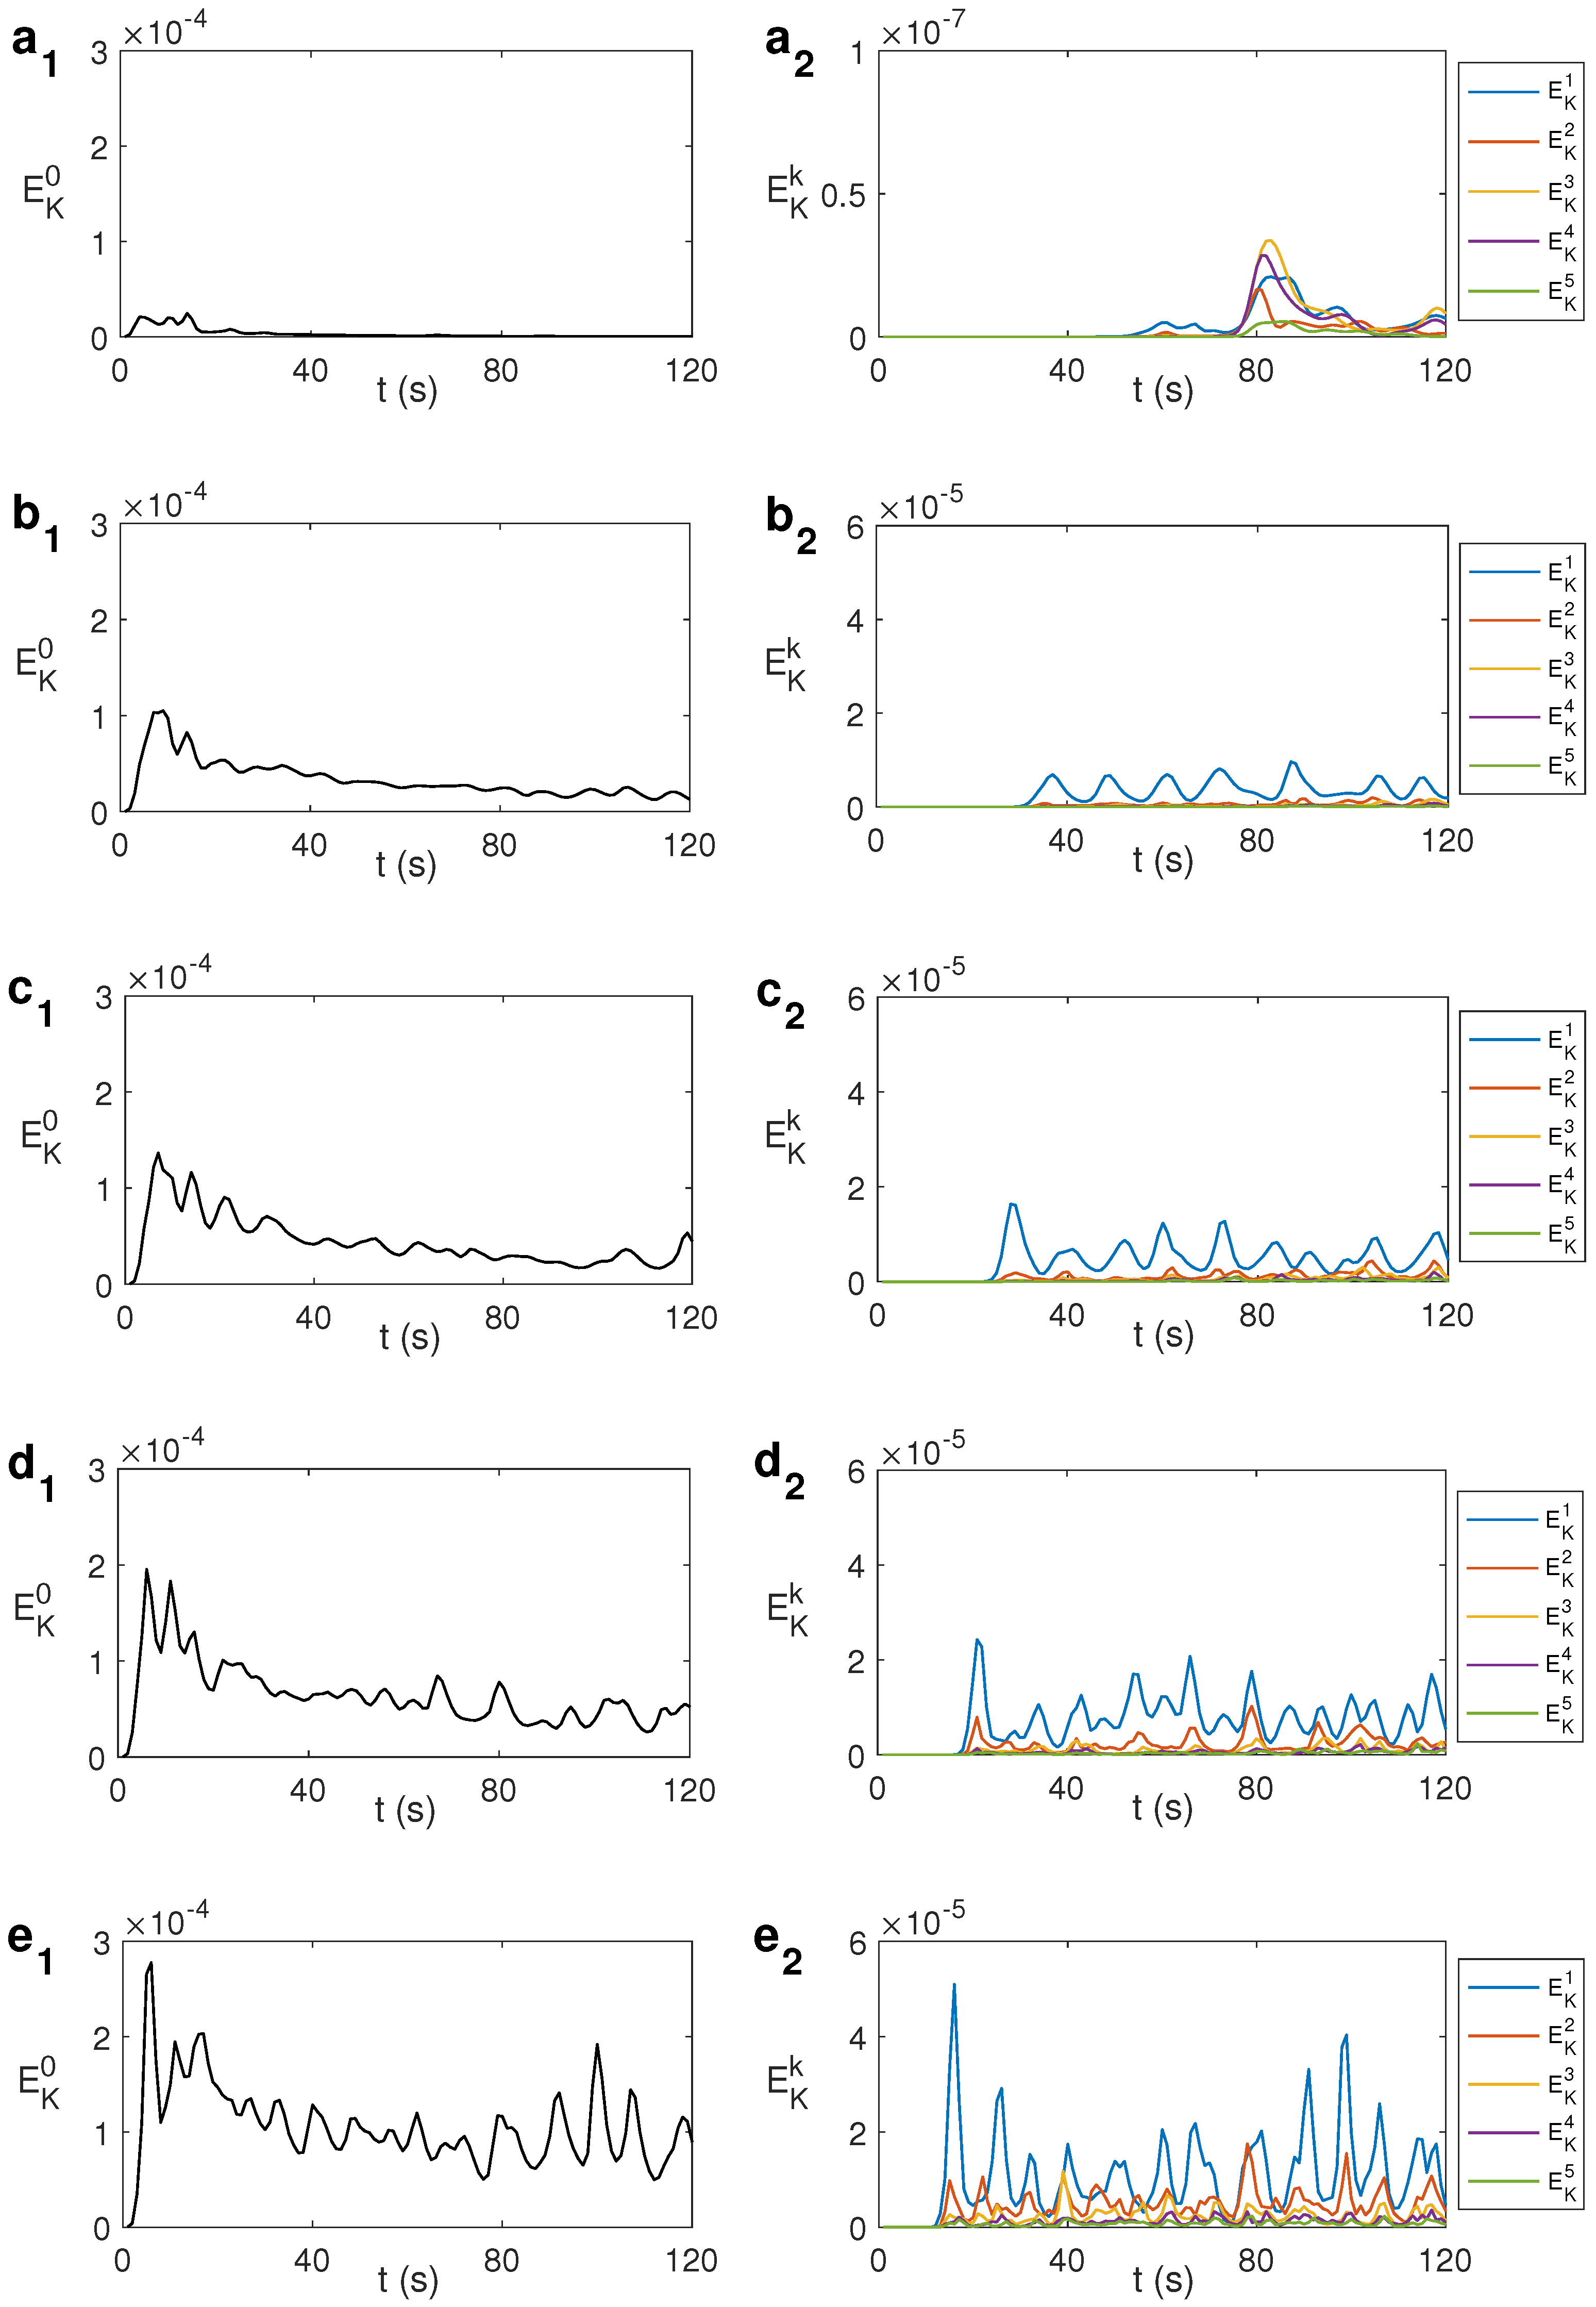
Figure 3 shows the spectral decomposition of the kinematic energy E K with the azimuthal wavenumber k for different values of Ω . The modal kinetic energy E K k is calculated as E K k = 1 2 z = 0 z = H r = 0 r = R u k · u k * r d r d z , where u k is the Fourier mode k of the velocity field and u k * its complex conjugate. Figure 3 a corresponds to Ω = 0 s 1 . As shown, for t = 45 s the energy of the mode k = 1 begins to grow significantly. Some seconds after that, other modes grow as well. The flow becomes non-axisymmetric, i. e.; fully 3D. For Ω = π 120 s 1 , the energy for modes different from k = 0 starts growing after 25 s of heating (Figure 3b), earlier than in the case Ω = 0 s 1 . As Ω increases, the state becomes fully 3D earlier in time. This is shown in Figure 3c–e for Ω = π 100 s 1 , Ω = π 80 s 1 and Ω = π 60 s 1 , respectively. A similar behavior is obtained for larger values of T e .

3.2. Effect of Ω in the Temperature Profile and Velocity Flow

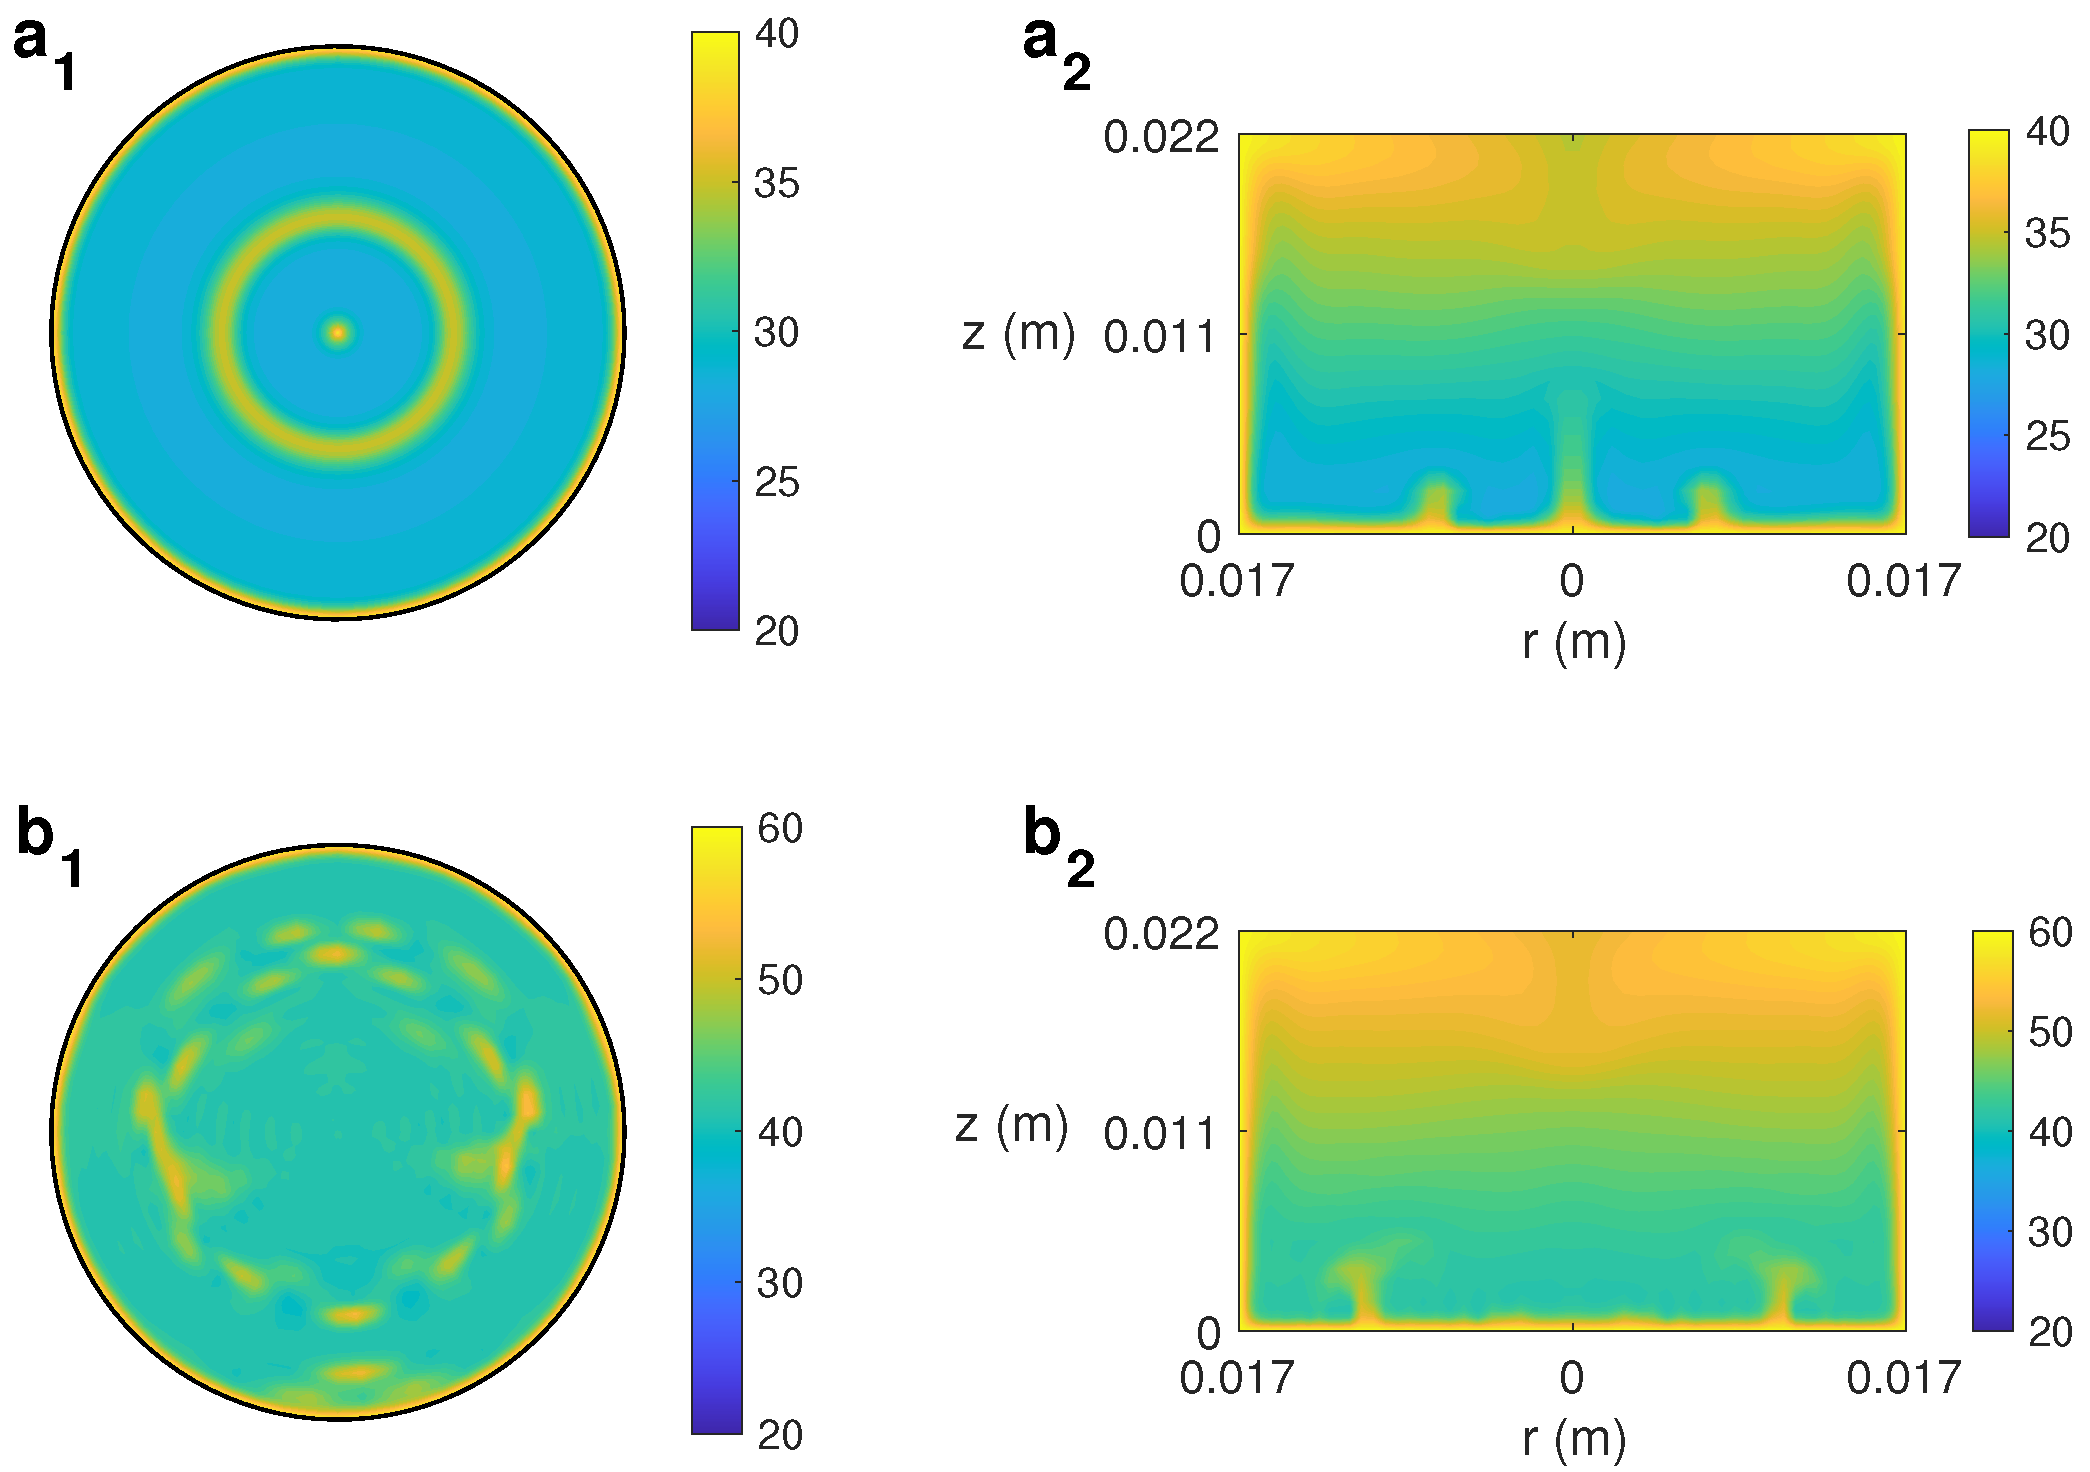
Experiments in the non-rotation case, Ω = 0 s 1 , show the formation of thermal plumes at the lower part of the cell that spread from the center toward the lateral wall, along which hot flow rises to upper levels [24]. Figure 4 displays, for the case Ω = 0 s 1 , contours of temperature at z = 0.0017 m and in the r z plane at ϕ = 0 ( ϕ = π ) for T e = 40 °C (Figure 4a) and T e = 60 °C (Figure 4b), at t = 40 s. When the state is axisymmetric, as in Figure 4a, hotter rings are observed corresponding to the regions where thermal plumes are localized. When the axisymmetry is broken for a higher T e , a disorganized distribution of hot spots along the bottom of the cell is reported that shows the regions where thermal plumes are developed. This is shown in Figure 4b. Figure 4a,b shows examples of the thermal plumes developed at lower levels that move displacing toward the lateral wall till collide with it, favoring thermal convection in that zone. This convective motion through the formation of thermal plumes moving at lower levels was reported in numerical [26,35] and experimental works [25,36].
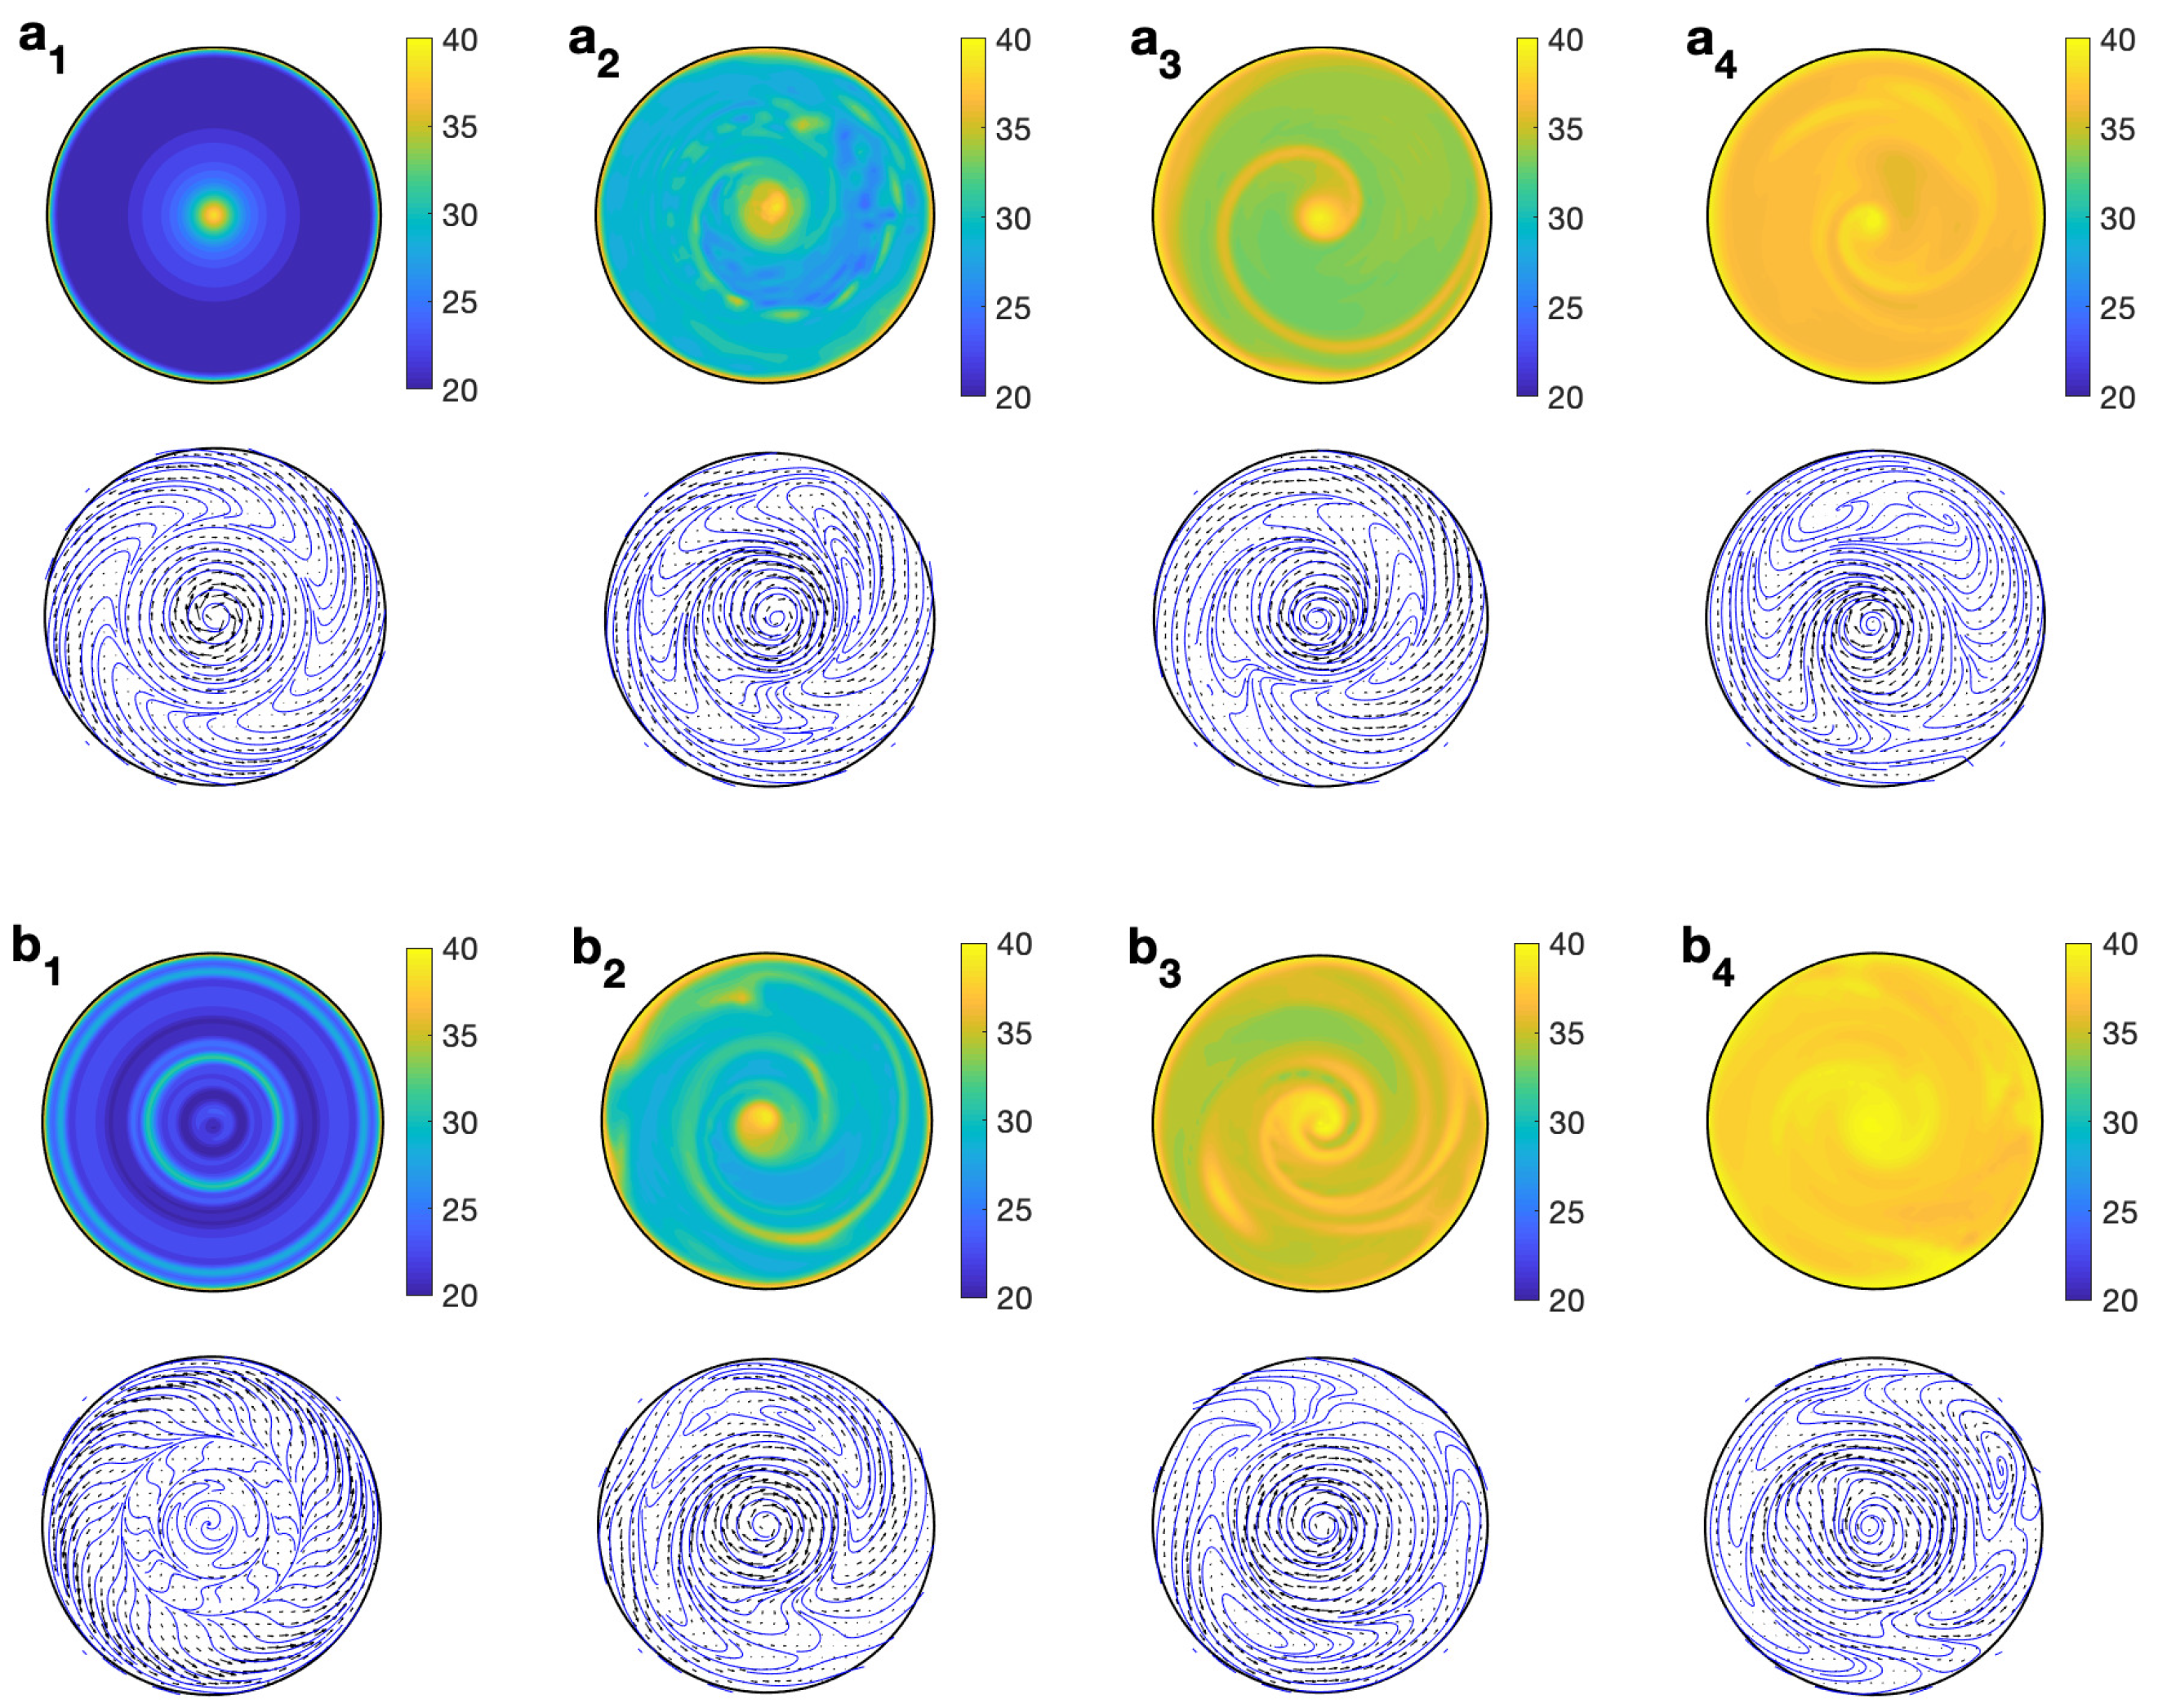
We analyze the effect of including rotation to the system, focusing on the distribution and evolution of thermal plumes and the improvement or not of the heating velocity in the sample. We performed simulations for T e = 40 °C and T e = 60 °C and different rotation rates: π 120 s 1 , π 100 s 1 , π 80 s 1 and π 60 s 1 . Figure 5 shows contours of the predicted temperature, velocity field, and streamlines for a top view at z = 0.0017 m for T e = 40 °C and two different rotation rates Ω = π 100 s 1 and Ω = π 60 s 1 . In the first temporal stages, the behavior of the flow and temperature distribution is similar to that in the axisymmetric case without rotation, with the formation of thermal plumes within concentric hot rings as depicted in Figure 5(a1,b1) at t = 10 s, for Ω = π 100 s 1 and Ω = π 60 s 1 , respectively. When time evolves, the axisymmetry is broken and, by the effect of rotation, the hot rings connect in a spiral of hotter fluid (Figure 5(a2,b2)) that becomes well-formed as time evolves (Figure 5(a3,b3)). The velocity field at z = 0.0017 m shows a central clockwise vortex coinciding with the central plume (center of the spiral). This central plume connects with regions of counterclockwise motion that become also conduits for hotter fluid to flow. For larger Ω , for which the temperature profile presents, in its axisymmetric form, several concentric hot rings (Figure 5(b1)), the instability developed gives place to a multi-armed spiral, as depicted in Figure 5(b3).
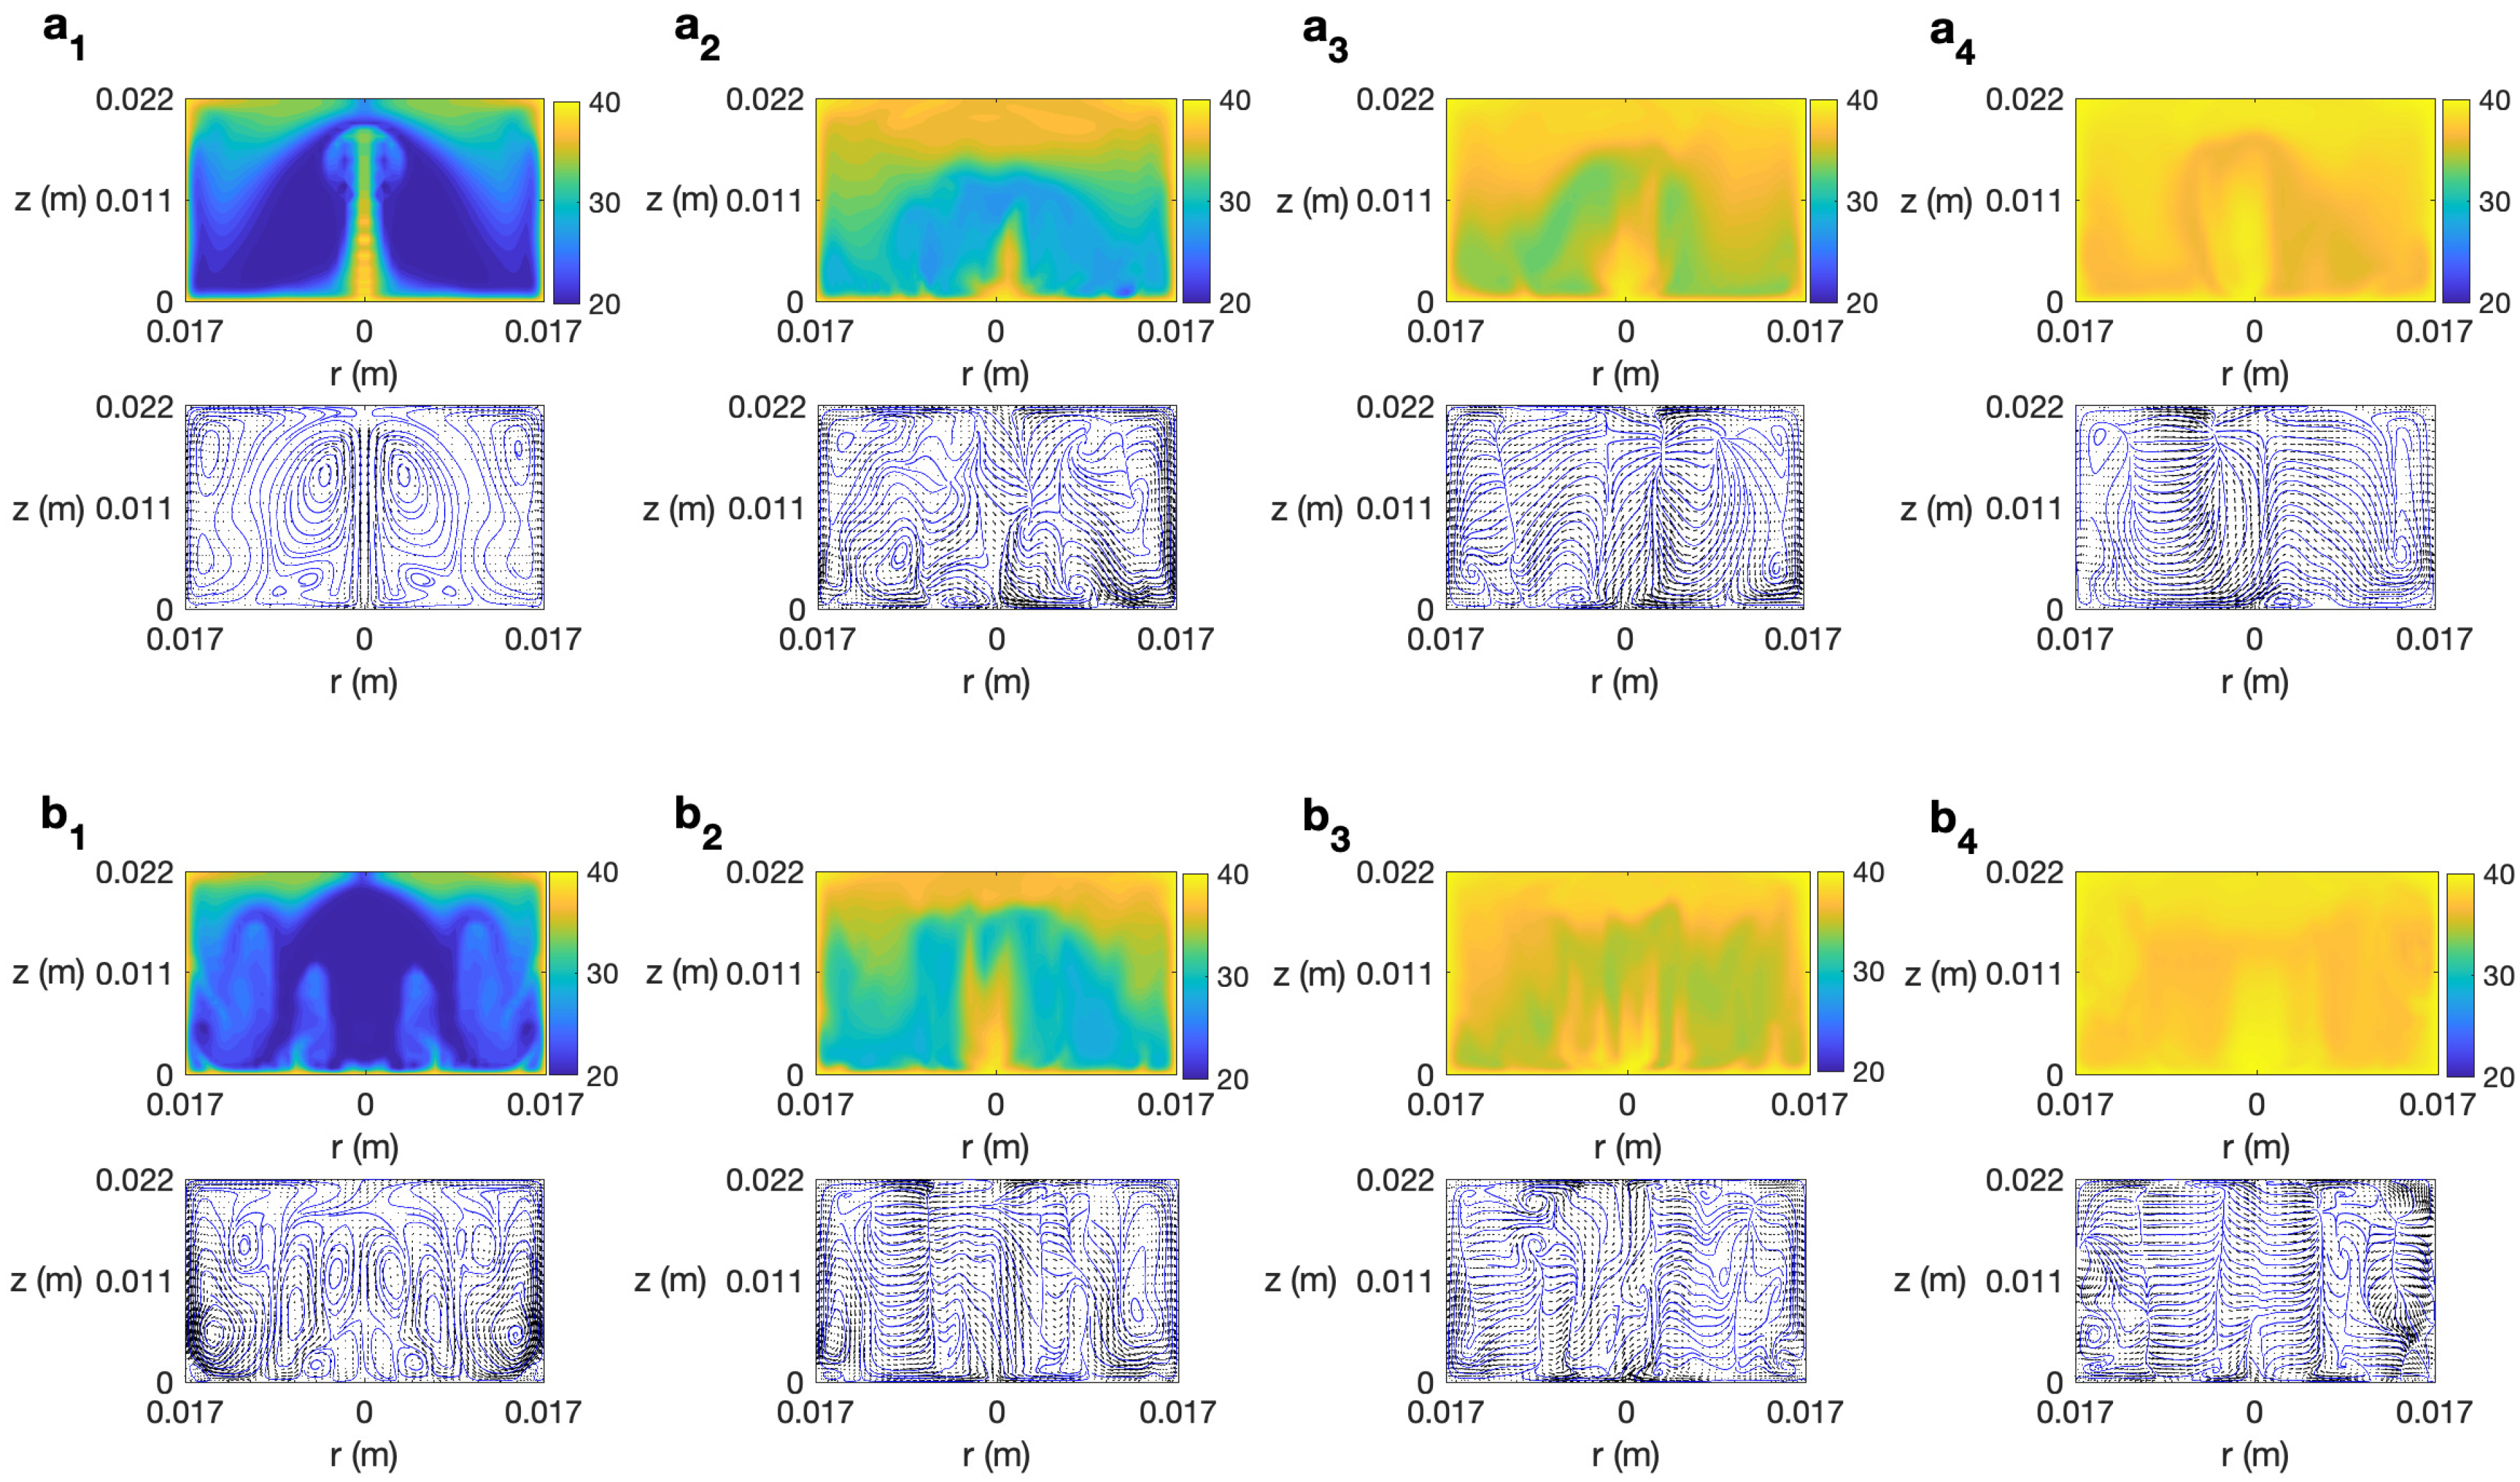
Temperature contour plots, velocity fields in the r z plane and streamlines complete the description of the structures formed. This is displayed in Figure 6 at ϕ = 0 ( ϕ = π ) for T e = 40 °C, Ω = π 100 s 1 and Ω = π 60 s 1 , and different time instants. For smaller rotation rates ( Ω = π 100 s 1 ) the state found in the first temporal stages is a large thermal plume localized along the cylinder’s axis. The typical mushroom shape is appreciated from both temperature contour and velocity field, and streamlines. As time evolves, convection reinforces along the lateral wall and at the bottom, where several convective rolls develop (Figure 6(a2)). The hot fluid spiral depicted in Figure 5(a3) is fed mainly by a strong central plume as shown in Figure 6(a3). For larger Ω , the temperature distribution is complex with several thermal plumes growing from the bottom, as depicted in Figure 6(b1), which corresponds to the formation of many convective rolls in the cell. As time evolves, a central thermal plume is developed that consists of several hot fingers (Figure 6(b3)) being the source of the multi-armed spiral shown in Figure 5(b3). The velocity fields and streamlines displayed show a complex motion of the fluid with the presence of convective rolls all along the cell. As time evolves, the sample becomes hotter (Figure 5(a4,b4) and Figure 6(a4,b4)) until it achieves a homogeneous temperature in the sample equal to T e = 40 °C.
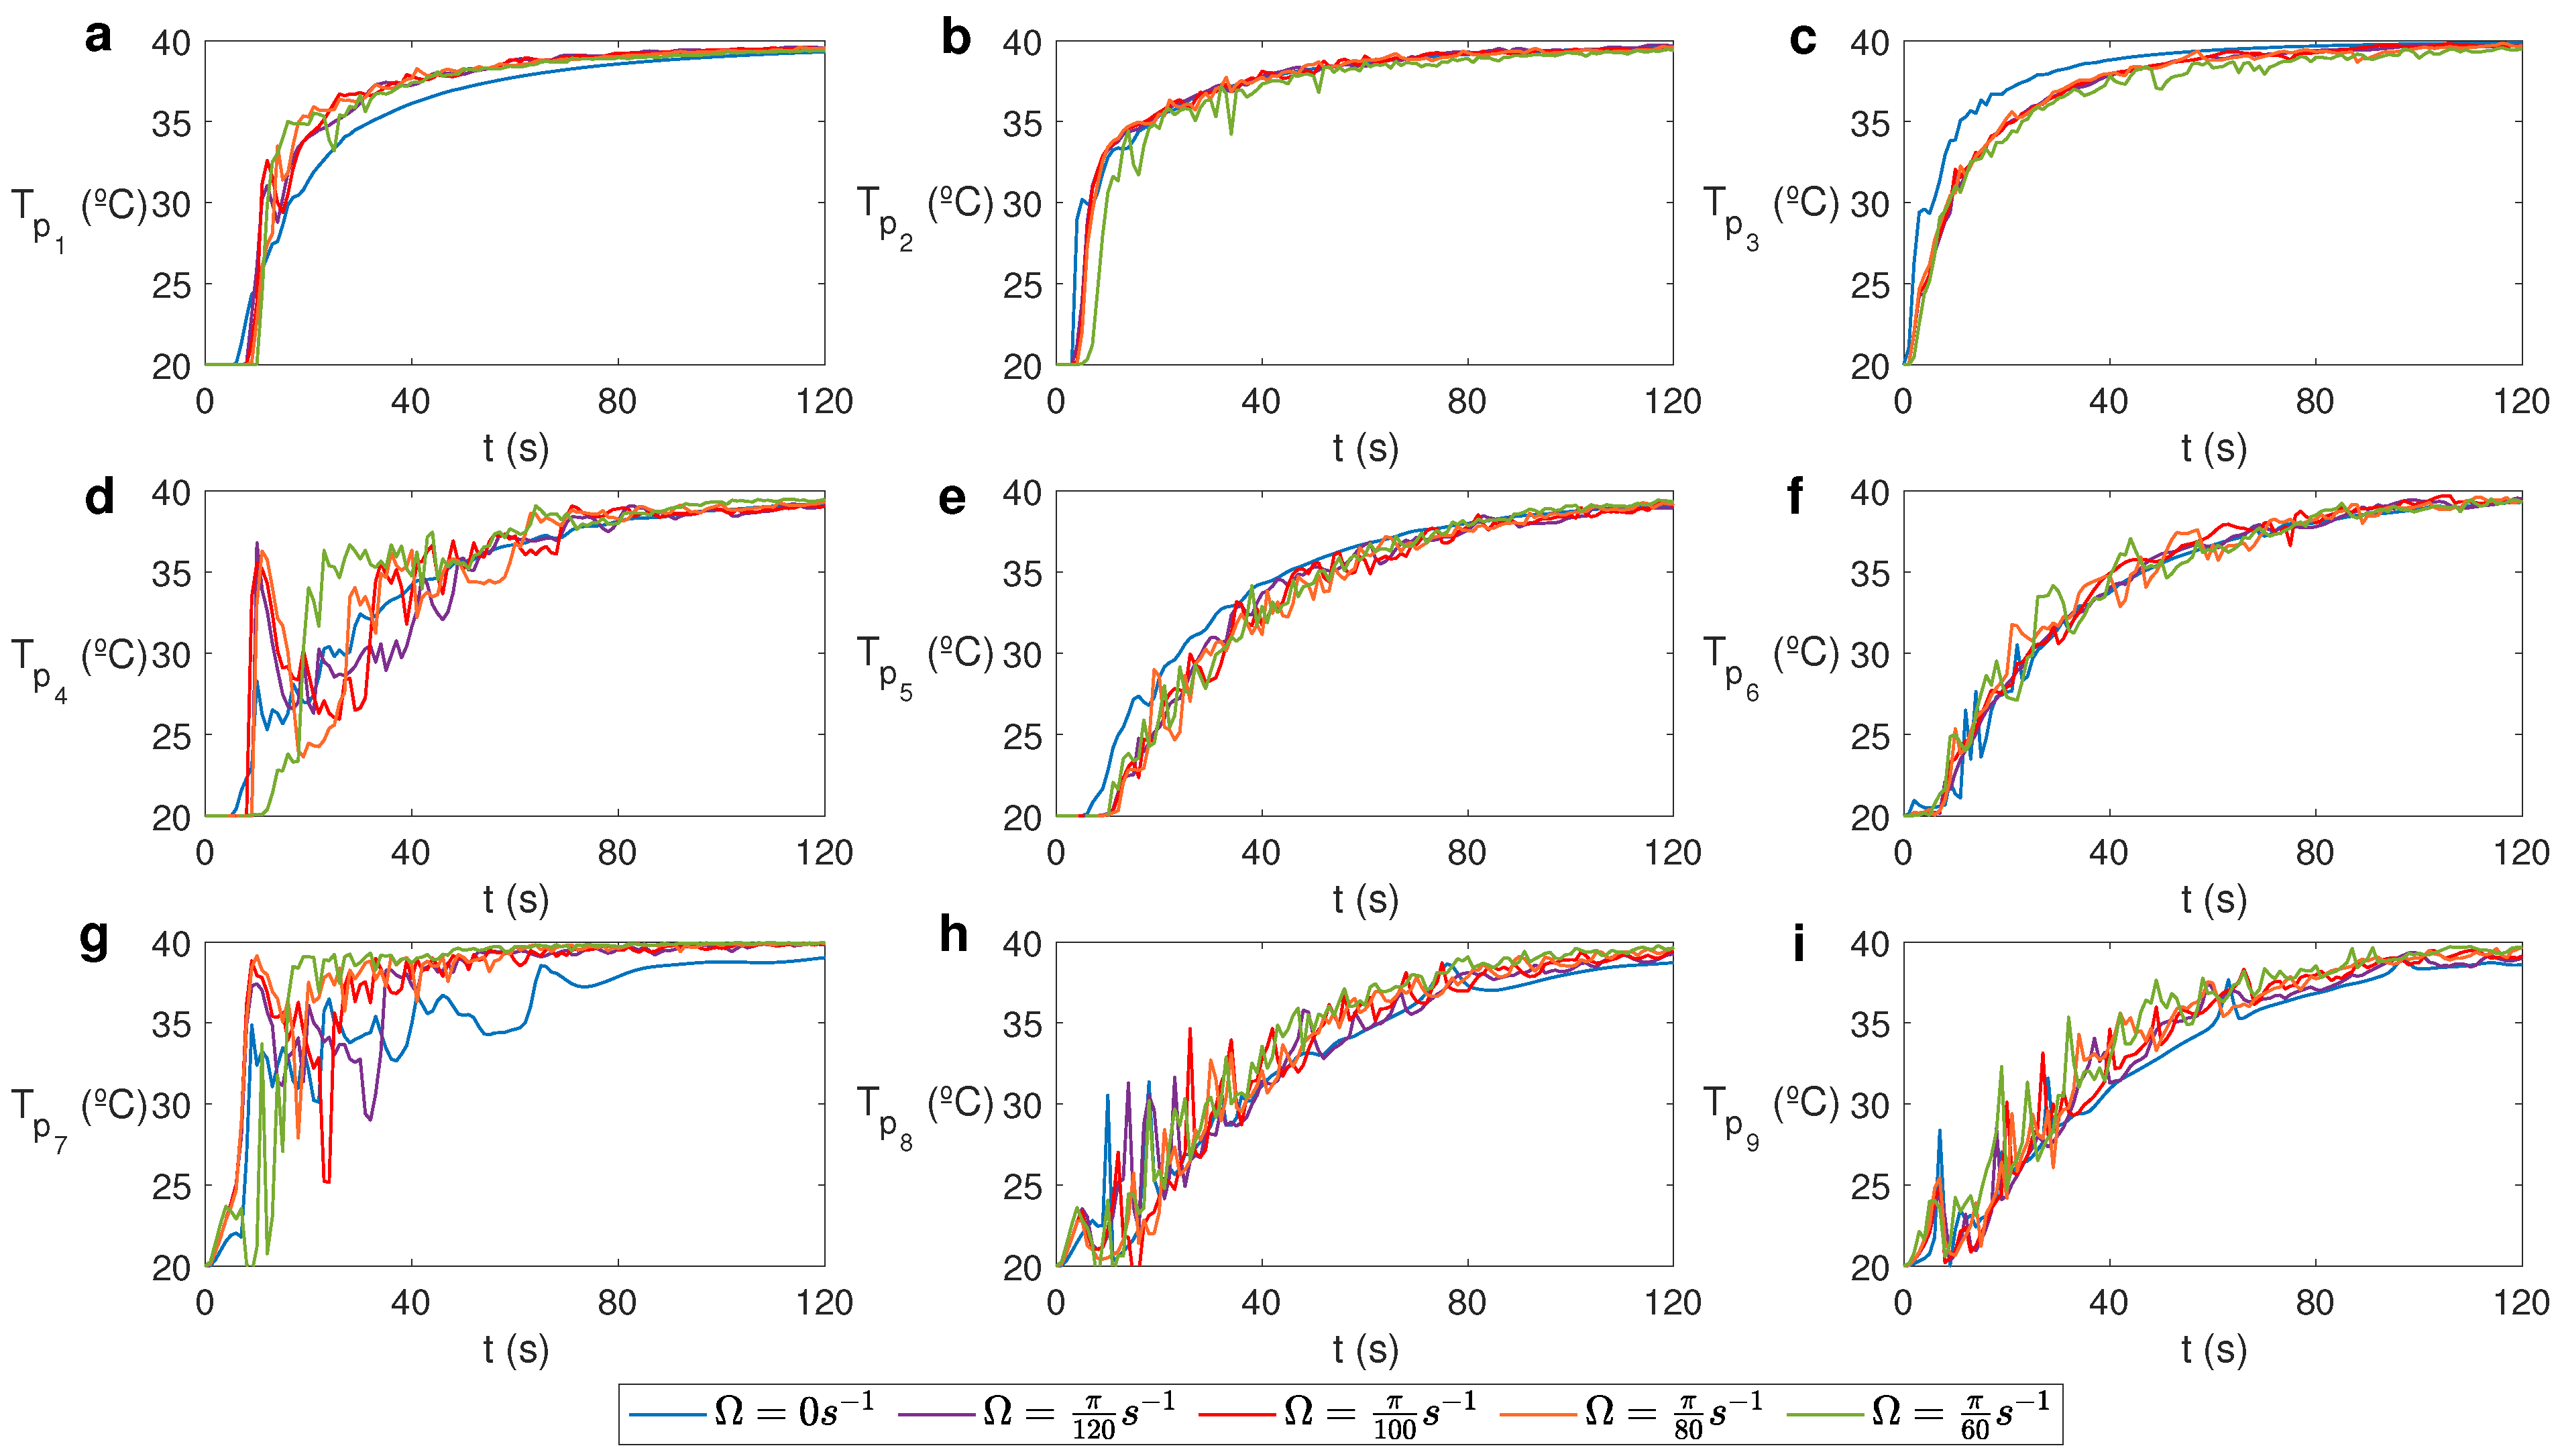
We studied the effect of the rotation rate on the velocity of heating in the sample and on the velocity field structure. Figure 7 shows the evolution of T for water at T e = 40 °C at different monitored points spread along the cell (Figure 1b) and different rotation rates. As observed, there is not a significant effect of Ω on the temporal evolution of temperature in the different regions of the cell. At lower levels (points p 7 , p 8 and p 9 ) the temperature suffers fluctuations due to the spiral thermal plumes developed close to the bottom boundary. For larger times ( t > 50 s) it is seen a slightly increase of temperature at these lower levels when ambient rotation is set in the system, as a result of the several hot fingers developed and the strong convection (Figure 6).
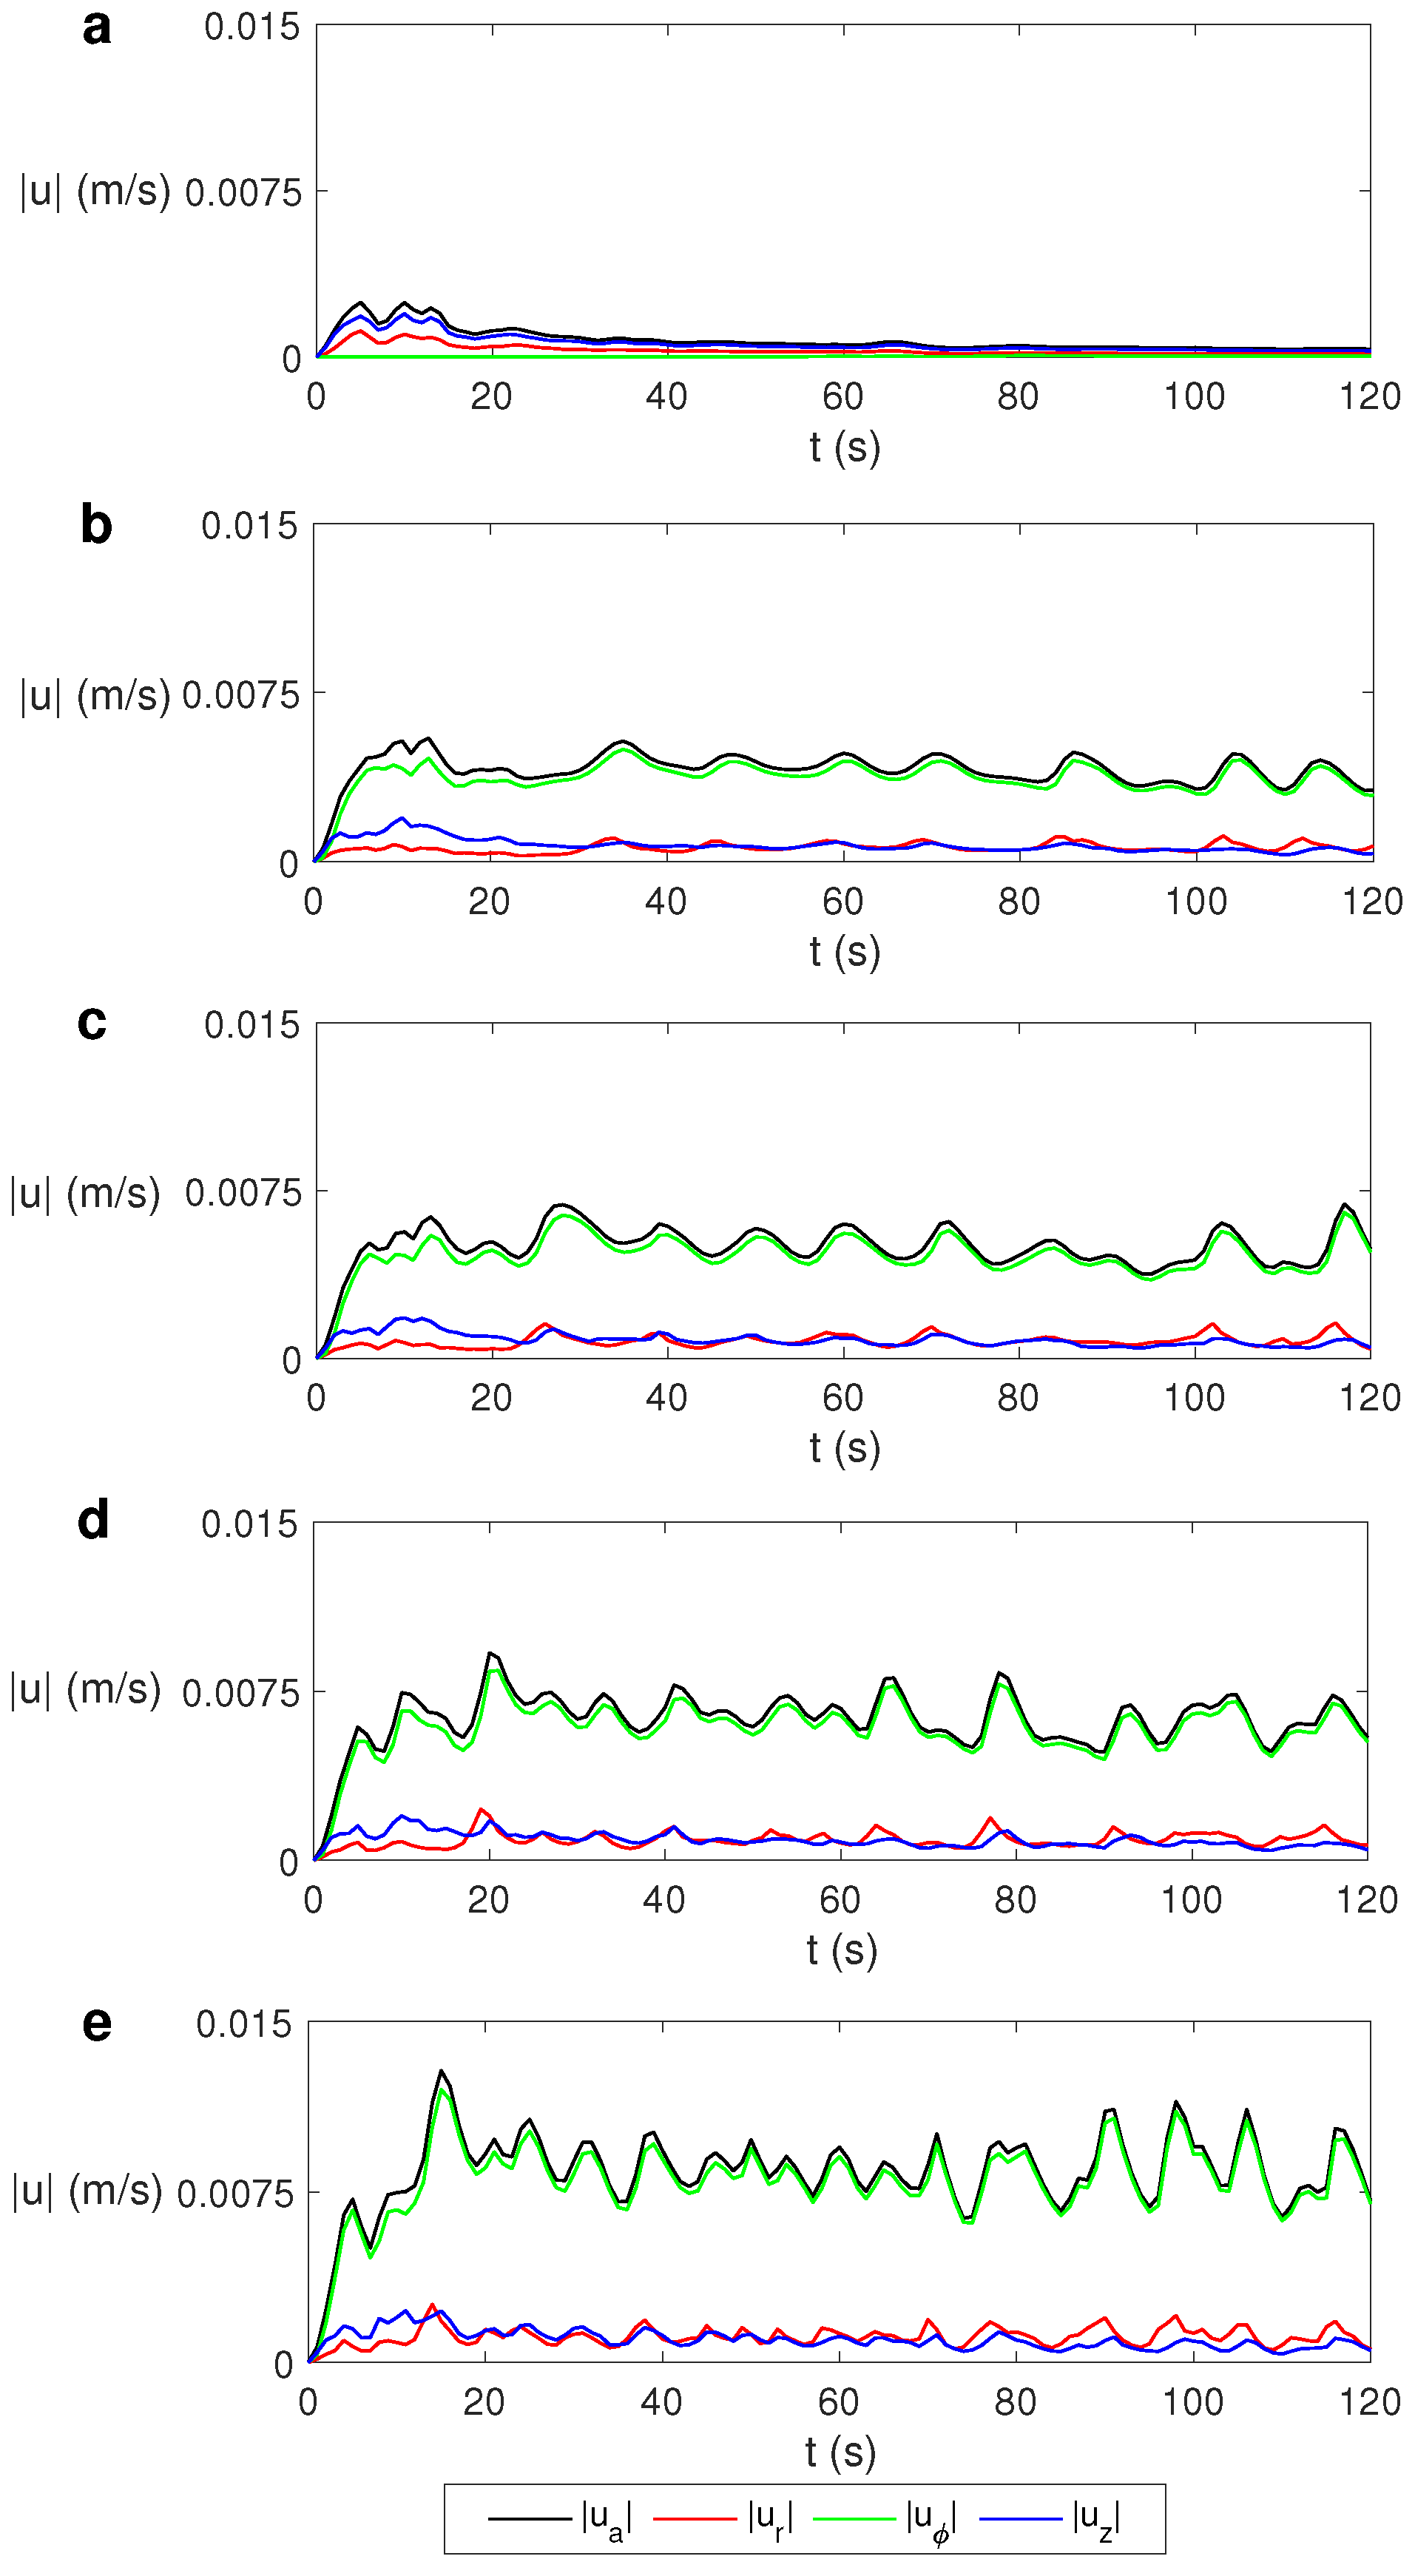
The evolution of the average velocity | u a | and the average radial ( | u r | ), azimuthal ( | u ϕ | ) and vertical ( | u z | ) velocity for different values of the rotation rate is displayed in Figure 8. The average velocity | u a | has been calculated as
| u a | = D r | u ( r , ϕ , z ) | d r d ϕ d z V o l ( D )
where | u | = u r 2 + u ϕ 2 + u z 2 . For the computation of | u x | , x = r , ϕ , z , we use Equation (14) with | u | = | u x | . The trapezoidal method has been used iteratively to compute the integrals.
As observed, there is no significant variation in the average values of radial and vertical velocity components for the different values of Ω , observing only an increase on the azimuthal velocity component that grows with Ω . This means that the fluid moves faster azimuthally when the rotation rate increases, but not radially or vertically. Therefore, the mixture of hotter and colder fluid in the cell is not improved by rotation and consequently no increase in the velocity of heating of the sample is reported under moderated rotation rates. The behavior described above is observed for any T e .
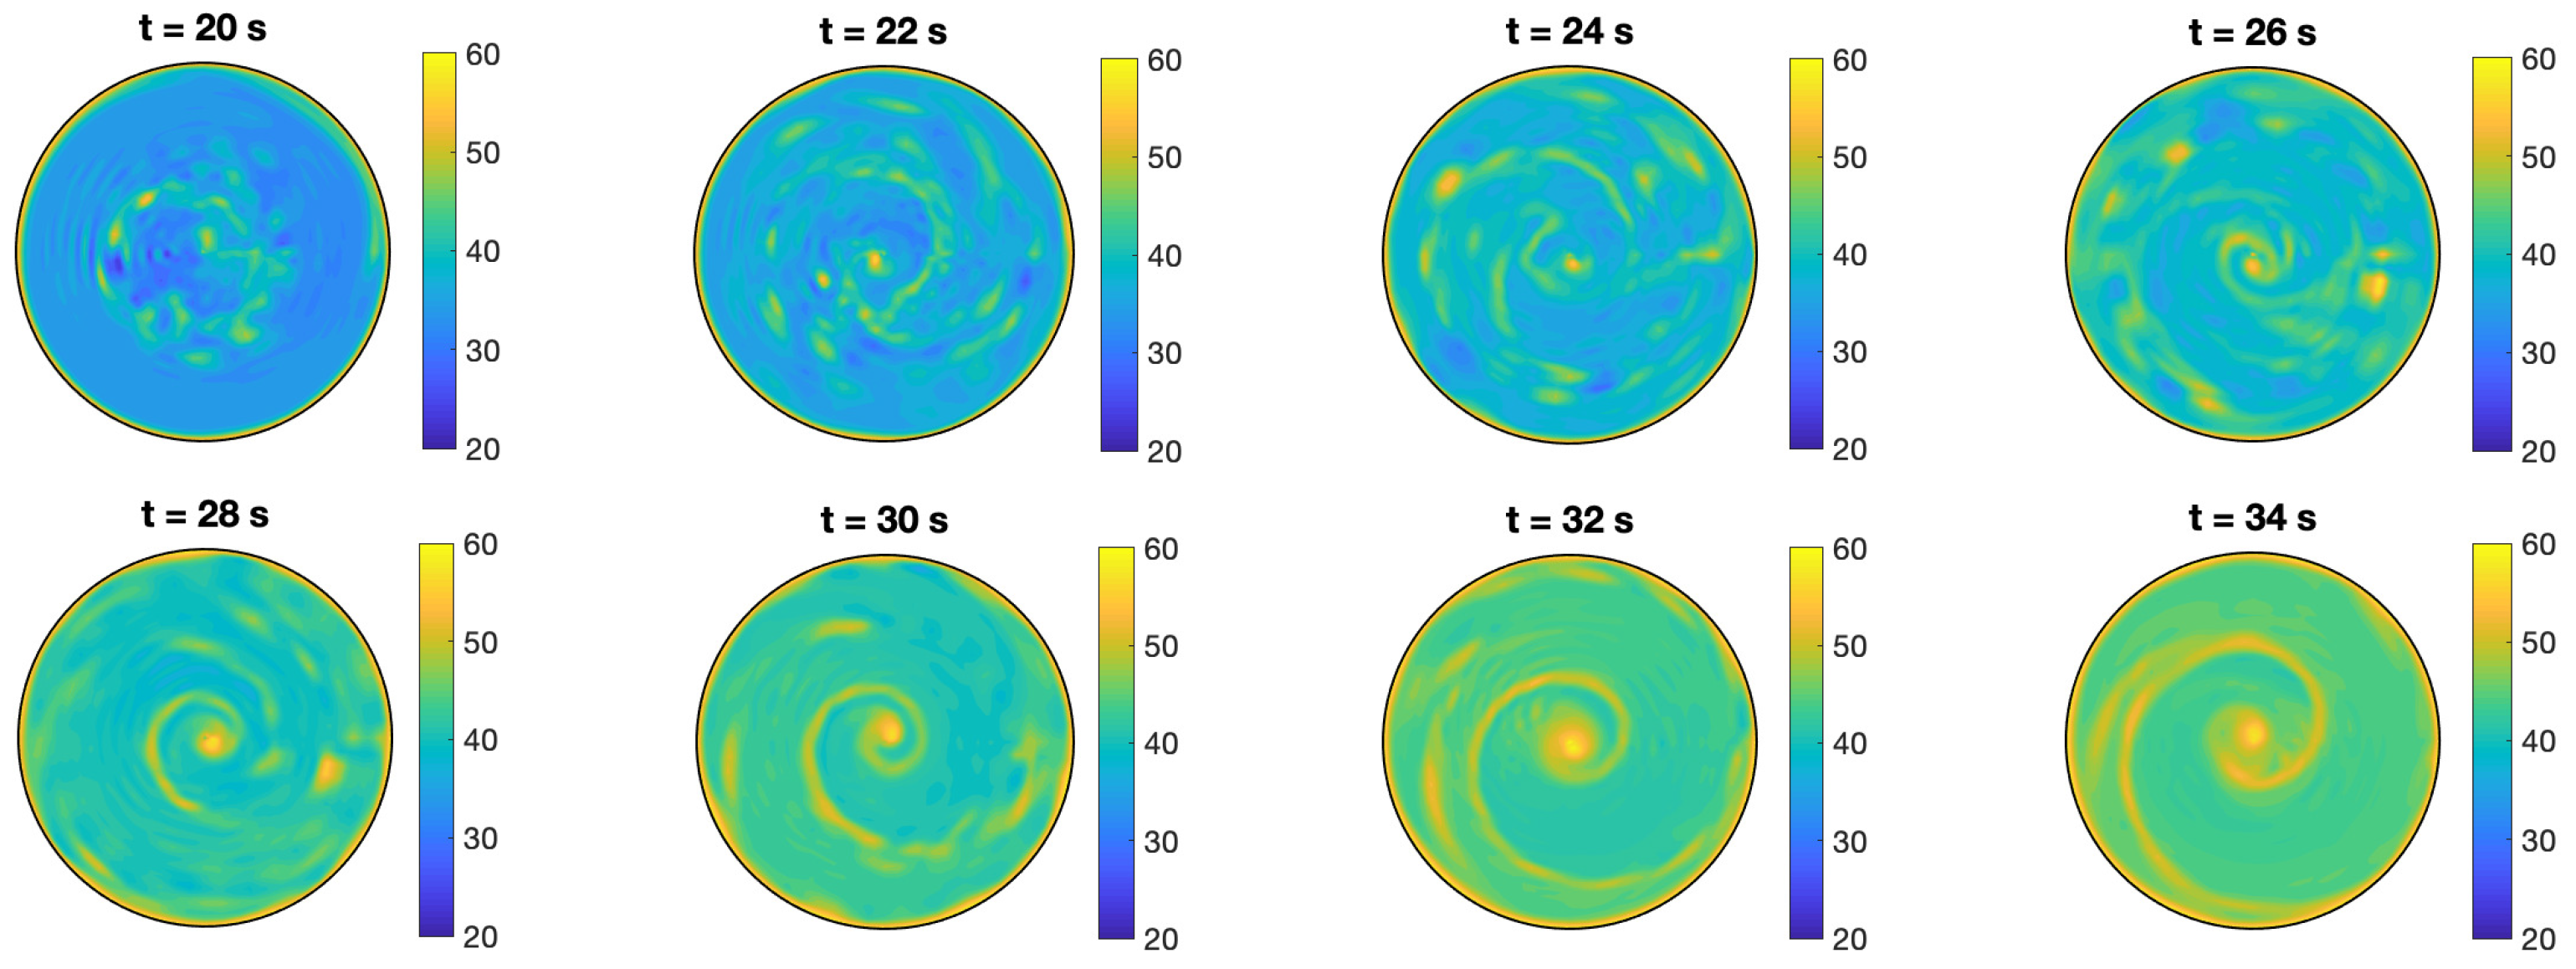
As we commented on in Section 3.1, for higher T e a disorganized distribution of hot spots along the bottom of the cell is reported in the non-rotation case. It is remarkable the effect of the rotation rate in this case. Figure 9 displays the evolution of temperature profile at z = 0.0017 m for T e = 60 °C and Ω = π 100 s 1 . In the first temporal stages, we observe a chaotic distribution of hot spots at lower levels. However, as time evolves, rotation makes the structure reorganize giving place to a spiral of hotter flow, as in the case of lower values of T e .

4. Conclusions

In this work, we studied numerically the effect of rotation during the heating process of a sample of water in a cylindrical container of height H = 0.022 m and radius R = 0.017 m, which is homogeneously heated at the bottom and at the lateral wall. This configuration is usually used in chemical devices to heat solvents by conventional heating. We use a 3D temporal model that couples heat and momentum equations based on spectral methods to perform the simulations. Results show the development, at lower levels, of a spiral thermal plume at the center of the cell moving clockwise and spreading hot flow toward the lateral wall, along which it rises to upper levels. For the largest rotation rate considered, the spiral thermal plume shows a multi-armed structure. The states lose the axisymmetry and become fully 3D earlier in time as the rotation rate increases.
As rotation increases, the fluid moves faster in the azimuthal direction but it is not observed a substantial increase in the radial and vertical velocity components that could favor the mixture of hotter and colder flows in the sample inducing a faster heating of the solvent.
For larger values of T e , corresponding to the case of an initial complex and chaotic distribution of thermal plumes at lower levels, the evolution shows as well a reorganization of the hot spots in one spiral of hotter flow.
These results are of interest for laboratory chemical experiments in order to fully understand thermal processes in conventional heating when rotation is added to the system, with a full description of temperature profiles and velocity fields.

Author Contributions

Conceptualization, methodology, software, investigation, visualization M.C.N., D.C. and H.H; writing—original draft preparation, M.C.N.; writing—review and editing, M.C.N. and D.C.; supervision, M.C.N. and H.H. All authors have read and agreed to the published version of the manuscript.

Funding

This work was partially supported by the Research Grant PID2019- 109652GB-I00 (MICINN, Spanish Government) and 2020-GRIN-28738 (Universidad de Castilla- La Mancha), which include RDEF funds.

Data Availability Statement

Not applicable.

Conflicts of Interest

The authors declare no conflict of interest.

References

  1. Bodenschatz, E.; Pesch, W.; Ahlers, G. Recent developments in Rayleigh-Benard convection. Annu. Rev. Fluid Mech. 2000, 32, 709–778. [Google Scholar] [CrossRef] [Green Version]
  2. Rudiger, S.; Feudel, F. Pattern formation in Rayleigh-Benard convection in a cylindrical container. Phys. Rev. E 2000, 62, 4927–4931. [Google Scholar] [CrossRef] [PubMed]
  3. Glatzmaier, G.A.; Coe, R.S.; Hongre, L.; Roberts, P.H. The role of the Earth’s mantle in controlling the frequency of geomagnetic reversals. Nature 1999, 401, 885–890. [Google Scholar] [CrossRef]
  4. Jones, C.A. Convection-driven geodynamo models. Philos. Trans. R. Soc. Lond. 2000, A358, 873–897. [Google Scholar] [CrossRef] [Green Version]
  5. Heimpel, M.; Aurnou, J. Turbulent convection in rapidly rotating spherical shells: A model for equatorial and high latitude jets on Jupiter and Saturn. Icarus 2007, 187, 540–557. [Google Scholar] [CrossRef]
  6. Ingersoll, A.P. Atmospheric dynamics of the outer planets. Science 1990, 248, 308–316. [Google Scholar] [CrossRef]
  7. Dunn, M.G. Convective heat transfer and aerodynamics in axial flow turbines. J. Turbomach. 2001, 123, 637–686. [Google Scholar] [CrossRef]
  8. Johnston, J.P. Effects of system rotation on turbulence structure: A review relevant to turbomachinery flows. Int. J. Rot. Mach. 1998, 4, 97–112. [Google Scholar] [CrossRef] [Green Version]
  9. Vorobieff, P.; Ecke, R.E. Turbulent rotating convection: An experimental study. J. Fluid Mech. 2002, 458, 191–218. [Google Scholar] [CrossRef]
  10. Kunnen, R.P.J.; Geurts, B.J.; Clercx, H.J.H. Experimental and numerical investigation of turbulent convection in a rotating cylinder. J. Fluid Mech. 2010, 642, 445–476. [Google Scholar] [CrossRef]
  11. Kunnen, R.P.J.; Corre, Y.; Clercx, H.J.H. Vortex plume distribution in confined turbulent rotating convection. Europhys. Lett. 2014, 104, 54002. [Google Scholar] [CrossRef] [Green Version]
  12. Lopez, J.M.; Marques, F. Instabilities of plumes driven by localized heating. J. Fluid Mech. 2013, 736, 616–640. [Google Scholar] [CrossRef] [Green Version]
  13. Navarro, M.C.; Castaño, D.; Herrero, H. Thermoconvective instabilities to explain the main characteristics of a dust devil-like vortex. Physica D 2015, 308, 109–115. [Google Scholar] [CrossRef]
  14. Devienne, R.; Fontaine, J.-R. Thermal plumes above hot sources: Characterization and capture efficiency. Mech. Ind. 2016, 17, 609. [Google Scholar] [CrossRef]
  15. Turner, J.S. Buoyant plumes and thermals. Annu. Rev. Fluid Mech. 1969, 1, 29–44. [Google Scholar] [CrossRef]
  16. Fay, J.A. Buoyant plumes and wakes. Annu. Rev. Fluid Mech. 1973, 5, 151–160. [Google Scholar] [CrossRef]
  17. List, E.J. Turbulent jets and plumes. Annu. Rev. Fluid Mech. 1982, 14, 189–212. [Google Scholar] [CrossRef]
  18. Woods, A.W. Turbulent plumes in nature. Annu. Rev. Fluid Mech. 2010, 42, 391–412. [Google Scholar] [CrossRef]
  19. Griffiths, R.W.; Campbell, I.H. Stirring and structure in mantle starting plumes. Earth. Planet Sci. Lett. 1990, 99, 66–78. [Google Scholar] [CrossRef]
  20. Kumagai, I. On the anatomy of mantle plumes: Effect of the viscosity ratio on entrainment and stirring. Earth Planet Sci. Lett. 2002, 198, 211–224. [Google Scholar] [CrossRef]
  21. Pham, M.V.; Plourde, F.; Kim, S.D. Three-dimensional characterization of a pure thermal plume. Heat Transf. 2005, 127, 624–636. [Google Scholar] [CrossRef]
  22. Plourde, F.; Pham, M.V.; Kim, S.D.; Balachandar, S. Direct numerical simulation of a rapidly expanding thermal plume: Structure and entrainment interaction. J. Fluid Mech. 2008, 604, 99–123. [Google Scholar] [CrossRef]
  23. Zhou, Q.; Xia, K. Physical and geometrical properties of thermal plumes in turbulent Rayleigh-Bénard convection. New J. Phys. 2010, 12, 075006. [Google Scholar] [CrossRef] [Green Version]
  24. Navarro, M.C.; Castaño, D.; Herrero, H. Thermal plumes in water under conventional heating: In silico experiments. Int. Commun. Heat Mass Transf. 2020, 119, 104946. [Google Scholar] [CrossRef]
  25. Cagney, N.; Newsome, W.H.; Bertelloni, C.L.; Cotel, A.; Hart, S.R.; Whitehead, J.A. Temperature and velocity measurements of a rising thermal plume. Geoche. Geophys. Ceosyst. 2015, 16, 579–599. [Google Scholar] [CrossRef] [Green Version]
  26. Khrapunov, E.; Chumakov, Y. Structure of the natural convective flow above to the horizontal surface with localized heating. Int. J. Heat Mass Transf. 2020, 152, 119492. [Google Scholar] [CrossRef]
  27. Rossby, H.T. A study of Bénard convection with and without rotation. J. Fluid Mech. 1969, 36, 309–335. [Google Scholar] [CrossRef]
  28. Navarro, M.C.; Diaz-Ortiz, A.; Prieto, P.; de la Hoz, A. A Spectral Numerical Model and an Experimental Investigation on Radial Microwave Irradiation of Water an Ethanol in a Cylindrical Vessel. Appl. Math. Model. 2019, 66, 680–694. [Google Scholar] [CrossRef]
  29. Batchelor, C.K. An Introduction to Fluid Dynamics; Cambridge University Press: Cambridge, UK, 1967. [Google Scholar]
  30. Chandrasekar, S. Hydrodynamic and Hydromagnetic Stability; Dover Publications: New York, NY, USA, 1981. [Google Scholar]
  31. Mercader, I.; Batiste, O.; Alonso, A. An efficient spectral code for incompressible flows in cylindrical geometries. Comput. Fluids 2010, 73, 215–224. [Google Scholar] [CrossRef]
  32. Castaño, D.; Navarro, M.C.; Herrero, H. Double vortices and single-eyed vortices in a rotating cylinder under thermal gradients. Comp. Math. Appl. 2017, 73, 2238–2257. [Google Scholar] [CrossRef]
  33. Faghri, A.; Zhang, Y. Advanced Heat and Mass Transfer; Global Digital Press: Columbia, MO, USA, 2010. [Google Scholar]
  34. Vargaftik, N.B. Handbook of Physical Properties of Liquids and Gases; Hemisphere: New York, NY, USA, 1975. [Google Scholar]
  35. Kondrashov, A.; Sboev, O.; Dunaev, P. Heater shape effects on thermal plume formation. Int. J. Therm. Sci. 2017, 122, 85–91. [Google Scholar] [CrossRef]
  36. Zhong, F.; Ecke, R.E.; Steinberg, V. Rotating Rayleigh-Bénard convection: Asymmetric modes and vortex states. J. Fluid Mech. 1993, 249, 135–159. [Google Scholar] [CrossRef]
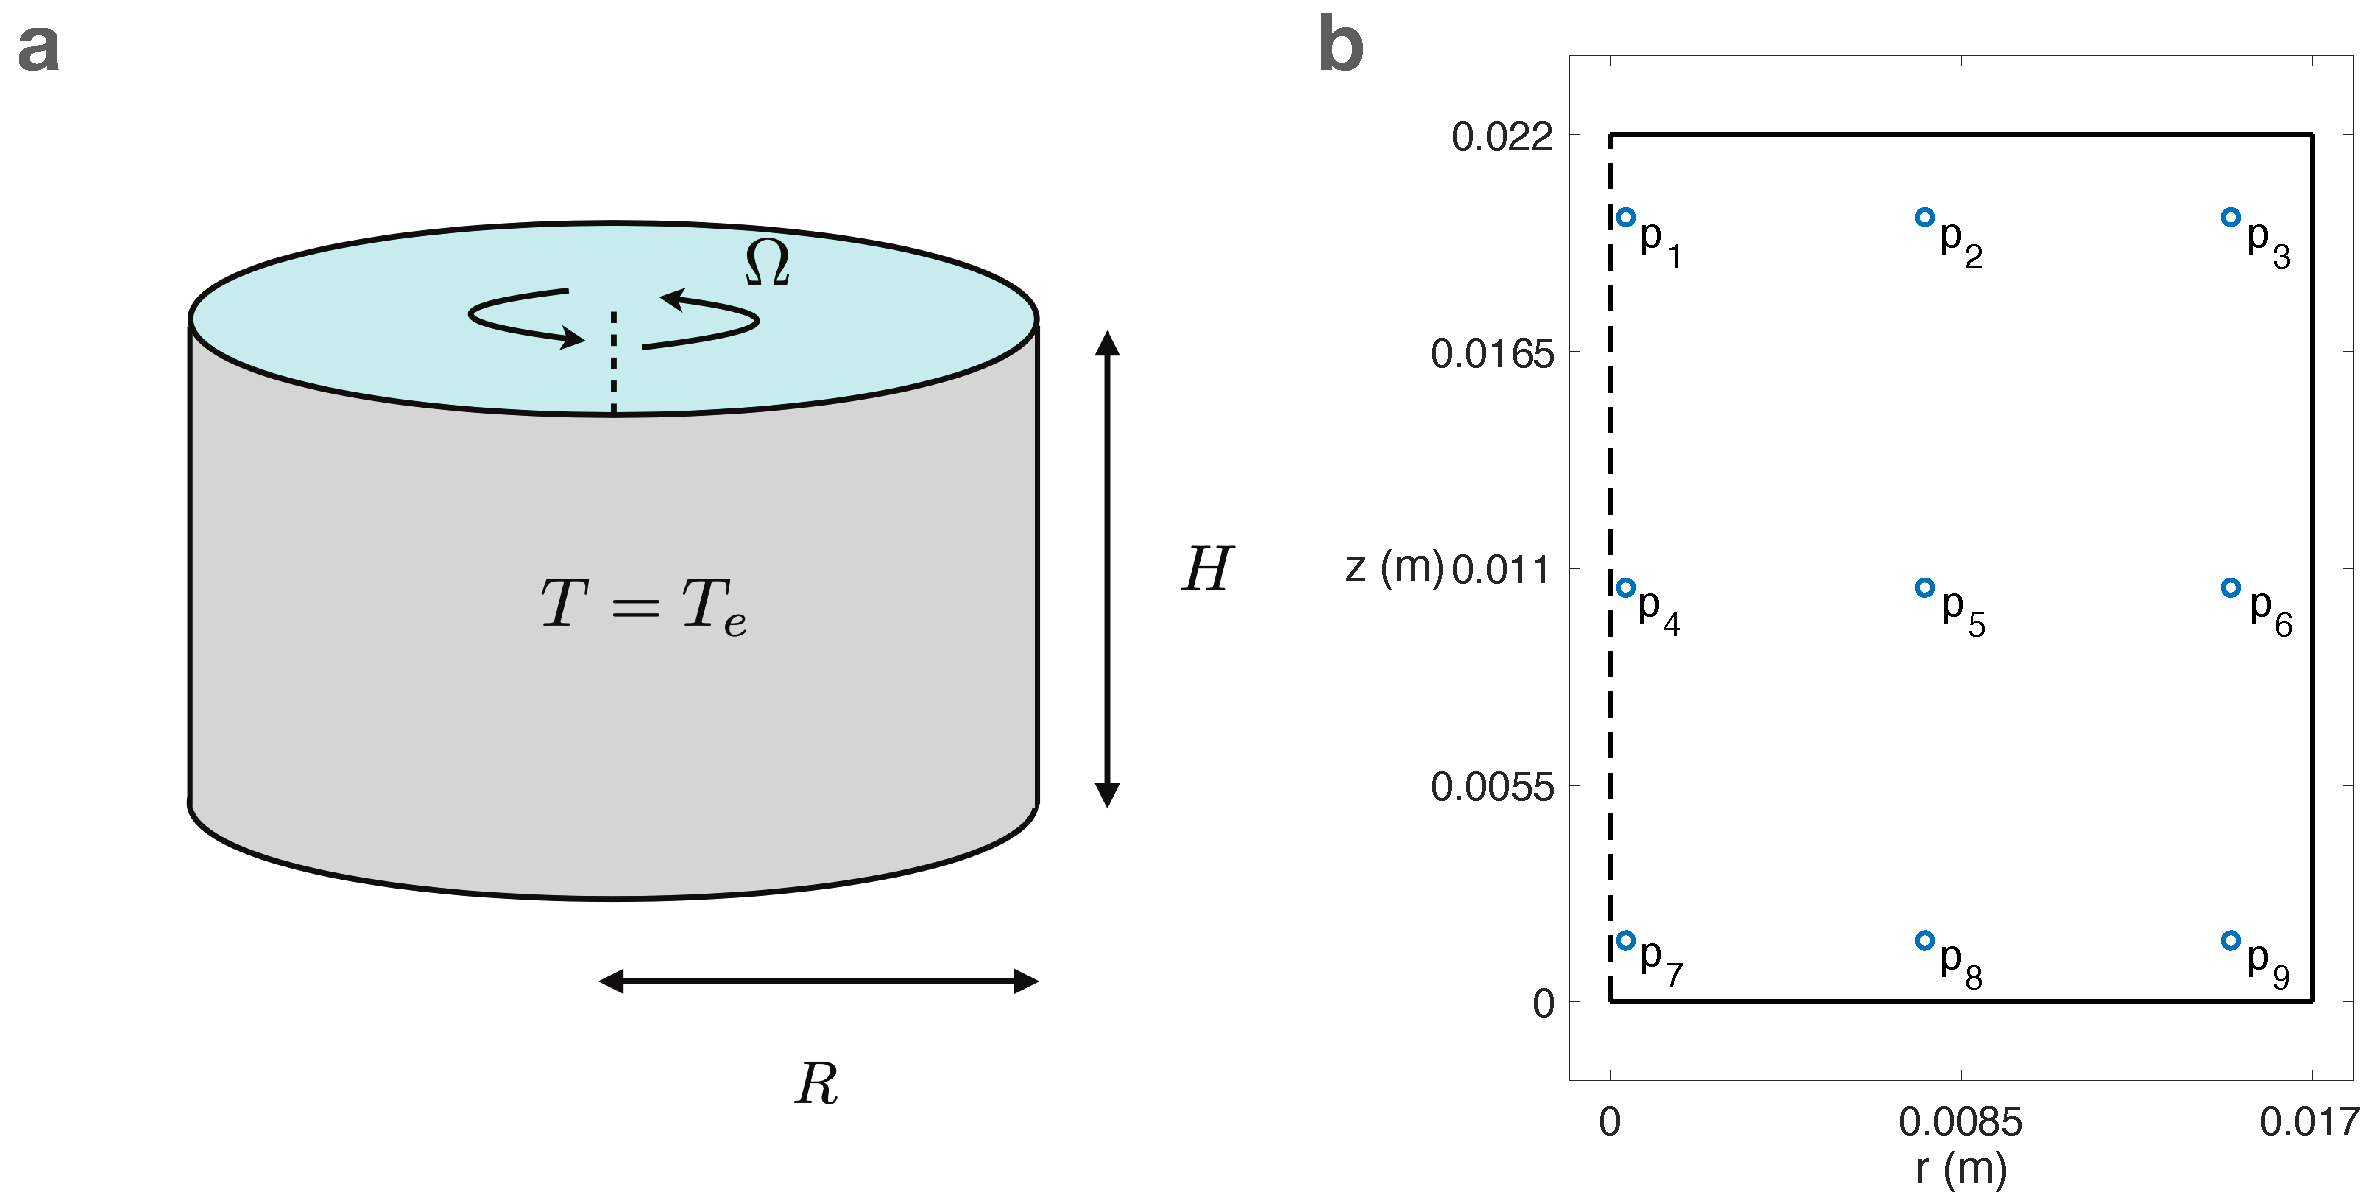
Figure 1. (a) Numerical setup; (b) Distribution of monitored points in the slice ϕ = 0 of the sample.
Mathematics 10 01052 g001
Figure 2. Diagram of the state-character varying the rotation rate Ω and t, for T e = 40 °C. The shaded region corresponds to the zone where fully 3D states develop.
Mathematics 10 01052 g002
Figure 3. Spectral decomposition of the kinematic energy E K with the azimuthal wave number k for different values of Ω . (a) Ω = 0 s 1 . (a 1 ) Kinematic energy for k = 0 ; (a 2 ) Kinematic energy for k 1 ; (b) Ω = π 120 s 1 . (b 1 ) Kinematic energy for k = 0 ; (b 2 ) Kinematic energy for k 1 ; (c) Ω = π 100 s 1 . (c 1 ) Kinematic energy for k = 0 ; (c 2 ) Kinematic energy for k 1 ; (d) Ω = π 80 s 1 . (d 1 ) Kinematic energy for k = 0 ; (d 2 ) Kinematic energy for k 1 ; (e) Ω = π 60 s 1 . (e 1 ) Kinematic energy for k = 0 ; (e 2 ) Kinematic energy for k 1 .
Mathematics 10 01052 g003
Figure 4. Contour of the predicted temperature at t = 40 s for the case Ω = 0 s 1 . (a) T e = 40 °C. (a 1 ) Top view at z = 0.0017 m; (a 2 ) r z section at ϕ = 0 ( ϕ = π ) ; (b) T e = 60 °C. (b 1 ) Top view at z = 0.0017 m; (b 2 ) r z section at ϕ = 0 ( ϕ = π ) .
Mathematics 10 01052 g004
Figure 5. Contour of the predicted temperature, velocity field and streamlines for a top view at z = 0.0017 m for T e = 40 °C. (a) Ω = π 100 s 1 . (a 1 ) t = 10 s; (a 2 ) t = 30 s; (a 3 ) t = 50 s; (a 4 ) t = 70 s; (b) Ω = π 60 s 1 . (b 1 ) t = 10 s; (b 2 ) t = 30 s; (b 3 ) t = 50 s; (b 4 ) t = 70 s.
Mathematics 10 01052 g005
Figure 6. Contour of the predicted temperature, velocity field and streamlines in the r z plane at ϕ = 0 ( ϕ = π ) for T e = 40 °C. (a) Ω = π 100 s 1 . (a 1 ) t = 10 s; (a 2 ) t = 30 s; (a 3 ) t = 50 s; (a 4 ) t = 70 s; (b) Ω = π 60 s 1 . (b 1 ) t = 10 s; (b 2 ) t = 30 s; (b 3 ) t = 50 s; (b 4 ) t = 70 s.
Mathematics 10 01052 g006
Figure 7. Time evolution of the temperature T in the monitored points of Figure 1b for T e = 40 °C for different values of the rotation rate Ω . (a) Temperature profiles for point p 1 ; (b) Temperature profiles for point p 2 ; (c) Temperature profiles for point p 3 ; (d) Temperature profiles for point p 4 ; (e) Temperature profiles for point p 5 ; (f) Temperature profiles for point p 6 ; (g) Temperature profiles for point p 7 ; (h) Temperature profiles for point p 8 ; (i) Temperature profiles for point p 9 .
Mathematics 10 01052 g007
Figure 8. (a) Time evolution of the average velocity | u a | and the average radial ( | u r | ), azimuthal ( | u ϕ | ) and vertical ( | u z | ) velocity for T e = 40 °C and different values of the rotation rate Ω . (a) Ω = 0 s 1 ; (b) Ω = π 120 s 1 ; (c) Ω = π 100 1 ; (d) Ω = π 80 s 1 ; (e) Ω = π 60 1 .
Mathematics 10 01052 g008
Figure 9. Contour of the predicted temperature for a top view at z = 0.0017 m for T e = 60 °C and Ω = π 100 s 1 at different times.
Mathematics 10 01052 g009
Table 1. Input parameters for water used for computations [33,34].
ParameterValue
Density, ρ 0 (kg/m 3 )993
Conductivity, κ (W/(m °C)) 0.63
Specific heat, C p (J/(kg °C))4179
Kinematic viscosity, ν (m 2 /s) 6.5 × 10 7
Volumetric expansion coefficient, α (°C 1 ) 2.14 × 10 4
Initial temperature, T 0 (°C)20
Bath temperature, T e (°C)40–60
Rotation rate, Ω (s 1 ) π 120 , π 100 , π 80 , π 60
Publisher’s Note: MDPI stays neutral with regard to jurisdictional claims in published maps and institutional affiliations.