


Abstract
Many papers on fuzzy risk analysis calculate the similarity between fuzzy numbers. Usually, they use symmetric and reflexive similarity measures between parameters of fuzzy sets or “centers of gravity” of generalized fuzzy numbers represented by real numbers. This paper studies bipolar similarity functions (fuzzy relations) defined on a domain with involutive (negation) operation. The bipolarity property reflects a structure of the domain with involutive operation, and bipolar similarity functions are more suitable for calculating a similarity between elements of such domain. On the set of real numbers, similarity measures should take into account symmetry between positive and negative numbers given by involutive negation of numbers. Another reason to consider bipolar similarity functions is that these functions define measures of correlation (association) between elements of the domain. The paper gives a short introduction to the theory of correlation functions defined on sets with an involutive operation. It shows that the dissimilarity function generating Pearson’s correlation coefficient is bipolar. Further, it proposes new normalized similarity and dissimilarity functions on the set of real numbers. It shows that non-bipolar similarity functions have drawbacks in comparison with bipolar similarity functions. For this reason, bipolar similarity measures can be recommended for use in fuzzy risk analysis. Finally, the correlation functions between numbers corresponding to bipolar similarity functions are proposed.
Keywords:
similarity; fuzzy relation; correlation between numbers; bipolarity; fuzzy risk assessment model MSC:
62H20; 91B30
1. Introduction
Risk assessment is a significant step of risk analysis, which involves identifying, analyzing, and controlling, hazards and risks, which are detrimental to the process under investigation. This allows predicting critical issues that can be addressed to avoid serious consequences [1]. In risk assessment, both quantitative and qualitative factors can arise, consequently, these kinds of models should be able to handle both of them. For this reason, an approach is needed which can handle both types of risk factors. Fuzzy logic is a useful technique to address the above problem. Its great advantage of being able to handle uncertainties, subjectivities in inputs and in the evaluation process with the help of fuzzy set theory [2,3].
Many papers on fuzzy risk analysis are based on similarity measures of generalized fuzzy numbers or parametric trapezoidal and triangular fuzzy sets [4,5,6,7,8,9,10,11]. These measures usually calculate the similarity between n-tuples of real-valued parameters defining fuzzy sets or some properties of fuzzy sets; for example, some “centers of gravity” of generalized fuzzy numbers can be used. From similarity measures used in fuzzy risk assessment models, it is usually required that they satisfy the properties of symmetry and reflexivity. These properties are very natural requirements on any similarity measures, but it would be interesting also to require from similarity measures other properties reflecting the general properties of the domain data. From similarity measures defined on the set of real values or on the set of n-tuples of real values, it is reasonable to require that these measures will take into account the symmetry between positive and negative numbers. Generally, such symmetry of the domain data exists for different types of data and can be represented by some involutive operation defined on the domain.
This paper studies bipolar similarity functions defined on a domain with involutive (negation) operation. The bipolarity property reflects some structure of the domain related to involutive operation, and bipolar similarity functions are more suitable for calculating a similarity between elements of such domain. On the set of real numbers, similarity measures should take into account symmetry between positive and negative numbers given by involutive mapping of positive numbers into negative numbers and vice versa. Such mapping can be obtained as a result of the multiplication of numbers by −1.
Another reason to consider bipolar similarity functions is that these functions define measures of correlation (association) between elements of the domain. The paper gives a short introduction to the theory of correlation functions (association measures) defined on sets with involutive operation [12,13,14,15,16,17,18,19]. The correlation function (association measure) is defined on such sets as a function satisfying several simple properties. One of these properties includes involutive operation defined on the set. It was shown that most of the correlation and association coefficients introduced in statistics during more than one hundred years satisfy these properties after a suitable definition of involutive operation on the domain set. It was proposed several general methods of construction of such correlation functions using suitable similarity and dissimilarity functions. One of the important results obtained in [19] establishes the one-to-one correspondence between bipolar similarity or dissimilarity functions (fuzzy similarity or dissimilarity relations) and correlation functions.
In this paper, we show that the dissimilarity function generating Pearson’s correlation coefficient is bipolar. Further, we propose new normalized similarity and dissimilarity functions on the set of real numbers. It is shown that non-bipolar similarity functions have drawbacks in comparison with bipolar similarity functions. For this reason, bipolar similarity measures can be recommended for use in fuzzy risk assessment models. Finally, correlation functions between numbers corresponding to bipolar similarity functions are proposed.
The paper has the following structure. Section 2 presents the basic results of the theory of correlation functions (association measures). Section 2.1 gives the definition of correlation functions (association measures) on sets with involutive operations. Section 2.2 describes the main properties of similarity and dissimilarity functions (fuzzy relations) related to the involutive operation defined on the domain. Section 2.3 describes the main methods of construction of correlation functions using similarity and dissimilarity functions. Section 3 contains the main results relating bipolar similarity and dissimilarity functions with correlation functions on the sets of real n-tuples and real numbers. Section 4 describes an application of bipolar dissimilarity and similarity correlation in Risk Assessment. Conclusions and discussions are given in Section 5.
2. Materials and Methods
2.1. Correlation Functions (Association Measures)
The concept of correlation function (association measure) was introduced and studied in [12,13,14,15,16,17,18,19]. Let be a nonempty set. A function is called a reflection or a negation on a set if it satisfies for all x in the involutivity property:
and is not an identity function, i.e., for some x in . An element x in such that is called a fixed point and the set of all fixed points of the negation N on is denoted as or .
Let N be a negation on , and V be a nonempty subset of closed under N, i.e., for all x in it is fulfilled . An association measure (correlation function) on is a function satisfying for all x, y in V the properties:
From A1–A3 it follows that the correlation function satisfies for all x, y in V the following properties:
The last two properties follow one from another for any function of two arguments defined on V.
Example 1.
It is shown [12,13,14,15,16,17,18,19] that most of the known in statistics correlation and association coefficients [20,21,22,23,24,25,26] satisfy these properties on specific domainwith suitably defined involution operation. Let us show that Pearson’s linear correlation coefficient satisfies A1–A3. Letbe the set of real-valued n-tuples. Define negation operation onas follows:This operation is involutive:with a unique fixed point, due to. Consider the setof non-constant n-tuples, such thatfor any real c. The Pearson’s linear correlation coefficient is defined on V as follows:
where, , , . It is clear that Pearson’s correlation coefficient satisfies properties A1 and A2. To check the fulfillment of A3 consider. We haveand finally:
2.2. Similarity and Dissimilarity Functions (Fuzzy Relations)
Let be a nonempty set with negation N, and V be a nonempty subset of closed under N. A function is called a similarity function (fuzzy similarity relation) on if it satisfies for all x, y in V the properties [18]:
A similarity function is called:
co-symmetric if for all x, y in V it holds:
consistent if for all x in V it holds:
bipolar if for all x, y in V it holds:
Dually, consider dissimilarity function (fuzzy dissimilarity relation) satisfying for all x, y in V the properties:
Dissimilarity function is called:
co-symmetric if for all x, y in V it holds:
consistent if for all x in V it holds:
bipolar if for all x, y in V it holds:
Similarity and dissimilarity functions are called dual if for all x, y in V it holds:
Proposition 1.
The similarity function satisfies one of the properties S3–S6 if and only if the dual dissimilarity function satisfies the corresponding property from D3–D6.
Proposition 2
[19]. If the similarity (dissimilarity) function is bipolar, then it is co-symmetric and consistent.
Due to duality, for a specific domain V, one can consider only one of the functions (fuzzy relations) S or D, but generally, it is convenient to consider both of them.
2.3. Constructing Correlation Functions from Similarity and Dissimilarity Functions
The main results on the construction of correlation functions from similarity functions are obtained in [13,14,15,19].
Theorem 1.
Let be a nonempty set with a reflection N, and V be a nonempty subset of closed under N. Let S be a co-symmetric and consistent similarity function on V, then the following function is an association measure (correlation function) on V:
Dually, if D is a co-symmetric and consistent dissimilarity function on V, then the following function is an association measure (correlation function) on V:
Let us prove, for example, that the function in (12) takes values in [–1, 1]. Since D takes values in [0, 1], has the maximal value when has the maximal possible value 1 and has the minimal possible value 0. In this case , that happens, for example, when . has the minimal value when has the minimal possible value 0 and has the maximal possible value 1. In this case , that happens, for example, when .
In [19] it was established a one-to-one correspondence between correlation functions and bipolar similarity functions. Due to the importance of this result for our research, we give here the proof of the corresponding theorem.
Theorem 2.
Let be a nonempty set with a reflection N, and V be a nonempty subset of closed under N. Let S be a bipolar similarity function on V, then the following function is a correlation function on V:
Let A be a correlation function on V, then the function
is a bipolar similarity function on V. Dually, if D is a bipolar dissimilarity function on V, then the following relations establish a one-to-one correspondence between correlation functions and bipolar dissimilarity functions on V:
Proof.
From the symmetry and reflexivity of S, it follows the symmetry A1 and the reflexivity A2 of A in (13). From the bipolarity S6 of S, we obtain and hence the inverse relationship A3 of A in (13):
If A is a correlation function, then from symmetry and reflexivity of A we obtain the symmetry and reflexivity of S in (14). From the inverse relationship A3 of A, we obtain for similarity function S in (14):
and from follows the bipolarity S6 of S.
The dual results for bipolar dissimilarity function D follow from (10), (13), (14). □
The dual bipolar similarity and dissimilarity functions, such that , together with a correlation function A related by (13)–(16) are called complementary to each other and compose complementary (or correlation) triplet (S, D, A) [19]. The functions , and from the complementary triplet (S, D, A) are also related as follows [19]:
This formula has clear interpretations:
- (a)
- Correlation between x and y is positive if the similarity between x and y is greater than the dissimilarity between them. In the opposite case, the correlation between x and y is negative.
- (b)
- Correlation between x and y is positive if they are “similar” and negative if they are “different”.
From (13), it follows that the correlation function is nothing else but rescaled bipolar similarity function. For this reason, a correlation function satisfying A1–A3 will also be referred to as a similarity correlation function. Note also that the formula (15) can be considered as a generalization of Spearman’s rank correlation coefficient on any domain with involutive negation and bipolar dissimilarity function.
The proposed approaches to the definition and construction of correlation functions on a set with involutive operation using (dis)similarity functions give a new look at correlation coefficients. The concept of correlation (association) coefficient developed in statistics can be extended now on any set with involutive operation if we can introduce a suitable similarity or dissimilarity function on this set. Such an approach to the construction of correlation functions gives new tools for discovering interesting relationships in data [27,28]. Similarity measures used in pattern recognition and machine learning can be used for the representation of new, correlation-like relationships in data.
In the following Sections we will use the method of construction of dissimilarity functions from Minkowsky distances proposed in [18] and considered below.
Let F be a transformation of elements x of some set into n-tuples . This transformation is called a p-transformation (p-standardization) for some real if it satisfies the following property:
Proposition 3
[18]. Let F(x) be a p-transformation of elements of the set into n-tuples then the function
is a dissimilarity function (metric) on , i.e., it takes values in [0, 1], it is symmetric (D1) and irreflexive (D2).
From this Proposition, it follows that the following functions are dissimilarity functions for and , respectively:
Additionally to the methods of construction of dissimilarity and similarity functions considered in [18] one can obtain these functions from a metric as follows:
In the following section, we describe the bipolar dissimilarity function complementary to Pearson’s correlation coefficient, and based on Theorems 1 and 2, we introduce correlation functions between numbers.
3. Results
3.1. Constructing Pearson’s Linear Correlation Coefficient Using Bipolar Dissimilarity Function
For the notations and details used here, see Example 1.
Proposition 4.
Letbe a set of real-valued n-tuples with involution operation . The following function D on the set of non-constant n-tuples is a bipolar dissimilarity function complementary to Pearson’s correlation coefficient:
Proof.
The transformation: , is a p-transformation (with p = 2) of n-tuples from V because it satisfies the condition: . Hence, from (19), it follows that (20) is a dissimilarity function.
Let us show that is bipolar. We have:
In the obtained formula
replace y by and from obtain:
Finally, obtain bipolarity of D:
From (15) and (21) obtain Pearson’s correlation coefficient:
□
Really, the property of bipolarity of the dissimilarity function (20) is surprising because, in the definition of this function, the concept of negation of n-tuples is not used! From the theoretical results of the new theory of correlation functions (association measures) developed in [12,13,14,15,16,17,18,19] and from our previous results, it was shown that Pearson’s correlation coefficient could be constructed from (20) by the method given in Theorem 1 due to (20) satisfies co-symmetry and consistency properties. The bipolarity is more strong property than these two properties together, and in Proposition 4, it is shown that bipolarity is also fulfilled for (20). Pearson’s correlation plays an important role in statistics [26]. Proposition 4 gives a new look at this correlation coefficient.
Theorem 2 is also important because sometimes it is easier to check the fulfillment of one bipolarity property than two properties of co-symmetry and consistency for potential similarity or dissimilarity functions as required in Theorem 1. Both Theorems we use further for the construction of the correlation of numbers. Note that Theorem 1 is a part of a more general theorem [13,14,15] where instead of difference operation in (11), it uses pseudo-difference operation associated to t-conorm.
3.2. Non-Bipolar Similarity, Dissimilarity, and Correlation Functions for Real Numbers
On the set of real numbers, , consider negation: . It has the fixed point , because ; for this reason, we define similarity, dissimilarity, and correlation functions on the set . Note that in the fixed point the consistency and reflexivity properties are incompatible due to: , and .
Proposition 5.
The function
is a co-symmetric and consistent dissimilarity function on , generating by Theorem 1 the following correlation function on the set:
Proof.
It is clear that , D is symmetric and irreflexive.
From obtain .
D is co-symmetric: .
D is consistent: .
Using (12) in Theorem 1, obtain from D the correlation function (23):
Note that dually to D, we obtain a co-symmetric and consistent similarity function:
According to Theorem 1, this similarity function will generate the same correlation function (23) as follows: □
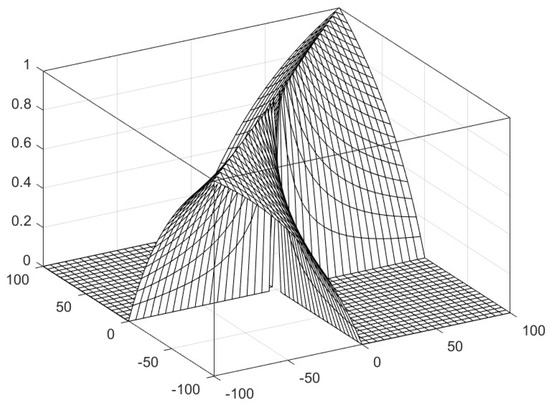
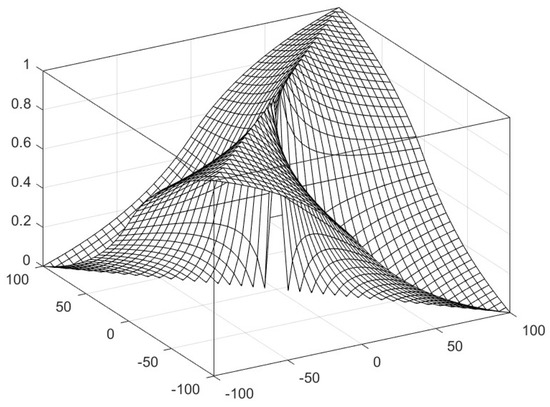
The shape of the similarity function (24) for the numbers from the set is depicted in Figure 1. The main diagonal due to the reflexivity has the maximal values . Due to the symmetry property, the shape is symmetric with respect to the vertical plane passing through the main diagonal. Due to the co-symmetry property, the shape of the similarity function is symmetric with respect to the vertical plane passing through the second diagonal.
Figure 1.
The similarity function (24) on the set of real numbers [−100,100]\{0}.
Below we show that the correlation function (23) can be obtained from another pair of dual co-symmetric and consistent similarity and dissimilarity functions.
Proposition 6.
The function
is a co-symmetric and consistent similarity function on , generating by Theorem 1 the correlation function (23).
Proof.
It is clear that , S is symmetric and reflexive.
From obtain .
S is co-symmetric: .
S is consistent: .
Using Theorem 1, we obtain from S the correlation function (23):
Dually to S, we obtain a co-symmetric and consistent dissimilarity function:
According to Theorem 1 this dissimilarity function generates the same correlation function (23). □
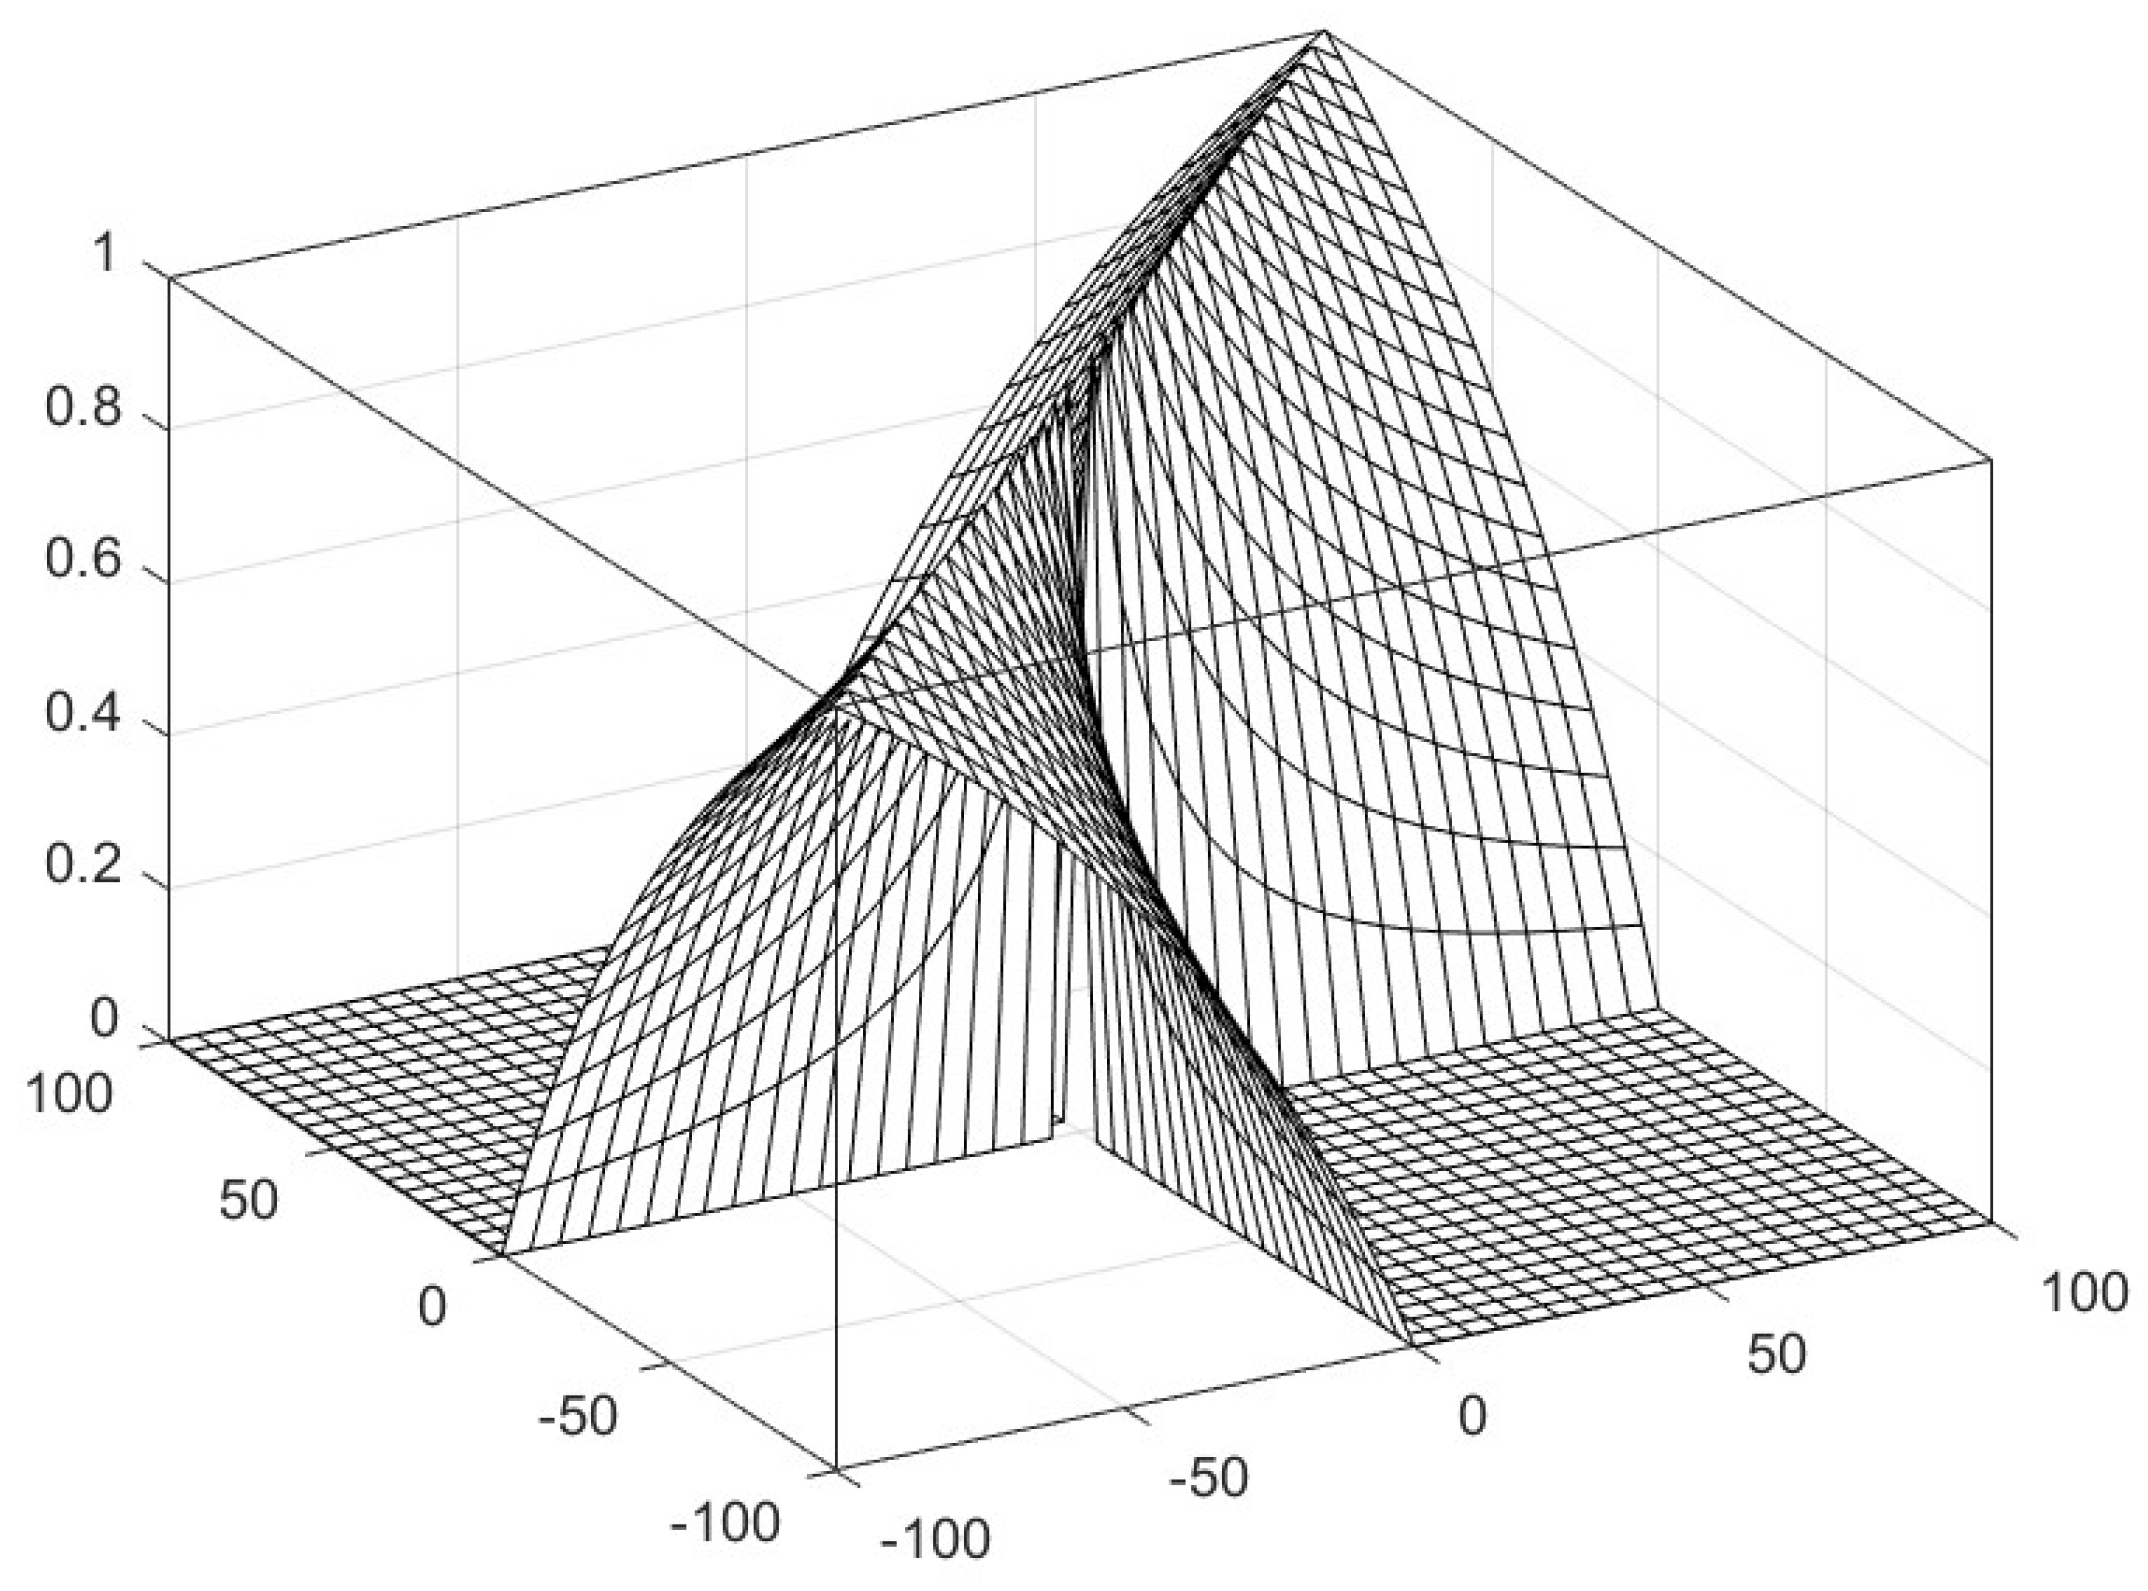
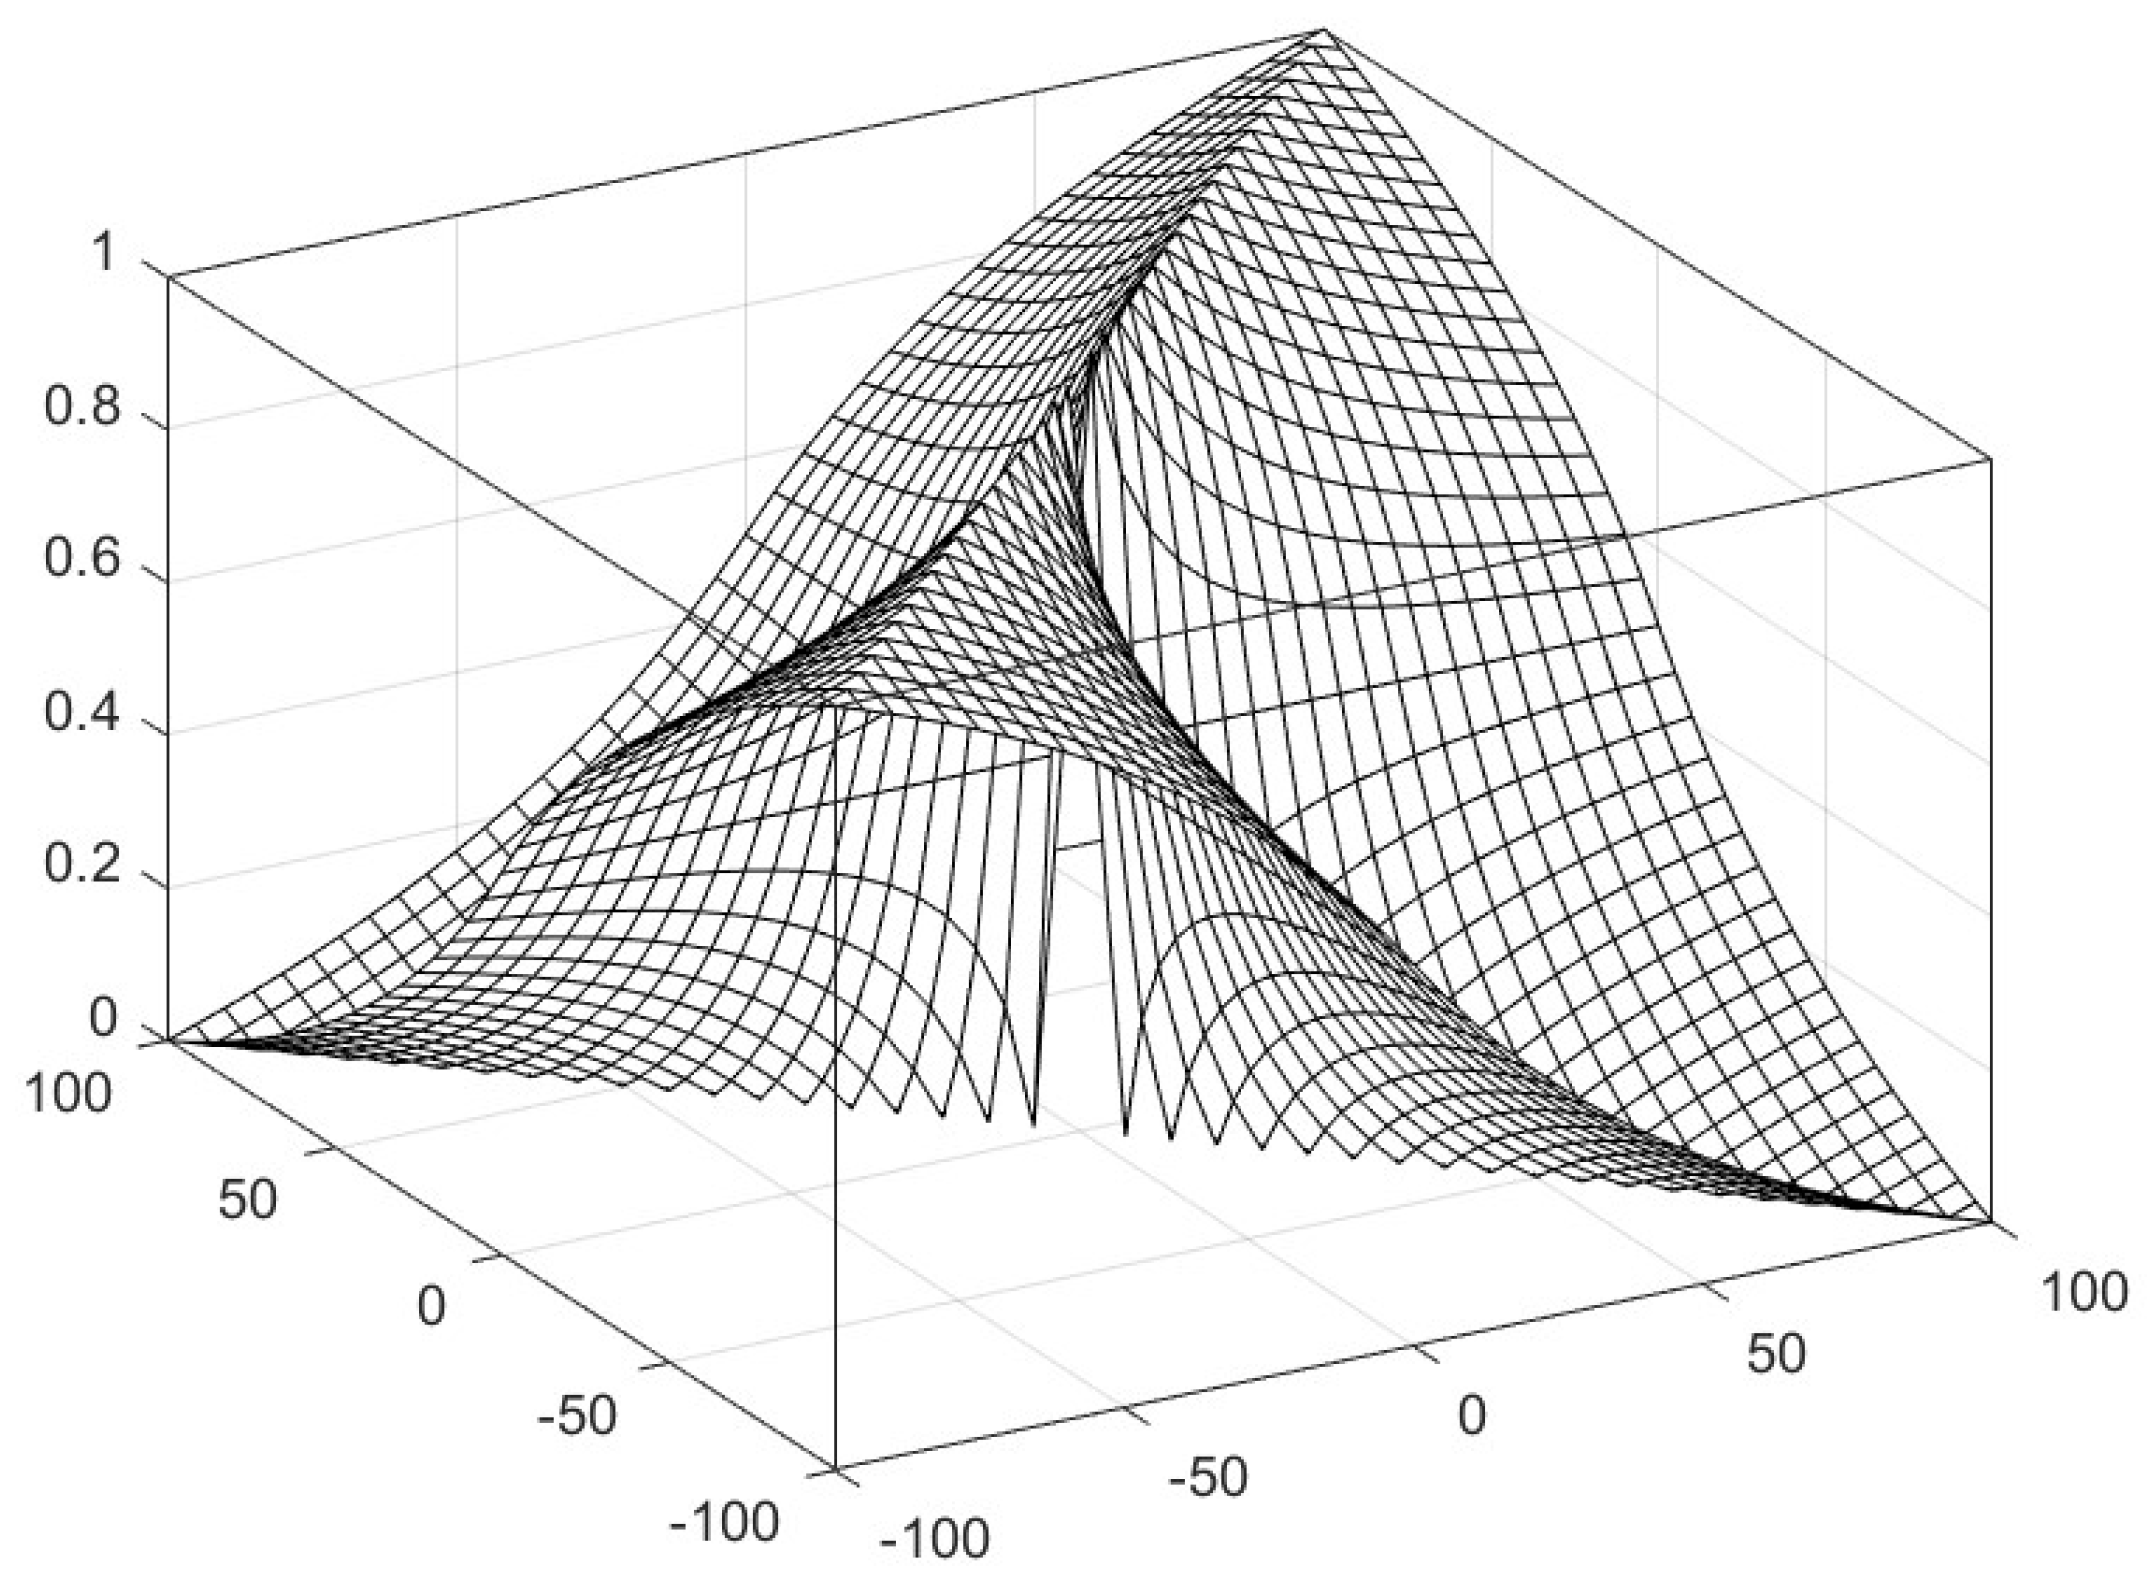
The shape of the similarity function (25) for the numbers from the set is depicted in Figure 2.
Figure 2.
The similarity function (25) on the set of real numbers [−100,100]\{0}.
Note that dissimilarity and similarity functions (22), (24)–(26) are not bipolar. To construct from them a correlation function, we need to use the formulas from Theorem 1. This is an interesting result that the same correlation function (23) can be generated by different non-bipolar similarity and dissimilarity functions. According to Theorem 2, we can find bipolar similarity and dissimilarity functions complementary to correlation function (23) and generating it by (13) and (15).
Proposition 7.
The correlation function (23) has the following dual complementary bipolar similarity and dissimilarity functions:
Proof.
Obtain (27) and (28) from (23) and from (14) and (16), respectively.
S is bipolar: .
Dually show that D is also bipolar. □
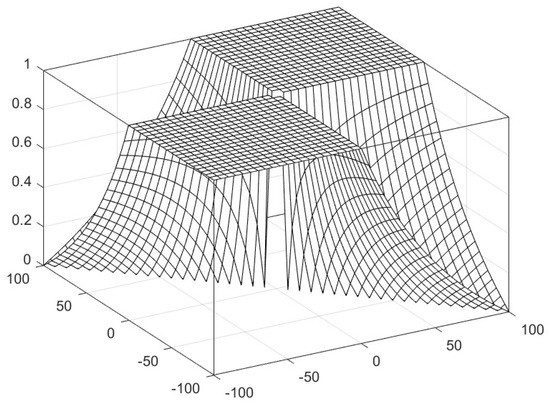
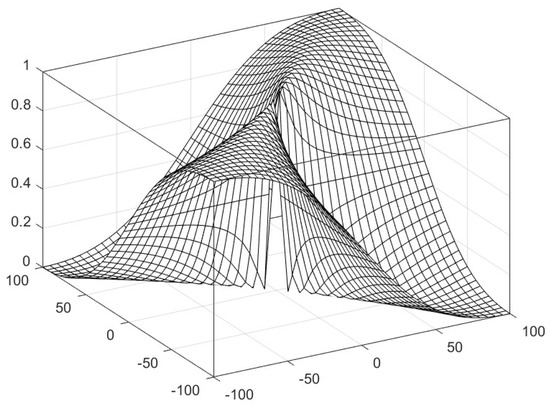
The shape of the bipolar similarity function (27) for the numbers from the set is depicted in Figure 3.
Figure 3.
The bipolar similarity function (27) on the set of real numbers [−100,100]\{0}.
As we can see, the similarity measures (24) and (25) presented in Figure 1 and Figure 2 have the following drawbacks compared to the bipolar similarity function (27) presented in Figure 3.
The similarity function (24) presented in Figure 1 has large non-monotonic sections such that if , and if , , i. e. it is not sensitive to the change of values of x and y within these sections. Indeed, if , then in (24) we have:
Similarly, we obtain if , .
Comparing the similarity function (25) presented in Figure 2 with the bipolar similarity function (27) presented in Figure 3, we see that the similarity function (25) also has large non-monotonic sections such that if , and if , i.e., when both x and y are negative or both are positive. Indeed, when both x and y are negative, or both are positive, we have in (25):
3.3. Bipolar Similarity, Dissimilarity, and Correlation Functions for Real Numbers
In this section, we find simple bipolar similarity and dissimilarity functions together with correlation function from a complementary triplet (S, D, A).
Let be a set of real numbers. Consider negation N on : . It has a unique fixed point .
Proposition 8.
The functions
are dual bipolar dissimilarity and similarity functions on, generating by Theorem 2 the complementary correlation function:
Proof.
It is clear that , D is symmetric and irreflexive. Let us show the bipolarity of D:
From and the bipolarity of D, it follows that , i.e., D is a bipolar dissimilarity function.
Dually to D, we obtain the bipolar similarity function (30):
Using this bipolar similarity function S, obtain from (13) a correlation function:
□
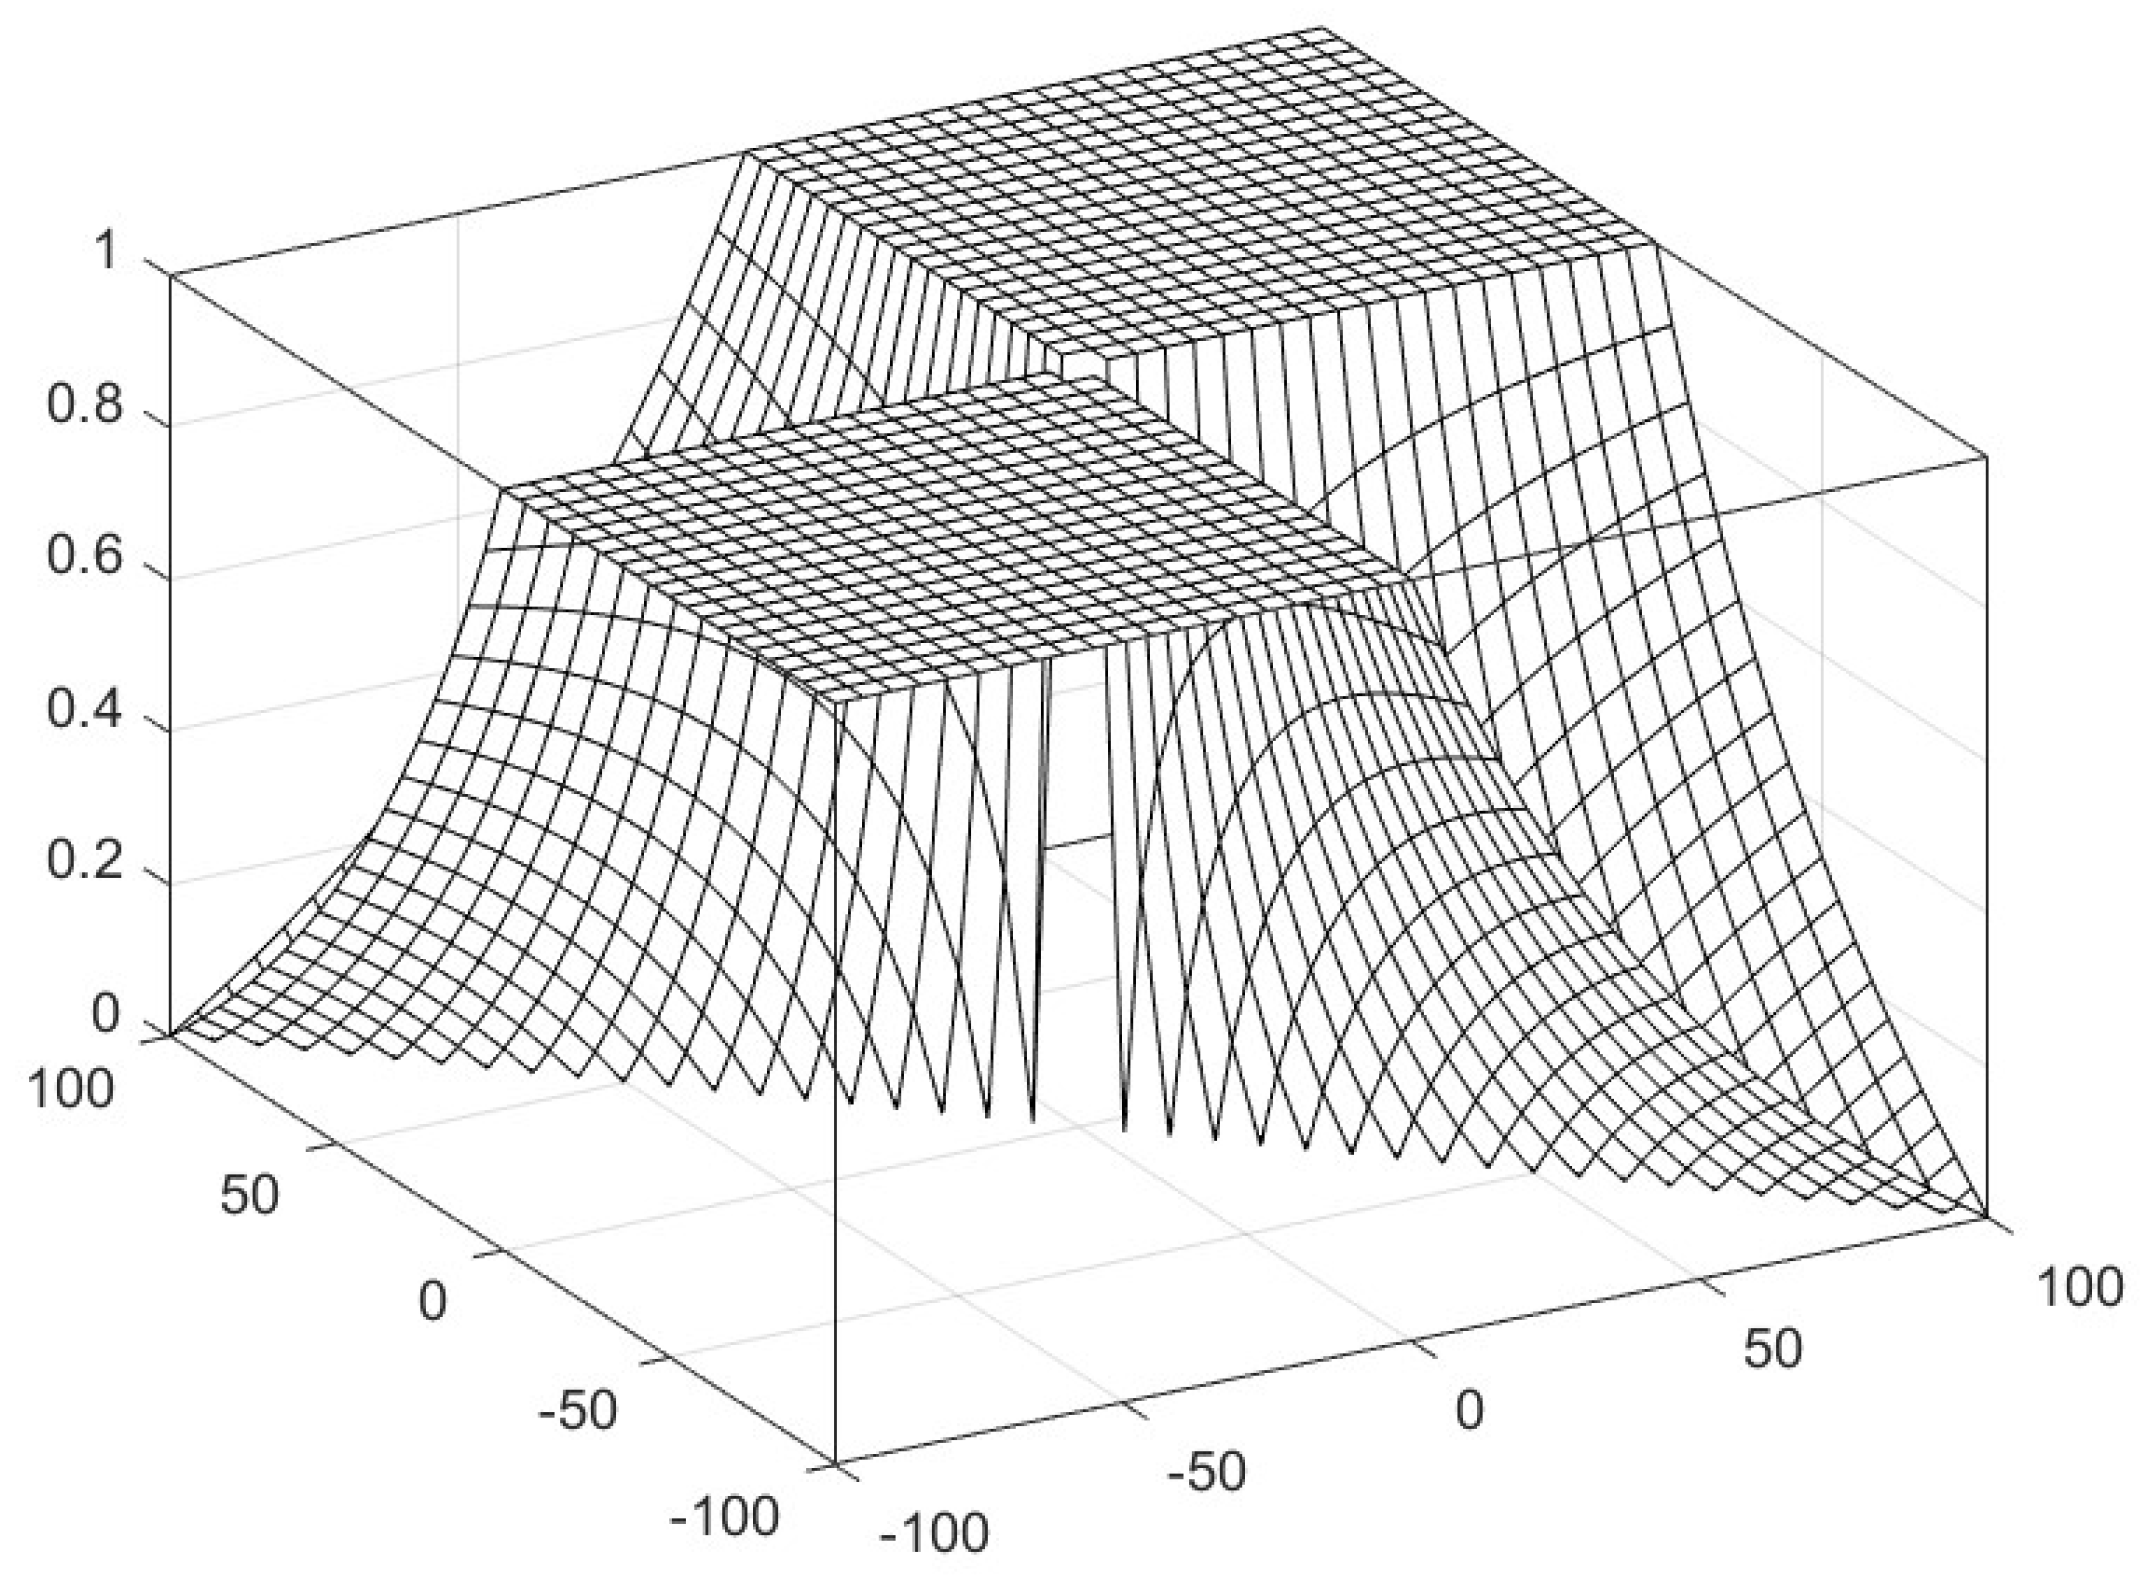
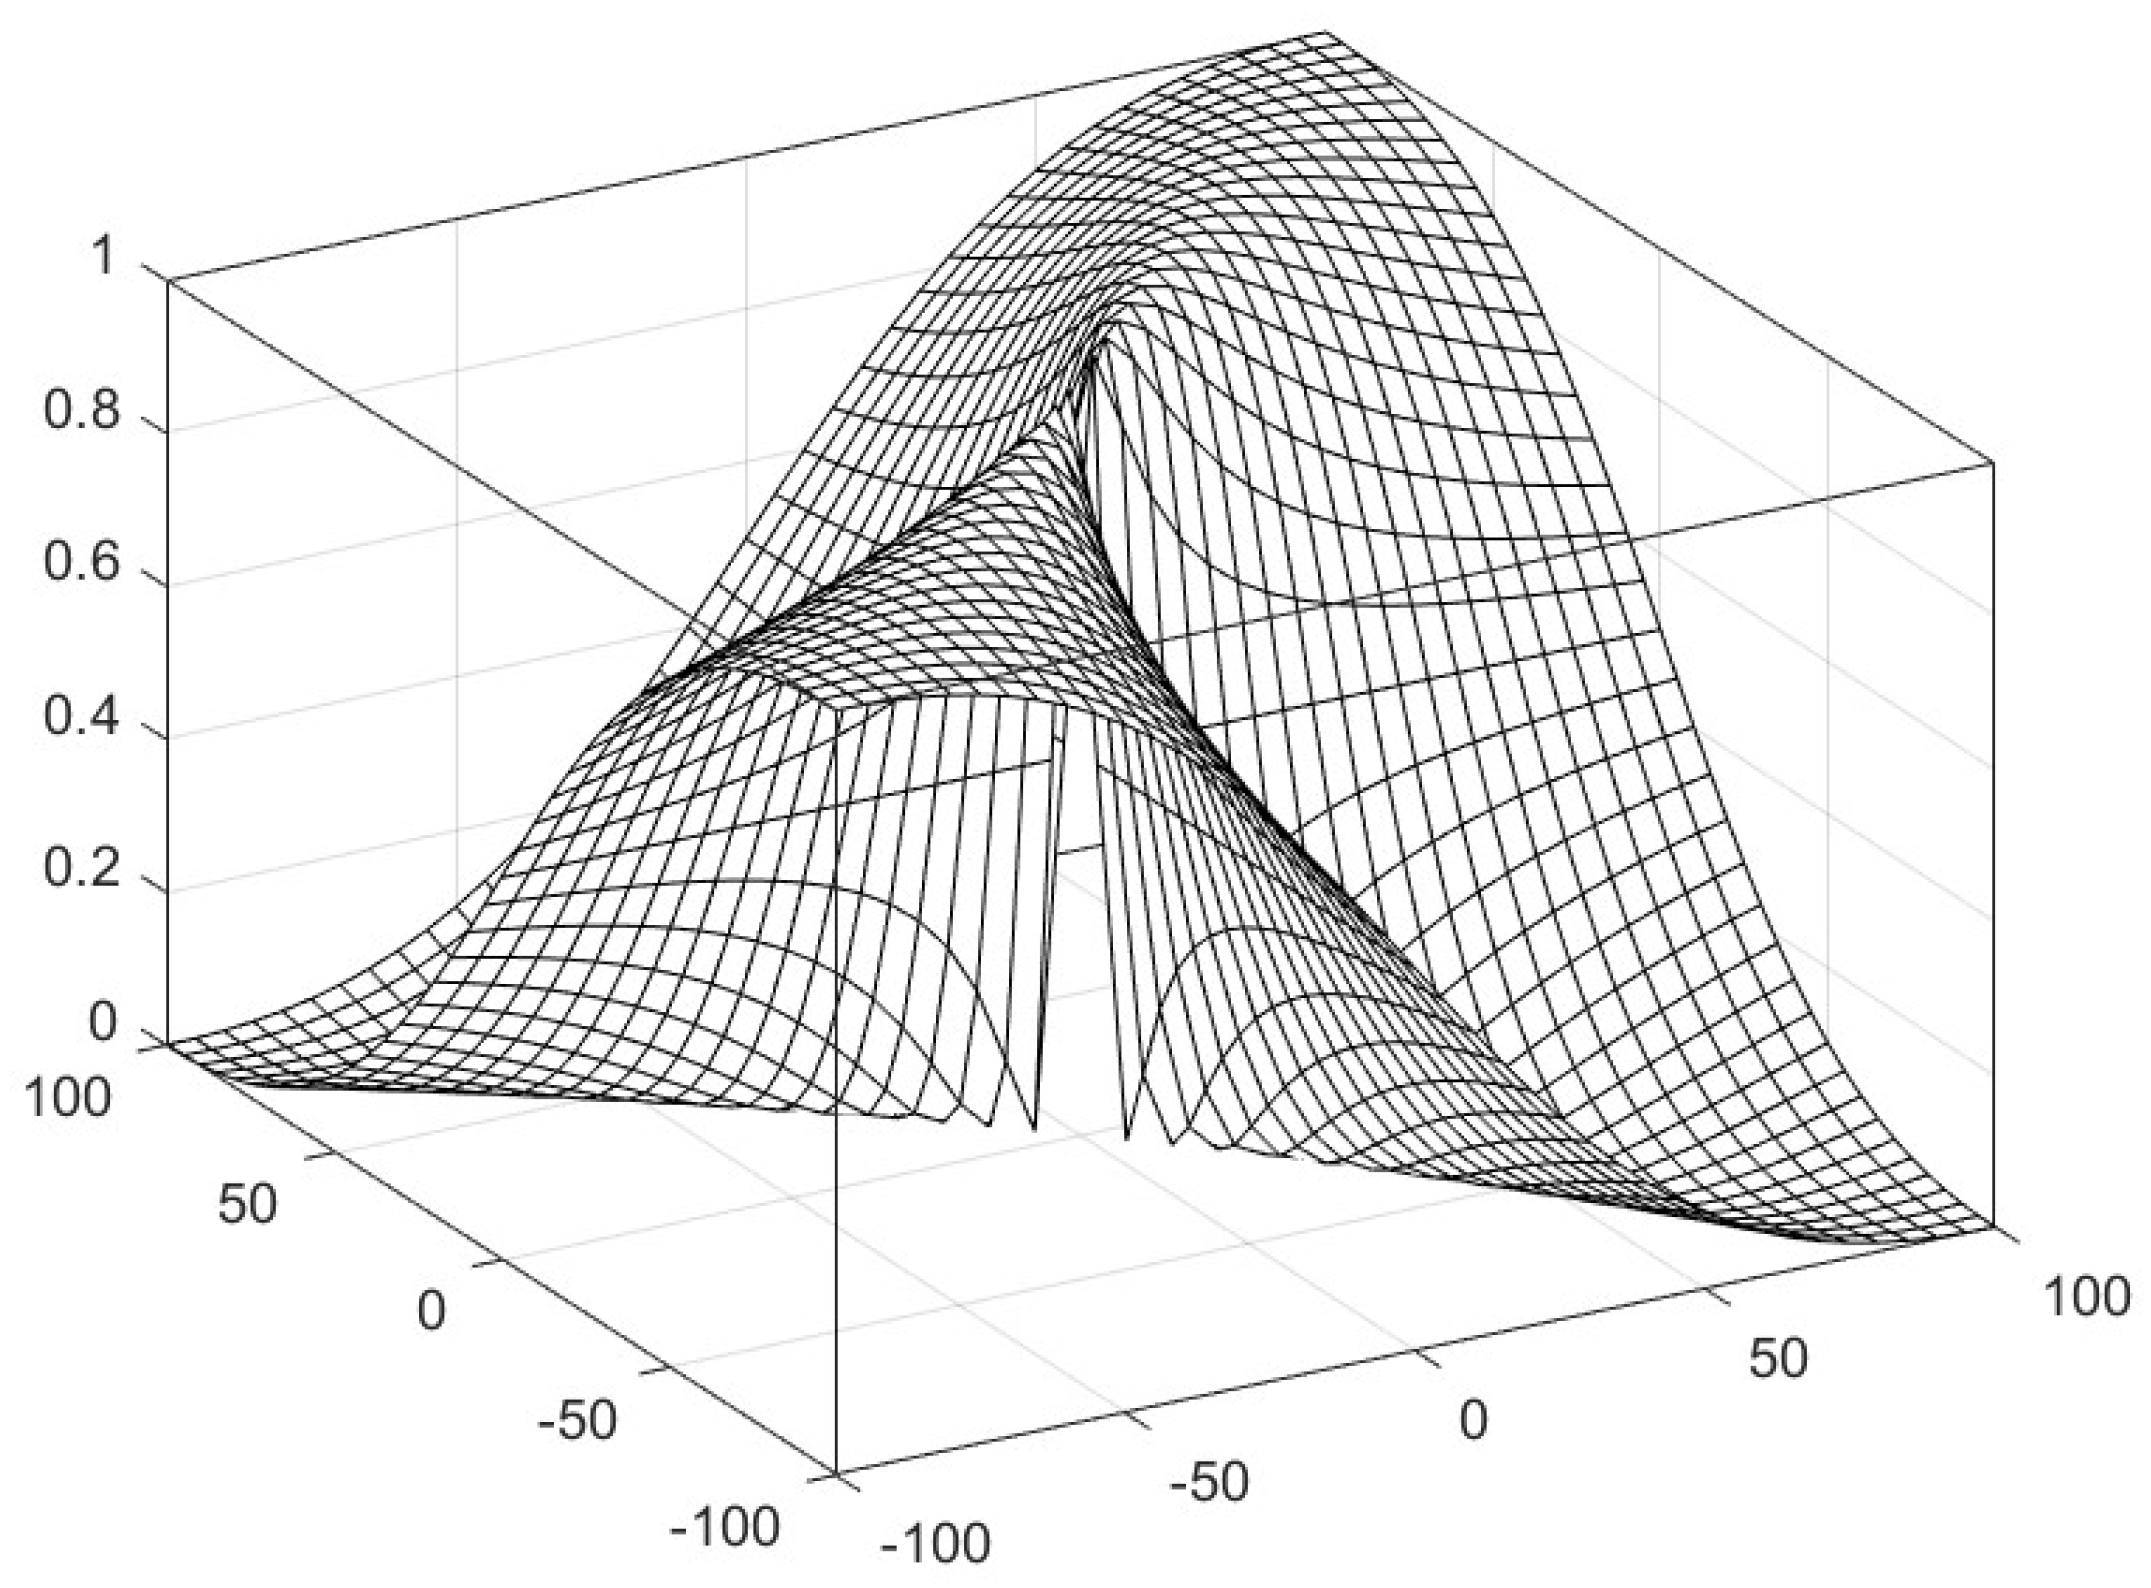
The shape of the bipolar similarity function (30) for the numbers from the set is depicted in Figure 4.
Figure 4.
Bipolar similarity function (30) on the set of real numbers [−100,100]\{0}.
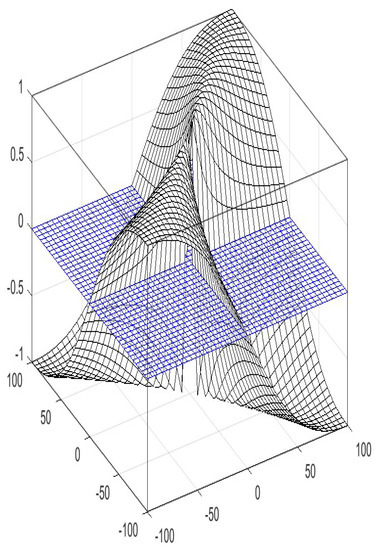
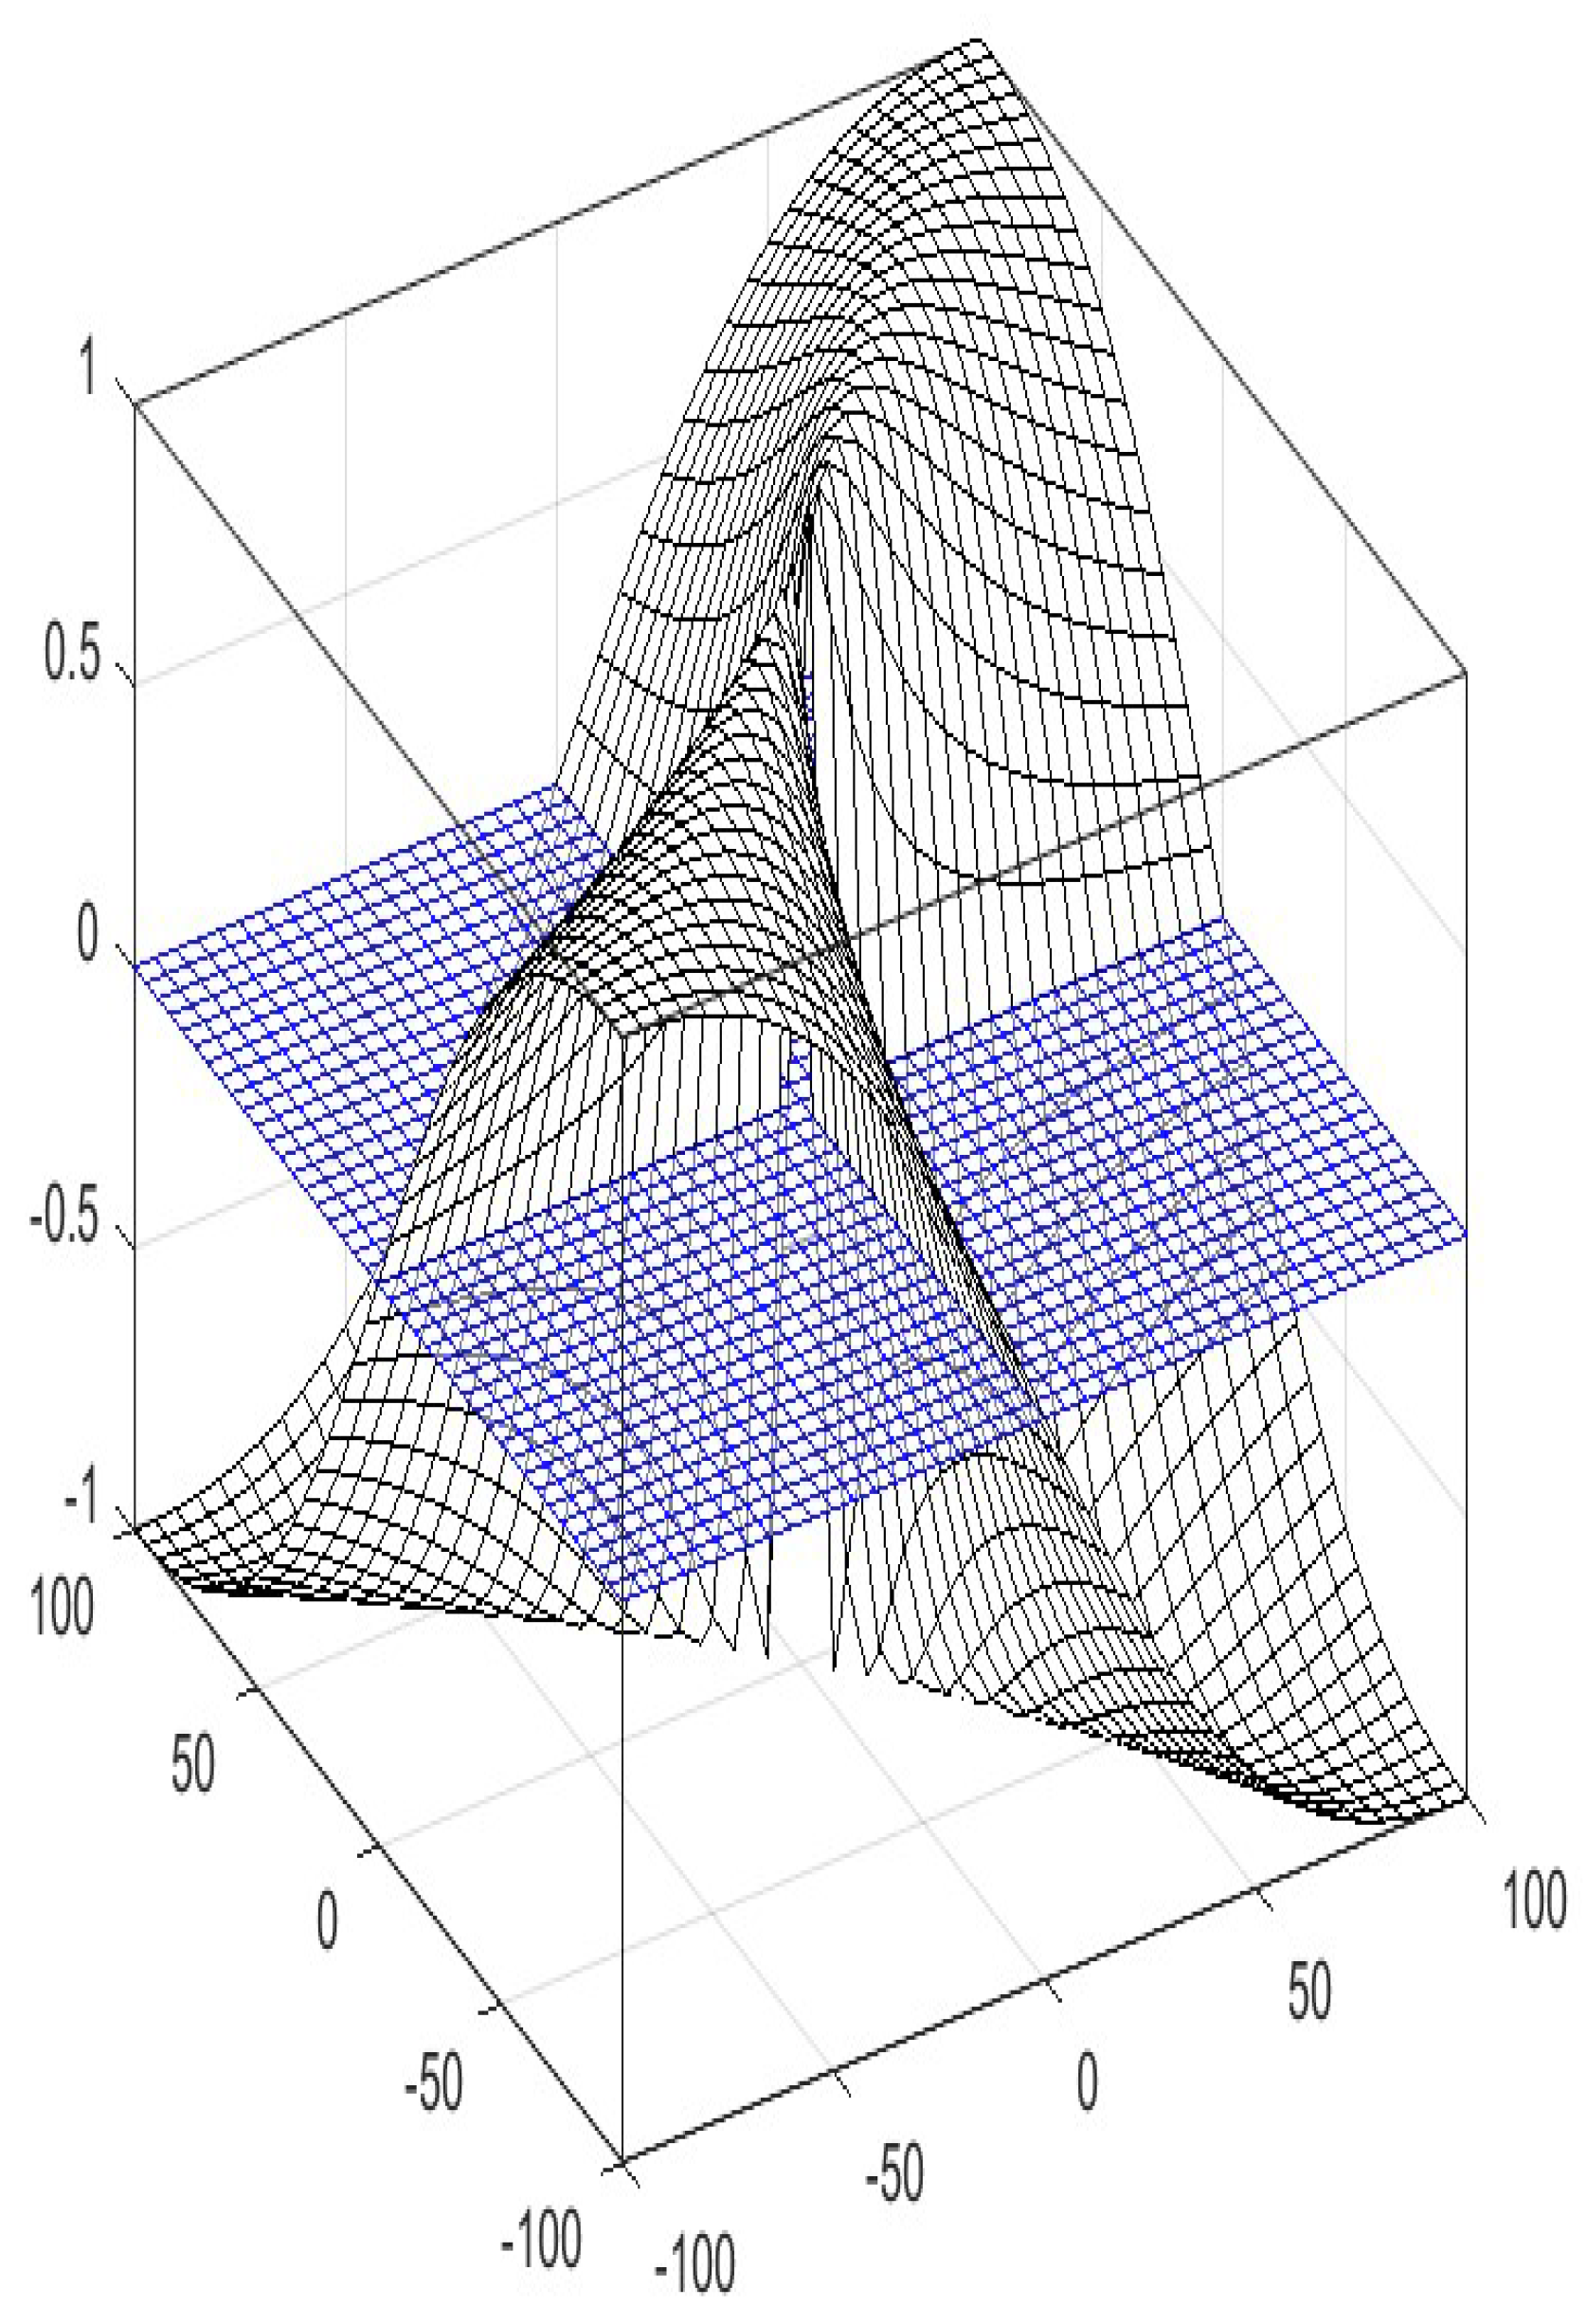
The shape of the correlation function (31) for the numbers from the set is depicted in Figure 5. The blue plane cuts the figure on the level where correlation equals 0. As we can see, the correlation is positive when both x and y are positive, or when both are negative. According to (13): , the correlation function (31) is a rescaling of the bipolar similarity function (30). The bipolar similarity function (30) takes values in [0, 1] but the correlation function takes values in [−1, 1]; compare Figure 4 and Figure 5.
Figure 5.
The correlation function (31) on the set of real numbers [−100,100]\{0} was obtained by rescaling the values of the bipolar similarity function (30) using the formula (13).
4. Bipolar Dissimilarity and Similarity Correlation in Risk Assessment
Similarity measures have an important role in risk assessment. In conventional models, the computational requirement is very high due to the complicated fuzzy arithmetic operations and performing linguistic approximations. However, using similarity measures, computational requirements can be reduced [6]. In some cases, this advantageous property has vital importance, e.g., in real-time and adaptive systems.
Nowadays, patient monitoring systems are very popular because of their several advantages. Nevertheless, the development of an appropriate evaluation model which serves realistic results is still the most serious issue. In these kinds of systems risk of the current activity can be monitored based on the measured physiological parameters. The problem is that the current physiological values of the patient are influenced by many factors. However, if the previous measurements under the same condition (resting heart-rate, intensity and duration of the activity, sampling rate, etc.) are available, a patient-specific evaluation can be built to result in a more realistic risk level. In this case a fuzzy set can be created based on the histogram of the previously measured values, and similarity can be calculated with the medical recommendation, or with the current values. Based on this similarity a risk can be assessed.
The process of creating a fuzzy set based on previous measurements through a simplified example is shown below:
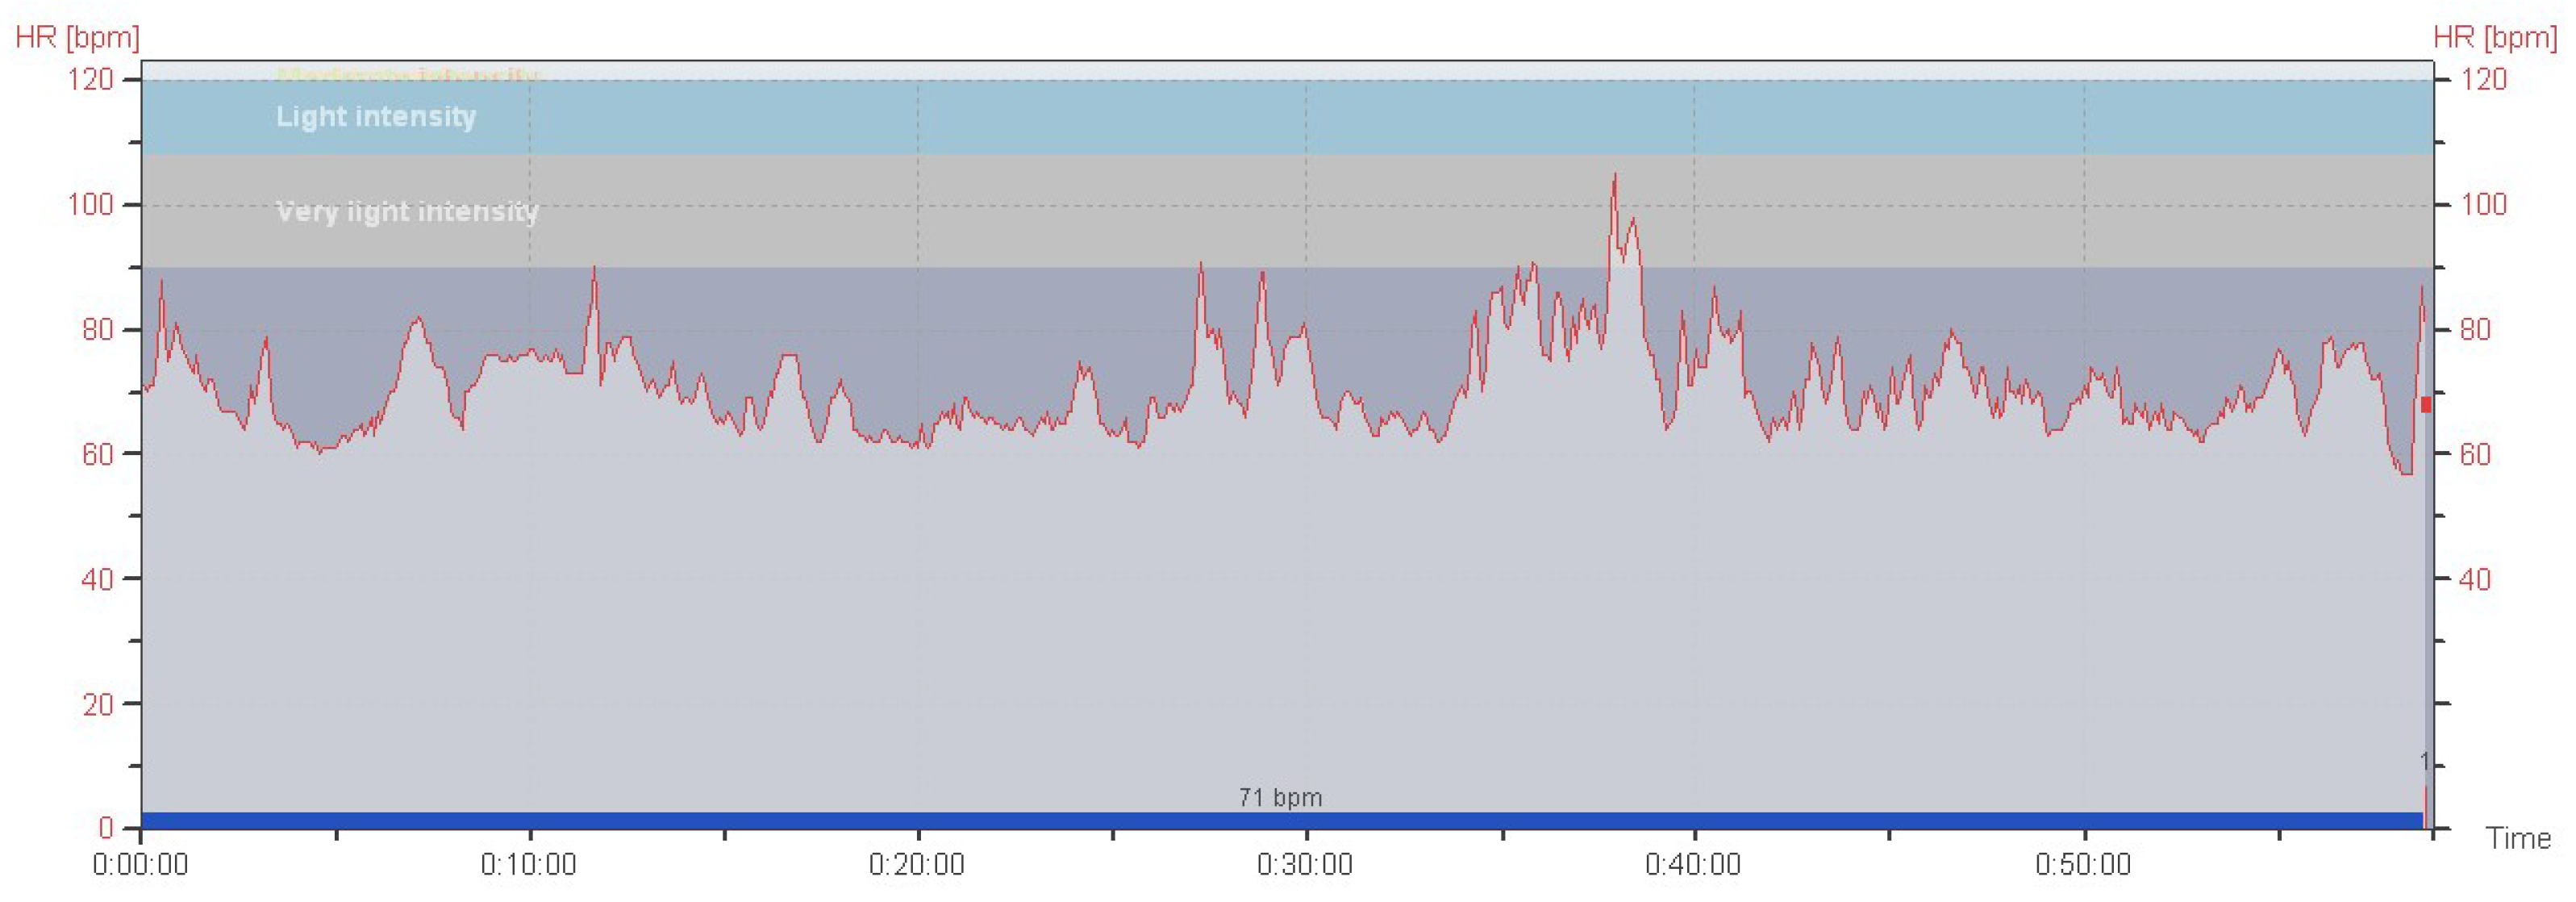
- Measured values (see Figure 6) are stored in a database.Figure 6. Previously measured values (23-year-old man, HRrest = 55 bpm, HRmax = 200 bpm, Weight = 69 kg, duration = 1 h, sampling frequency = 5 s).
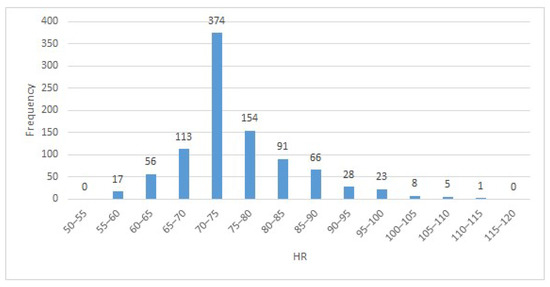
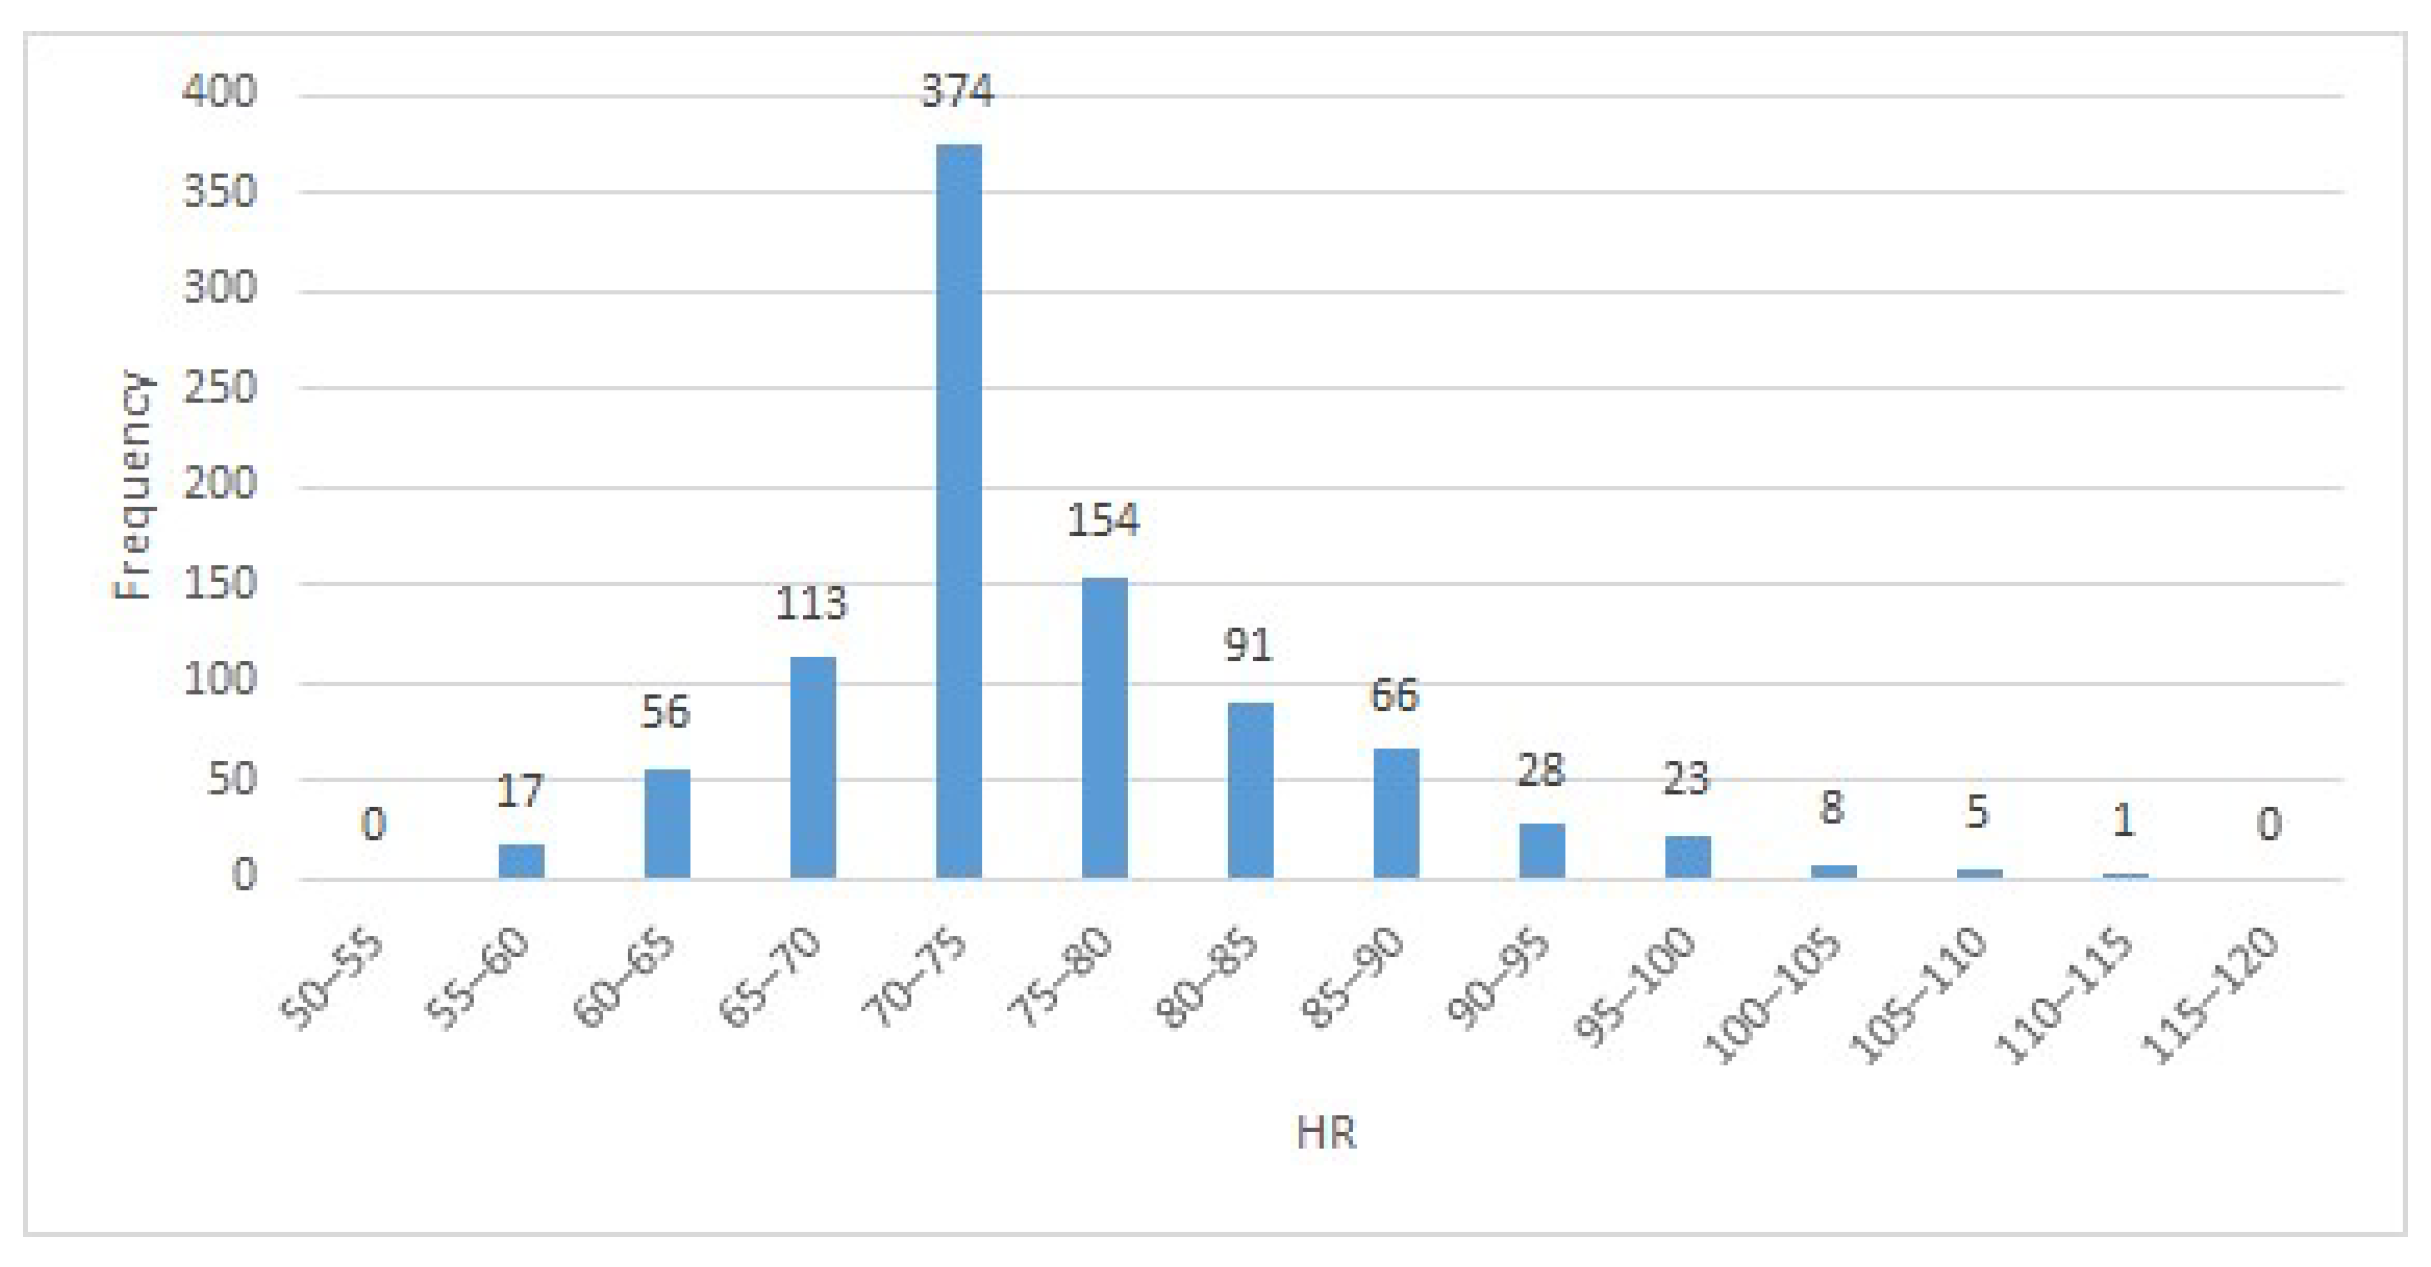
- Histogram is created based on the stored data as illustrated in Figure 7.Figure 7. Histogram based on previous measurements (23-year-old man, HRrest = 55 bpm, HRmax = 200 bpm, Weight = 69 kg, duration = 1 h, sampling frequency = 5 s).
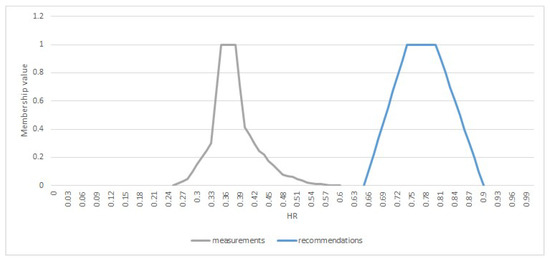
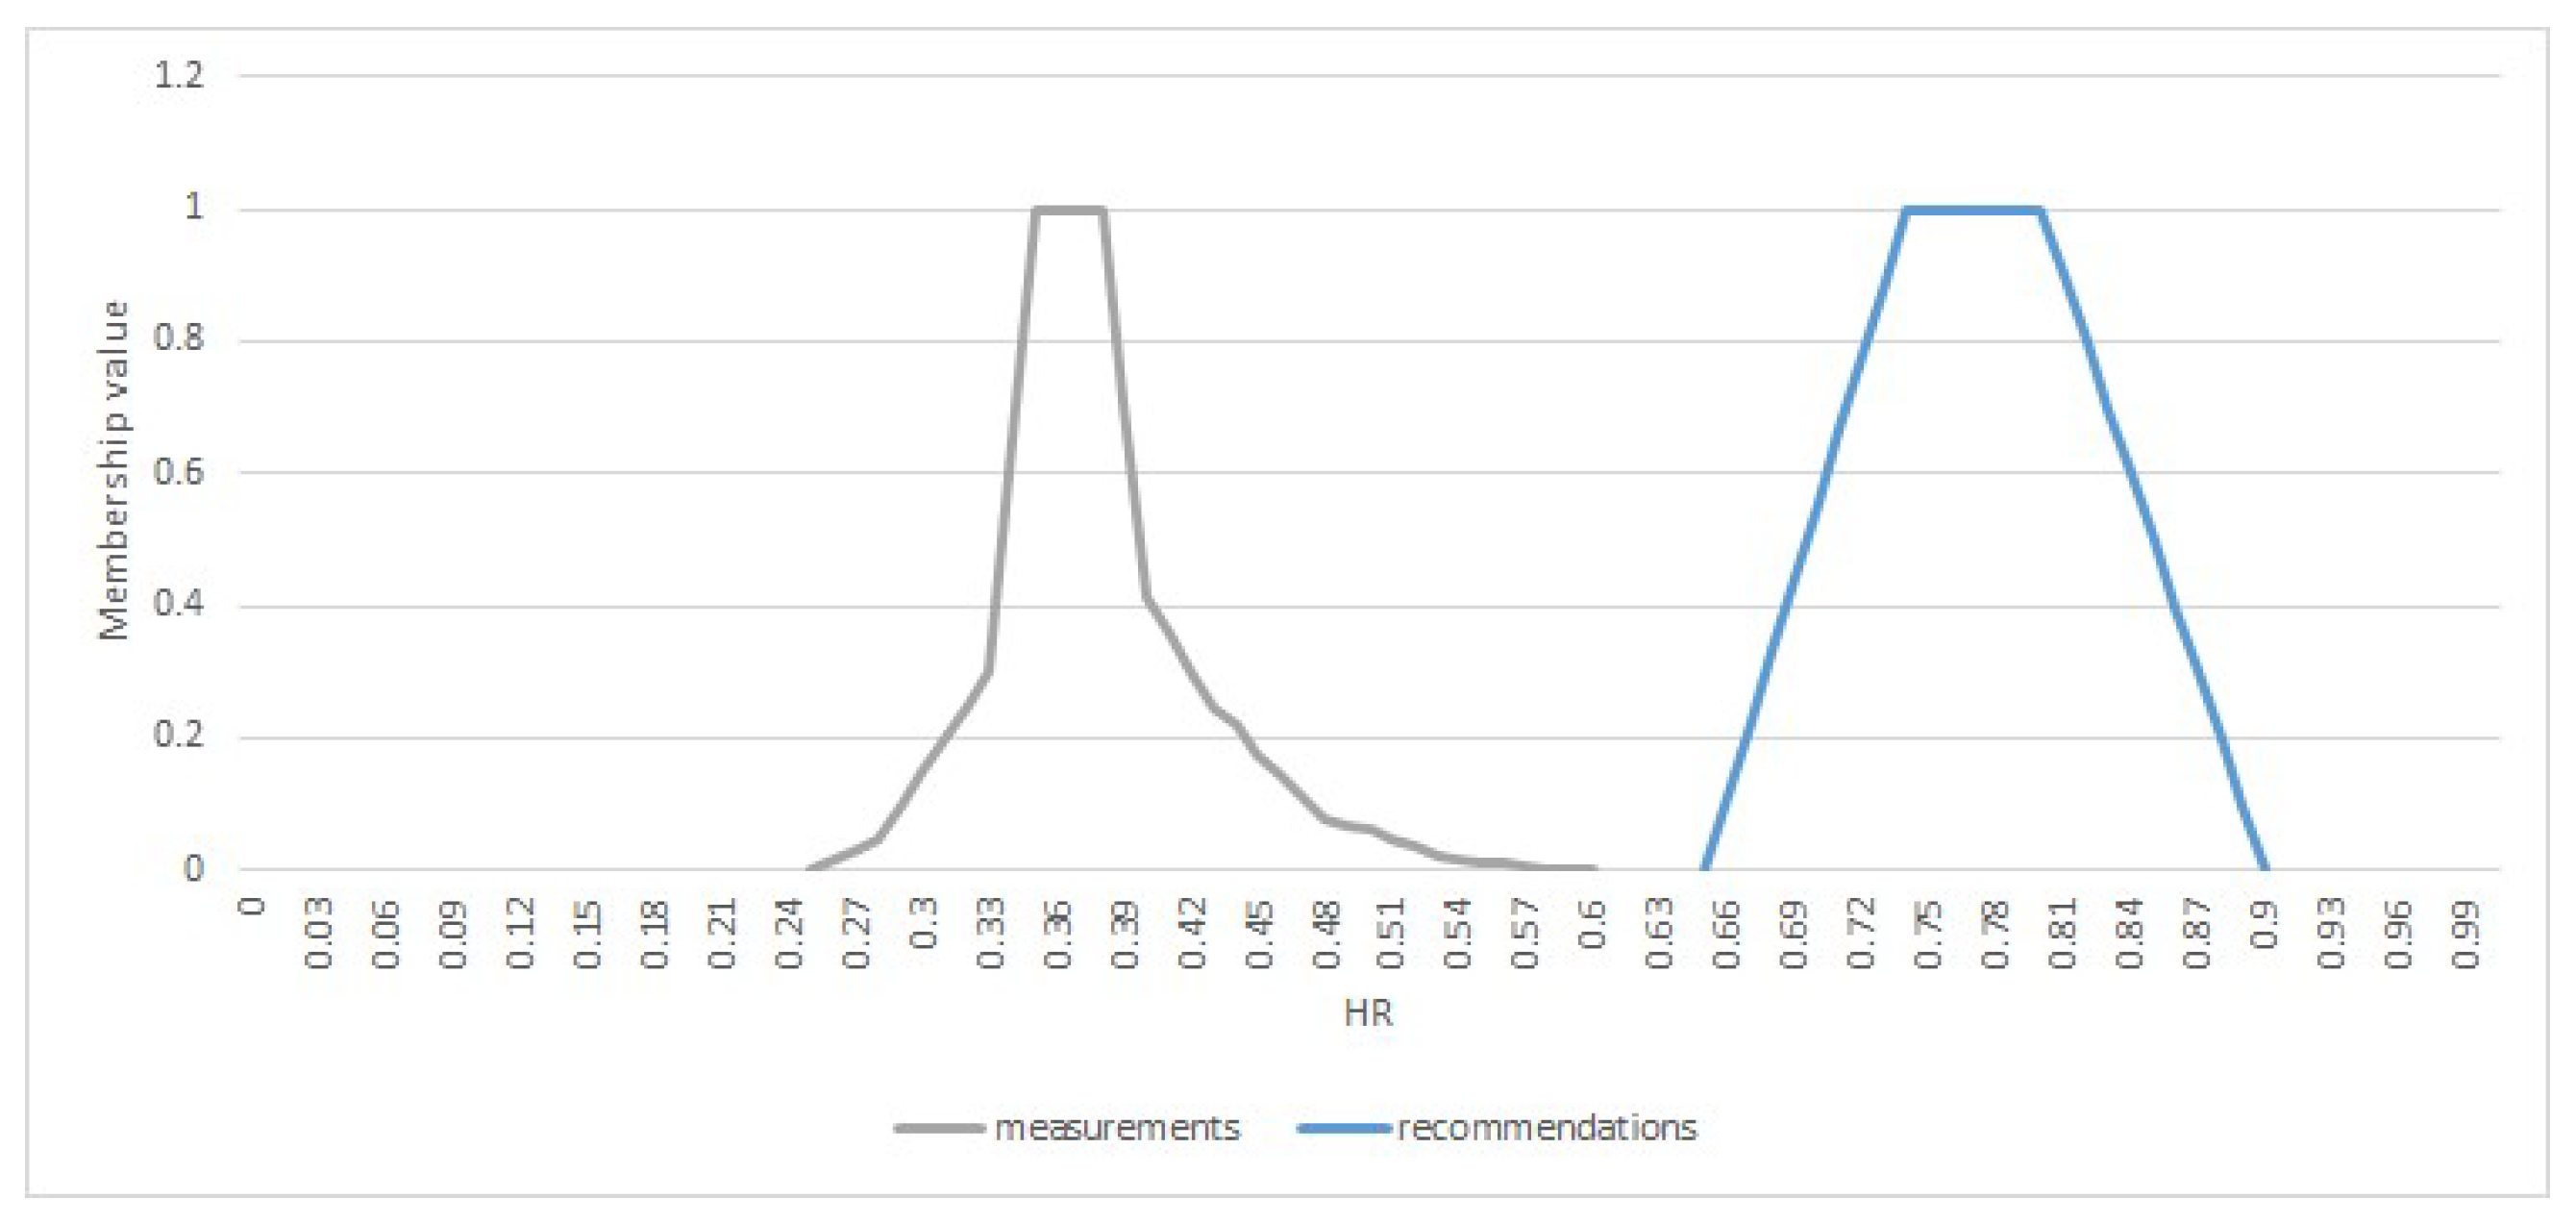
- Fuzzy set is fitted to the histogram, (see in [29]). This set represents the normal reactions of the patient under the same conditions. Medical recommendations for the specific patient should be available in the database as well, or the age- and sex-specific values from the literature can be used instead. Figure 8. shows the fuzzy sets generated based on the measurements and medical recommendations for the above case study.Figure 8. Medical recommendation-based set and histogram-based fuzzy set based on previous measurements (23-year-old man, HRrest = 55 bpm, HRmax = 200 bpm, Weight = 69 kg, duration = 1 h, sampling frequency = 5 s).
Finally, the obtained sets can be compared, which is good feedback for the doctor or the patient themselves.
5. Discussion
The paper studied the important role of bipolar similarity and dissimilarity functions in the analysis of relationships between real variables or real numbers when negation operations on the data domain are considered. We showed the previously unexpected result that the dissimilarity function generating Pearson’s correlation coefficient is bipolar. Further, we proposed new normalized similarity and dissimilarity functions on the set of real numbers. Using the graphic representation of the similarity functions, we showed that non-bipolar co-symmetric similarity functions have drawbacks in large subdomains, such that the similarity between any two elements from these subdomains is equal to zero or one. The proposed bipolar similarity functions have no such drawbacks. For this reason, bipolar similarity measures can be recommended for use in fuzzy risk assessment models and in other applications where the symmetry of positive and negative numbers is a natural requirement. Finally, correlation functions between numbers corresponding to bipolar similarity functions were proposed. In inferential statistics, to apply Pearson’s correlation between two variables, it is usually required from these variables the fulfillment of some assumptions, at least to have a sufficient number of measurements. Generally, the representation of correlation and association coefficients as functions obtained as a rescaling of bipolar similarity and dissimilarity functions is quite different from looks at these measures used in statistics [26]. In the new similarity-based approach to the construction of correlation functions, it is possible to measure the correlation between just two numbers or two measurements. We suppose that similarity correlation can be used in descriptive statistics, data analytics, data mining, and exploratory data analysis [27,28,30] rather than in inferential statistics. In such applications, similarity correlation functions and bipolar similarity and dissimilarity functions give new measures of relationships of data [27,28].
The similarity and dissimilarity functions considered in the paper are fuzzy relations, and the bipolarity property of these relations can be used in the analysis of fuzzy systems. Propositions 4–8 are proved for real numbers, and similar propositions could also be proven for the real numbers of the interval [0, 1]. But technically, the results will have another form because the negation on [0, 1] is different from the negation of real numbers. Similarity and correlation functions (association measures) for elements of [0, 1] and for fuzzy sets are studied in [15,16].
Author Contributions
Conceptualization, I.Z.B. and E.T.-L.; Formal analysis, I.Z.B. and E.T.-L.; Funding acquisition, I.Z.B. and E.T.-L.; Investigation, I.Z.B. and E.T.-L.; Methodology, I.Z.B. and E.T.-L.; Visualization, I.Z.B. and E.T.-L.; Writing—original draft, I.Z.B. and E.T.-L.; Writing—review & editing, I.Z.B. and E.T.-L. Funding acquisition: E.T.-L. All authors have read and agreed to the published version of the manuscript.
Funding
The work was partially supported by the project SIP 20220857 of IPN, Mexico.
Institutional Review Board Statement
Not applicable.
Informed Consent Statement
Not applicable.
Data Availability Statement
Not applicable.
Acknowledgments
The authors would like to express their thanks to Óbuda University, Budapest (Hungary) that financially supported the publication of this article.
Conflicts of Interest
The authors declare no conflict of interest.
References
- Bognár, F.; Benedek, P. A Novel Risk Assessment Methodology—A Case Study of the PRISM Methodology in a Compliance Management Sensitive Sector. Acta Polytech. Hung. 2021, 18, 89–108. [Google Scholar] [CrossRef] [Scilit]
- Tóth-Laufer, E.; Takács, M.; Rudas, I.J. Fuzzy Logic-based Risk Assessment Framework to Evaluate Physiological Parameters. Acta Polytech. Hung. 2015, 12, 159–178. [Google Scholar]
- Portik, T.; Pokorádi, L. The summarized weighted mean of maxima defuzzification and its application at the end of the risk assessment process. Acta Polytech. Hung. 2014, 11, 167–180. [Google Scholar]
- Schmucker, K.J. Fuzzy Sets, Natural Language Computations and Risk Analysis; Computer Science Press: Rockville, MD, USA, 1984. [Google Scholar]
- Chen, S.J.; Chen, S.M. Fuzzy risk analysis based on similarity measures of generalized fuzzy numbers. IEEE Trans. Fuzzy Syst. 2003, 11, 45–56. [Google Scholar] [CrossRef]
- Chen, S.-J.; Chen, S.-M. Fuzzy risk analysis based on measures of similarity between interval-valued fuzzy numbers. Comput. Math. Appl. 2008, 55, 1670–1685. [Google Scholar] [CrossRef] [Scilit]
- Xu, Z.; Shang, S.; Qian, W.; Shu, W. A method for fuzzy risk analysis based on the new similarity of trapezoidal fuzzy numbers. Expert Syst. Appl. 2010, 37, 1920–1927. [Google Scholar] [CrossRef] [Scilit]
- Khorshidi, H.A.; Nikfalazar, S. An improved similarity measure for generalized fuzzy numbers and its application to fuzzy risk analysis. Appl. Soft Comput. 2017, 52, 478–486. [Google Scholar] [CrossRef] [Scilit]
- Chutia, R.; Gogoi, M.K. Fuzzy risk analysis in poultry farming using a new similarity measure on generalized fuzzy numbers. Comput. Ind. Eng. 2018, 115, 543–558. [Google Scholar] [CrossRef] [Scilit]
- Gogoi, M.K.; Chutia, R. Similarity measure of the interval-valued fuzzy numbers and its application in risk analysis in paddy cultivation. J. Ambient Intell. Humaniz. Comput. 2021, 1–24. [Google Scholar] [CrossRef] [Scilit]
- Gogoi, M.K.; Chutia, R. Fuzzy risk analysis based on a similarity measure of fuzzy numbers and its application in crop selection. Eng. Appl. Artif. Intell. 2022, 107, 104517. [Google Scholar] [CrossRef] [Scilit]
- Batyrshin, I. Constructing time series shape association measures: Minkowski distance and data standardization. In Proceedings of the 1st BRICS Countries Congress on Computational Intelligence, BRICS-CCI 2013, Porto de Galinhas, Brasil, 8–11 September 2013; IEEE Computer Society Order Number E3194; BMS Part Number CFP1364W-ART. IEEE Computer Society, GPS: Washington, DA, USA, 2013; pp. 204–212. [Google Scholar]
- Batyrshin, I. Association measures and aggregation functions. In Advances in Soft Computing and Its Applications; Lecture Notes in Computer Science; Springer: Berlin/Heidelberg, Germany, 2013; Volume 8266, pp. 194–203. [Google Scholar]
- Batyrshin, I.Z. On definition and construction of association measures. J. Intell. Fuzzy Syst. 2015, 29, 2319–2326. [Google Scholar] [CrossRef] [Scilit]
- Batyrshin, I.Z. Association measures on [0,1]. J. Intell. Fuzzy Syst. 2015, 29, 1011–1020. [Google Scholar] [CrossRef] [Scilit]
- Batyrshin, I. Association measures on sets with involution and similarity measure. In Recent Developments and New Direction in Soft-Computing Foundations and Applications; Springer International Publishing: Cham, Switzerland, 2016; pp. 221–237. [Google Scholar]
- Batyrshin, I.Z. Data Science: Similarity, Dissimilarity and Correlation Functions. In Artificial Intelligence; Osipov, G.S., Panov, A.I., Yakovlev, K.S., Eds.; LNAI 11866; Springer: Berlin/Heidelberg, Germany, 2019; pp. 13–28. [Google Scholar]
- Batyrshin, I. Towards a general theory of similarity and association measures: Similarity, dissimilarity and correlation functions. J. Intell. Fuzzy Syst. 2019, 36, 2977–3004. [Google Scholar] [CrossRef] [Scilit]
- Batyrshin, I.Z. Constructing correlation coefficients from similarity and dissimilarity functions. Acta Polytech. Hung. 2019, 16, 191–204. [Google Scholar] [CrossRef] [Scilit]
- Yule, G.U. On the association of attributes in statistics: With illustrations from the material of the childhood society, &c. Philos. Trans. R. Soc. Lond. Ser. A 1900, 194, 257–319. [Google Scholar]
- Kendall, M.G. Rank Correlation Methods, 4th ed.; Griffin: London, UK, 1970. [Google Scholar]
- Liebetrau, A.M. Measures of Association; Sage Publications: Thousand Oaks, IA, USA, 1983. [Google Scholar]
- Gibbons, J.D. Nonparametric Measures of Association; Sage Publications: Thousand Oaks, IA, USA, 1993. [Google Scholar]
- Chen, P.Y.; Popovich, P.M. Correlation: Parametric and Nonparametric Measures; Sage: Thousand Oaks, CA, USA, 2002. [Google Scholar]
- Gibbons, J.D.; Chakraborti, S. Nonparametric Statistical Inference, 4th ed.; Dekker: New York, NY, USA, 2003. [Google Scholar]
- Lee Rodgers, J.; Nicewander, W.A. Thirteen ways to look at the correlation coefficient. Am. Stat. 1988, 42, 59–66. [Google Scholar] [CrossRef] [Scilit]
- Geng, L.; Hamilton, H.J. Interestingness measures for data mining: A survey. ACM Comput. Surv. (CSUR) 2006, 38, 1–32. [Google Scholar] [CrossRef] [Scilit]
- Tan, P.N.; Kumar, V.; Srivastava, J. Selecting the right interestingness measure for association patterns. In Proceedings of the Eighth ACM SIGKDD International Conference on Knowledge Discovery and Data Mining, Edmonton, AB, Canada, 23–26 July 2002; pp. 32–41. [Google Scholar]
- Tóth-Laufer, E.; Nagy, I. Effect of the Different Membership Function Fitting Methods in Personalized Risk Calculation. In Proceedings of the 22nd IEEE International Conference on Intelligent Engineering Systems 2018 (INES 2018), Las Palmas de Gran Canaria, Spain, 21–23 June 2018; pp. 127–132. [Google Scholar]
- Han, J.; Kamber, M. Data mining: Concepts and techniques, 2nd ed.; Morgan Kaufmann: Amsterdam, The Netherlands, 2006. [Google Scholar]
Publisher’s Note: MDPI stays neutral with regard to jurisdictional claims in published maps and institutional affiliations. |
© 2022 by the authors. Licensee MDPI, Basel, Switzerland. This article is an open access article distributed under the terms and conditions of the Creative Commons Attribution (CC BY) license (https://creativecommons.org/licenses/by/4.0/).