Article

Predictive Ability of Machine-Learning Methods for Vitamin D Deficiency Prediction by Anthropometric Parameters

by
Carmen Patino-Alonso
1,2,*,
Marta Gómez-Sánchez
2,
Leticia Gómez-Sánchez
2,
Benigna Sánchez Salgado
2,3,
Emiliano Rodríguez-Sánchez
2,3,4,
Luis García-Ortiz
2,3,5,† and
Manuel A. Gómez-Marcos
2,3,4,†
1
Department of Statistics, University of Salamanca, 37007 Salamanca, Spain
2
Primary Care Research Unit of Salamanca (APISAL), Biomedical Research Institute of Salamanca (IBSAL), 37005 Salamanca, Spain
3
Health Service of Castilla and Leon (SACyL), 37005 Salamanca, Spain
4
Department of Medicine, University of Salamanca, 37007 Salamanca, Spain
5
Department of Biomedical and Diagnostic Sciences, University of Salamanca, 37007 Salamanca, Spain
*
Author to whom correspondence should be addressed.
These authors contributed equally to this work.
Mathematics 2022, 10(4), 616; https://doi.org/10.3390/math10040616
Submission received: 30 November 2021 / Revised: 13 February 2022 / Accepted: 14 February 2022 / Published: 17 February 2022

Abstract

:
Background: Vitamin D deficiency affects the general population and is very common among elderly Europeans. This study compared different supervised learning algorithms in a cohort of Spanish individuals aged 35–75 years to predict which anthropometric parameter was most strongly associated with vitamin D deficiency. Methods: A total of 501 participants were recruited by simple random sampling with replacement (reference population: 43,946). The analyzed anthropometric parameters were waist circumference (WC), body mass index (BMI), waist-to-height ratio (WHtR), body roundness index (BRI), visceral adiposity index (VAI), and the Clinical University of Navarra body adiposity estimator (CUN-BAE) for body fat percentage. Results: All the anthropometric indices were associated, in males, with vitamin D deficiency (p < 0.01 for the entire sample) after controlling for possible confounding factors, except for CUN-BAE, which was the only parameter that showed a correlation in females. Conclusions: The capacity of anthropometric parameters to predict vitamin D deficiency differed according to sex; thus, WC, BMI, WHtR, VAI, and BRI were most useful for prediction in males, while CUN-BAE was more useful in females. The naïve Bayes approach for machine learning showed the best area under the curve with WC, BMI, WHtR, and BRI, while the logistic regression model did so in VAI and CUN-BAE.

1. Introduction

Published work, at different latitudes and on both sexes, has indicated that serum 25-hydroxyvitamin D concentrations are lower in obese subjects as compared to normal-weight subjects [1,2,3,4,5]. Moreover, intervention studies and clinical trials have shown an inverse association between the duration and dosage of 25-hydroxyvitamin D supplementation according to BMI and body fat [2,6,7]. Excess adiposity is associated with risk factors for cardiovascular diseases (CVD), such as hypertension, diabetes mellitus, and dyslipidemia. Body mass index (BMI) is the most widely used measure to evaluate the presence of obesity in adults, and it is associated with an increase in morbimortality by cardiovascular diseases and cancer [8]. Waist circumference (WC) has been used to evaluate central obesity and predict the risk of mortality more accurately than BMI [9]. However, it has some limitations, as it considers neither the height nor the weight of the individual [9]. To solve these limitations, alternatives have been developed that include height (e.g., the waist-to-height ratio (WHtR)) [10], the lipid profile (e.g., the visceral adiposity index (VAI)) [11], body fat percentage (e.g., the body adiposity estimator (CUN-BAE)) [12], and body roundness index (BRI) [13]. The epidemic of vitamin D deficiency has been correlated with a wide variety of diseases [14]. The study of vitamin D deficiency and its relation to different diseases has gained increasing interest in recent decades. Vitamin D deficiency affects the general population and is very common in European populations, especially among the elderly [15,16]. This deficit has also been associated with several diseases, such as cancer and cardiovascular diseases [17,18], obesity [19], and even mortality rates for COVID-19 [20]. Aleksova et al. [21] found a U-shaped, nonlinear relationship between vitamin D levels and myocardial infarction. Although evidence has been found [22] for the association of anthropometric parameters regarding vitamin D, such association is not yet fully understood. It would be helpful to better identify individuals with a greater likelihood of vitamin D deficiency, which could improve the efficiency of the determination.
Machine learning (ML) is a technology that was originally intended to mimic human intelligence [23]. Currently, it has been transformed into a tool that can use algorithms to identify patterns and formulate predictions. ML methods have acquired great importance in the health sector for disease prediction. Their versatility means they can derive a model from available data without prior knowledge of the relationships between variables [24]. These methods make fewer assumptions about the data, which allows them to use variables with a non-normal distribution. In the medical field, ML has been used to predict different traits, such as cardiovascular disease [25], diabetes [26,27], and hypertension [28]. These methods, in theory, can provide more accurate predictions as compared to traditional linear methods [29]. However, one of the reasons why conventional methods such as regression are still used is that despite the theoretical potential of ML, its practical application has not always proven superior to traditional linear modeling. Furthermore, it has been difficult to forecast which method will result in the higher accuracy when predicting a particular disease [30]. In practice, there are many different ML techniques that may be suitable for predicting a variable of interest. This challenge has resulted in a trial-and-error approach to find the best method for each circumstance [31]. In summary, ML is an interdisciplinary field closely related to artificial intelligence, pattern recognition, and probability theory, through which computer algorithms can automatically extract patterns from the available data. ML has mainly been divided into three categories: supervised, unsupervised and semisupervised learning approaches, depending on the availability of types and categories of training data. Supervised ML involves predetermined output attributes in addition to the use of input attributes, and all the data are labeled. Unsupervised learning approaches are in contrast to supervised learning approaches, in that they do not require any training process, and all the data are unlabeled. The difference between both is the existence of labels in the training data subset [32]. Semisupervised ML is an approach that incorporates both unsupervised and supervised machine learning; that is, in the presence of both labeled and unlabeled data [33]. In this paper, supervised learning approaches, which are widely used in the data classification process, were applied. The naïve Bayes (NB) probabilistic classifier and the linear logistic regression (LR) and random forest (RF) were used.
Recently, prediction models for 25-hydroxyvitamin D have been developed using conventional regression analysis [34,35]. However, ML is a data analysis technique that creates algorithms to predict outcomes by “learning” from the data. It increasingly stands out as a competitive alternative to regression analysis. However, although ML can outperform conventional regression, it develops fewer assumptions about the data, possibly due to its ability to capture nonlinearities between predictor variables [36]. Despite this, only two studies [37,38] have used machine-learning algorithms to predict 25-hydroxyvitamin D, neither of which studied the relationship of 25-hydroxyvitamin D deficit using anthropometric parameters.
Although ML predication models have already been tested in other pathologies, such as coronary artery disease [39], this was the first study to use them in the analysis of the association of different anthropometric parameters with vitamin D. Therefore, the aims of this study were, firstly, to explore the association of the different anthropometric parameters (i.e., BMI, WC, WHtR, BRI, VAI, and CUN-BAE) with vitamin D, and secondly, to analyze which anthropometric parameters were the most efficient in predicting vitamin D levels while comparing the results to those of other methods, including LR, NB, and RF.

2. Methods

2.1. Design

This was a cross-sectional, descriptive study of individuals recruited for a study entitled “Association between Different Risk Factors and Early Vascular Ageing (EVA study)” (NCT02623894) [40].

2.2. Study Population

The sample was recruited from an urban population of 43,946 people from 5 healthcare centers. Through random sampling with replacement and stratifying by age groups (35, 45, 55, 65, and 75 years) and sex, 501 individuals were selected, with 100 in each group (i.e., 50 males and 50 females) aged between 35 and 75 years old. The recruitment was conducted from June 2016 to November 2017. Inclusion criteria included those aged 35–75 years old and willing to sign the informed consent to participate. The exclusion criteria included individuals with terminal illnesses, as well as those who could not move into the healthcare centers, had a history of CVD, had a glomerular filtration rate below 30%, had chronic inflammatory disease or acute inflammatory processes in the last three months, or were under treatment with estrogen, testosterone, or growth hormone.

2.3. Variables and Measurement Instruments

A detailed description of the variables gathered and tests performed was included in the protocol of the EVA study [40]. The nurses who collected the tests and questionnaires of the EVA study were previously trained following a standardized protocol.

2.3.1. Measurement of the Anthropometric Parameters

The anthropometric variables were gathered through physical examination.
Weight: mean of 2 measures recorded using an approved and calibrated Seca-770 scale (precision ± 0.1 kg), with the participant barefoot and wearing light clothing.
Height: mean of 2 measures using a Seca-222 wall-mounted height rod, with the participant standing barefoot and aligning their midsagittal line with the middle line of the height rod.
BMI: this was calculated as weight in kg/height in m2. We considered obesity for participants with BMI ≥ 30 [41].
WC: this was measured in the superior border of the iliac crest parallel to the floor, at the end of a normal exhalation. Obesity was considered for WC values ≥88 cm in females and ≥102 cm in males [41]. Hip circumference (HC) was measured at the level of the trochanters.
WHtR: this was calculated using the following equation [42,43]: WHtR = waist circumference (cm)/height (cm).
CUN-BAE: the body fat percentage was calculated according to the Clinical University of Navarra, following the recommendations of Gómez-Ambrosi et al. [12]: CUN-BAE = −44988 + (0.503 × age) + (10689 × sex) + (3172 × BMI) − (0.026 × BMI2) + (0.181 × BMI sex) − (BMI 0.02 × age) − (0.005 × BMI2 sex) + (0.00021 × BMI2 age), considering males = 0 and females = 1.
BRI: this was based on height (m) and waist perimeter (m), and it was calculated using the following equation [13]:
( BRI ) = 364.2 ( 365.5 × SQR ( 1 ( ( WC / ( 2 × 3.141416 ) ) 2 ) / ( 0.5 × Height ) 2 ) )
VAI: this was calculated using the following equations [11]:
Males : VAI = ( WC 39.68 + ( 1.88 × BMI ) ) × ( TG 1.03 ) × ( 1.31 HDL )
Females : VAI = ( WC 36.58 + ( 1.89 × BMI ) ) × ( TG 0.81 ) × ( 1.51 HDL )

2.3.2. Vitamin Intake

The level of 25-hidroxyvitamin D was calculated using an immunoassay technique in a venous blood sample taken at 8–9 a.m. The participants fasted and were instructed not to consume any alcohol or caffeine for 12 h prior to the collection of the blood samples. Fasting plasma glucose, creatinine, total serum cholesterol, high-density lipoprotein (HDL) cholesterol, and triglycerides were measured by standard automatized enzymatic methods.
Vitamin D deficiency was determined as levels below 20 ng/mL [44].

2.4. Statistical Analysis

The continuous variables were expressed as means ± standard deviations, whereas the categorical variables were expressed as numbers and percentages. The comparison of the means between two independent groups was carried out using Student’s t-test, applying χ2 for the categorical variables.
The missing values were imputed according to the rate of missing values. If the rate was <1%, the missing values were replaced with the mean in the continuous variables. The missing values of the variables with a proportion of missing values between >1% and <5% were replaced with the hot-deck imputation.
Three logistic regression models were performed, using each of the anthropometric parameters (i.e., BMI, WC, WHtR, VAI, BRI, and CUN-BAE) as independent variables and vitamin D as the dependent variable in two categories (model 0 for ≥20 ng/mL; model 1 for <20 ng/mL). Model 1 was carried out without controlling for any variables, model 2 was controlled for age and sex, and model 3 was controlled for age, sex, cardiovascular risk score, and consumption of hypotensive, hypoglycemic, and hypolipidemic drugs (0 = no consumption; 1 = consumption).
In this study, three classifiers were used: LR, NB, and RF. The data were divided into a training set and a test set (70% and 30%, respectively). The training set was used to build the classifier; however, to calculate the precision measurements of the models in order to validate them, the data from the test set were applied. The parameters used to evaluate the efficacy of the individual classifiers and compare them included sensitivity, specificity, precision, and error.
All the ML methods used in this study could provide a confidence score on the classification of vitamin D deficiency vs. no vitamin D deficiency. By varying the threshold of this confidence score, it was possible to compensate for the rate of true positive outcomes (sensitivity) with the rate of false positive outcomes (1-specificity) and, therefore, generate a curve of the receiver operating characteristic (ROC). The standard measure of the area under the ROC curve (AUC) was used to report and compare the efficiency of the models.

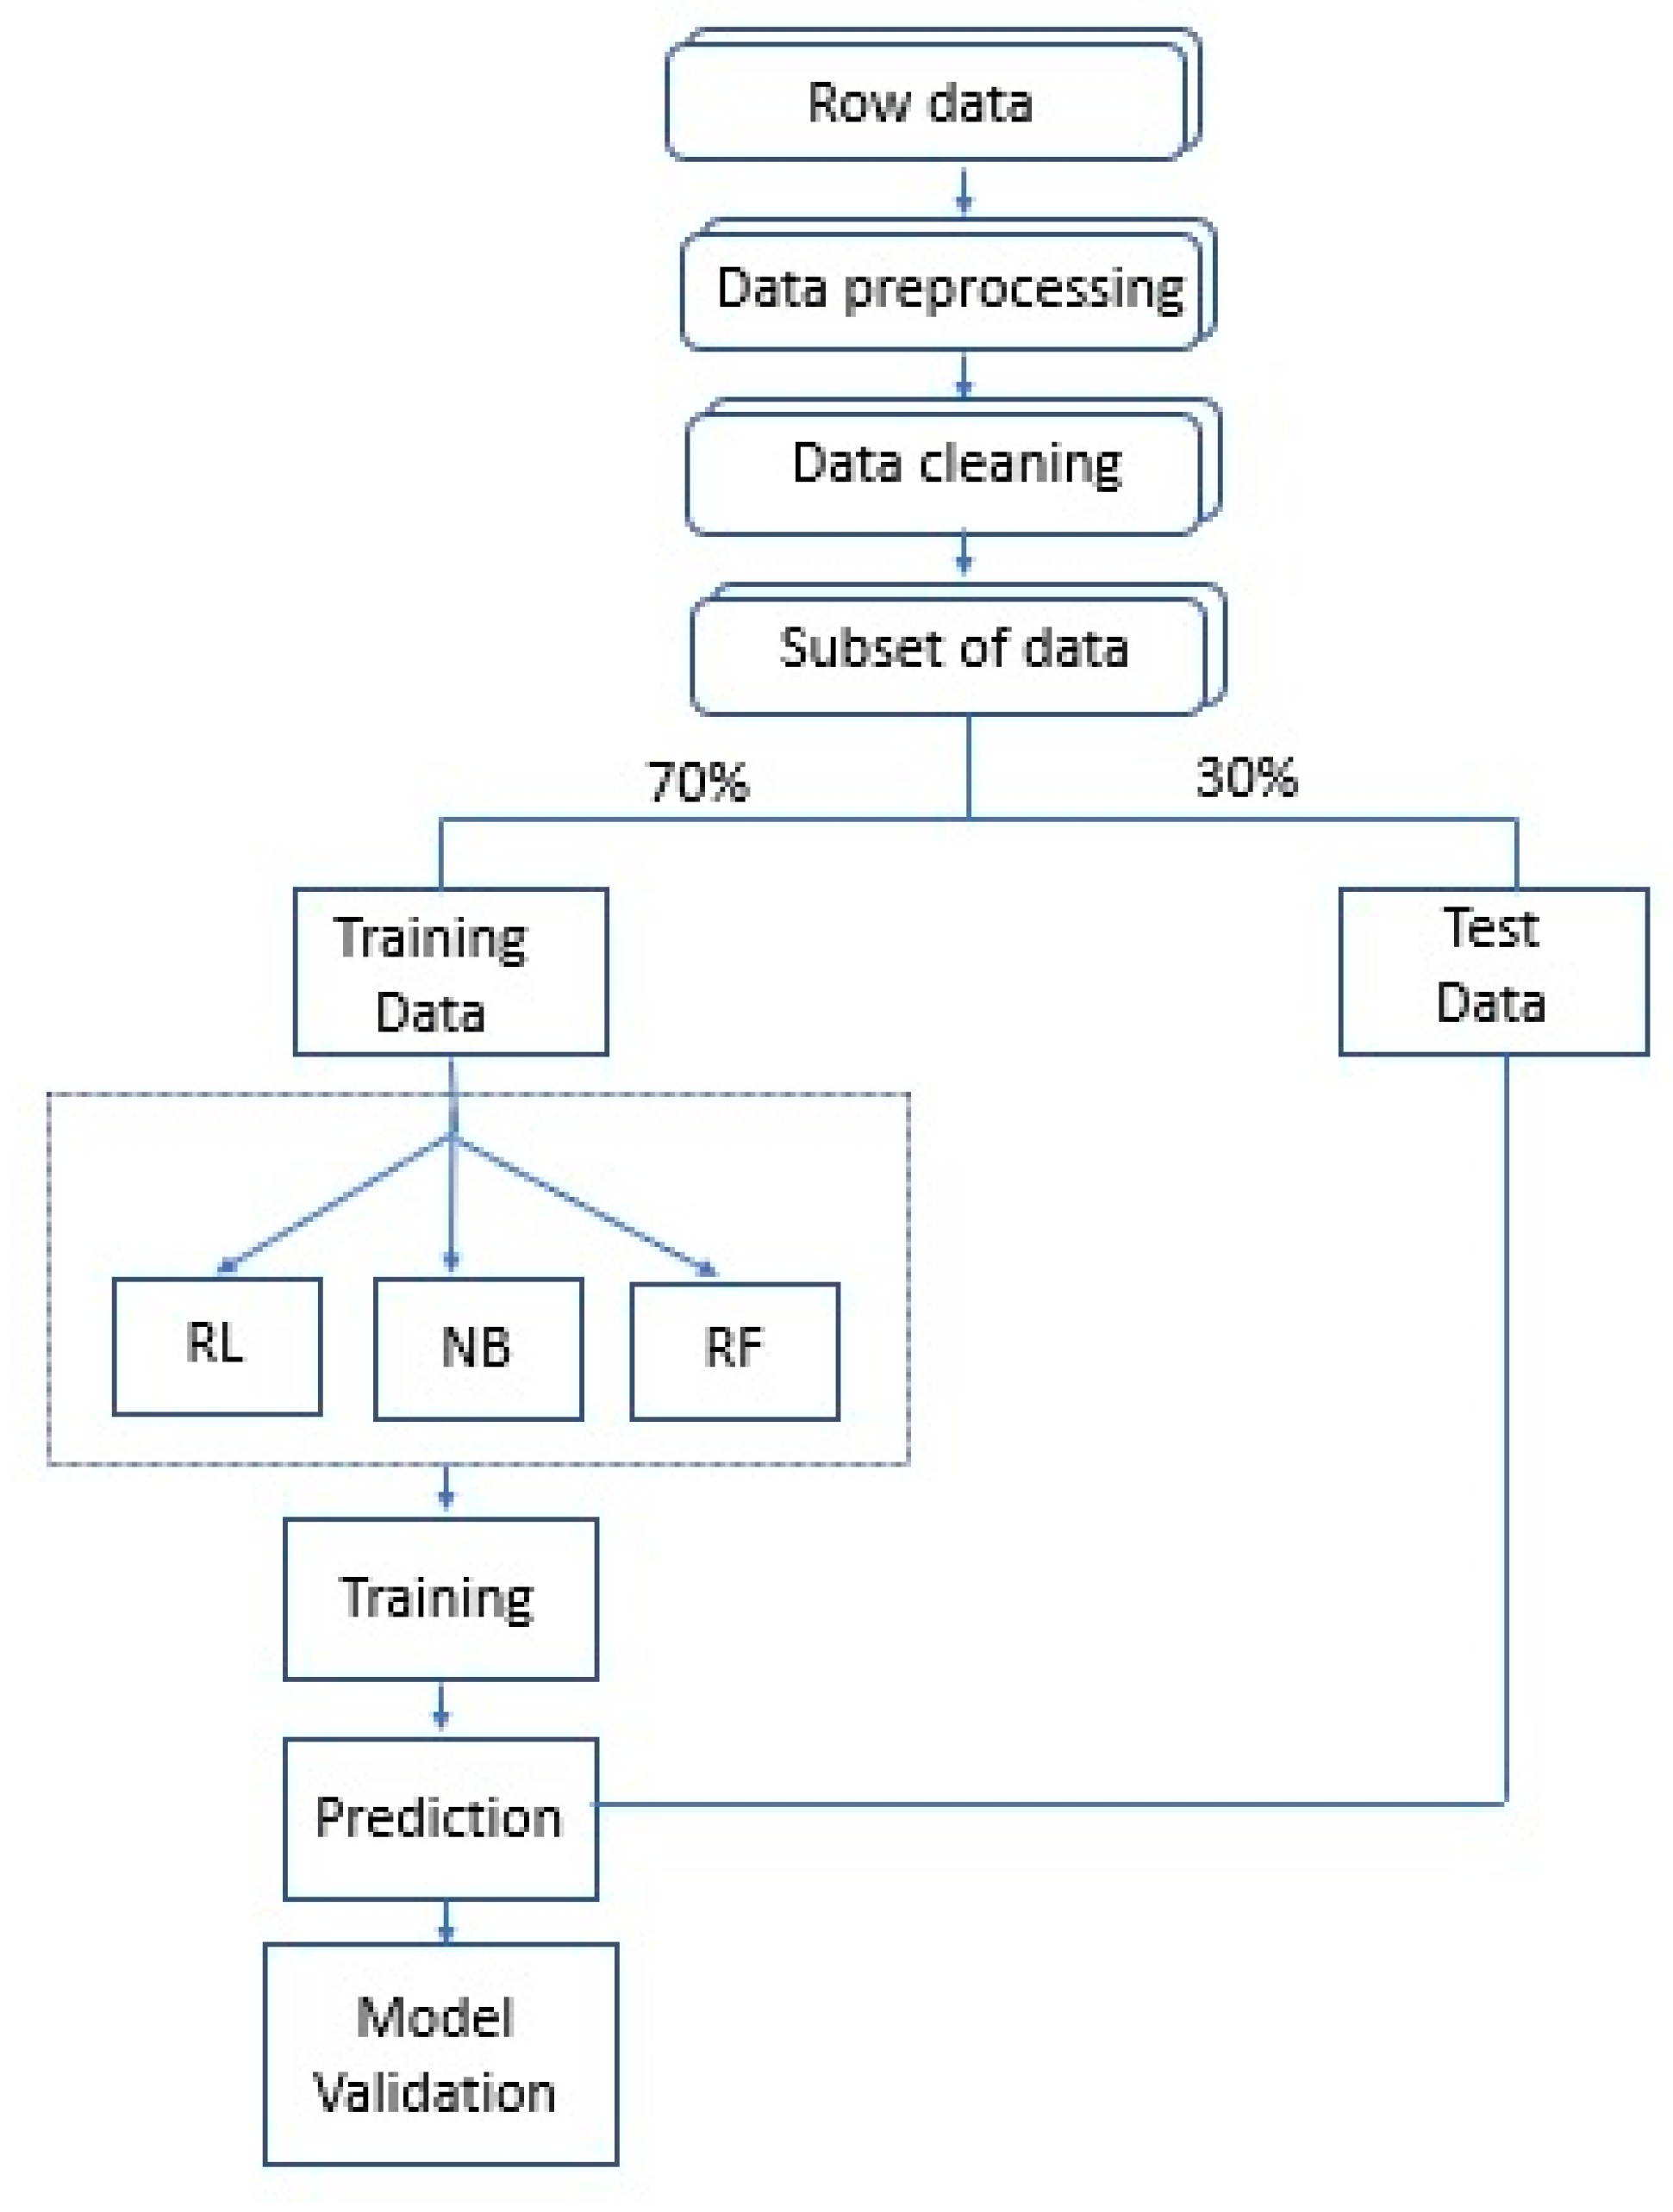
2.4.1. Machine Learning Techniques: LR, NB, RF

ML is a form of artificial intelligence that enables machines to learn and respond under specific conditions. It employs techniques and algorithms that can predict future events or classify data by identifying and learning the patterns in the existing data.

2.4.2. Logistic Regression

Logistic regression (LR) is a statistical-inferential machine-learning technique employed by researchers to analyze and classify binary and proportional response datasets that dates back to the 1960s [45,46]. LR analysis extends multiple regression analysis techniques to research situations in which the outcome variable is categorical. The model for logistic regression analysis assumes that the outcome variable, Y, is categorical, but LR does not model this outcome variable directly. It is based on probabilities associated with the values of Y. It is a type of regression that predicts the probability of an occurrence by fitting data to a logistic function; that is, it is about finding a sigmoid function that maximizes the probability of the observed values in the dataset [47]. The logit of the LR model is transformed by the following equation:
l o g i t   ( y ) = b 0 + b 1 x 1 + b 2 x 2 + + b n x n
where b 0 is the intercept of the equation, and b 1 ,   b 2 ,   ,   b n are the coefficients of independent variables x 1 ,   x 2 ,   ,   x n . The logistic (logit) transformation is the logarithm of the odds of the positive response, and it is defined as:
ln ( p 1 p ) = x β
The probability P ( Y = 1 / X ) is calculated in the LR model as follows:
P ( Y = 1 / x 1 , x 2 x n ) = p ( x )
The general equation is:
p ( x ) = 1 1 + e β x i = 1 1 + e ( b 0 + b 1 x 1 + b 2 x 2 + + b n x n ) = 1 1 + e ( b 0 +   β i X i )
The regression coefficients are usually estimated using maximum likelihood (ML) estimation [48]. The ML method is based on the joint probability density of the observed data, and acts as a function of the unknown parameters in the model. Now, with the assumption that the observations are independent, the likelihood function is:
L ( β ) = i = 1 n ( p i ) y i ( 1 p i ) 1 y i = i = 1 n ( e x i β 1 + e x i β ) y i ( 1 1 + e x i β ) 1 y i
The log-likelihood is:
ln   L ( β ) = i = 1 n ( y i ln ( e x i β 1 + e x i β ) + ( 1 y i ) ln ( 1 1 + e x i β ) )
Some of the main advantages of LR are that it can naturally provide probabilities and extend to multiclass classification problems [49].

2.4.3. Naïve Bayes

Naïve Bayes (NB) is a supervised classifier based on Bayes’ theorem. An NB classifier assumes that the existence or absence of a specific feature of a class is independent of and unrelated to the presence (or absence) of any other feature [50]. The method is based on the class-conditional independence assumption. Despite the naïve design, some studies have exhibiting the effectiveness of the NB [51]. NB presents several advantages: the structure is predefined, it is very efficient when the features are not strongly correlated, and it requires a small amount of training data to estimate the necessary parameters [52]. One limitation is that the attribute independence assumption is often violated in the real world.
It is defined as:
  • X < X 1 ,   , X k > as an instance (vector of random variables denoting observed attribute values);
  • x < x < x 1 ,   ,   x k > as a particular instance;
  • C as a random variable denoting the class of an instance;
  • c represents the value that C takes.
Each instance is assumed to belong to one class C   { c 1 , c 2 ,   ,   c m } . In NB, all attributes are assumed to be independent given the value of the class variable (conditional independence assumption): P ( C = c s / X = x i ) . Applying Bayes’ theorem, it is obtained by:
P ( c s / x i ) = P ( x i / c s ) P ( c s ) P ( x i )
P ( x i / c s ) P ( c s ) is the joint probability of xi and c s . Let us assume that the individual x i are independent from each other. Thus, the joint probability of x and c s is:
P ( x / c s ) P ( c s ) = P ( x 1 / c s ) P ( x k / c s ) P ( c s ) = n = 1 k P ( x k / c s ) P ( c s )
Thus, it is obtained by:
P ( c s / X ) = n = 1 k P ( x k / c s ) P ( c s ) P ( x )
P ( x ) does not depend on the class; it is the same for all classes. NB aims to determine the class using the maximum a posteriori (MAP) decision rule, and it is calculated as y ^ for the instance x as follows:
y ^ = argmax c s n = 1 k P ( x n / c s ) P ( c s )

2.4.4. Random Forest

The Random Forest (RF) algorithms form a family of classification methods that rely on several decision trees for building a predictor ensemble with a set of decision trees that grow in randomly selected subspaces of data. The RF algorithm was introduced by Breiman [53], and it is defined as the group of decision trees whose nodes are defined at the preprocessing step. RF handles a huge number of input variables without the deletion of variables. It uses two randomizations: bagging and random feature selection, which introduces randomization in the choice of the splitting test designed for each node of the tree. The choice is usually based on an impurity measure that is used as a criterion to determine the best feature for the partition of the current node into several child nodes [54]. Each tree in the collection is formed by first selecting at random, at each node, a small group of input coordinates on which to split, and secondly, by calculating the best split based on these features in the training set. The tree is grown using the CART methodology of Breiman et al. [55] to maximum size without pruning.
A random forest is a classifier consisting of a of a collection of randomized base regressions { k (x, Θn), n = 1, … ,J} in which {Θk} are independent and identically distributed random vectors, and each tree h(x, Θn) casts a unit vote for the most popular class at input x [53].
The general growing and voting process of RF was as follows. A bootstrap sample was chosen from the training set to grow each tree of RF. In the RF, the number of trees and the number of predictor variables chosen at each node were the tuning parameters determining the RF overall fit. Because the RF was composed of many individual decision trees (DTs), an RF algorithm was required to determine the suitable number. The error of the RF was approximated by the out-of-bag (OOB) score. This method allowed us to find the proper size of the RF. Each tree was built on a different bootstrap sample.
Machine learning has been used in different fields of health and medicine. Various other machine-learning techniques have attracted attention in recent years. A low vitamin D status is common in the general population. This finding is of concern because it has been associated with several chronic diseases, including cardiovascular diseases (CVD) [17,18], the leading causes of death. Therefore, different artificial intelligence methods, such as classification algorithms, should be used to significantly improve the efficiency of vitamin D deficiency detection. This study compared multiple LR, a linear method, with NB and RF, two nonlinear machine-learning methods. All the analyses were performed using the statistical software SPSS for Windows, version 23.0 (IBM Corp, Armonk, NY, USA), and R, version 3.4.1. In the hypothesis test, an α risk of 0.05 was established as the limit of statistical significance.
Figure 1 presents a summary flow diagram of the approach proposed in this study.

3. Results

3.1. Characteristics of the Population

The general characteristics of the individuals included in this study are shown in Table 1, including their sex and their levels of vitamin D. The mean age was 55.90 ± 14.24 years. The males showed higher values of arterial pressure, blood glucose, triglycerides, LDL cholesterol, and RCV, and lower values of HDL cholesterol, as compared to the females. The prevalence of smokers, hypertensives, and diabetics was greater in males. The mean values of BMI, WC, WhtR, and BRI were higher in males, whereas hip circumference and CUN-BAE were greater in females. A total of 174 individuals (%) presented values of vitamin D of <20 ng/mL. The patients with <20 ng/mL vitamin D presented greater values in all the analyzed anthropometric parameters.

3.2. Association of the Anthropometric Parameters with Vitamin D

The logistic regression analysis, both globally and stratified by sex, is presented in Table 2. In the global analysis, higher values of all the parameters analyzed in the three models were associated with lower 25-hydroxyvitamin D values. In model 3, the OR ranged from 1.249 with BRI to 1.005 with WHTr*1000. No statistically significant association was found with CUN-BAE in any of the three models. In the analysis by sex, the association was maintained in males for all parameters except CUN-BAE, with an OR ranging between 1.467 for BRI and 1.008 for WHtR*1000. Therefore, we concluded that the results for males were similar to the overall sample. In contrast, in females, the only anthropometric parameter associated with 25-hydroxyvitamin D deficiency was CUN-BAE, with an OR ranging from 1.044 to 1.060.

3.3. Comparing the Performance of Data-Mining Algorithms in the Prediction of Vitamin D Deficiency

Table 3 presents the percentages of success, error, sensitivity, specificity, and AUC-ROC obtained for each classifier. It can be observed that the logistic regression built models with the greatest precision in WC and CUN-BAE (92.4%), BMI (91.9%), WHtR (91%), and BRI (91%). In the case of CUN-BAE, the RL was closely followed by the NB classifier (92.3%). However, for the anthropometric parameter VAI, it was the NB classifier that presented the highest value, 94.2%. NB exceeded the logistic regression in the area under the curve for WC (AUC = 0.528; CI: 0.494–0.563), BMI (AUC = 0.538; CI: 0.502–0.574), WHtR (AUC = 0.538; CI: 0.499–0.575), and BRI (AUC = 0.533; CI: 0.497–0.570). However, for VAI and CUN-BAE, the logistic regression presented higher values in the area under the curve (AUC = 0.531, CI: 0.494–0.568; and AUC= 0.536, CI: 0.501–0.572, respectively).
The highest values in terms of sensitivity were obtained by NB in WC, BMI, and VAI (66.9%, 69.7%, and 70.5%, respectively), and by RF in WHtR, BRI, and CUN-BAE (68.7%, 69.4%, and 68.3%, respectively). Regarding specificity in all the anthropometric parameters, the highest values were obtained by LR. Sensitivity for all three algorithms and for all anthropometric parameters showed similar results, with values ranging from 0.650 to 0.705. The highest values in terms of sensitivity for the anthropometric parameters VAI, BMI, and WC (70.5%, 69.7%, and 66.9%, respectively) were obtained with NB. The highest values in terms of sensitivity for BRI, WHtR, and CUN-BAE (69.4%, 68.7%, and 68.3%, respectively) were achieved with RF. Regarding specificity in all the anthropometric parameters, the highest values were obtained by LR, ranging from 0.488 to 0.528. RF and NB presented very low values in specificity in all anthropometric parameters, with the exception of the NB algorithm for the anthropometric parameter VAI.

4. Discussion and Conclusions

Through a logistic regression model, we explored the capacity of anthropometric parameters to predict vitamin D deficiency, and we concluded that the behavior of these parameters differed according to sex; thus, in males, WC, WHtR, VAI, and BRI were associated with low levels of vitamin D, whereas in females, CUN-BAE was associated with low vitamin D.
To the best of our knowledge, this was the first study to use ML algorithms for the detection of vitamin D and investigate its predictability using anthropometric parameters.
Vitamin D deficiency (<20 ng/mL) in our study affected 34.7% of the participants. These results were in line with the systematic review conducted by Manios et al. [56], who reported that in Southern European countries, over one-third of the population had vitamin D levels <20 ng/mL, and 10% of the population had values <10 ng/mL. A cross-sectional, retrospective study with 21,490 patients (74.3% females) aged between 14 and 105 years who had used primary healthcare in La Rioja (Spain) showed that the mean levels of 25(OH)D were 18.3 (SD, 11.6) ng/mL in the entire sample [57], with males presenting lower values than females (17.6 vs. 18.5 ng/mL, p < 0.001). However, our study did not obtain significant differences according to sex, and the mean levels were above 25.56 (SD, 19.30), likely due to the differences in age, sex, and associated diseases between the study populations.
The relationship between low concentrations of 25(OH)D and obesity has been previously reported [58,59]. Jääskeläine et al. [60] used data from the 2000–2011 Health Survey and suggested that vitamin D deficiency may be a risk factor for abdominal obesity among males, but not among females. These results were in line with those of our study; in males, in the logistic regression analysis, WC and BMI were associated with vitamin D deficiency. Nevertheless, these results disagreed with those of Cătoi et al. [61], who explored the complex relationship between the levels of 25(OH)D and overweight/obesity, insulin resistance, systemic inflammation, and oxidative stress, revealing that overweight and an increasing degree of obesity were not significantly associated with a decrease in the levels of 25(OH)D.
A Danish study with 4909 children and adolescents in the Danish Childhood Obesity Biobank (2860 females) found that vitamin D deficiency was common among Danish children and adolescents with obesity. Our results were in line with those of that study, as the individuals with vitamin D deficiency showed greater BMI, WHtR, and frequency in males, which indicated that the degree of obesity was independently associated with lower serum concentrations of 25(OH)D [62]. Moreover, it is known that obese people need higher vitamin D loading doses to reach the same amount of serum 25-hydroxyvitamin D as people with normal body weight [5]. However, not all studies have found this association. The results of Pereira Santos et al. [4] indicated that overweight and obese individuals in different age groups have a similar probability of presenting with vitamin D deficiency. These discrepancies could be due to the origins of the different study populations.
In a study conducted with young Italian females, Adami et al. [15] found that the main determinants of vitamin D deficiency were an increase in BMI and exposure to sunlight. In a more recent study performed to identify the best combination of predictors for the serum concentration of vitamin D in adults aged between 18 and 70 years old, the multivariate linear regression model included age, sex, BMI, sunlight exposure in the previous week and during the month of blood sample collection, skin phototype, job position, smoking status, physical activity, latitude, and administration of vitamin D supplements in the previous year [63]. However, these results differed from some of our results, in that BMI was not found to be significant in females; we considered that these differences could be due to differences in age ranges and ethnicities.
The relationship we found between vitamin D deficiency and VAI was in disagreement with the study by Izadi et al. [64], who analyzed a sample of 57 males and 26 females with nonalcoholic fatty liver disease (NAFLD) and despite controlling for age and sex, they found a reverse association between VAI and vitamin D levels. Nevertheless, a study by Zubiaga et al. [65] reported that body fat percentage (BFP), when calculated with CUN-BAE as a predictive marker of cardiovascular risk in patients with morbid obesity before and after being subjected to vertical gastrectomy (VG), was significantly correlated with three biochemical factors associated with greater cardiovascular risk (i.e., cortisol, vitamin D, and TG/HDL-C ratio), which was in line with our results, as we only found an association between CUN-BAE and vitamin D in females.
Several studies have analyzed the association (i.e., predictive ability) of 25-hydroxyvitamin D concentrations with various health problems, using different ML techniques. Luo et al. [66] analyzed whether 25-hydroxyvitamin D deficiency was associated with an increased incidence of COVID-19 and disease severity using multivariable logistic regression techniques in order to propose a predictive model. These authors observed that subjects with COVID-19 had lower 25-hydroxyvitamin D concentrations as compared to the controls without COVID-19, and that 25-hydroxyvitamin D deficiency influenced both hospitalization rates and the severity of COVID-19 in the Chinese subjects. Deschasaux et al. [67] used logistic regression in 1557 middle-aged adults without prior 25-hydroxyvitamin D treatment to develop a scale to predict 25-hydroxyvitamin D deficiency and identify adults at risk of deficiency. This scale indicated that in subjects with scores of ≥7 points, 70% were deficient in 25-hydroxyvitamin D, and when the score was >9, 80% were deficient in 25-hydroxyvitamin D, with a sensitivity of 0.67 and a specificity of 0.63. Therefore, the application of this scale could avoid unjustified 25-hydroxyvitamin D supplementation and unnecessary blood tests. Garcia-Carretero et al. [37] analyzed 1002 hypertensive patients to establish predictive models to identify patients unlikely to have 25-hydroxyvitamin D deficiency or to undergo plasma 25-hydroxyvitamin D concentration measurements. To do so, they used the classifiers logistic regression, support vector machine (SVM), RF, NB, and extreme gradient boosting to calculate classification accuracy, sensitivity, specificity, and predictive values to assess the performance of each method. These authors found that the radial kernel, SVM-based method performed better than the other algorithms in terms of sensitivity (98%), negative predictive value (71%), and classification accuracy (73%). Therefore, they concluded that the combination of a feature-selection method such as elastic regularization, as well as a classification approach, produced well-fitted models. This combined approach allowed them to develop a prediction model with high sensitivity but low specificity, which was consistent with the results of our study, to identify the population that could benefit from a laboratory determination of serum 25-hydroxyvitamin D levels. Guo et al. [38] analyzed MLR and RBF-SVR techniques in 594 Caucasian adults to develop a score for predicting serum 25-hydroxyvitamin D concentration. The best results were found using the RBF-SVR model, which provided a better prediction of serum 25-hydroxyvitamin D concentrations and vitamin D deficiency, as compared to an MLR model. Lopes et al. [68] analyzed 908 community-dwelling older people using logistic regression to propose a model for detecting 25-hydroxyvitamin D deficiency. The model was able to identify older people at risk of 25-hydroxyvitamin D deficiency with a sensitivity of 55.9%, a specificity of 72.3%, and an ROC area of 0.685. These authors suggested that a clinical use of these parameters could help to identify and design appropriate public health interventions. Finally, Sohl et al. [69], in a longitudinal aging study in Amsterdam with 1509 subjects, developed a risk profile based on backward logistic regression to identify older people at high risk of 25-hydroxyvitamin D deficiency. In this study, two total risk scores were developed that included either 10 or 13 variables that were capable of predicting serum 25(OH)D concentrations of less than 0.50 and 0.30 nmol/L, respectively. This scale may be useful in clinical practice to identify individuals at risk of 25-hydroxyvitamin D deficiency.
Given the association between 25-hydroxyvitamin D deficiency and obesity, and that healthcare professionals deal with many variables that can influence health problems, ML algorithms have potential clinical application.
Recent research has further explored linking these techniques to provide hybrid ML algorithms. Therefore, the approach of this paper, which indicated that the predictive ability of different anthropometric parameters differed according to sex, could be useful in future research. However, additional studies are needed to confirm our results.

4.1. Limitations of the Study

This study had several limitations. Firstly, this was a cross-sectional study, which hindered the establishment of causal relationships between vitamin D levels and anthropometric parameters. Secondly, there may have been confounding variables that were not considered in this study. Lastly, the number of patients with vitamin D deficiency in our study was unbalanced as compared to the number of people with normal levels.

4.2. Conclusions

The capacity of anthropometric parameters to predict vitamin D deficiency differed according to sex; thus, WC, BMI, WHtR, VAI, and BRI were useful predictors in males, while CUN-BAE was more useful in females. In all the anthropometric parameters, the LR model presented the highest values in terms of specificity to predict vitamin D deficiency. The NB approach of ML showed the best area under the curve in WC, BMI, WHtR, and BRI, whereas the LR model did so for VAI and CUN-BAE.

Author Contributions

Conceptualization, C.P.-A., M.A.G.-M., L.G.-O. and E.R.-S.; methodology, M.G.-S., L.G.-S., M.A.G.-M., E.R.-S. and B.S.S.; data analysis, C.P.-A., M.A.G.-M. and L.G.-O.; writing—review and editing, all authors; supervision, C.P.-A.; funding acquisition, M.A.G.-M. All authors have read and agreed to the published version of the manuscript.

Funding

The project was funded by the Institute of Health Carlos III of the Spanish Ministry of Science, Innovation, and Universities through Red de investigación en cronicidad, atención primaria y promoción de la salud (RD21/0016/0010), and cofinanced by the European Union Health Institute/European Regional Development Fund (ERDF), the Autonomous Government of Castilla and León (GRS 1193/B/15, GRS 1821/B/18), and intensification of a research program (INT/M/08/19, INT/M/9/19/INT/M/14/19).

Institutional Review Board Statement

The study was approved by the Drug Research Ethics Committee of the Health Area of Salamanca on 4 May 2015 under registry number PI15/01039. All procedures conducted with human participants complied with the ethical rules of the institutional and/or national research committee and with the 2013 Declaration of Helsinki [70]. All participants signed an informed consent form before participating in this study.

Informed Consent Statement

Informed consent was obtained from all subjects involved in the study.

Data Availability Statement

Not applicable.

Conflicts of Interest

The authors declare that they have no known competing financial interest or personal relationships that could have influenced the work reported in this paper.

References

  1. Bassatne, A.; Chakhtoura, M.; Saad, R.; Fuleihan, G. Vitamin D supplementation in obesity and during weight loss: A review of randomized controlled trials. Metabolism 2019, 92, 193–205. [Google Scholar] [CrossRef] [PubMed]
  2. Cordeiro, A.; Santos, A.; Bernardes, M.; Ramalho, A.; Martins, M. Vitamin D metabolism in human adipose tissue: Could it explain low vitamin D status in obesity? Horm. Mol. Biol. Clin. Investig. 2017, 33. [Google Scholar] [CrossRef] [PubMed]
  3. Lagunova, Z.; Porojnicu, A.; Lindberg, F.; Hexeberg, S.; Moan, J. The dependency of vitamin D status on body mass index, gender, age and season. Anticancer Res. 2009, 29, 3713–3720. [Google Scholar] [CrossRef] [PubMed]
  4. Pereira-Santos, M.; Costa, P.R.F.; Assis, A.M.O.; Santos, C.A.S.T.; Santos, D.B. Obesity and vitamin D deficiency: A systematic review and meta-analysis. Obes. Rev. 2015, 16, 341–349. [Google Scholar] [CrossRef]
  5. Walsh, J.S.; Bowles, S.; Evans, A.L. Vitamin D in obesity. Curr. Opin. Endocrinol. Diabetes Obes. 2017, 24, 389–394. [Google Scholar] [CrossRef]
  6. Orces, C. The Association between Body Mass Index and Vitamin D Supplement Use among Adults in the United States. Cureus 2019, 11, e5721. [Google Scholar] [CrossRef]
  7. Camozzi, V.; Frigo, A.C.; Zaninotto, M.; Sanguin, F.; Plebani, M.; Boscaro, M.; Schiavon, L.; Luisetto, G. 25-hydroxycholecalciferol response to single oral cholecalciferol loading in the normal weight, overweight, and obese. Osteoporos. Int. 2016, 27, 2593–2602. [Google Scholar] [CrossRef]
  8. Forouzanfar, M.H.; Alexander, L.; Bachman, V.F.; Biryukov, S.; Brauer, M.; Casey, D.; Coates, M.M.; Delwiche, K.; Estep, K.; Frostad, J.J.; et al. Global, regional, and national comparative risk assessment of 79 behavioural, environmental and occupational, and metabolic risks or clusters of risks in 188 countries, 1990–2013: A systematic analysis for the Global Burden of Disease Study 2013. Lancet 2015, 386, 2287–2323. [Google Scholar] [CrossRef] [Green Version]
  9. Nishida, C.; Ko, G.T.; Kumanyika, S. Body fat distribution and noncommunicable diseases in populations: Overview of the 2008 WHO Expert Consultation on Waist Circumference and Waist-Hip Ratio. Eur. J. Clin. Nutr. 2010, 64, 2–5. [Google Scholar] [CrossRef] [Green Version]
  10. Ashwell, M.; Cole, T.J.; Dixon, A.K. Ratio of waist circumference to height is strong predictor of intraabdominal fat. BMJ 1996, 313, 559–560. [Google Scholar] [CrossRef] [Green Version]
  11. Amato, M.C.; Giordano, C.; Galia, M.; Criscimanna, A.; Vitabile, S.; Midiri, M.; Galluzzo, A. Visceral adiposity index: A reliable indicator of visceral fat function associated with cardiometabolic risk. Diabetes Care 2010, 33, 920–922. [Google Scholar] [CrossRef] [PubMed] [Green Version]
  12. Gómez-Ambrosi, J.; Silva, C.; Catalán, V.; Rodríguez, A.; Galofré, J.C.; Escalada, J.; Valentí, V.; Rotellar, F.; Romero, S.; Ramírez, B.; et al. Clinical usefulness of a new equation for estimating body fat. Diabetes Care 2012, 35, 383–388. [Google Scholar] [CrossRef] [PubMed] [Green Version]
  13. Thomas, D.M.; Bredlau, C.; Bosy-Westphal, A.; Mueller, M.; Shen, W.; Gallagher, D.; Maeda, Y.; McDougall, A.; Peterson, C.M.; Ravussin, E.; et al. Relationships between body roundness with body fat and visceral adipose tissue emerging from a new geometrical model. Obesity 2013, 21, 2264–2271. [Google Scholar] [CrossRef] [PubMed] [Green Version]
  14. Rosas-Peralta, M.; Holick, M.F.; Borrayo-Sánchez, G.; Madrid-Miller, A.; Ramírez-Árias, E.; Arizmendi-Uribe, E. Efectos inmunometabólicos disfuncionales de la deficiencia de vitamina D y aumento de riesgo cardiometabólico. Potencial alerta epidemiológica en América? Endocrinol. Diabetes y Nutr. 2017, 64, 162–173. [Google Scholar] [CrossRef] [PubMed]
  15. Adami, S.; Bertoldo, F.; Braga, V.; Fracassi, E.; Gatti, D.; Gandolini, G.; Minisola, S.; Battista Rini, G. 25-hydroxy vitamin D levels in healthy premenopausal women: Association with bone turnover markers and bone mineral density. Bone 2009, 45, 423–426. [Google Scholar] [CrossRef]
  16. Cashman, K.D.; Dowling, K.G.; Škrabáková, Z.; Gonzalez-Gross, M.; Valtueña, J.; De Henauw, S.; Moreno, L.; Damsgaard, C.T.; Michaelsen, K.F.; Mølgaard, C.; et al. Vitamin D deficiency in Europe: Pandemic? Am. J. Clin. Nutr. 2016, 103, 1033–1044. [Google Scholar] [CrossRef] [Green Version]
  17. Danik, J.S.; Manson, J.A.E. Vitamin D and cardiovascular disease. Curr. Treat. Options Cardiovasc. Med. 2012, 14, 414–424. [Google Scholar] [CrossRef] [Green Version]
  18. Gandini, S.; Boniol, M.; Haukka, J.; Byrnes, G.; Cox, B.; Sneyd, M.J.; Mullie, P.; Autier, P. Meta-analysis of observational studies of serum 25-hydroxyvitamin D levels and colorectal, breast and prostate cancer and colorectal adenoma. Int. J. Cancer 2011, 128, 1414–1424. [Google Scholar] [CrossRef]
  19. Foss, Y.J. Vitamin D deficiency is the cause of common obesity. Med. Hypotheses 2009, 72, 314–321. [Google Scholar] [CrossRef]
  20. Ilie, P.C.; Stefanescu, S.; Smith, L. The role of vitamin D in the prevention of coronavirus disease 2019 infection and mortality. Aging Clin. Exp. Res. 2020, 32, 1195–1198. [Google Scholar] [CrossRef]
  21. Aleksova, A.; Beltrami, A.P.; Belfiore, R.; Barbati, G.; Di Nucci, M.; Scapol, S.; De Paris, V.; Carriere, C.; Sinagra, G. U-shaped relationship between vitamin D levels and long-term outcome in large cohort of survivors of acute myocardial infarction. Int. J. Cardiol. 2016, 223, 962–966. [Google Scholar] [CrossRef] [PubMed]
  22. Elizondo-Montemayor, L.; Castillo, E.; Rodríguez-López, C.; Villarreal-Calderón, J.; Gómez-Carmona, M.; Tenorio-Martínez, S.; Nieblas, B.; García-Rivas, G. Seasonal Variation in Vitamin D in Association with Age, Inflammatory Cytokines, Anthropometric Parameters, and Lifestyle Factors in Older Adults. Mediators Inflamm. 2017, 2017, 5719461. [Google Scholar] [CrossRef] [PubMed] [Green Version]
  23. Michalski, R.; Carbonell, J.; Mitchell, T. Machine Learning: An Artificial Intelligence Approach; Springer Science & Business Media: Berlin, Germany, 2013. [Google Scholar]
  24. Kotsiantis, S.; Zaharakis, I.; Pintelas, P. Supervised machine learning: A review of classification techniques. Emerg. Artif. Intell. Appl. Comput. Eng. 2007, 160, 3–24. [Google Scholar]
  25. Dey, D.; Diaz Zamudio, M.; Schuhbaeck, A.; Juarez Orozco, L.E.; Otaki, Y.; Gransar, H.; Li, D.; Germano, G.; Achenbach, S.; Berman, D.S.; et al. Relationship between Quantitative Adverse Plaque Features from Coronary Computed Tomography Angiography and Downstream Impaired Myocardial Flow Reserve by 13N-Ammonia Positron Emission Tomography: A Pilot Study. Circ. Cardiovasc. Imaging 2015, 8, e003255. [Google Scholar] [CrossRef] [Green Version]
  26. Kavakiotis, I.; Tsave, O.; Salifoglou, A.; Maglaveras, N.; Vlahavas, I.; Chouvarda, I. Machine Learning and Data Mining Methods in Diabetes Research. Comput. Struct. Biotechnol. J. 2017, 15, 104–116. [Google Scholar] [CrossRef]
  27. Zou, Q.; Qu, K.; Luo, Y.; Yin, D.; Ju, Y.; Tang, H. Predicting Diabetes Mellitus With Machine Learning Techniques. Front. Genet. 2018, 9, 515. [Google Scholar] [CrossRef]
  28. Krittanawong, C.; Bomback, A.S.; Baber, U.; Bangalore, S.; Messerli, F.H.; Wilson Tang, W.H. Future Direction for Using Artificial Intelligence to Predict and Manage Hypertension. Curr. Hypertens. Rep. 2018, 20, 75. [Google Scholar] [CrossRef]
  29. Qawqzeh, Y.K.; Bajahzar, A.S.; Jemmali, M.; Otoom, M.M.; Thaljaoui, A. Classification of Diabetes Using Photoplethysmogram (PPG) Waveform Analysis: Logistic Regression Modeling. Biomed Res. Int. 2020, 2020, 3764653. [Google Scholar] [CrossRef]
  30. Tiwari, P.; Colborn, K.; Smith, D.; Xing, F.; Ghosh, D.; Rosenberg, M. Assessment of a machine learning model applied to harmonized electronic health record data for the prediction of incident atrial fibrillation. JAMA Netw. Open 2020, 3, e1919396. [Google Scholar] [CrossRef]
  31. Uddin, S.; Khan, A.; Hossain, M.E.; Moni, M.A. Comparing different supervised machine learning algorithms for disease prediction. BMC Med. Inform. Decis. Mak. 2019, 19, 281. [Google Scholar] [CrossRef]
  32. Saravanan, R.; Sujatha, P. A State of Art Techniques on Machine learning algorithms: A perspective of supervised learning approaches in data classification. In Proceedings of the 2018 Second International Conference on Intelligent Computing and Control Systems (ICICCS), Madurai, India, 14–15 June 2018; pp. 945–949. [Google Scholar]
  33. Zhu, X.; Goldberg, A. Introduction to semi-supervised learning. Synth. Lect. Artif. Intell. Mach. Learn. 2009, 31, 1–130. [Google Scholar] [CrossRef] [Green Version]
  34. Narang, R.K.; Gamble, G.G.; Khaw, K.T.; Camargo, C.A.; Sluyter, J.D.; Scragg, R.K.R.; Reid, I.R. A prediction tool for vitamin D deficiency in New Zealand adults. Arch. Osteoporos. 2020, 15, 172. [Google Scholar] [CrossRef] [PubMed]
  35. Heo, J.-C.; Kim, D.; An, H.; Son, C.-S.; Cho, S.; Lee, J.-H. A Novel Biosensor and Algorithm to Predict Vitamin D Status by Measuring Skin Impedance. Sensors 2021, 21, 8118. [Google Scholar] [CrossRef] [PubMed]
  36. Miller, D.D.; Brown, E.W. Artificial Intelligence in Medical Practice: The Question to the Answer? Am. J. Med. 2018, 131, 129–133. [Google Scholar] [CrossRef]
  37. Garcia Carretero, R.; Vigil-Medina, L.; Barquero-Perez, O.; Mora-Jimenez, I.; Soguero-Ruiz, C.; Ramos-Lopez, J. Machine learning approaches to constructing predictive models of vitamin D deficiency in a hypertensive population: A comparative study. Informatics Heal. Soc. Care 2021, 46, 355–369. [Google Scholar] [CrossRef]
  38. Guo, S.; Lucas, R.M.; Ponsonby, A.L.; Chapman, C.; Coulthard, A.; Dear, K.; Dwyer, T.; Kilpatrick, T.; McMichael, T.; Pender, M.P.; et al. A novel approach for prediction of vitamin D status using support vector regression. PLoS ONE 2013, 8, e79970. [Google Scholar] [CrossRef]
  39. Ricciardi, C.; Cantoni, V.; Improta, G.; Iuppariello, L.; Latessa, I.; Cesarelli, M.; Triassi, M.; Cuocolo, A. Application of data mining in a cohort of Italian subjects undergoing myocardial perfusion imaging at an academic medical center. Comput. Methods Programs Biomed. 2020, 189, 105343. [Google Scholar] [CrossRef]
  40. Gomez-Marcos, M.A.; Martinez-Salgado, C.; Gonzalez-Sarmiento, R.; Hernandez-Rivas, J.M.; Sanchez-Fernandez, P.L.; Recio-Rodriguez, J.I.; Rodriguez-Sanchez, E.; Garca-Ortiz, L. Association between different risk factors and vascular accelerated ageing (EVA study): Study protocol for a cross-sectional, descriptive observational study. BMJ Open 2016, 6, e011031. [Google Scholar] [CrossRef]
  41. Salas-Salvadó, J.; Rubio Hererra, M.A.; Barbany, M.; Moreno, B. Consensus for the evaluation of overweight and obesity and the establishment of therapeutic intervention criteria. Med. Clin. (Barc). 2007, 128, 184–196. [Google Scholar] [CrossRef]
  42. Oliveros, E.; Somers, V.K.; Sochor, O.; Goel, K.; Lopez-Jimenez, F. The concept of normal weight obesity. Prog. Cardiovasc. Dis. 2014, 56, 426–433. [Google Scholar] [CrossRef]
  43. Browning, L.M.; Hsieh, S.D.; Ashwell, M. A systematic review of waist-to-height ratio as a screening tool for the prediction of cardiovascular disease and diabetes: 05 could be a suitable global boundary value. Nutr. Res. Rev. 2010, 23, 247–269. [Google Scholar] [CrossRef] [PubMed] [Green Version]
  44. Bouillon, R.; Carmeliet, G. Vitamin D insufficiency: Definition, diagnosis and management. Best Pract. Res. Clin. Endocrinol. Metab. 2018, 32, 669–684. [Google Scholar] [CrossRef] [PubMed]
  45. Kleinbaum, D.; Kupper, L.; Nizam, A.; Muller, K. Applied Regression Analysis and Multivariable Methods, 4th ed.; Duxbury Press: Pacific Grove, CA, USA, 2007. [Google Scholar]
  46. Hilbe, J. Logistic Regression Models; Chapman & Hall/CRC: Boca Raton, FL, USA, 2009. [Google Scholar]
  47. Kleinbaum, D. Logistic Regression: A Self-Learning Text; Springer: New York, NY, USA, 1994. [Google Scholar]
  48. Maalouf, M. Logistic regression in data analysis: An overview. Int. J. Data Anal. Tech. Strateg. 2011, 3, 281–299. [Google Scholar] [CrossRef]
  49. Hastie, T.; Tibshirani, R.; Friedman, J. The Elements of Statistical Learning: Data Mining, Inference, and Prediction; Springer: New York, NY, USA, 2009. [Google Scholar]
  50. Berrar, D. Bayes’ Theorem and Naive Bayes Classifier. Encycl. Bioinform. Comput. Biol. 2018, 1, 403–412. [Google Scholar] [CrossRef]
  51. Hand, D.; Chan, Y. Idiot’s Bayes—Not so stupid after all? Int. Stat. Rev. 2001, 69, 385–398. [Google Scholar]
  52. Jahan, R. Applying Naive Bayes Classification Technique for Classification of Improved Agricultural Land soils. Int. J. Res. Appl. Sci. Eng. Technol. 2018, 6, 189–193. [Google Scholar] [CrossRef]
  53. Breiman, L. Random forests. Mach. Learn. 2001, 45, 5–32. [Google Scholar] [CrossRef] [Green Version]
  54. Bernard, S.; Adam, S.; Heutte, L. Dynamic Random Forests. Pattern Recognit. Lett. 2012, 33, 1580–1586. [Google Scholar] [CrossRef] [Green Version]
  55. Breiman, L.; Friedman, J.; Olshen, R.; Stone, C. Classification and Regression Trees; Chapman & Hall: New York, NY, USA, 1984. [Google Scholar]
  56. Manios, Y.; Moschonis, G.; Lambrinou, C.P.; Tsoutsoulopoulou, K.; Binou, P.; Karachaliou, A.; Breidenassel, C.; Gonzalez-Gross, M.; Kiely, M.; Cashman, K.D. A Systematic Review of Vitamin D Status in Southern European Countries; Springer: Berlin/Heidelberg, Germany, 2018; Volume 57, ISBN 0039401715. [Google Scholar]
  57. Díaz-López, A.; Paz-Graniel, I.; Alonso-Sanz, R.; Marqués-Baldero, C.; Mateos-Gil, C.; Arija-Val, V. Vitamin D deficiency in primary health care users at risk in Spain. Nutr. Hosp. 2021, 38, 1058–1067. [Google Scholar]
  58. Mansouri, M.; Miri, A.; Varmaghani, M.; Abbasi, R.; Taha, P.; Ramezani, S.; Rahmani, E.; Armaghan, R.; Sadeghi, O. Vitamin D deficiency in relation to general and abdominal obesity among high educated adults. Eat. Weight Disord. 2019, 24, 83–90. [Google Scholar] [CrossRef]
  59. Vanlint, S. Vitamin D and obesity. Nutrients 2013, 5, 949–956. [Google Scholar] [CrossRef] [PubMed] [Green Version]
  60. Jääskeläinen, T.; Männistö, S.; Härkänen, T.; Sääksjärvi, K.; Koskinen, S.; Lundqvist, A. Does Vitamin D status predict weight gain or increase in waist circumference? Results from the longitudinal Health 2000/2011 Survey. Public Health Nutr. 2020, 23, 1266–1272. [Google Scholar] [CrossRef] [PubMed]
  61. Cătoi, A.F.; Iancu, M.; Pârvu, A.E.; Cecan, A.D.; Bidian, C.; Chera, E.I.; Pop, I.D.; Macri, A.M. Relationship between 25 hydroxyvitamin d, overweight/obesity status, pro-inflammatory and oxidative stress markers in patients with type 2 diabetes: A simplified empirical path model. Nutrients 2021, 13, 2889. [Google Scholar] [CrossRef] [PubMed]
  62. Plesner, J.L.; Dahl, M.; Fonvig, C.E.; Nielsen, T.R.H.; Kloppenborg, J.T.; Pedersen, O.; Hansen, T.; Holm, J.C. Obesity is associated with Vitamin D deficiency in Danish children and adolescents. J. Pediatr. Endocrinol. Metab. 2018, 31, 53–61. [Google Scholar] [CrossRef]
  63. Viprey, M.; Merle, B.; Riche, B.; Freyssenge, J.; Rippert, P.; Chakir, M.A.; Thomas, T.; Malochet-guinamand, S.; Cortet, B.; Breuil, V.; et al. Development and validation of a predictive model of hypovitaminosis d in general adult population: SCOPYD study. Nutrients 2021, 13, 2526. [Google Scholar] [CrossRef]
  64. Izadi, A.; Aliasghari, F.; Gargari, B.P.; Ebrahimi, S. Strong association between serum vitamin D and vaspin levels, AIP, VAI and liver enzymes in NAFLD patients. Int. J. Vitam. Nutr. Res. 2020, 90, 59–66. [Google Scholar] [CrossRef]
  65. Toro, L.Z.; Polo, J.R.T.; Díez-Tabernilla, M.; Bernal, L.G.; Sebastián, A.A.; Rico, R.C. Fórmula CUN-BAE y factores bioquímicos como marcadores predictivos de obesidad y enfermedad cardiovascular en pacientes pre y post gastrectomía vertical. Nutr. Hosp. 2014, 30, 281–286. [Google Scholar]
  66. Luo, X.; Liao, Q.; Shen, Y.; Li, H.; Cheng, L. Vitamin D deficiency is associated with COVID-19 incidence and disease severity in Chinese people. J. Nutr. 2021, 151, 98–103. [Google Scholar] [CrossRef]
  67. Deschasaux, M.; Souberbielle, J.C.; Andreeva, V.A.; Sutton, A.; Charnaux, N.; Kesse-Guyot, E.; Latino-Martel, P.; Druesne-Pecollo, N.; De Edelenyi, F.S.; Galan, P.; et al. Quick and easy screening for Vitamin D insufficiency in adults a scoring system to be implemented in daily clinical practice. Medicine 2016, 95, e2783. [Google Scholar] [CrossRef]
  68. Lopes, J.B.; Fernandes, G.H.; Takayama, L.; Figueiredo, C.P.; Pereira, R.M.R. A predictive model of vitamin D insufficiency in older community people: From the São Paulo Aging & Health Study (SPAH). Maturitas 2014, 78, 335–340. [Google Scholar]
  69. Sohl, E.; Heymans, M.W.; De Jongh, R.T.; Den Heijer, M.; Visser, M.; Merlijn, T.; Lips, P.; Van Schoor, N.M. Prediction of vitamin D deficiency by simple patient characteristics. Am. J. Clin. Nutr. 2014, 99, 1089–1095. [Google Scholar] [CrossRef] [PubMed] [Green Version]
  70. World Medical Association. World Medical Association Declaration of Helsinki: Ethical principles for medical research involving human subjects. JAMA 2013, 310, 2191–2194. [Google Scholar] [CrossRef] [PubMed] [Green Version]
Figure 1. Flow diagram.
Mathematics 10 00616 g001
Table 1. Baseline demographic and clinical characteristics of participants in the overall sample by sex and with and without vitamin D deficiency.
VariablesOverall (n = 501)Females (n = 252)Males (n = 249)p1Normal Levels of Vitamin D (n = 327)Vitamin D Deficit (n = 174)p2
Cardiovascular risk factors
Age, years55.90 ± 14.2455.85 ± 14.1955.95 ± 14.300.93455.77 ± 14.4356.14 ± 13.900.782
Smoker, n (%)90 (18.00)41 (16.30)49 (19.70)0.32047 (14.4)43 (24.7)0.004
SBP, mmHg120.69 ± 23.13114.99 ± 24.96126.47 ± 19.52<0.001120.62 ± 25.78120.83 ± 17.140.921
DBP, mmHg75.53 ± 10.1073.67 ± 10.4677.40 ± 9.37<0.00175.30 ± 10.3975.95 ± 9.540.496
Hypertension, n (%)147 (25.80)65 (29.30)82 (32.90)0.07996 (29.4)51 (29.3)0.991
Total cholesterol, (mg/dL)194.76 ± 32.50196.88 ± 32.64192.61 ± 32.260.142193.96 ± 32.21196.27 ± 33.070.450
LDL-C, mg/dL115.51 ± 29.37113.61 ± 28.54117.43 ± 14.120.148114.37 ± 28.68117.65 ± 30.590.236
HDL-C, mg/dL58.88 ± 16.1564.27 ± 16.1453.43 ± 14.23<0.00160.27 ± 16.3356.27 ± 15.510.008
Triglycerides, mg/dL103.12 ± 53.1194.07 ± 50.48112.27 ± 54.23<0.00197.90 ± 46.63112.93 ± 62.510.002
Dyslipidemia, n (%)191 (38.1)96 (38.2)95 (38.1)0.905208 (64.0)118 (67.8)0.393
Glycemia, mg/dL88.21 ± 17.3786.30 ± 15.7390.14 ± 18.710.01387.05 ± 15.2090.39 ± 20.720.040
HbA1c, (%)5.49 ± 0.565.44 ± 0.475.54 ± 0.630.0435.48 ± 0.505.51 ± 0.650.466
Diabetes mellitus, n (%)38 (7.60)12 (4.8)26 (10.50)0.01623 (7.0)15 (8.6)0.523
CVR score (%)11.80 ± 13.006.48 ± 6.6717.22 ± 15.43<0.00110.99 ± 12.3813.33 ± 14.020.056
Vitamin D25.56 ± 19.3026.55 ± 25.6024.61 ± 10.110.276---------
Drugs
Antihypertensive drugs, n (%)96 (19.20)46 (18.30)50 (20.10)0.60458 (17.7)38 (21.8)0.267
Lipid-lowering drugs, n (%)102 (20.40)53 (21.00)49 (19.70)0.70772 (22.0)30 (17.2)0.206
Antidiabetic drugs, n (%)35 (7.00)12 (4.8)23 (9.20)0.04922 (6.7)13 (7.5)0.756
Anthropometric parameters
Height, cm165.11 ± 9.68158.70 ± 6.98171.60 ± 7.46<0.001165.59 ± 9.67164.21 ± 9.670.128
Weight, kg72.41 ± 13.6165.67 ± 11.8779.22 ± 11.75<0.00171.68 ± 12.9973.76 ± 4.650.104
WC, (cm)93.33 ± 11.9987.95 ± 11.6898.76 ± 9.65<0.00192.32 ± 11.7895.21 ± 12.200.010
Hip circumference, (cm)103.13 ± 9.24103.55 ± 9.34102.71 ± 9.130.313102.29 ± 9.38104.72 ± 8.780.005
BMI ≥ 30, n (%)94 (18.80)52 (20.6)42 (16.90)0.28052 (15.9)42 (24.1)0.025
BMI, (kg/m2)26.52 ± 4.2326.14 ± 4.7926.90 ± 3.540.04426.11 ± 4.0827.28 ± 4.400.003
WHtR0.57 ± 0.070.56 ± 0.080.58 ± 0.060.0010.56 ± 0.070.58 ± 0.070.001
BRI4.79 ± 1.574.59 ± 1.734.98 ± 1.360.0054.62 ± 1.555.09 ± 1.560.002
VAI3.26 ± 2.423.22 ± 2.593.30 ± 2.250.7283.02 ± 2.263.71 ± 2.650.002
CUN-BAE33.20 ± 7.8638.50 ± 6.3727.82 ± 5.07<0.00132.73 ± 7.7434.07 ± 8.020.068
BMI, body mass index; SBP, systolic blood pressure; DBP, diastolic blood pressure, HDL-C, high-density lipoprotein cholesterol; LDL-C, low-density lipoprotein cholesterol; HbA1c, glycohemoglobin; WC, waist circumference; WHtR, waist-to-height ratio; VAI, visceral adiposity index; BRI, body roundness index; CUN-BAE, Clinical University of Navarra body adiposity estimator. Normal value if vitamin D ≥ 20 ng/mL, and a deficiency if vitamin D < 20 ng/mL. The continuous variables are presented as average ± standard deviation; the categorical variables are presented as numbers and percentages. Column p1 shows differences between males and females, and column p2 shows differences between participants in the sample with and without vitamin D deficiency.
Table 2. Anthropometric parameters associated with low values of vitamin D levels determined using logistic regression analysis.
Overall Females Males
VariableORIC 95%pORIC 95%pORIC 95%p
WC
Model 11.0211.005–1.0370.0111.0160.993–1.0380.1771.0381.009–1.0670.009
Model 21.0211.005–1.0380.0101.0170.994–1.0410.1491.0391.009–1.0700.010
Model 31.0221.005–1.0390.0111.0140.990–1.0400.2521.0401.010–1.0710.010
BMI
Model 11.0681.022–1.1160.0031.0611.005–1.1210.0341.0801.003–1.1630.042
Model 21.0691.022–1.1180.0041.0651.007–1.1270.0271.0781.001–1.1620.048
Model 31.0681.021–1.1180.0041.0590.999–1.1230.0561.0781.000–1.1630.050
WHtR*1000
Model 11.0041.002–1.0070.0011.0031.000–1.0060.0891.0071.002–1.0110.003
Model 21.0051.002–1.0080.0011.0031.000–1.0070.0551.0081.003–1.0130.002
Model 31.0051.002–1.0080.0011.0030.999–1.0070.1181.0081.003–1.0140.001
VAI
Model 11.1191.038–1.2070.0031.0730.973–1.1830.1571.1881.054–1.3390.005
Model 21.1201.038–1.2080.0031.0800.976–1.1940.1351.1891.055–1.3400.005
Model 31.1221.039–1.2120.0031.0640.959–1.1810.2421.2031.064–1.3600.003
BRI
Model 11.2091.073–1.3610.0021.1260.969–1.3080.1221.3621.118–1.6600.002
Model 21.2501.095–1.4260.0011.1570.982–1.3630.0801.4471.152–1.8180.002
Model 31.2491.092–1.4300.0011.1260.945–1.3400.1841.4671.163–1.8510.001
CUN-BAE
Model 11.0220.998–1.0460.0681.0441.001–1.0890.0441.0520.998–1.1080.061
Model 21.0240.999–1.0500.0651.0601.011–1.1130.0161.0570.996–1.1220.067
Model 31.0250.999–1.0520.0621.0561.005–1.1100.0300.0700.995–1.1220.070
%CI, 95% confidence interval; WC, waist circumference; BMI, body mass index; WHtR, waist-to-height ratio; VAI, visceral adiposity index; BRI, body roundness index, CUN-BAE, Clinical University of Navarra body adiposity estimator; OR, odds ratio. Dependent variable in the logistic regression analysis was vitamin D (0 = ≥20 ng/mL; 1 = levels less than 20 ng/mL). Independent variables were WC, BMI, WHtR, and VAI, and adjustment variables were age, cardiovascular risk score, hypotensive, hypoglycemic, and hypolipidemic drugs. For risk factors: 1 = presence and 0 = absence. Model 1: unadjusted; Model 2: adjusted by age; Model 3: adjusted by age, cardiovascular risk score, hypotensive, hypoglycemic, and hypolipidemic drugs (1 = yes, 0 = no).
Table 3. Comparison of area under receiver-operating characteristic curve among the different models for prediction.
VariableAccuracyErrorPrecisionSpecificitySensitivityAUC-ROC
(95% CI)
Algorithms
Logistic Regression
WC0.6350.3650.9240.5000.6500.528 (0.494–0.563)
BMI0.6410.3590.9190.5260.6550.538 (0.502–0.574)
WHtR0.6380.3620.9100.5120.6540.538 (0.499–0.575)
BRI0.6350.3650.9100.5000.6530.533 (0.497–0.570)
VAI0.6330.3670.9060.4880.6520.531 (0.494–0.568)
CUN-BAE0.6410.3590.9240.5280.6540.536 (0.501–0.572)
Naïve Bayes
WC0.6070.3930.8560.1180.6690.546 (0.487–0.604)
BMI0.6530.3470.8850.3330.6970.555 (0.495–0.616)
WHtR0.6200.3800.8750.1330.6740.556 (0.499–0.613)
BRI0.6200.3800.8750.1330.6740.556 (0.499–0.613)
VAI0.6870.3130.9420.4550.7050.503 (0.458–0.547)
CUN-BAE0.6400.3600.9230.0000.6760.503 (0.465–0.542)
Random Forest
WC0.5800.4200.7860.1850.6670.449 (0.388–0.509)
BMI0.6070.3930.8170.2400.6800.474 (0.412–0.536)
WHtR0.6400.3600.8850.2500.6870.486 (0.434–0.537)
BRI0.6530.3470.8940.3130.6940.501 (0.447–0.556)
VAI0.6330.3670.8460.3040.6930.499 (0.436–0.562)
CUN-BAE0.6130.3870.8270.2500.6830.479 (0.417–0.540)
CI, confidence interval; AUC-ROC, area under the receiver-operating characteristic curve; BMI, body mass index; WC, waist circumference; WHtR, waist-to-height ratio; VAI, visceral adiposity index; BRI, body roundness index, CUN-BAE, Clinical University of Navarra body adiposity estimator.
Publisher’s Note: MDPI stays neutral with regard to jurisdictional claims in published maps and institutional affiliations.

