Abstract
The European Commission (EC) has monitored Member States' digital progress through the Digital Economy and Society Index (DESI) since 2014. The DESI index currently ranks the EU Member States and monitors their progress based on four core and 33 individual indicators. We sought to determine whether convergence between the Member States could be detected using the DESI’s annual databases. By examining the variation in the indices, we propose the existence of a so-called “Matthew effect”, i.e., the “rich get richer” syndrome among the 27 EU Member States. We also hypothesised that the COVID-19 pandemic would influence the change in the DESI. Issues investigated were those using bibliometric, statistical-mathematical methods. The σ-convergence analysis was used to estimate the reduction over time of the differences between the Member States, while the β-convergence analysis was used to estimate the rate of catching up with the initial level of development. A PCA analysis was performed to verify the Mathew effect with additional λ-variances considering real GDP per capita change. The σ-convergence was confirmed over the period 2016–2021. The β-convergence was significantly confirmed, and the research also revealed that the half-life of catching up is approximately 20 years. The suggestion of a Matthew effect in the 2016–2021 period, although not significantly confirmed, tends to suggest its existence. The COVID-19 pandemic’s impact on the value of the DESI index is likely to be affected, but future studies are needed to find support for this hypothesis. The study concludes that convergence between the EU-27 Member States can be detected based on the DESI, but this does not imply convergence for all four core DESI indicators.
1. Introduction
The competitiveness of the European economy depends on a knowledge-based economy and support for research and development (R&D). While the former is closely linked to human capital development and qualitative improvement, R&D activities presuppose the integration and development of information and communication technologies (ICT) [1]. At the EU level, the Lisbon Strategy in 2000 was the first to address their conscious development, followed in 2010 by the EU 2020 Strategy, which reaffirmed these efforts [2]. One of EU 2020 Strategy’s flagship initiatives is the Digital Agenda for Europe. To achieve the objectives quickly and on schedule, the proposed governance framework is based on the enhanced Digital Economy and Society Index (DESI), which has been tracking Member States’ digital progress since 2014 [3,4]. In 2021, the EC modified the structure of the DESI, replacing the previous five-dimensional structure with four main areas. The change become necessary through two policy initiatives that will have the most significant impact on the EU’s digital transformation in the coming years: the Recovery and Resilience Facility (RRF), adopted by the European Parliament in February 2021, and the Digital Decade Compass (March 2021). In September 2021, the European Commission proposed the Path to the Digital Decade, a blueprint for the digital transformation of the European economy and society [5].
The DESI index currently aggregates the scores of 33 individual indicators and ranks the EU Member States according to a weighting system measuring digital performance and monitoring their progress. The DESI overall index includes four main indicators (Table 1), developed based on OECD guidelines and recommendations [6]. Assessments published in a given year are based on the previous year’s data. The DESI index assessments published between 2016 and 2021 reflect 2015–2020. The EC collects the data included in the index from the Member States’ competent authorities and various studies carried out by the Commission.

Table 1.
Digital Economy and Society Index (DESI) main indicators, sub-dimensions and individual indicators.
For each country, the DESI overall index is defined as a simple weighted arithmetic average of the individual DESI main indicators:
DESI = desi_1 * 0.25 + desi_2 * 0.25 + desi_3 * 0.25 + desi_4 * 0.25
The aim of our research is by using statistical-mathematical methods to look for evidence of the digital development of Member States, both aggregated and relative to themselves. The convergence of the economic, social, and in this case, digital development of the Member States that joined the EU during Eastern Europe enlargements (2004, 2007, and 2013) with that of the previous members is essential since the results of EU accession should be reflected in this convergence. Our null hypothesis on convergence is formulated as follows:
Hypothesis 1 (H1).
Based on the change in the DESI index, we assumed that there is no convergence between the Member States.
We used correlation analysis and principal component analysis (PCA) to analyse the DESI index further. The advantage of PCA is that it reduces the data to a more transparent and more accessible manner in which to interpret, thanks to the aggregated information [7,8]. An additional benefit of the analysis is that the contribution of variables to the overall DESI index is determined along with principal component(s) (PC) rather than along DESI indicators (weights given by EC). Accordingly, our second null hypothesis is formulated as follows:
Hypothesis 2 (H2).
Assume that the contributions of the components (variables) of the first dimension obtained by PCA analysis are equal to the weights given by EC.
Robert K. Merton [7,9] refers to the following part of the Gospel of Matthew as the “Matthew effect”, and Derek J. de Solla Price [8] refers to the Matthew effect as the “cumulative advantage”: “For everyone who has will be given more, and he will have an abundance. But the one who does not have, even what he has will be taken away from him” [10]. While explaining the discrepancies in recognition of scientific work, both Merton and de Solla Prince made the statement colloquially known as “rich get richer”. The term is now used to describe the self-reinforcing general pattern of inequalities associated with economic wealth, political power, prestige, knowledge, or another scarce or valuable resource [11,12]. This study analyses whether the Matthew effect can be justified alongside convention across the 27 EU Member States through the variation in DESI indices. Accordingly, our third null hypothesis is formulated as follows:
Hypothesis 3 (H3).
The mean and variance of the latent variables of the DESI indices over the period 2016–2021 do not confirm the existence of a Matthew effect.
The structure of our study is as follows: in Section 2, we reviewed the literature that discusses the analysis of the DESI index values. Then, Section 3 presents the statistical analysis methods used to analyse the DESI index principal indicator data for 2016–2021: σ- and β-convergence and principal component analysis (PCA). Section 4 contains the statistical analyses themselves, and in each case, we have attempted to justify and explain the results obtained satisfactorily. In Section 5, the results are interpreted, compared with results from previous studies, our hypotheses are tested, and further research directions are highlighted. Section 6 outlines the limitations of our research, and finally, the conclusions highlight the main scientific results.
2. Literature Review
To explore the literature analysing or discussing the DESI index, which areas of the index are studied by each author, and which countries, it was considered most appropriate to carry out a bibliometric analysis. To this end, we used the freely available bibliometric software VOSviewer 1.6.17 (Centre for Science and Technology Studies (CWTS), Leiden University, The Netherlands, developed by: Nees Jan van Eck and Ludo Waltman) [13] to examine the keywords of articles that address the DESI index theme, identify the relationships between them, and analyse bibliographic linkages between countries. This was done using the Web of Science Core Collection-Clarivate Analytics database. We searched for academic journal articles and conference proceedings containing the word combination “Digital economy and society” or “DESI”, examining their occurrence in the title, abstract, keywords provided by the authors, and Keyword Plus, for 2015–2021. The database analysed yielded 89 direct hits and 43 related records related to our search terms and can aid us in understanding the field more comprehensively.
The software used identified 592 keywords in the studies analysed, which were reduced to 568 keywords using a thesaurus. Out of the 568 keywords, 20 keywords met the threshold with a minimum occurrence rate of 5 times the set threshold. The VOSviewer software uses colours to distinguish between the clusters identified during the analysis. The relationship network between the relevant keywords is depicted in (Figure 1) and should be interpreted as follows: the size of the points represents the frequency of occurrence; the line thickness connecting the points represents the frequency of co-occurrence of each keyword, and the distance between each point represents the strength of the relationship between the keywords.
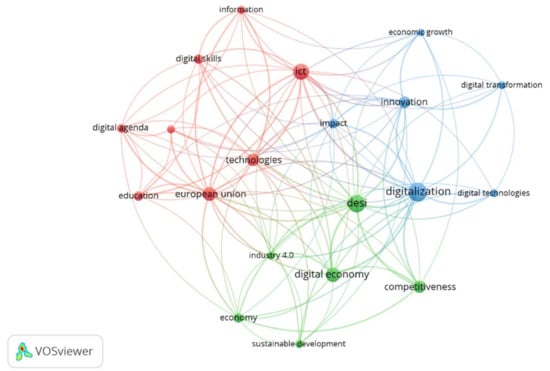
Figure 1.
Keywords that meet threshold 5 in selected articles.
In the database we created, the minimum occurrence for the relationships between keywords had to be five. Three clusters were identified, maintaining the software’s default resolution setting for generating clusters (resolution = 1). The clusters are separated by colour (Figure 1) and are included in (Table 2).
Table 2.
Keyword clusters.
In the first cluster, marked in red, the main keyword is “ICT”, and those most often referred to as “European Union”, “technologies”, “education”, and “digital skills” which suggests that the spread of ICT in the European Union requires the acquisition and teaching of digital skills. Many argue that ICT tools are essential for the development and growth of the EU economy [14,15,16,17,18,19]. The digital skills gap in the 54+ age group is a serious problem, as, without these skills, they are excluded from employment in areas where digital technology is a significant factor [20]. Also linked to the digital skills gap is the virtual exclusion of women from the digital market economy, as most ICT professionals are male, further widening the digital skills and competencies divide [21,22,23]. Tkáč [24] studied the contribution of eGovernment measures to implementing the Digital Single Market Strategy (DSM) adopted by the European Council in 2015. His analysis showed that the measures implemented have led to a significant increase in public trust in public administrations. Making data visible, particularly to public administrations, would significantly streamline the processing of documents, saving time and money [25,26]. Luhan et al. [27] developed a dynamic model for developing e-government systems.
The green-labelled cluster 2 relates the DESI index domain (a keyword) to the digital economy and its perceived fundamental characteristic, competitiveness [28]. Also in this cluster are the concepts of sustainable development and Industry 4.0 (Table 2). Zdjelar et al. [20], Pelikánová [29], and Esses et al. [30] also argue that the EU economy must comply not only with competitiveness but also sustainability criteria, as the idea of infinite and unlimited growth is a utopia [31]. The digital economy must be considered in designing national strategies to achieve economic and social progress [32,33,34,35]. Čiefová [36], in her analysis of Austria’s competitiveness, concludes that it is a function of long-term conditions so that the shift is prolonged. Moldabekova et al. [37], due to the impact of Industry 4.0 on logistics performance, consider that it is essential to develop human capital, integrate digital technologies, and have dense and solid digital coverage.
In cluster 3, marked in blue, the most frequently occurring keywords are digitalisation, and these have a substantial impact on innovation, which are also keywords in this cluster. Khalid-Naumova [38] explored the opportunities for digital transformation through the prism of supply chain management, driven by the ever-changing business environment and customer demands. Baryakin et al. [39] explored the possibilities of developing commercial networks to maximise the potential of digital technology using stochastic modelling, dynamic programming and mathematical methods of optimisation. Jovanovic et al. [16] and Luchko [40] consider that the cultural habits of each state are also determinants in the process of digitalisation. Using Hofstede’s cultural dimensions [41], they conclude that countries with a high level of individualism and hierarchy, and a higher propensity to take risks and live life experiences, have a higher level of digitisation of the economy [42]. In contrast, digitalisation is lower in traditional and future-oriented societies. Therefore, it is necessary to take cultural specificities into account and the development of specific dimensions of the digital economy and society index. Rakićević et al. [43] consider it advisable to design intelligent policies for each DESI dimension, considering country-specificities and targeting gaps, as countries’ development varies from area to area [44,45,46,47]. Bogoslova-Lungu [48] and Esses et al. [30] found that the level of digitisation of the economy and society depends on the overall human development level (HDI level) of a country. Moreno-Llamas et al. [49] took a somewhat unusual perspective on the development of digital technology and found a positive correlation between digitally developed countries and sedentary lifestyles.
Monitoring the evolution and development of the DESI index is more important for member states with a significant gap. Therefore, the number of relevant studies is higher in these countries, and many of them are not members of the European Union community. Thus, after having processed the database mentioned above, this time analysing the bibliographic appendices, we can see the countries that have enriched the relevant literature of the DESI index with at least five studies (scientific journal articles or conference proceedings) (Figure 2). Out of 40 countries, 12 have reached the threshold. Most studies come from Romania (25), followed by Ukraine (12), Slovakia, and Croatia (10-10).

Figure 2.
Network of bibliographic coupling.
Several studies conduct country-by-country evaluations, comparing different countries or regions based on the main factors of the DESI index. Karnitis et al. [50] compares the Baltic countries with the EU and makes a critical statement on the factors of the DESI index, considering that data mining and mathematical modelling are the main drivers of digitisation. Ershova et al. [51] assessed the development of the digital economies of Russia, Ukraine, and developed countries and concluded that digital, technology-driven economies would be the engines of growth. Countries that digitise their production and economic activities can gain substantial economic benefits, also, through the example of Russia. Lomakina et al. [52] argue that economic resources in the digital society will be transformed: the role of natural resources will be reduced, the development of renewable resources will be emphasised, and human resources, knowledge, and entrepreneurship will be valued. The finding of Szőllősi et al. [53] at the company level indicate that a significant improvement can be achieved in profitability, competitiveness, and reducing negative environmental impacts through the complex application of state-of-the-art technologies, automation, robotics, and digitisation, as well as the necessary expertise acceptable at the national economy level. Jurčević et al. [54] compared the digital development of the Croatian economy with the other EU Member States, concluding that the Croatian economy has not yet reached the expected level of competitiveness, which may be because the Republic of Croatia is lagging behind EU countries in terms of broadband internet coverage [55]. According to Grinberga-Zalite–Hernik [56] Poland appears to be better prepared than Latvia in terms of human capital to face the future challenges of the digital economy, a claim supported by its R&D expenditure as a percentage of GDP [35]. Latvia’s digital economic and social performance lags behind the other Baltic States [57].
3. Materials and Methods
3.1. σ- and β-Convergence
Convergence calculations are currently being performed on several areas, such as income disparities, poverty, social capital development, environmental economics, and others. According to Quah [58] (p. 1054), this provides that “convergence is simply a basic empirical issue, one that reflects on—among other things—polarisation, income distribution, and inequality. Certainly, understanding economic growth is important. However, growth is only one of many different areas in economics where analysing convergence sheds useful insight”. In this paper, we address two types of convergence. The first is σ-convergence or relative standard deviation, the average relative deviation of the DESI index values from the mean, expressed as a percentage. If the dispersion of the development levels decreases over time, we speak of σ-convergence. Another well-known convergence indicator is the β-convergence introduced in the empirical growth literature by Barro–Sala-i-Martin [59,60]. This growth indicator is based on the neoclassical growth theories of Ramsey [61], Solow [62] and Koopmans [63]. The Solow-based and, from the 1980s onwards, endogenous growth theories argued that national economic policies and country-specific characteristics are crucial determinants of a country’s catching-up performance. Foreign capital inflows accelerate growth, leading over time to narrowing the gap between developed and less-developed catching-up countries.
The σ-convergence refers to the reduction of differences between regions over time, particularly between the Member States, while β-convergence focuses on identifying a possible catching-up process.
The σ-convergence (relative standard deviation or coefficient of variation) is a coefficient of variation that allows the comparison of multitudes or samples with different averages and characteristics. In our case, we work with a model of DESI index values, period 2016–2021. The coefficient of variation is the average relative deviation of the importance of the criteria from the mean, expressed as a percentage. If the dispersion of development levels decreases over time, we speak of σ-convergence.
The calculation of relative dispersion is given in Formula (1):
where:
- σt = the standard deviation of the DESI indices at time t;
- = the mean of the DESI index.
Based on the hypothesis of absolute β-convergence, Equation (2) expresses the empirical relationship between growth per Member State and the initial level of development:
where:
- ln = the average annual growth rate of the DESI index values for the i Member State;
- T = representing the interval in years between observations;
- = initial level of development of the DESI index;
- = the error term assumed to be identically and independently distributed;
- α and β = the parameters to be estimated.
In this expression, the initial level of development alone explains the rate of catching up. The strength of the effect is indicated by the sign and value of the β-coefficient. Univariate linear regression (OLS) was performed to estimate the α and β coefficients. However, the estimation would be fully explained and error-free only in the case of a perfect relationship (r = 1 or r = −1) and, therefore, εi is the error of the estimate. We use the least-squares procedure to minimise the squared error to estimate the coefficients α and β. We considered the β-coefficient to be significant only if the empirical significance level (p-value) was less than 5%. However, the concept of conditional convergence suggests that there is an excessive amount of unexplained information hidden in α and εi that needs to be extracted on a case-by-case basis. Still, in this case, we only tested absolute convergence.
After estimating the coefficient β, we can calculate the annual rate of convergence (constant progress rate):
where:
- β = the value of the regression coefficient;
- T = representing the interval in years between observations.
The value of the annual rate of convergence is used to determine the half-life of convergence, i.e., the time required to travel half the distance to the complete intersection within the study area if the convergence rate remains constant [64]. The expected time required to reduce inequalities by 50%, assuming absolute convergence, is:
- θ = the annual rate of convergence.
The time needed for long-term convergence needs to consider how long it would take to get halfway to the level of more advanced countries if the current catching-up rates are sustained. This is called half-life convergence.
3.2. Determination of Correlations Coefficients
The formula for the sample correlation coefficient is:
where:
- sxy = the sample covariance;
- sx and sy = the sample standard deviations.
After Karl Pearson, Pearson’s r or Pearson’s correlation.
3.3. Principal Component Analysis (PCA)
The origins of PCA analysis can be traced back to Cauchy, but it was first formulated in statistics by Karl Pearson [65], who described the analysis as “lines and planes of closest fit to systems of points in space”. Subsequently, Hotelling [66] worked on the method, but it only became well known after the advent of computers due to its complexity.
The idea of PCA analysis is to use a large number of correlated variables to form a small number of artificial (latent) uncorrelated variables, called principal components, which have maximum variance. Because main components are uncorrelated variables does not necessarily mean that they are independent of each other. PCA analysis can best be compared to a shadow game, where the shadow image of a complex spatial shape is projected onto a planar surface so that the characteristic properties of the figure are lost as little as possible. First, we defined the correlation matrix and plotted the most characteristic values.
PCA analysis is a multivariate interdependence technique based on eigenvalue calculation, which provides an overview of the correlation of all variables at once. The variables' correlation matrix (R) is used as a starting point. This matrix is spectrally resolved to obtain the eigenvectors and eigenvalues. These are used to determine the principal component variables (scores) and principal component weights (patterns). The observed variables can be grouped according to their correlation and combined into an equal number of principal component variables. The principal component variables (scores) can be calculated from the standardised values (z) of the original variables according to the following relationship:
where:
- Cj = jth standardized principal component variable (score);
- aij = eigenvector matrix elements (loadings);
- Zi = column vectors of standardised scores.
The eigenvector matrix is orthonormal in a row, and column direction, i.e., independent pairwise in row and column direction, and their sum of squares give 1. Standardised variables are unmeasured data formed by dividing the variance of the variables from their mean by the standard deviation. The expected value of principal component variables is zero; their variance is equal to λ. The principal component variables are independent of each other.
Subsequently, as many of the principal components as are sufficient to describe the original variables are used. The first principal component (PC1) contains the most considerable fraction of the variances, represented by the eigenvalue (λ1). The first principal component is thus constructed in our model:
Only principal components that have an eigenvalue greater than or equal to one or that explain at least 80% of the total variance are considered. Principal components are used to identify background variables.
Principal component weights (patterns) express the closeness of the relationship between a given principal component variable (i.e., C1) and the variables under investigation. They range from −1 to +1 and should be interpreted similarly as Pearson correlation coefficients. The closer their absolute value is to 1, the closer the correlation. Their practical definition is given by the formula below:
where:
- pcij = jth principal component weights (patterns);
- aij = eigenvector matrix elements (loadings);
- λj = eigenvalues.
The square sum of the principal component weights per row gives 1. The columns are orthogonal, and the sum of squares per column equals the associated eigenvalue.
The location of the EU Member States in the coordinate system of the two principal components is then plotted in two dimensions. The groupings were made according to entry into the EU and real GDP per capita.
We used the R statistics software package version 4.0.2 (R Core Team, Foundation for Statistical Computing, Vienna, Austria) for our analyses [67].
4. Results
4.1. σ-Convergence of Digital Economy and Society Index (DESI) Overall Index
Using σ-convergence, we sought to determine whether the relative dispersion of the DESI total index data over the period 2016–2021 can be used to show the coherence of the EU-27 Member States. The data needed to perform the σ-convergence calculations are available in the DESI database [68]. The σ-convergence was analysed in three units: first for the EU-27 as a whole, then for the EU-14 countries, and finally for the group of countries that joined the EU during the Eastern European enlargements (2004, 2007, and 2013). For the period 2016–2021, a convergence of Member States is observed in all three units of analysis, but the rate of convergence is different (Figure 3). The convergence rate is higher over 2016–2019, between 1% and 2% per year per group. After that, it falls below 1%, e.g., the EU-14 group, there is little evidence of digital convergence between the Member States.
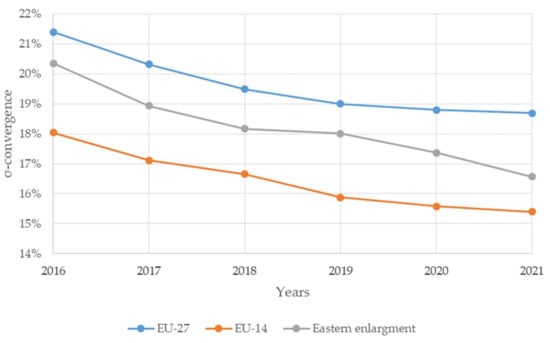
Figure 3.
σ-convergence of DESI overall index.
The average rate of progress varies across EU countries, ranging from 5.16% to 9.65%. Greece has developed fastest, while Latvia is on the opposite side. Among the countries that joined the EU in 2004 and after, Poland shows the highest average rate of progress (9.34%), while Luxembourg (5.98%) is the EU-14 leader in terms of progress. However, we should not jump to conclusions, as the level of development in the Member States also varied at t0 time (2016).
4.2. β-Convergence of DESI Overall Index
Between 2016–2021, the EU Member States were characterised by beta-convergence, a negative correlation between initial development levels and the average volume growth rate of the DESI overall index (Table 3) and (Figure 4). The correlation is quite strong (R2 = 0.5), and the regression equation in the figure shows that the annual average rate of development gap shrinkage for the EU was 3.45%, based on a coefficient of the initial development of around −0.0317. The regression coefficient can be considered significant as the p-value (3.69 * 10−5) is less than α (0.05).
Table 3.
Ordinary least squares (OLS) regression of DESI overall index.

Figure 4.
β-Convergence of DESI overall index (2016–2021).
On this basis, the half-life of catching-up can be determined, i.e., how many years it would take to cover half of the road towards full catching-up within the region if the convergence rate remained unchanged. A constant catching-up rate of 3.45% implies a half-life of approximately 20 years. The data needed to perform the β-convergence calculations are available in the DESI database [68].
The basic assumption of β-convergence is that the growth rate of the indicator will be higher in countries with a lower initial value (e.g., Greece, Poland, Romania, Italy, Croatia) and lower in countries with a higher initial value (e.g., Denmark, Estonia, Finland, Sweden). In the present case, this has resulted in less developed countries catching up with the better performers in terms of the overall DESI indicator. Looking at the countries that joined during the enlargements in Eastern Europe, most of these countries are below the regression line over the period under review. Only Cyprus, Croatia, Malta, and Poland are above the regression line, suggesting that only these four Member States have managed to catch up with the catching-up potential that resulted from their initial lag. Of particular note is Ireland’s DESI overall index growth rate progress (distance from the regression line, i.e., the residual term in the equation for Ireland) of 1.3 percentage points. Bulgaria and Latvia, however, have underperformed relative to their catching-up potential over the period under review. The lag in the volume growth rate of the overall DESI index, interpreted in this way, is close to 1.1% for Bulgaria and more than 1.8% for Latvia.
The year 2020 was challenging in many ways. COVID-19 led to a series of restrictive measures, mainly requiring a reduction in face-to-face encounters. These restrictive measures created increased urgency to integrate and accelerate digitalisation processes at the social and economic levels. Comparing the DESI overall index in 2019 and 2020, the most considerable improvements in percentage points were achieved in Denmark (+8.28), Austria (+6.65), the Netherlands (+6.26), and Ireland (+6.2). Latvia, Lithuania, Bulgaria, and Poland show an absolute increase of less than 2.5 percentage points on the opposite side. Examining the average growth rate of the overall DESI index from 2016 to 2021, we found that the growth rate was 6.98%. In 2019 and 2020, during the first two waves of the COVID-19 pandemic, the growth rate was close to 9%. Without fetishizing the impact of the pandemic alone, it is striking that the DESI overall index increased by 25% points in one year compared to the average of previous years. The change is significant, but further studies are needed to validate the impact of COVID-19 statistically.
4.3. Correlation Matrix
A correlation test was used to see how the four main indicators of the DESI index are related. The correlation test was first performed in t0–2016 (Figure 5) and repeated with data published in 2021 (Figure 6). The portion of the correlation matrix above the main graph reveals the values of the correlation coefficients and indicates the significance levels (* p < 0.05; ** p < 0.01; *** p < 0.001). The diagonal line indicates the distribution of a given variable. In contrast, the section below the diagonal shows the nature of the relationship between pairs of variables, which is assumed to be linear since the correlation coefficient is only valid at this point.
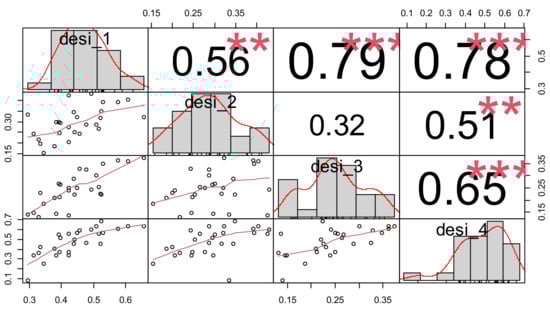
Figure 5.
Pearson correlation coefficients, distribution and correlations of variables, 2016. (*** significance level p < 0.001, ** significance level p < 0.01).
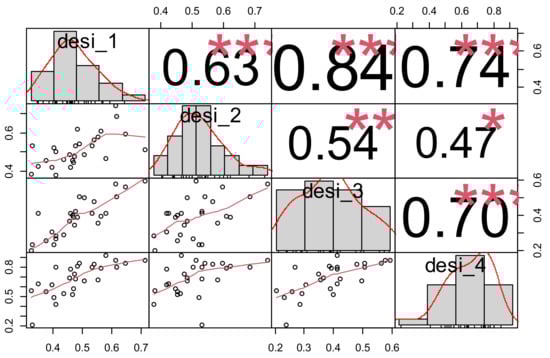
Figure 6.
Pearson correlation coefficients, distribution and correlations of variables, 2021. (*** significance level p < 0.001, ** significance level p < 0.01, * significance level p < 0.05).
The correlation coefficients are most significant, with a positive direction between pairs of variables with medium and more robust relationships, so the four main indicators of the DESI index are closely correlated. There is no correlation between Connectivity (desi_2) and Integration of digital technology (desi_3) in t0. The integration of digital technology at the enterprise level depends on the management approach rather than the degree of network connectivity. In the EU, the SME sector has significant activity: more than 22.8 million registered enterprises, representing 99% of all enterprises in the EU, employing 84 million Europeans and contributing 50% of EU GDP [69]. However, the SME sector is not exploiting the potential of digital technologies, both because of its mindset and because of its limited access to finance.
Looking at the correlations between pairs of variables individually, in 2021, the correlation coefficients between desi_1 and desi_4 and between desi_2 and desi_4 decreased slightly. The significance level also decreased for the latter, which suggests that digital infrastructure is evolving more than other digital public services. The strength of the correlation relationship has increased considerably for pairs of variables related to the integration of digital technology (desi_3), such as human capital (desi_1) (0.79 *** -> 0.84 ***) and digital public services (desi_4) (0.65 *** -> 0.70 ***). There was also an increase in the correlation coefficient between desi_1 and desi_2 (0.56 ** -> 0.63 ***) and a decrease in the significance level.
4.4. Principal Component Analysis (PCA)
To be eligible to perform principal component analysis, variables must be correlated as a group, and Pearson correlation coefficients must be significantly higher than partial correlation measures. To verify this, we conducted Kaiser–Meyer–Olkin (KMO) tests in 2016 and 2021 (Table 4). The test relates the sum of squares of Pearson correlation coefficients to the sum of squares of partial correlation coefficients. The resulting indicator is the MSA (a measure of sampling adequacy), where the critical value of the test is 0.5. The tests performed confirmed that the data are suitable for PCA analysis, as both the global and the individual values are above 0.5.
Table 4.
Kaiser–Meyer–Olkin test on DESI main indicators in 2016 and 2021.
The principal component analysis is about finding the variables or components that carry the relevant information. In our case, the relevant, valuable information is the variance between the data and the mean deviations, allowing us to reduce our available data in a manner that captures as large a percentage of the total variance as possible. Our data are analysed with principal components (PC) rather than DESI main indicators. These principal components are directions in the current four-dimensional space that specify the direction in the data that has the most significant variance. The first principal component (PC1) represents the direction in which the variance of the data under investigation is largest. The second principal component (PC2) is the direction perpendicular to the first principal component (PC1), in which the variance of the data is the second largest. The results of our analysis for 2016 and 2021 are presented in (Table 5 and Table 6).
Table 5.
Eigenvalue and variance proportions.
Table 6.
Coordinates of variables.
By 2021, the context has become even more one-dimensional. The explanatory power of the first principal component increased from 70.9% to 74.4%. On the other hand, the second principal component has decreased, which is natural, as the sum of the four components is 100%. The two principal components explain the same proportion of the correlation (88.5%). There is only a slight shift between the two dimensions
4.4.1. PCA Analysis of DESI Main Indicators in 2016
The main components are assigned a main indicator weighting value, which provides information on which main indicators within the main component have a higher weight and which have a lower weight. For PC1 (Dim1), the weight of the main indicator variables is high (Table 6), and they are all positive, i.e., they change in parallel in the same direction. The main indicator desi_1 (0.9419) has the highest weight, so countries with a high value of desi_1 tend to perform better in integrating digital technology at the economic and social level and, therefore, the DESI main indicator index is higher than countries with a low value of this main indicator. In the case of PC2 (Dim2), the desi_2 (0.7132) and desi_3 (−0.4301) main indicators are more highly weighted, and there is a negative relationship between the two indicators. In countries where the value of desi_2 (network connectivity) is high, desi_3 (Integration of digital technology at the enterprise level) is typically low, which can be attributed to the fact that integration of digital technology at the company level depends more on the approach of the management and less on the degree of network interconnectedness. In 2016, the principal component for the first dimension described 70.9% of the relationships and in the second dimension, 17.6%. The contribution of the variables to the component is slightly modified but still close enough to the one-quarter weighting used by the European Commission:
PC1 (Dim1) = desi_1 * 31.28 + desi_2 * 16.3 + desi_3 * 24.66 + desi_4 * 27.76
Along with the resulting principal components, we grouped the EU Member States according to their entry into the EU (Figure 7) and their real GDP per capita (Figure 8). We sought to answer how the different grouping criteria affect digital technology at the economic and social levels. Which countries perform better on the given criteria, is there a divergence between them, or is there a shift in the 6-year horizon (2016–2021)?

Figure 7.
The position of countries on the plane of principal components, grouped by the year of joining the EU (2016).

Figure 8.
The position of countries on the plane of principal components (grouped by the real GDP in euro per capita), 2016.
The use of digital technology at the economic and social level is illustrated in (Figure 7), and the principle of settlement is the time of accession to the EU. Based on this, three groups have been created:
- The group of those who joined between 1957 and 1980 is the founding six Member States, plus the first round of accessions from 1973: Belgium, Germany, France, Italy, Luxembourg, the Netherlands, Denmark, and Ireland;
- In addition, the countries that joined after the Cold War: Greece, Spain, Portugal, Austria, Finland, and Sweden;
- The group of Member States that joined in the context of the Eastern European enlargements between 2001 and 2013: Cyprus, the Czech Republic, Estonia, Hungary, Lithuania, Latvia, Malta, Poland, Slovenia, Slovakia, Bulgaria, Romania and Croatia.
The majority of Member States in the first group (marked in red) perform very well in digital technology on the right side of the first principal component (X-axis). Belgium and Ireland are slightly behind in network connectivity but perform very well in digital technology adoption at the enterprise level (Y-axis). This is not the case for Italy and France, which are on the left side of the X-axis, i.e., among the less developed, and perform very poorly in both desi_2 and desi_3 indicators.
The digital performance of the second group, in green, is above average. The exception this time is Greece, which is lagging on both desi_1 and desi_4 indicators.
The third group, marked and framed in blue and comprising primarily Eastern European countries, typically performs poorly in digital technology, although the infrastructure is there. The digital network infrastructure is outstanding in Latvia and above average in Romania, Poland, and Bulgaria. However, as far as the desi_4 indicator is concerned, it scores low except for Malta and Estonia. Estonia has good network connectivity and excellent uptake of digital technologies at an enterprise level.
The use of digital technology at the economic and societal levels is illustrated in (Figure 8), with the sorting principle being the real GDP per capita achieved [70]. Based on this, three groups were created:
- The group of Member States with a real GDP per capita between €5000 and €15,000 (marked in red): Bulgaria, Estonia, Croatia, Latvia, Lithuania, Hungary, Poland, Romania, and Slovakia;
- The group of Member States with a real GDP per capita between €15,001–32,000 (marked in green): Cyprus, the Czech Republic, Greece, France, Italy, Malta, Portugal, Slovenia and Spain;
- Member States with a real GDP per capita between €32,001–85,000 (marked in blue): Austria, Belgium, Denmark, Finland, Germany, Ireland, Luxembourg, the Netherlands, Sweden, and Finland.
The group with the lowest real GDP per capita (marked and framed in red) is located on the left side of the X-axis, meaning that they are lagging in terms of the main indicator desi_1, with low values. Whether they are below or just above the X-axis is determined by their importance for the desi_2 and desi_3 indicators. The upper left quadrant indicates high network connectivity but low digital technology integration, while the lower-left quadrant indicates poor performance for the two indicators mentioned above. The exception is Estonia, which is ranked in the top right quadrant, with above-average network connectivity and above-average digital technology integration.
Member States in the middle, i.e., those marked green, have mostly average digital performance. Sweden performs exceptionally well in desi_2 and desi_3 and slightly above average in desi_1 and desi_4. Greece and Cyprus are slightly behind, below the X-axis, in the bottom left quadrant, indicating poor network connectivity and poor adoption of digital technology at the enterprise level.
The group of Member States with the highest real GDP per capita are located on the right side of the X-axis, although there are differences in the main indicators of the DESI index. The position of Luxembourg and Germany in the upper right quadrant suggests that they are simply the best performers in all indicators of the DESI index, coupled with an outstandingly high real GDP per capita. Denmark, the Netherlands, Finland, and Sweden have high scores for digital human capital and internet services digital readiness, while Austria, Belgium, and Ireland are very good at using digital technology.
The results obtained suggest that countries are more widely spaced around the mean than in the normal distribution, whether the clustering criterion is the date of accession to the EU (Figure 7) or the real GDP per capita (Figure 8). Considering the properties of normal distributions, 95% of our data should fall within the ±1, 96 standard deviation interval around the mean. Our artificially constructed indicators describe an abnormal situation which, when translated from the language of statistics, can be interpreted as follows: in terms of the DESI index, the poorly performing Member States (Romania, Greece, Bulgaria, and Poland) and the highly developed countries (Finland, Denmark, Sweden, and the Netherlands) are much further apart than would generally be expected. Those countries lagging are at a disadvantage compared to developed countries; it seems almost impossible for them to catch up. In Section 4.2 (β-convergence of DESI overall index), we have calculated the half-life of convergence, i.e., the number of years it would take to cover half of the distance towards full convergence within the region if the rate of convergence were to remain unchanged. The result is a half-life of 20 years. At this point, we suspect that although convergence exists for the DESI overall index, the Matthew effect is also present. For countries that joined later or are poorer in terms of real GDP per capita, the gaps between countries that joined earlier and those that are richer are not narrowing, but on the contrary, are widening. For this reason, we compared the DESI figures for 2016 and 2021.
4.4.2. PCA Analysis of DESI Main Indicators in 2021
Similar to the values calculated for 2016, the weight of the main indicator variables for PC1 (Dim1) is high, and they are all positive, so they change in parallel in the same direction. The main indicator desi_1 (0.9371) has the highest weight, so countries with a high value of desi_1 tend to perform better in integrating digital technology at the economic and social levels, and therefore the DESI main indicator index is also higher than countries with a low value of this main indicator. In the case of PC2, the desi_2 (0.6539) and desi_4 (−0.3289) main indicators are more highly weighted, and the two variables are negatively correlated. In countries where the value of desi_2 (network connectivity) is high, desi_4, which characterises digital public services, is lower. In 2021, the principal component for the first dimension described 74.4% of the correlations and the second dimension 14.2%. The contribution of the variables to the respective component is as follows:
2021 PC1 (Dim1) = desi_1 * 29.52 + desi_2 * 18.72 + desi_3 * 27.59 + desi_4 * 24.17
The use of digital technology at the economic and social level is illustrated in (Figure 9), and the principle of settlement is the time of accession to the EU. The emerging groups have been described in detail in the previous sections under Section 4.4.1.
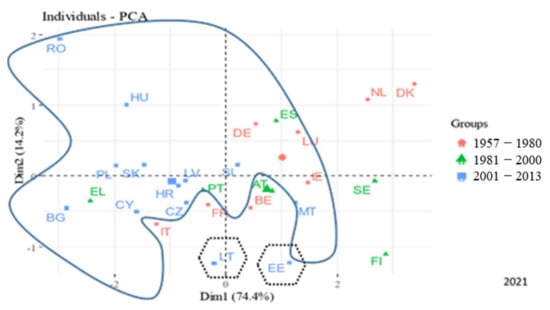
Figure 9.
The position of countries on the plane of principal components, grouped by the year of joining the EU (2021).
The vast majority of the Member States in the first group (marked in red) are performing relatively better in the application of digital technology, being on the right side of the first principal component (X-axis). Denmark and the Netherlands have further increased their digital readiness advantage among the best-performing countries in digital technology. Belgium lags slightly behind the rest of the group in developing digital infrastructure but is very strong in applying digital public services (Y-axis). This statement is not the case for Italy and France, which are on the left side of the X-axis, i.e., among the less developed countries, and perform very poorly in both desi_2 and desi_4 indicators.
The digital performance of the second group, marked in green, is primarily average or above. The two main exceptions are Greece and Finland, where the former lags behind in both desi_1 and desi_4 indicators, and Finland lags behind its peer group in terms of network connectivity. Spain has managed to improve its digital performance, and Greece has started to catch up, albeit still only in the area of digital public services, but with an average rate of improvement of almost 10.5% between 2016 and 2021.
The third group, marked and framed in blue and comprising Eastern European countries, typically performs poorly in digital technology, although the infrastructure is there. The digital network infrastructure is outstanding in Romania and Hungary. However, as far as the desi_4 indicator is concerned, they have low scores except for Malta and Estonia. Estonia has good network connectivity and is at the forefront of digitising public services. Comparing (Figure 7) and (Figure 9), there are no significant changes between 2016 and 2021. The countries that joined later are almost in the same “range”, retaining the role of low performers.
The use of digital technology at the economic and social level is revealed in (Figure 10), with the ordering principle being the real GDP per capita achieved [70]. The difference with the 2016 grouping is that Estonia and Slovakia have moved up, with real GDP per capita above €15,000.

Figure 10.
The position of countries on the plane of principal components (grouped by the real GDP euro per capita), 2021.
The group with the lowest real GDP per capita (marked in red) is on the left side of the X-axis, so they are significantly lagging behind nations with higher GDP in terms of the main DESI indicators.
Member States in the middle, i.e., green, have average digital performance. Spain has seen an increase in the desi_4 indicator compared to 2016, and Cyprus has shown a positive shift towards the average. On the other hand, Greece is lagging, below the X-axis, in the lower left quadrant, which means that it performs poorly on all indicators of the DESI index.
The group of Member States with the highest real GDP per capita is on the right side of the X-axis, although there are differences in the main indicators of the DESI index. Denmark, the Netherlands, Finland, and Sweden perform highly in all respects, outperforming the other European Member States and the best performers in the group with a real GDP per capita of €32,001–85,000.
As of 2016, EU Member States are now more widely spaced than ±1.96 standard deviations around the average. Therefore, in this case we cannot speak of a normal distribution either. The gaps between developed and underdeveloped countries have widened slightly further by 2021, whether the grouping criterion is the date of their accession to the EU (Figure 9) or the level of real GDP per capita (Figure 10). The same countries are at the top of the ranking, and the same countries are at the bottom, and the gap has not narrowed but slightly widened. To quantify this, we calculated the means and variances of the DESI indicators for 2016 and 2021 for the EU-27 countries. For the averages (2016: 0.3658 and 2021: 0.5178), the increase was close to 42%, so the averages have increased significantly. The variance, on the other hand (2016: 0.0064 and 2021: 0.0097), shows a more considerable increase of almost 52%. The 10% higher increase in variance also indicates that the absolute increase in the distances from the mean has been more significant than we could see from the clustering criteria (Figure 9 and Figure 10). However, the F test did not confirm the significance of the variance. The suggestion of a Matthew effect in the period 2016–2021, although not significantly confirmed, tends to indicate its existence. Since our model uses symmetrical assumptions to examine the change in the DESI overall index, the more developed countries moving away will, by definition, mean the less developed countries are lagging by the same amount: the rich get richer because the poor lose out.
5. Discussion
In the literature review, bibliometric analysis reveals that monitoring the evolution and development of the DESI index is more important for those Member States where there is a significant gap. Therefore, the number of relevant studies is higher in these countries, and several of them are not members of the European Union community.
According to the first hypothesis (H1), the change in the DESI indices implies no convergence between the Member States. The σ-convergence was analysed in three units: at the EU-27 level, for EU-14 countries and for the group of states that joined during eastern enlargements. Over the period 2016–2021, a convergence of Member States is observed in all three units of analysis, but the rate of convergence is different (Figure 3), ranging from 5.16% to 9.65% for the EU Member States. Greece has developed fastest, while Latvia is on the opposite side. Among the countries that joined after 2004, Poland shows the highest average rate of progress (9.34%). β-Convergence of DESI overall index for the EU, the annual average rate of narrowing the development gap was 3.45%. The change is significantly confirmed, which allowed the half-life of catching-up to be determined. It was found that a constant catching-up rate of 3.45% requires a half-life of approximately 20 years. To the best of our knowledge, no other authors have addressed this problem, and no forecasts or data have been published.
The sigma and beta convergence studies have shown that there is convergence in the DESI overall index between the EU Member States; therefore, the null H1 hypothesis is rejected.
The second hypothesis (H2) assumes that the contributions of the components (variables) of the first dimension obtained by PCA analysis are equal to the weights given by EC. Our calculations showed that the contribution of the variables to the component is slightly different from the procedure currently used for calculating the DESI overall index but still close enough to the one-quarter weighting used by the EC. A similar correlation was identified when analysing the 2021 data. Both analyses (2016, 2021) confirm that human capital’s first component is weighted higher than the 25% used initially. Based on this, we also reject our second null hypothesis. At the same time, we propose for consideration a modification of the one-quarter weighting in the calculation of the DESI index. We suggest allocating a higher weight for human capital. Previous studies on this issue have also highlighted the importance of skills and education. Bánhidi et al. [3] used cluster analysis and MDS (multidimensional scaling) to group and rank EU member states and compared their results with the DESI index weights. It was found that the two rankings do not differ significantly, but it was suggested that the DESI dimensional structure should be simplified and reconsidered. According to Folea [71], Fleaca [17] and Condruz-Bacescu [72] in the EU Digital Agenda measures to support digital skills education play a crucial role in developing the digital skills of the population, and all Member States have a duty to increase the number of people with basic and higher digital skills [73,74,75]. However, education alone is not enough, as technology must be within reach to ensure that the knowledge acquired can be applied and further developed [76,77]. Pélaez et al. [78] contrasted the digital skills of British youth with the expectations of the labour market and argued that the digital divide between the two could only be bridged through education and digital skills development. Kwilinski et al. [79] found that the higher the level of digitalization in a society, the lower the risk of poverty and social exclusion Vyshnevskyi et al. [80] points out by assessing the development of the EU economy through the dynamics of GDP change, that the digitalization of the economy does not play a decisive role in the rate of economic growth achieved, given the current state of development of the technologies and institutions used. Our analysis shows that the Member States with the highest real GDP per capita have the highest digital readiness of human capital and internet services. Austria, Belgium, and Ireland have companies that are good at using digital technology, while Luxembourg and Germany out perform on all indicators of the DESI index, combined with an outstandingly high real GDP per capita. Increases in the DESI index also imply increases in employment rates and personal incomes, reducing long-term unemployment rates and labour market insecurity [81,82]. According to Neamțu et al. [83] and Bejinaru [84], Industry 4.0, together with ICT, has completely rewritten the global economic system, and further transformations are expected. In digital terms, the Nordic countries of Europe are performing better, while Eastern Europe is lagging [85]. Romania is also lagging behind the European average in several aspects of digitization, such as the adoption of e-government measures [86,87], the digital skills of the population [88], and the use of digital technology at the enterprise level [89,90]. Esses et al. [30] and Kuncová-Doucek [91] assess the performance and progress of the Visegrad countries; Herman [92] underlines the share of ICT employment and its contribution to GDP in the V4 countries, and Romania is below the EU average.
Continuing this line of reasoning, we verify the third null hypothesis (H3) that the mean and variance of the latent variables of the DESI indices over the period 2016–2021 do not support the Matthew effect. Analysing the growth rate and variance of the DESI index, we find that both have increased significantly over this period. Comparing the increase in averages and variances, a 10% higher increase in the latter indicates that the distances from the mean have increased in absolute terms. After six years, the same countries are at the top of the ranking and the same at the bottom, so the gap has not only not been closed but has increased further. However, the F test did not confirm the significance of the difference. The suggestion of a Matthew effect in the period 2016–2021, although not significantly confirmed, tends to suggest its existence, i.e., the third hypothesis is confirmed. However, the conjecture is still worth documenting with deeper investigations. It is proposed to analyse the main indicators of the DESI overall index separately by statistical tests.
Finally, by examining the average growth rate of the overall DESI indicators between 2016 and 2021, we found that it was 6.98%, with a growth rate of almost 9% in just 2 years, 2019 and 2020, i.e., during the first two waves of the COVID-19 pandemic. Without fetishizing the impact of the pandemic, what is striking is that the DESI overall index increased by 25% points in 1 year compared to the average of previous years. The change is significant, but further detailed studies are needed to validate the impact of COVID-19 statistically.
6. Limitation
For the σ- and β-convergence calculations, we used the values of the DESI overall index, which are presented as percentages that may mask the actual values.
For the β-convergence procedure, the β-value is determined by linear regression analysis, and the evolution of the β-value is strongly influenced by the number of elements in the sample. The method cannot be used in the case of a non-linear relationship.
Principal component variables (scores) are calculated from the original variables' standardized values (z). Standardized variables are unmeasured data constructed by dividing the variance of the variables from their mean by the standard deviation. Nevertheless, the results obtained suggest that countries are more widely spaced around the mean than in the case of a normal distribution, which may make the method uncertain.
7. Conclusions
Our study looked for evidence of digital development in the EU Member States based on DESI index scores. We are the first to use σ- and β-convergence methods to study the DESI overall index to the best of our knowledge. We have examined the development of Member States separately but also using σ- and β-convergence to determine the change in the development gap. We found that, over the period under study, the average growth rate of the EU Member States ranged from 5.16% to 9.65%. Statistical calculations revealed that the differences between the EU Member States have decreased (σ-convergence) and that there is a negative correlation between initial levels of development and the average volume growth rate (β-convergence). We reported that the annual average rate of development gap shrinkage was 3.45%, implying that the half-life of catching up is close to 20 years. The figures presented here show that digital technology is increasing in the EU Member States at the economic and societal levels.
We validated the weighting method used by the EU and proposed a modification to the weighting of the DESI overall index. PCA analysis can be used to accurately determine the contribution of each of the main indicators within the principal component. Our calculations have shown that the importance of human resources is higher than currently defined in the DESI overall index methodology, while at the same time, the importance of connectivity as a core indicator is slightly reduced. Our studies have confirmed human resources as the essential factor.
Our analysis led us to suspect that, based on the DESI overall index and regardless of whether the clustering criterion is the date of accession to the EU or the real GDP per capita, the gap between high and low performers is widening. However, this phenomenon, known as the Matthew effect, could not be statistically supported, but the tendency does suggest its existence.
Complementing the descriptive statistics currently used to analyse the DESI index with the methods presented in the paper could help connect macroeconomics to solutions.
Author Contributions
Conceptualisation, T.Z.K.; methodology, T.Z.K. and L.H.; software, L.H.; validation, L.H.; formal analysis, B.B. and A.N.; investigation, T.Z.K.; resources, A.N.; data curation, L.H.; writing—original draft preparation, T.Z.K. and A.N.; writing—review and editing, T.Z.K., B.B., L.H. and A.N.; visualisation, L.H.; supervision, A.N. All authors have read and agreed to the published version of the manuscript.
Funding
This research received no external funding.
Institutional Review Board Statement
Not applicable.
Informed Consent Statement
Not applicable.
Data Availability Statement
The DESI data were provided by the European Commission database [68]. The real GDP per capita data were provided by the Eurostat database [70].
Acknowledgments
The publication is supported by EFOP-3.6.3-VEKOP-16-2017-00007—Young researchers for talent—supporting careers in research activities in higher education programs.
Conflicts of Interest
The authors declare no conflict of interest.
References
- Bassanini, A.; Scarpetta, S.; Visco, I. Knowledge, technology and economic growth: Recent evidence from OECD countries. OECD Econ. Dep. Work. Pap. 2000, 259, 39. [Google Scholar] [CrossRef] [Green Version]
- European Commission. Europe 2020 A Strategy for Smart, Sustainable and Inclusive Growth; Communication from the Commission: Brussels, Belgium, 2010. [Google Scholar]
- Bánhidi, Z.; Dobos, I.; Nemeslaki, A. What the overall Digital Economy and Society Index reveals: A statistical analysis of the DESI EU28 dimensions. Reg. Stat. 2020, 10, 42–62. [Google Scholar] [CrossRef]
- Banhidi, Z.; Dobos, I.; Nemeslaki, A. Comparative Analysis of the Development of the Digital Economy in Russia and EU Measured with DEA and Using Dimensions of DESI. Vestn. St. Petersb. Univ.-Ekon. 2019, 35, 588–605. [Google Scholar] [CrossRef]
- European Commission. State of the Union: Commission proposes a Path to the Digital Decade to Deliver the EU’s Digital Transformation by 2030; European Commission: Brussels, Belgium, 2021. [Google Scholar]
- European Commission. Digital Economy and Society Index 2021 Methodological Note; European Commission: Brussels, Belgium, 2020; p. 11. [Google Scholar]
- Merton, R.K. The Matthew effect in science, II: Cumulative advantage and the symbolism of intellectual property. Isis 1988, 79, 606–623. [Google Scholar] [CrossRef] [Green Version]
- De Solla Price, D. Network of Scientific Papers. Science 1967, 149, 510–515. [Google Scholar] [CrossRef]
- Merton, R.K. The Matthew effect in science: The reward and communication systems of science are considered. Science 1968, 159, 56–63. [Google Scholar] [CrossRef]
- Matthew (25:29). Berean Study Bible; Bible Hub: Pittsburgh, PA, USA, 2020. [Google Scholar]
- Rigney, D. The Matthew Effect: How Advantage Begets Further Advantage; Columbia University Press: New York, NY, USA, 2010. [Google Scholar]
- Perc, M. The Matthew effect in empirical data. J. R. Soc. Interface 2014, 11, 20140378. [Google Scholar] [CrossRef] [PubMed] [Green Version]
- Van Eck, N.J.; Waltman, L. VOSviewer Manual; University of Leiden: Leiden, The Netherland, 2013; Volume 1, pp. 1–53. [Google Scholar]
- Fernández-Portillo, A.; Almodóvar-González, M.; Hernández-Mogollón, R. Impact of ICT development on economic growth. A study of OECD European union countries. Technol. Soc. 2020, 63, 101420. [Google Scholar] [CrossRef]
- Stofkova, Z.; Hraskova, D. Digital skills in period of digital economy. In Proceedings of the Mark. Identity: Online Rules, PT I, International Scientific Conference, Slovak Acad Sci, Smolenice, Slovakia, 7–8 November 2017; pp. 417–425. [Google Scholar]
- Jovanović, M.; Dlačić, J.; Okanović, M. Digitalization and society’s sustainable development–Measures and implications. Zb. Rad. Ekon. Fak. Rijeci Časopis Za Ekon. Teor. Praksu 2018, 36, 905–928. [Google Scholar]
- Fleacă, E. Entrepreneurial Curriculum through Digital-Age Learning in Higher Education–A Process-based Model. TEM J. 2017, 6, 591–598. [Google Scholar] [CrossRef]
- Săvulescu, C.; Antonovici, C.-G. Fostering the Digital Competencies for the 5G Era. In Proceedings of the STRATEGICA-International Academic Conference, Bucharest, Romania, 10–11 October 2019; pp. 644–655. [Google Scholar]
- Huculova, E.; Solcova, L. Cluster Analysis of Digital Performance in Educational Techniques in Conditions of EU. In Proceedings of the 4th International Conference on Higher Education Advances (HEAd), Univ Politrcnica Valencia, Fac Business Adm & Management, Valencia, Spain, 20–22 June 2018; pp. 1029–1037. [Google Scholar]
- Zdjelar, R.; Hrustek, N.Z.; Sumpor, M.J.E. Sustaintable development and active ageing in EU countries–bridges and gaps. In Proceedings of the 38th International Scientific Conference on Economic and Social Development, Faculty of Law, Economics and Social Sciences Sale-Mohammed V University in Rabat, Rabat, Morocco, 21–22 March 2019; pp. 275–284. [Google Scholar]
- Kamberidou, I.; Pascall, N. The digital skills crisis: Engendering technology–empowering women in cyberspace. Eur. J. Soc. Sci. Stud. 2019, 4, 33. [Google Scholar] [CrossRef]
- Hadad, S. Business Digitization in the Romanian Economy. In Proceedings of the 5th International Academic Conference on Strategica-Shift! Major Challenges of Today’s Economy, Bucharest, Romania, 28–30 September 2017; pp. 453–466. [Google Scholar]
- Martínez-Cantos, J.L. Digital skills gaps: A pending subject for gender digital inclusion in the European Union. Eur. J. Commun. 2017, 32, 419–438. [Google Scholar] [CrossRef]
- Tkac, M. Digital Single Market Strategy and its Impact on Trust in Public Administration. In Proceedings of the 26th Conference on Interdisciplinary Information Management Talks (IDIMT), Kutna Hora, Czech Republic, 5–7 September 2018; pp. 277–286. [Google Scholar]
- Stofkova, K.R.; Stofkova, J. Use of Open Data in the Development of the Digital Economy in the Knowledge Society in the Era of Globalization. In Proceedings of the 19th International Scientific Conference Globalization and Its Socio- Economic Consequences-Sustainability in the Global-Knowledge Economy, Rajecke Teplice, Slovakia, 9–10 October 2020. [Google Scholar]
- Jendricko, K.; Mesaric, J. The Significance of European Structural and Investment Funds for the Republic of Croatia in the Area of Information and Communications Technologies. In Proceedings of the Interdisciplinary Management Research XV (IMR) Conference, Opatija, Croatia, 16–18 May 2019; pp. 1632–1655. [Google Scholar]
- Luhan, J.; Novotna, V.; Olesovsky, V. The Dynamic Model of System Development in the area of E-government. In Proceedings of the 30th International Business-Information-Management-Association Conference, Madrid, Spain, 8–9 November 2017; pp. 1157–1165. [Google Scholar]
- Pyroh, O.; Kalachenkova, K.; Kuybida, V.; Chmil, H.; Kiptenko, V.; Razumova, O. The Influence of Factors on the Level of Digitalization of World Economies. Int. J. Comput. Sci. Netw. Secur. 2021, 21, 183–191. [Google Scholar] [CrossRef]
- MacGregor Pelikánová, R. Fostering innovation—A myth or reality of the EU in 2018. In Proceedings of the 4th International Conference on European Integration, Ostrava, Czech Republic, 17–18 May 2018; pp. 965–973. [Google Scholar]
- Esses, D.; Csete, M.S.; Németh, B. Sustainability and Digital Transformation in the Visegrad Group of Central European Countries. Sustainability 2021, 13, 5833. [Google Scholar] [CrossRef]
- Francis Pope. Laudato Si: On Care for Our Common Home; Diós, I., Ed.; Vatican Press: Vatican City, 2015; p. 164. [Google Scholar]
- Laitsou, E.; Kargas, A.; Varoutas, D. Digital competitiveness in the European Union era: The Greek case. Economies 2020, 8, 85. [Google Scholar] [CrossRef]
- Tudora, E.; Gheorghe-Moisii, M.; Tîrziu, E. Analiza evoluției indicatorilor DESI și SNADR ai societății informaționale. Rom. J. Inf. Technol. Autom. Control 2020, 30, 121–134. [Google Scholar] [CrossRef]
- Jakovic, B.; Curlin, T.; Miloloza, I. Enterprise Digital Divide: Website e-Commerce Functionalities among European Union Enterprises. Bus. Syst. Res. J. 2021, 12, 197–215. [Google Scholar] [CrossRef]
- Rozite, K.; Balina, S.; Freimane, R.; Univ, L. Digital Competence Rating and Economic Development in the EU. In Proceedings of the 11th International Scientific Conference on New Challenges of Economic and Business Development-Incentives for Sustainable Economic Growth, Univ Latvia, Riga, Latvia, 16–18 May 2019; pp. 701–708. [Google Scholar]
- Čiefová, M. Austria’s Competitiveness: Assessing Changes Compared to the Past Year. In Proceedings of the 18th International Scientific Conference, Smolenice, Slovakia, 30 November–1 December 2017; pp. 155–161. [Google Scholar]
- Moldabekova, A.; Philipp, R.; Reimers, H.-E.; Alikozhayev, B. Digital Technologies for Improving Logistics Performance of Countries. Transp. Telecommun. 2021, 22, 207–216. [Google Scholar] [CrossRef]
- Khalid, B.; Naumova, E. Digital Transformation SCM in View of Covid-19 from Thailand SMEs Perspective; Nova Science Publisher: Hauppauge, NY, USA, 2021. [Google Scholar]
- Barykin, S.Y.; Kapustina, I.V.; Sergeev, S.M.; Kalinina, O.V.; Vilken, V.V.; de la Poza, E.; Putikhin, Y.Y.; Volkova, L.V. Developing the physical distribution digital twin model within the trade network. Acad. Strateg. Manag. J. 2021, 20, 18. [Google Scholar]
- Luchko, M. Positions of Nordic Countries through the Prism of International Ratings. Contemp. Eur. 2020, 3, 83–95. [Google Scholar] [CrossRef]
- Hofstede, G. Cultural dimensions in management and planning. Asia Pac. J. Manag. 1984, 1, 81–99. [Google Scholar] [CrossRef]
- Ivanovic-Dukic, M.; Stevanovic, T.; Radenovic, T. Does digitalization affect the contribution of entrepreneurship to economic growth? Zb. Rad. Ekon. Fak. Rijeci 2019, 37, 653–679. [Google Scholar] [CrossRef]
- Rakićević, J.; Rakićević, A.; Poledica, A. Logical clustering approach for analysing digital economy and society performance of countries. In Proceedings of the 11th Conference of the International Fuzzy Systems Association and the European Society for Fuzzy Logic and Technology (EUSFLAT 2019), Prague, Czech Republic, 9–13 September 2019; pp. 550–557. [Google Scholar]
- Borowiecki, R.; Siuta-Tokarska, B.; Maroń, J.; Suder, M.; Thier, A.; Żmija, K. Developing Digital Economy and Society in the Light of the Issue of Digital Convergence of the Markets in the European Union Countries. Energies 2021, 14, 2717. [Google Scholar] [CrossRef]
- Polozova, T.; Kolupaieva, I.; Sheiko, I. Digital Gap in EU Countries and its Impact on Labour Productivity and Global Competitiveness. In Proceedings of the 19th International Scientific Conference on Hradec Economic Days, Hradec Kralove, Czech Republic, 25–26 May 2021. [Google Scholar]
- Tsenzharik, M.K.; Krylova, Y.V.; Steshenko, V.I. Digital transformation in companies: Strategic analysis, drivers and models. Vestn. St. Petersb. Univ.-Ekon. 2020, 36, 390–420. [Google Scholar] [CrossRef]
- Giannone, D.; Santaniello, M. Governance by indicators: The case of the Digital Agenda for Europe. Info. Commun. Soc. 2019, 22, 1889–1902. [Google Scholar] [CrossRef]
- Bogoslov, I.A.; Lungu, A.E. The Relationship between Entrepreneurship and Digitalization-Spotlight on the EU Countries. Stud. Bus. Econ. 2020, 15, 5–15. [Google Scholar] [CrossRef]
- Moreno-Llamas, A.; Garcia-Mayor, J.; De la Cruz-Sanchez, E. The impact of digital technology development on sitting time across Europe. Technol. Soc. 2020, 63, 6. [Google Scholar] [CrossRef]
- Karnitis, G.; Virtmanis, A.; Karnitis, E. Key drivers of digitalization; EU context and Baltic case. Balt. J. Mod. Comput. 2019, 7, 70–85. [Google Scholar] [CrossRef]
- Ershova, I.; Obukhova, A.; Belyaeva, O. Implementation of innovative digital technologies in the world. Econ. Ann. XXI 2020, 186. [Google Scholar] [CrossRef]
- Lomakina, O.; Kookueva, V.; Makarenko, A. Redistribution of economic resources in the digital society. Bus. Soc. Rev. 2021, 126, 25–35. [Google Scholar] [CrossRef]
- Szőllősi, L.; Béres, E.; Szűcs, I. Effects of modern technology on broiler chicken performance and economic indicators–a Hungarian case study. Ital. J. Anim. Sci. 2021, 20, 188–194. [Google Scholar] [CrossRef]
- Jurčević, M.; Lulić, L.; Mostarac, V. The Digital Transformation of Croatian Economy compared with EU Member Countries. Ekon. Vjesn. /Econviews -Rev. Contemp. Bus. Entrep. Econ. Issue 2020, 33, 151–164. [Google Scholar]
- Ivanovic, M.; Ambros, F. The Ecoomic Impacts of Broadband Access Investment in Croatia. In Proceedings of the 5th International Scientific Symposium on Economy of Eastern Croatia-Vision and Development, Osijek, Croatia, 2–4 June 2016; pp. 911–921. [Google Scholar]
- Grinberga-Zalite, G.; Hernik, J. Digital Performance Indicators in the EU. In Proceedings of the 25th Annual International Scientific Conference on Research for Rural Development, Latvia Univ Life Sci & Technologies, Jelgava, Latvia, 15–17 May 2019; pp. 183–188. [Google Scholar]
- Vidruska, R.; Univ, L. The Digital Economy & Society Index and Network Readiness Index: Performance of Latvia on European Union Arena. In Proceedings of the International Conference on New Challenges of Economic and Business Development-Society, Innovations and Collaborative Economy, Univ Latvia, Riga, Latvia, 12–14 May 2016; pp. 901–916. [Google Scholar]
- Quah, D.T. Empirics for economic growth and convergence. Eur. Econ. Rev. 1996, 40, 1353–1375. [Google Scholar] [CrossRef] [Green Version]
- Barro, R.J.; Xavier Sala, I.M.; Blanchard, O.J.; Hall, R.E. Convergence Across States and Regions. Brook. Pap. Econ. Act. 1991, 1991, 107–182. [Google Scholar] [CrossRef] [Green Version]
- Barro, R.J.; Sala-i-Martin, X. Convergence. J. Polit. Econ. 1992, 100, 223–251. [Google Scholar] [CrossRef]
- Ramsey, F.P. A mathematical theory of saving. Econ. J. 1928, 38, 543–559. [Google Scholar] [CrossRef]
- Solow, R.M. A contribution to the theory of economic growth. Q. J. Econ. 1956, 70, 65–94. [Google Scholar] [CrossRef]
- Koopmans, T.C. On the Concept of Optimal Economic Growth; Yale University: New Haven, CT, USA, 1963; p. 38. [Google Scholar]
- Obláth, G.; Szörfi, B. Makrogazdasági konvergencia az EU új tagországaiban. In Társadalmi Riport; Kolosi, T., Tóth, I.G., Eds.; Tárki: Budapest, Hungary, 2008; pp. 204–225. [Google Scholar]
- Pearson, K. LIII On Lines and Planes of Closest Fit to Systems of Points in Space. Philos. Mag. J. Sci. 1901, 2, 559–572. [Google Scholar] [CrossRef] [Green Version]
- Hotelling, H. Analysis of a complex of statistical variables into principal components. J. Educ. Psychol. 1933, 24, 417. [Google Scholar] [CrossRef]
- R Core Team. R: A Language and Environment for Statistical Computing; R Foundation for Statistical Computing: Vienna, Austria, 2020. [Google Scholar]
- European Commission. Digital Economy and Society Index. In Digital Agenda for Europe; European Commission: Brussels, Belgium, 2021. [Google Scholar]
- Clark, D. Number of SMEs in the European Union 2008–2021, by Size. In Statista.com. Available online: https://www.statista.com/statistics/878412/number-of-smes-in-europe-by-size/ (accessed on 7 July 2021).
- European Commission. Real GDP per capita. In Eurostat. Available online: https://ec.europa.eu/eurostat/databrowser/view/sdg_08_10/default/table?lang=en (accessed on 5 November 2021).
- Folea, V. European public policies in the area of the digital economy and society: Country performance analysis. In Proceedings of the CBU International Conference Proceedings 2018: Innovations in Science and Education, Prague, Czech Republic, 21–23 March 2018; pp. 120–128. [Google Scholar]
- Condruz-Bacescu, M. E-learning Market in Romania. In Proceedings of the 15th International Scientific Conference on eLearning and Software for Education (eLSE)-New Technologies and Redesigning Learning Spaces, Bucharest, Romania, 11–12 April 2019; pp. 49–56. [Google Scholar]
- Rodrigues, A.L.; Cerdeira, L.; Machado-Taylor, M.D.; Alves, H. Technological Skills in Higher Education-Different Needs and Different Uses. Educ. Sci. 2021, 11, 326. [Google Scholar] [CrossRef]
- Jaculjakova, S.; Stofkova, K.R. Analysis of Basic Digital Skills of Citizens in Selected Region. In Proceedings of the 14th International Technology, Education and Development Conference (INTED), Valencia, Spain, 2–4 March 2020; pp. 6141–6149. [Google Scholar]
- Tumbas, P.; Sakai, M.; Pavlicevic, V.; Rakovic, L. Digital Competencies in Business Informatics Curriculum Innovation. In Proceedings of the 13th International Technology, Education and Development Conference (INTED), Valencia, Spain, 11–13 March 2019; pp. 9655–9664. [Google Scholar]
- Štofková, Z.; Soltes, V.; Stofkova, J. Survey of the Citizens Digital Skills in the Region. In Proceedings of the 12th annual International Conference of Education, Research and Innovation, Seville, Spain, 11–13 November 2019; pp. 7127–7132. [Google Scholar]
- Matkovic, P.; Maric, M.; Rakovic, L.; Sakal, M. Enhancing Digital Competences in Higher Education. In Proceedings of the 12th Annual International Conference of Education, Research and Innovation (ICERI), Seville, Spain, 11–13 November 2019; pp. 7939–7944. [Google Scholar]
- López Peláez, A.; Erro-Garcés, A.; Gómez-Ciriano, E.J. Young people, social workers and social work education: The role of digital skills. Soc. Work Educ. 2020, 39, 825–842. [Google Scholar] [CrossRef]
- Kwilinski, A.; Vyshnevskyi, O.; Dzwigol, H. Digitalization of the EU Economies and People at Risk of Poverty or Social Exclusion. J. Risk Financ. Manag. 2020, 13, 142. [Google Scholar] [CrossRef]
- Vyshnevskyi, O.; Stashkevych, I.; Shubna, O.; Barkova, S. Economic growth in the conditions of digitalization in the EU countries. Stud. Appl. Econ. 2020, 38, 3. [Google Scholar] [CrossRef]
- Basol, O.; Yalcin, E.C. How does the digital economy and society index (DESI) affect labor market indicators in EU countries? Hum. Syst. Manag. 2021, 40, 503–512. [Google Scholar] [CrossRef]
- Stavytskyy, A.; Kharlamova, G.; Stoica, E.A. The Analysis of the Digital Economy and Society Index in the EU. Balt. J. Eur. Stud. 2019, 9, 245–261. [Google Scholar] [CrossRef] [Green Version]
- Neamtu, D.M.; Hapenciuc, C.V.; Bejinaru, R. The Impact of Digitalization on Business Sector Development in the Knowledge Economy. In Proceedings of the 13th International Conference on Business Excellence (ICBE)-Sustainable Business Models and Innovation in the Knowledge Economy, Bucharest, Romania, 21–22 March 2019; pp. 479–491. [Google Scholar]
- Bejinaru, R. Knowledge strategies aiming to improve the intellectual capital of universities. Manag. Mark. 2017, 12, 500–523. [Google Scholar] [CrossRef] [Green Version]
- Stankovic, J.J.; Marjanovic, I.; Drezgic, S.; Popovic, Z. The Digital Competitiveness of European Countries: A Multiple-Criteria Approach. J. Compet. 2021, 13, 117–134. [Google Scholar] [CrossRef]
- Todorut, A.V.; Tselentis, V. Digital Technologies and the Modernization of Public Administration. Qual.-Access Success 2018, 19, 73–78. [Google Scholar]
- Murariu, M.; Bedrule-Grigoruta, M.V. Digitalisation- A Sine-qua-non Condition for the Romanian Public Managament. In Proceedings of the European Finance, Business and Regulation International Conference (EUFIRE), Alexandru Ioan Cuza Univ Iasi, Fac Econ & Business Adm, Iasi, Romania, 15 May 2020; pp. 621–631. [Google Scholar]
- Gaftea, V. Awarness in eEducation given by Strategies and Indicators. In Proceedings of the 12th International Scientific Conference on eLearning and Software for Education (eLSE), Bucharest, Romania, 21–22 April 2016; pp. 593–600. [Google Scholar]
- Baltateanu, A.M. Digitalization. Global Challenges and Economic Prosperity Example: Romania. In Proceedings of the 8th International Academic Conference on Strategica-Preparing for Tomorrow, Today, Bucharest, Romania, 15–16 October 2020; pp. 520–530. [Google Scholar]
- Iliescu, M.E. Barriers to Digital Trannsformation in SMES: A Qualitative Exploration of Factors Affecing ERP Adoption in Romania. In Proceedings of the 8th International Academic Conference on Strategica-Preparing for Tomorrow, Today, Bucharest, Romania, 15–16 October 2020; pp. 453–461. [Google Scholar]
- Kuncová, M.; Doucek, P. Comparison of ICT Development in V4 Countries. In Proceedings of the 16th International Scientific Conference on Hradec Economic Days, Hradec Kralove, Czech Republic, 30–31 January 2018; pp. 513–522. [Google Scholar]
- Herman, E. The Influence of ICT Sector on the Romanian Labour Market in the European Context. In Proceedings of the 13TH International Conference Interdisciplinarity in Engineering (INTER-ENG 2019), Targu Mures, Romania, 3–4 October 2019; pp. 344–351. [Google Scholar]
Publisher’s Note: MDPI stays neutral with regard to jurisdictional claims in published maps and institutional affiliations. |
© 2022 by the authors. Licensee MDPI, Basel, Switzerland. This article is an open access article distributed under the terms and conditions of the Creative Commons Attribution (CC BY) license (https://creativecommons.org/licenses/by/4.0/).