Article

European Citizens’ Happiness: Key Factors and the Mediating Effect of Quality of Life, a PLS Approach

by
Nuria Huete-Alcocer
1,
Víctor-Raúl López-Ruiz
1,
José Luis Alfaro-Navarro
2,* and
Domingo Nevado-Peña
3
1
Department of Spanish and International Economics, Econometrics and History and Economic Institution, University of Castilla-La Mancha, 02071 Albacete, Spain
2
Department of Political Economy and Public Finance, Economic and Business Statistics and Economic Policy, University of Castilla-La Mancha, 02071 Albacete, Spain
3
Department Business Administration, University of Castilla-La Mancha, 13071 Ciudad Real, Spain
*
Author to whom correspondence should be addressed.
Mathematics 2022, 10(3), 367; https://doi.org/10.3390/math10030367
Submission received: 23 December 2021 / Revised: 20 January 2022 / Accepted: 22 January 2022 / Published: 25 January 2022

Abstract

:
Happiness is a very important aspect in the life and well-being of all citizens; as such, it has become a key factor in personal preferences. For these reasons, it is relevant to study what factors principally affect the happiness of the population. However, the difficulties involved in measuring this concept mean that there are no clear criteria as to which aspects should be promoted in order for citizens to achieve greater happiness. This paper uses variance-based structural equation modelling (SEM)—partial least squares path modelling (PLS)—to analyse the direct and indirect effects of European citizens’ assessment of different aspects of their city related to safety, environmental quality and urban planning on their happiness. The source of information used in this study is the Flash Eurobarometer 419 prepared by Eurostat in 2015, with a total of 9799 observations. The results show how quality of life, safety, the environment and city planning have a positive and significant influence on European citizens’ happiness, especially safety. In addition, quality of life acts as a mediating variable, primarily increasing the influence of urban planning on happiness. The findings of the study point to the relevant policies that governments should undertake to ensure the happiness of their citizens.

1. Introduction

Happiness and life satisfaction are currently central themes of research in social sciences, psychology, philosophy and economics [1]. Much of the work has been based on determining more objective methods of research on happiness, well-being and quality of life, supported by socioeconomic and geographical attributes, with a special interest in the impact of inequalities, such as social justice, social and spatial [2]. Equally, however, numerous studies have emerged that consider more subjective characteristics through the use of social surveys [3], where citizens rate their health, well-being, life satisfaction, as well as their happiness in general [4].
The measurement and analysis of happiness is becoming increasingly important in the social sciences [5], where there have been numerous attempts to define, measure and analyse subjective measures of happiness from the perspective of different academic disciplines, from neuroscience and psychology to philosophy and economics [6]. Thus, happiness has been shown to be one of the key factors in subjective well-being and overall life satisfaction [7,8,9,10,11,12], and it is very related if you take into account the place where a person lives, especially in the cultural context [13]. Thus, the current vision of urban, economic and social policy in cities is taking on particular importance [14], with the aim of understanding the happiness of their residents [15,16]. The place where one lives affects all aspects of everyday life and, therefore, affects one’s happiness [15,17,18]. In this regard, authors such as [19] have examined whether the happiness of citizens depends on the amount of services available in a city. Their results reveal that they must have a good quality of services, for example: surveillance, schools, beauty, easy access to health, as well as transportation services and cultural and recreational opportunities. In this sense, this is what really determines whether cities will succeed or fail when residents are presented with opportunities to have a good quality of life. In view of the above, this study uses a subjective approach for measuring happiness in order to analyse how it is influenced by both personal elements and external factors simultaneously [20].
The purpose of this research is to gain a better understanding of how some key factors influence the happiness of European citizens since people normally tend to choose where to live based on job opportunities, as well as the services and public goods offered [15]. To that end, a factor analysis using the Flash Eurobarometer 419 from 2015 [21] produced by Eurostat has allowed us to identify some key aspects of cities for citizens, according to their degree of satisfaction with them. The factors identified measure citizens’ satisfaction with safety, environmental actions and urban planning. Thus, we first conduct a literature review to observe how the literature approaches these factors before analysing the effects they have on happiness, considering both the direct effect of each factor and the indirect effect, mediated by quality of life. Specifically, the Flash Eurobarometer 419 compiles European citizens’ assessments of different items relating to various aspects of their personal situation, their city and the neighbourhood where they live. It should be noted that this information has been filtered, taking into account some of the specifics of this study, allowing us to identify the three key factors mentioned above.
Thus, in Section 2, we conduct a literature review that allows us to confirm the use of quality of life as a mediating variable, as well as the theoretical justification for each of the hypotheses established in the article. Section 3 details the methodology applied in this research, the database used, the definition of each of the factors considered and the procedure used to fit the corresponding model. The results and discussion are presented in Section 4 where the measurement of the model and the validation of the hypotheses proposed in this study are shown. The method chosen has been through structural equations (SEM), using the technique of partial least squares (PLS). This technique has become a standard tool for analysing complex interrelationships between variables [22,23] and is used in many disciplines [24]. Section 5 outlines the main conclusions reached, together with the new lines of research opened up.

2. Background on Happiness and the Mediating Effect of Quality of Life

Regarding the measurement of happiness, Veenhoven [25] and Diener and Seligman [26] hold that happiness reveals an individual’s assessment of the general aspects of their life and conditions, and how much an individual likes the life that he/she lives. Therefore, the central concept of happiness is the subjective assessment of one’s life or satisfaction with life [7,27]; they thus claim that happiness can be measured through “Satisfaction with life in this city”. This way of measuring happiness is supported by the works of Diener [28], Diener and Inglehart [29], Veenhoven [30] and Bernini, Emili and Galli [31]. In addition, Moeinaddini et al. [32] consider that happiness is synonymous with satisfaction of the experience, and this satisfaction can come from everything around you. Therefore, the place where one lives affects happiness [33]. In this study, we follow this subjective approach, establishing that the way to measure residents’ happiness with their city is through the answer to the question “I am satisfied to live in…”.
The literature review has allowed us to observe how the terms happiness and quality of life are intertwined, given the links between them. While there are studies that clearly differentiate between quality of life and happiness by measuring quality of life through aspects, such as income [34], income and employment [35] or the built environment, education, leisure and recreation, mental and physical health, social belonging and safety and crime. [16,36]. Other studies support that quality of life is synonymous with more abstract issues, such as freedom, human rights and happiness. [37], which complicates the task of differentiating between quality of life and happiness. In this respect, we consider quality of life as a mediating variable that can contribute to happiness. Accordingly, we approach quality of life as a multidimensional concept, accounting for different aspects that allow us to measure citizens’ quality of life. It is worth highlighting the work of [14,38], which have served as a starting point for our study.
Węziak-Białowolska [14], using the Flash Eurobarometer 366 [39] proposes measuring quality of life in relation to citizen’s satisfaction with aspects, such as availability of services, the environment and social aspects in cities and characteristics of the city, such as size, location, safety, economic development, the labour market and the quality of institutions. Thus, the results indicate that satisfaction with life in a city is very different, both within cities and across Europe. In the same vein, Nevado-Peña et al. [38], based on the Flash Eurobarometer 419, proposes four dimensions for the measurement of the quality of life of European citizens: Life Satisfaction (Trust and Safety), Mobility (Culture and Sports), Integration (Sustainability) and Public Services.
This way of measuring quality of life allows the researcher, on the one hand, to analyse its direct influence on happiness and, on the other, to consider it as a mediating variable of the effects on happiness. This allows more in-depth research on what aspects to promote in order to ultimately achieve greater happiness in European citizens. In this regard, it is necessary to establish different hypotheses to be tested in this study.

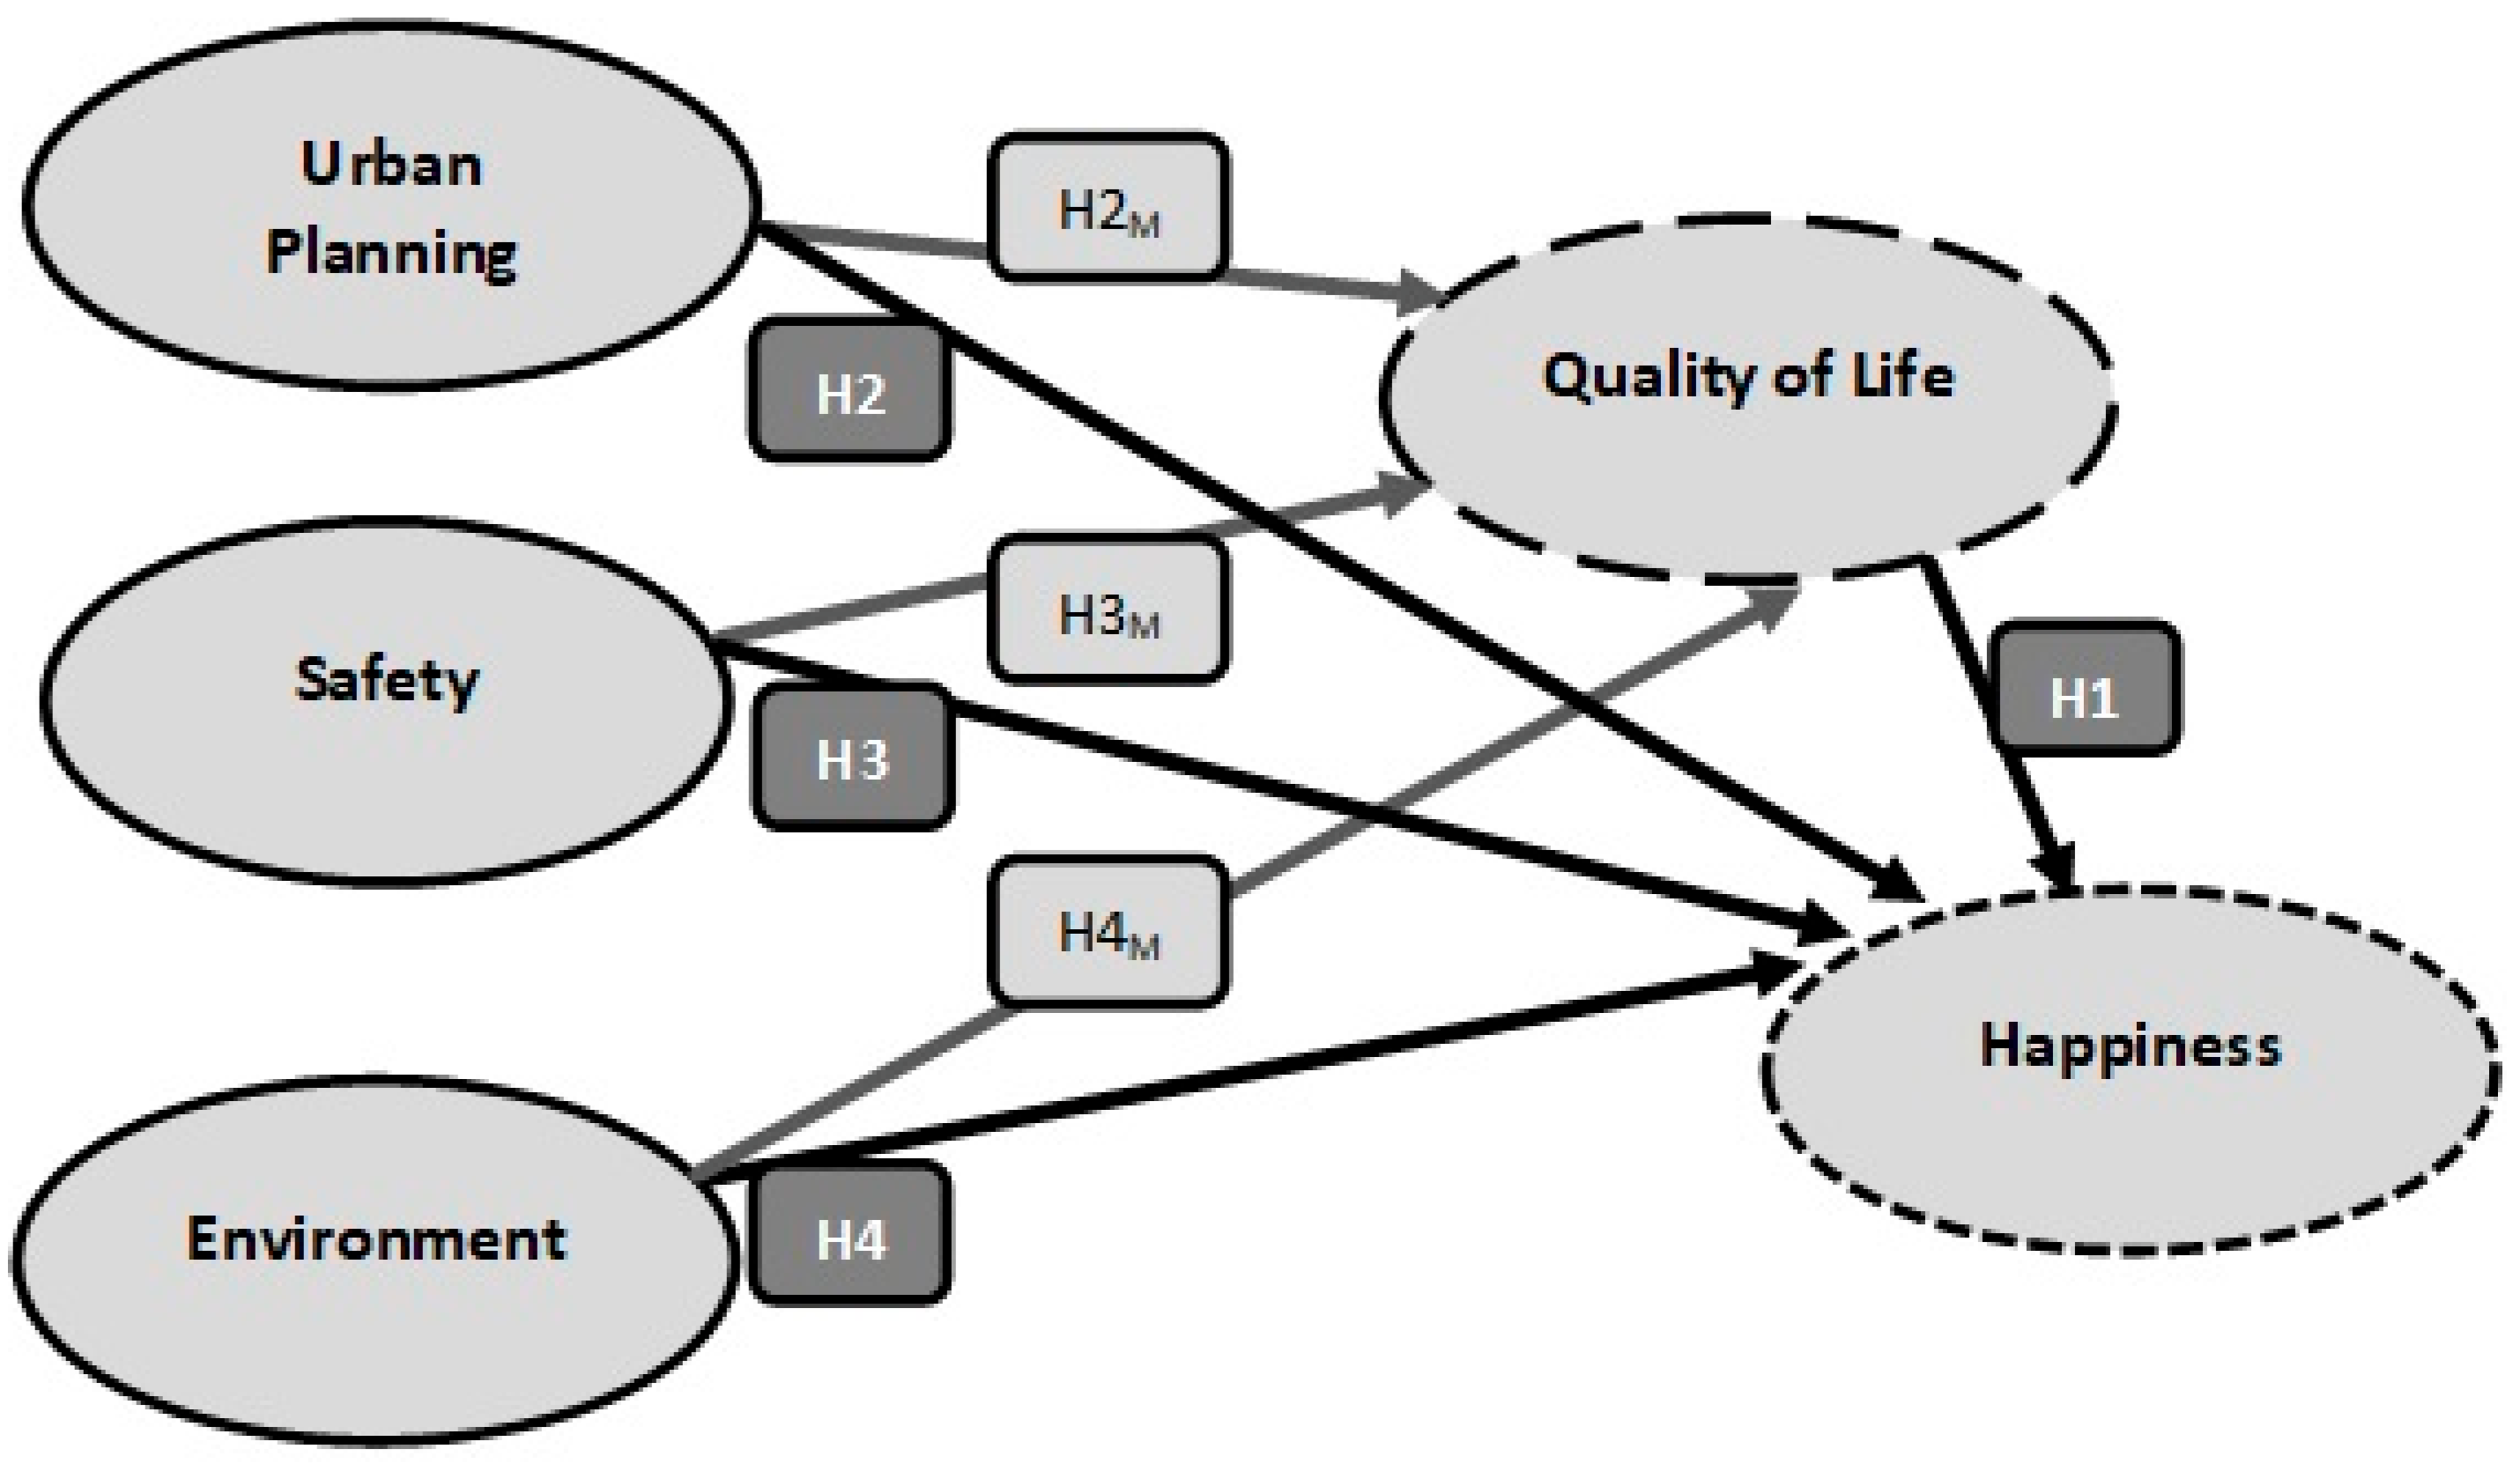
2.1. European Citizens’ Happiness: Hypotheses Development

From the literature review, we draw our first hypothesis on the relationship between quality of life and happiness. Senasu and Singhapakdi [40] analyse the influence of quality of life on the happiness of Thai citizens in family, community and work settings. Li [41] uses objective, subjective and social quality indicators for three Chinese cities, analysing the relationship between respondents’ happiness and quality of life characteristics (objective and subjective) and social quality. Finally, several analyses have found that, among the three abovementioned sets of factors, the ones that most influence happiness are subjective indicators [31,42]. Thus, we propose the following hypothesis to determine whether happiness in European cities can be influenced by people’s subjective assessment of their quality of life:
Hypothesis 1 (H1).
Quality of life in European cities has a positive and significant influence on happiness.
Analysing the influence of different types of factors on happiness and quality of life requires the use of a multidimensional approach. This allows us to include a wide range of factors, considering both the direct effect of each factor on happiness and the indirect effect mediated by quality of life. In this respect, there are a number of studies that explore the influence of different economic/labour-related factors on happiness; notable examples focus on income [2,3,15,36,41,43,44,45,46,47], or employment status and access to housing [15,44]. However, other studies account for aspects related to the city of residence, such as population density or travel times on public transport [15] or the size of the city [48,49]. For example, accessibility and transportation play an important role in obtaining a good quality of life [49]. However, according to our background, there are no studies that focus on citizens’ subjective assessment of the particular features of their city. In this regard, we consider assessments of urban planning, the environment and safety, and the extent to which quality of life acts as a mediating variable on their influence.

2.1.1. Urban Planning

Life satisfaction tends to be higher in regions with intermediate levels of urbanisation [50]. The constant growth of cities’ populations has prompted rapid planned urbanisation in many of them, which has helped to improve the quality of life of millions of people [51]. Thus, the type of urbanisation of a city has proven to be important in predicting happiness [20,52]. In addition, urban parks, considered green spaces, are associated with obtaining a good quality of life translated into good health and well-being of people [53].
The progress that is taking place between the standard of living and the urbanisation of the place of residence are increasingly related. This leads some studies to conclude that we are happier in cities. [54]. However, those that have lost population may be due to the fact that they present lower quality of life standards, which leads to a general negative conception of these cities [49]. In this sense, people tend to choose where to live according to the job opportunities, public goods and services the location provides [15]. Conversely, Maricchiolo et al. [18] show that urban development, in the sense of whether someone lives in a rural or urban area, does not directly affect happiness.
This rapid urbanisation has meant that urban planning can have an influence on happiness since most cities would be chaotic without such planning. Papachristou and Rosas-Casals [17] and Zhang and Wang [16] have shown that proper urban planning is vital in order to ensure residents’ quality of life [55,56,57] and, consequently, their happiness [16,32].
Indeed, research has shown that the distance of commutes, as determined by urban planning, is closely related to residents’ happiness [15,45,51,58,59]. Duarte et al. [60] find that respondents who use the subway to go to work are happier than those who travel by car, while Abou-Zeid and Ben-Akiva [61] report that commuters in non-motorised vehicles are happier than those who commute by car and public transport. In light of the above, we consider two further hypotheses for analysis: whether the urban planning factor influences European citizens’ happiness and whether their quality of life has a mediating effect on said relationship.
Hypothesis 2 (H2).
Planning in European cities has a positive and significant influence on happiness.
Hypothesis 2M (H2M).
The influence of planning on happiness is positively mediated by quality of life.

2.1.2. Safety

Papachristou and Rosas-Casals [17] argue that the subjective happiness of citizens consists of the satisfaction they obtain through three factors: comfort and security in the place of residence, having satisfactory social relationships and feeling that there is an increase in vital possibilities. Similarly, Veenhoven [62] argues that quality of life can refer to society and, in other cases, to the happiness of its citizens. For shrinking cities, Delken [48] shows that his is not because residents are unaware of the situation in their city, since they seem to be more concerned about job opportunities and crime [48]. Therefore, measures taken to improve safety and lifestyle will unquestionably improve quality of life and happiness [16,63]. Authors such as Amado et al. [49] reveal that safety in smaller cities helps to develop a friendly environment.
The review focusing on public safety reveals that this factor has been the least studied in terms of its influence on citizens’ happiness. This finding underlies the idea of proposing two further hypotheses regarding whether safety in European cities directly or indirectly affects the happiness of their citizens, considering both the direct effect and the effect mediated by quality of life.
Hypothesis 3 (H3).
Safety in European cities has a positive and significant influence on happiness.
Hypothesis 3M (H3M).
The influence of safety on happiness is positively mediated by quality of life.

2.1.3. Environment

The relationships between environmental and well-being factors are causing great interest in research, specifically in the field of economics, psychology, health and conservation [64]. However, the lack of attention paid to the city environment justifies the lack of research that exists to understand how the characteristics of the environment influence happiness throughout life [19]. In this regard, there are at least reasons to believe that the natural environment is positively related to well-being, health and happiness. Similarly, awareness of a local environmental problem and its adverse effects on the health of people and the ecosystem can have a negative influence on levels of happiness. This is, therefore, because natural environments tend to increase happiness as they facilitate and encourage behaviours that are physically and mentally enhancing, including physical exercise, recreation and social interaction [64].
In this respect, citizens’ perceptions of air pollution can influence their happiness [65]. Thus, studies, such as MacKerron and Mourato [64], show how citizens are significantly happier when they live in places that have more green or natural spaces, unlike those who live in urban environments. This relationship between the environment and subjective well-being is sometimes mediated by variables that help explain these causal effects, such as satisfaction with personal relationships, health, satisfaction from leisure and the emotional response to the neighbourhood [57]. In the same sense, ref. [66] posit that the “rhythm of life” indicator is an important mediator between perceived quality of life and people’s relationship with the environment. Together with the type of urbanisation of a city (considering buildings, streets, etc.), this has been indicated to be relevant to achieving the happiness of the citizens [52]. Thus, we try to analyse the influence of the city’s environment on the happiness of its inhabitants and whether the quality of life they enjoy in their place of residence can mediate the influence on said happiness. To that end, two further hypotheses are proposed.
Hypothesis 4 (H4).
The environment in European cities has a positive and significant influence on happiness.
Hypothesis 4M (H4M).
The influence of the environment on happiness is positively mediated by quality of life.

3. Material and Methodology

The source of information used in this study is the Flash Eurobarometer 419 produced by Eurostat in 2015, as this is the most up-to-date information available. The information it compiles consists of a Likert-scale assessment of citizens’ degree of satisfaction with certain aspects of their city. It has been produced for a total of 79 cities and 4 “greater cities” in the EU, as well as Turkey, Iceland, Norway and Switzerland [21], and includes a total of 40,798 observations. In this study, we filtered the information in three ways: first, we removed information related to the greater cities, as it was thought it could distort the results; second, we removed observations that answered “don´t know” to some of the questions, thus leaving complete information in the database, and such that the different items are measured on a 4-point Likert scale (very satisfied; rather satisfied; rather unsatisfied; not at all satisfied); and finally, we removed cities that did not have a representative number of observations and those that do not belong to the European Union (the United Kingdom is included). This filtering of the information yielded a total of 9799 observations, the distribution of which by country and city can be seen in Appendix A.
Based on this information, we first carried out a factor analysis to identify the key factors in citizens’ satisfaction and the items corresponding to each one. In the first place, for the evaluation of a PLS-SEM model, it is required to specify the model measure and later to evaluate the structural model where the hypotheses are tested. We started with a reflective model and used the partial least squares (PLS) technique [67]. This methodology allows being more flexible in the specification of the relationship between elements and constructions. It also works well in any setting and field of study [23] and has been more studied than CB-SEM (based on covariance) [68]. SEM is a good method to address the problem of measuring unobservable latent variables [69]. Table 1 shows the latent factors and items extracted for the sample together with the value of Cronbach’s alpha (α), which allows us to verify the validity of these latent variables, and the Kaiser–Meyer–Olkin (KMO) measure to determine the adequacy of the data for factor analysis.
The results in Table 1 confirm the validity of the factor analysis carried out, as shown by the high KMO values. In addition, the validity of the constructs is confirmed by the Cronbach’s Alpha values above 0.7 [70]. Therefore, the quality of life of European citizens can be measured through their subjective responses regarding their degree of satisfaction with four items in their economic/financial and labour sphere. The urban planning factor is determined according to their degree of satisfaction with the public and private services offered, access, mobility and transport infrastructure, assessed through seven items. To measure safety, we again used seven satisfaction items from the survey relating to the surroundings in the neighbourhood of residence, the integration of foreigners and trust in other residents of the neighbourhood. The environmental factor is determined based on European citizens’ responses indicating their satisfaction with five items relating to pollution and green policies. Finally, as discussed above, citizens’ happiness is measured by the answer given to the direct question aimed at assessing citizens’ satisfaction with the place where they live.
To fully test the proposed hypotheses, a reflective-type conceptual model is formulated [71,72,73], currently called mode A [23]. This type of model is used in many fields [69,74,75]. We contribute two innovative elements to the scientific analysis of happiness: different aspects related to the city of residence are assessed from a subjective point of view, and we also include the mediating effect of quality of life on the relationship between these aspects and the happiness of European citizens. We measure all the constructs used, and on the other, we test the hypotheses raised.
The reflective model (model A), shown in Figure 1, is estimated with the PLS technique using the SmartPLS 3.3.2 software package. This software has a good platform that allows sharing and exchanging knowledge between researchers. This measure is determined by (Equation (1)):
Reflective   ( mode   A )   X k j , n = w ˜ k j ξ ˜ j , n + e k j , n  
  • x k i = the manifest variable k of the latent variable i, k = 1, …, K
  • w ˜ k j = the estimated external weight of the indicator x k i
  • ξ ˜ j , n = the latent variable, j = 1, …, J
  • e k j , n = the error term from a bivariate regression [76]. The main results are analysed in the next section.
  • n = the specific observation, n = 1, …, N

4. Main Results and Discussion

First, the measurement model is evaluated with PLS and, subsequently, the hypotheses proposed are contrasted.

4.1. Evaluation of the Measurement Model: Validity and Reliability

For the measurement of reflective models, it involves evaluating the reliability of the measures (the reliability of the indicator and the internal consistency reliability) and the validity (convergent and discriminant validity) [24]. The individual reliability of the indicators was calculated; the simple correlations of the indicators with their constructs were analysed, confirming those items with loadings greater than or equal to 0.707 [77]. Some of the observed variables show a standardised loading slightly lower than this value (Figure 2); however, the t-values were greater than 1.96. In this case, Chin [78] suggests that there is some flexibility in the 0.707 standardised loading rule, especially when indicators can contribute to content validity.
To calculate the reliability of the internal consistency of the reflective construct, the composite reliability is calculated (Equation (2)), which should range between 0.7 and 0.95 [76]:
ρ c =   ( k = 1 K l k ) 2   ( k = 1 K l k ) 2 + k = 1 K v a r ( e k )
  • lk = the outer loading of the manifest variable k corresponding to a latent variable measured with K indicators
  • ek = is the measurement error of k
  • var(ek) = the measurement error variance and it is calculated as 1 l k 2
Cronbach’s alpha (Equation (3)), which is the upper limit of the reliability of internal consistency, is also calculated:
C r o n b a c h ´ s   a = K   r ¯ 1 + ( K 1 ) r ¯ ´
  • r ¯ = the mean of the correlation matrix
With respect to the reliability of the model, it can be confirmed that Cronbach’s Alpha and composite reliability exceed 0.7 for all constructs (Table 2). Thus, the indicators satisfactorily measure the construct to which they are assigned.
Regarding the validation of the measurement model, the acceptable values of the Average Variance Extracted (AVE) (Equation (4)) and Rho_A (Equation (5)) for each of the constructs indicate their reliability (Table 2) [79,80]. These measurements are determined by:
AVE = k = 1 k l k 2   k
ρ A = (   w ^ ´ w ^ ) 2 w ^ ´ (   S d i a g   ( S ) ) w ^ w ^ ´ ( w ^ w ^ ¨ d i a g ( w ^ w ^ ´ ) ) w ^ ´
On the other hand, to calculate the discriminant validity, the Fornell–Larcker [79] criterion is taken into account: if the correlations between the constructs are lower than the square root of the AVE, which is shown on the diagonal of said matrix, it indicates that each construct is different from the others. The results obtained in the matrix of correlations between the constructs of the model (Table 3) confirm the discriminant validity of the measurement model [81]. In addition, the values of the Heterotrait–Monotrait Ratio of Correlations (HTMT) in all cases indicate discriminant validity in the PLS-SEM model [82]; where it has been calculated as (Equation (6)):
HTMT   = 1 K i K j g = 1 K i h = 1 K j r i g , j h 2 K i ( K i 1 ) g = 1 K i 1 h = g + 1 K i r i g , j h   2   K i ( K i 1 ) g = 1 K i 1 h = g + 1 K i r i g , j h

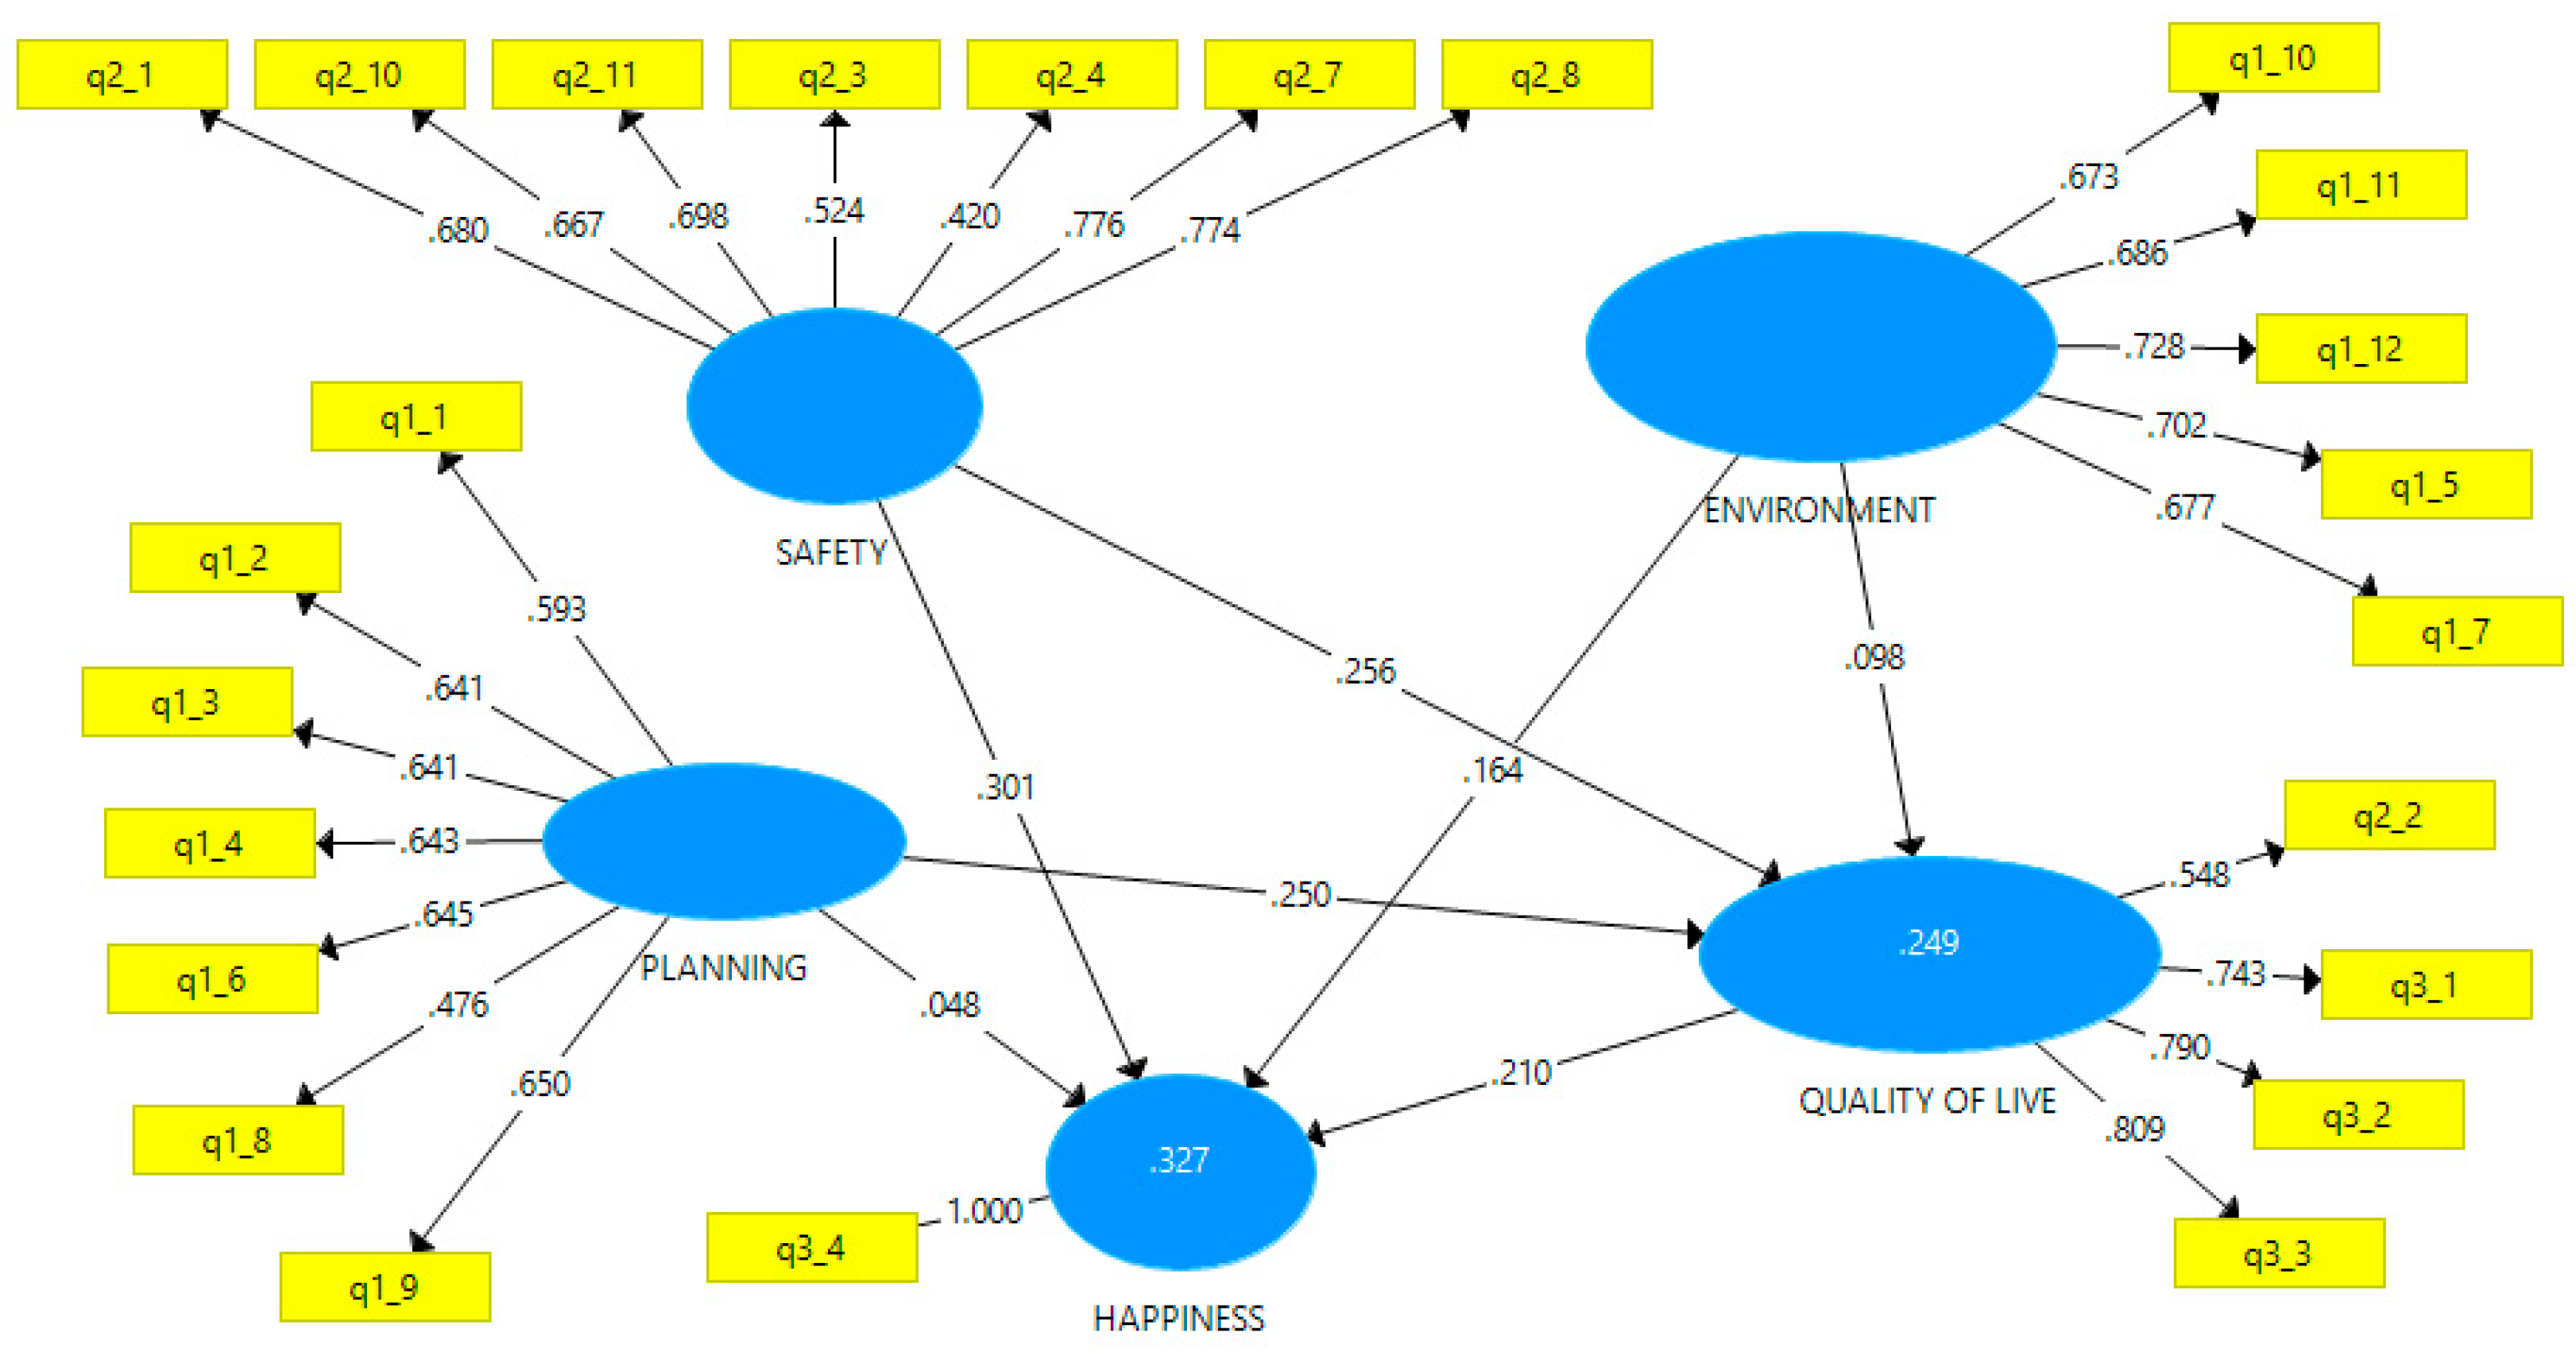
4.2. Evaluation of the Structural Model

Having validated the model, we use the nonparametric resampling technique, PLS bootstrapping [83], to evaluate the relevance of the trajectory coefficients (β), detail the relationships between constructs, as well as the significance of the relationships proposed [68]. Table 4 shows the results of this structural analysis.
In light of these results (Table 4), we accept the first hypothesis, meaning that quality of life has a positive and significant influence on the happiness of European citizens. Their happiness is, therefore, significantly conditioned by their financial and labour sphere and the enabling structural environment; that is, their neighbourhood, district and city. In this sense, the results are in line with studies, such as Senasu and Singhapakdi [40], who first distinguished between the two before testing the influences of quality of life on happiness.
Furthermore, hypotheses 2, 3 and 4 are also accepted, and it is shown that of the variables proposed, the one that has the greatest direct effect on citizens’ happiness is safety in cities, followed by the environment, and to a lesser extent, urban planning. We have, thus, been able to clearly specify the factors that determine Europeans’ personal satisfaction and also rank them. In this regard, safe surroundings in the place of residence and the way that foreigners are integrated in the city are fundamental. Although this has been less investigated, the H3 results are consistent with Janjani [63] and Zhang and Wang [16]. These elements are followed by the environmental conditions (H4), where they coincide with the works of MacKerron and Mourato [64] and Wang et al. [84], the green policy of local governments in all their spheres and, finally, the value added of life in the city considering structural aspects and access to public and private services through infrastructure and spatial-temporal planning. These H2 data are adjusted to the studies, such as Yin et al. [20] and Clark, Yi and Huang [52], where they suggest that the type of urbanisation of a city is relevant to predict happiness.
It should be stressed that these measured effects on European citizens’ happiness are direct, i.e., they condition the choice to live in the city in question rather than another, and the satisfaction with that choice. Variations in these situations should then be assessed to see if this determination is mediated or influenced through the social and labour conditions related to the quality of life variable.
The most relevant prerequisite for the evaluation of the structural model is the evaluation of the quality of the model [85]. For the R2 values have also been taken into account: good results in terms of predictive power are obtained for quality of life (0.249) and for happiness (0.327) [86].
Lastly, as a measure of the fit of the model, the Standardised Root Mean Square Residual (SRMR) is calculated, which compares the difference between observed and predicted correlations. The range lies between 0 and 1, and the lower the value is, the better the model fit [68]. The proposed model shows an appropriate fit with a value of 0.061 [87].
Furthermore, we now test for the existence of a mediating effect of quality of life. To do so, following the methodology proposed by Hayes and Scharkow [88], Zhao, Lynch and Chen [89], Nitzl, Roldan and Cepeda [90] and Carrión, Nitzl and Roldán [91], we propose differentiated analysis through three mediation models (Figure 3). Authors such as Hayes and Scharkow [88] recommend bias-corrected bootstrap confidence intervals as the most reliable test.
The main results for direct and mediating effects are summarised in Table 5. Again, it can be seen that the so-called direct effects are positive and significant (β = 0.229; β = 0.391; β = 0.319; p < 0.001); that is, urban planning, the environment and safety in cities have a positive influence on the happiness of European cities’ residents. The significance of these factors had already been confirmed with the first hypotheses tested (H2, H3 and H4), and they were even ranked according to their value.
Moreover, the indirect effects of these three factors on happiness are also measured, and they are found to be significant when quality of life acts as a mediating variable, given that the confidence interval of these effects does not contain zero (Table 5). These effects were considered relevant in this research after a review of the literature review on how to test hypotheses about indirect effects [92,93].
Having obtained significant results for the indirect effects, we go on to check what type of effect it is and its magnitude [89,90]. Since the indirect effect and the direct effect are in the same direction—in this case, they are both positive—and are both significant; it can be concluded that the European citizens’ quality of life acts as a partial and complementary mediating variable between their happiness and urban planning, the environment and the safety of their cities of residence. The magnitude of the effect is calculated using the Variance Accounted For (VAF) (Equation (7)).
VAF = I n d i r e c t   e f f e c t ( D i r e c t   e f f e c t + I n d i r e c t   e f f e c t )
Thus, having accepted hypothesis H2M, the mediating process accounts for 37.20% of the variance; that is, 37.20% of the effect of urban planning on happiness is positively mediated by quality of life. However, it should be highlighted here that in terms of direct effects, urban planning (0.229) is shown to have the lowest direct impact on the happiness of European citizens. It can, therefore, be concluded that quality of life plays a very important role as a mediator in this relationship since this mediating effect makes urban planning more relevant for citizens. In other words, if we take into account residents’ working and financial spheres, the infrastructure, access to and provision of public and private services, together with commuting efficiency, become essential for improving subjective life satisfaction, or what has been called citizen happiness. These results are in line with those reported by Papachristou and Rosas-Casals [17] and Zhang and Wang [16], who have shown that proper urban planning is vital in order to ensure residents’ quality of life [55,56,57] and, consequently, their happiness [16,32].
On the other hand, the opposite can be observed in regards to safety. Hypothesis H3M is accepted, but with a VAF value of 21.57%, which confirms the lower mediating effect of quality of life on the influence of safety on happiness. Conversely, when compared with the direct effect (0.391), it can be seen that of the three variables, safety is the one that has the greatest direct effect on happiness, but it becomes less relevant for happiness under the mediating influence of quality of life. These results are not conclusive since the review of the literature on public safety indicates that this factor has been the least studied in terms of its direct influence on citizens’ happiness. Given the relevance of these results, they call for further study and point to safety-related initiatives as a priority for local governments in order to ensure the happiness of their residents. These results are in line with the conclusions of Papachristou and Rosas-Casals [17], who claimed that citizens’ subjective happiness consists of the satisfaction provided by living safely.
Lastly, the mediating effect (26.12%) of quality of life on the relationship between the environment and the happiness of European citizens is verified, confirming hypothesis H4M. It has been shown how actions addressing the environment of European cities directly influence (0.319) the happiness of their citizens, but also accounting for quality of life means considering relevant local characteristics and policies related to cleanliness, air quality, noise level or the condition of streets and buildings. This evidence aligns with the article of MacKerron and Mourato [64], who demonstrated how citizens are much happier outdoors in all types of habitats, whether green or natural, than in urban settings.

5. Conclusions

From a theoretical point of view, happiness can be measured in two ways. One would be multivariable, which considers that different aspects of life should be used for its measurement. On the one hand, there are those who consider that happiness is obtained through a single variable that measures general satisfaction with life. In this work, with the information available, we have used a single item as a measure of happiness.
On the other hand, the analysis of the factors affecting the happiness of the population has become critical, especially in situations as sensitive as those currently resulting from the COVID-19 pandemic. In this regard, the literature review has allowed us to verify that the most widely-analysed factors relate to the economic-labour sphere, with less of a focus on the influence of factors related to aspects of the city of residence.
Thus, based on the Flash Eurobarometer 419, we have developed a set of indicators to measure citizens’ satisfaction with aspects related to urban planning, the environment and safety in the city, which are key elements for quality of life. We have been able to confirm their direct effects on the happiness of European citizens, as well as their indirect effects mediated by quality of life, i.e., the influence these factors exert through quality of life.
The results obtained indicate the hierarchy of issues that facilitate the happiness of European cities’ residents. “Urbanites” also choose their residence based on their financial/labour and social environment, so the variable quality of life is a mediator for these factors. Thus, safety has the greatest significance for European citizens, followed by green policies and then issues of mobility, access to and provision of services, all of which give them satisfaction with their way of life. However, if the mediating effect of quality of life is included, the key factors are more balanced, as the effect of planning increases and that of safety decreases. Therefore, as a place of residence, the city satisfies all of a human being’s needs for existence, with preferential emphasis on the financial and labour sphere, and, subsequently, complemented by matters of safety, the environment and urban planning.
This research opens up new lines of study, which will depend on the availability of information in the future, this being one of the limitations in this study since it has not been possible to analyse other possibly interesting variables about happiness, such as living in rural areas. In this sense, there are questions of comparability between the key factors for happiness and whether they are the same in geographical areas other than Europe. On the other hand, in the future, the collection of similar data in European cities after COVID-19 will be able to analyse the effect that the pandemic has had on these factors and determine if this situation has modified key aspects that citizens face to obtain happiness or even displaced preferences towards cities with lower population density. This has been a limitation at the time of the analysis of this research with data from 2015; however, similar data, but with Spanish cities, have already been published by the authors of this manuscript [94].

Author Contributions

Conceptualisation, N.H.-A. and V.-R.L.-R.; methodology, N.H.-A. and J.L.A.-N.; software, N.H.-A.; validation, N.H.-A. and J.L.A.-N.; formal analysis, V.-R.L.-R.; investigation, N.H.-A., V.-R.L.-R., J.L.A.-N. and D.N.-P.; resources, D.N.-P.; data curation, J.L.A.-N. and V.-R.L.-R.; writing—original draft preparation, N.H.-A., V.-R.L.-R. and D.N.-P.; writing—review and editing, V.-R.L.-R. and D.N.-P.; visualisation, J.L.A.-N. and D.N.-P.; supervision, J.L.A.-N. and D.N.-P.; project administration, N.H.-A., V.-R.L.-R., J.L.A.-N. and D.N.-P.; funding acquisition, N.H.-A., V.-R.L.-R., J.L.A.-N. and D.N.-P. All authors have read and agreed to the published version of the manuscript.

Funding

This research was funded by the UNIVERSIDAD DE CASTILLA-LA MANCHA, grant number 2020-GRIN-28711 and the APC was funded by 2021-GRIN-31005.

Data Availability Statement

Data is available at: Flash Eurobarometer 419 (Quality of Life in European Cities 2015). TNS Political & Social (producer). GESIS Data Archive, Cologne. ZA6641 Data file Version 1.0.0, (Internet). (2016).

Acknowledgments

This research has been supported by the Intellectual Capital Research Group at the University of Castilla-La Mancha and the Vice Chancellor for Research and Scientific Politic.

Conflicts of Interest

The authors declare no conflict of interest.

Appendix A

CountryCityFrecuency
AT—AustriaAT1-Graz149
AT2-Wien176
BE—BelgiumBE1-Antwerpen212
BE2-Brussel160
BE3-Liege167
BG—BulgariaBG1-Burgas132
BG2-Sofia133
HR—CroatiaHR1-Zagreb160
CY—Cyprus (Republic)CY1-Lefkosia108
CZ1-Ostrava161
CZ2-Praha191
DE-W—Germany—WestDE1-Berlin145
DE2-Dortmund100
DE3-Essen90
DE7-Rostock66
DE4-Hamburg136
DE5-Leipzig89
DE6-Munchen119
DK—DenmarkDK1-Aalborg90
DK2-Kobenhavn118
EE—EstoniaEE1-Tallinn71
ES—SpainES1-Barcelona143
ES2-Madrid144
ES3-Malaga145
ES4-Oviedo140
FI—FinlandFI1-Helsinki152
FI2-Oulu158
FR—FranceFR1-Bordeaux162
FR2-Lille148
FR3-Marseille135
FR4-Paris186
FR5-Rennes171
FR6-Strasbourg175
GR—GreeceGR1-Athinia138
GR2-Irakleio137
HU—HungaryHU1-Budapest105
HU2-Miskolc94
IE—IrelandIE1-Dublin177
IT—ItalyIT1-Bologna132
IT2-Napoli143
IT3-Palermo118
IT4-Roma123
IT5-Torino111
IT6-Verona118
LT—LithuaniaLT1-Vilnius130
LU—LuxembourgLU1-Luxembourg180
LV—LatviaLV1-Riga193
MT—MaltaMT1-Valletta49
NL—The NetherlandsNL1-Amsterdam151
NL2-Groningen134
NL3-Rotterdam160
PL—PolandPL1-Bialystok158
PL2-Gdansk145
PL3-Krakow144
PL4-Warszawa157
PT—PortugalPT1-Braga143
PT2-Lisboa160
RO—RomaniaRO1-Bucuresti132
RO2-Cluj-Napoc166
RO3-Piatra Nea120
SE—SwedenSE1-Malmo127
SE2-Stockholm148
SI—SloveniaSI1-Ljubljana78
SK—SlovakiaSK1-Bratislava145
SK2-Kosice118
GB—United KingdomGB1-Belfast147
GB2-Cardiff145
GB3-Glasgow122
GB4-London158
GB5-Manchester122
GB6-Newcastle139
Total 9799

References

  1. Lu, H.; Tong, P.; Zhu, R. Longitudinal evidence on social trust and happiness in China: Causal effects and mechanisms. J. Happiness Stud. 2020, 21, 1841–1858. [Google Scholar] [CrossRef]
  2. Huang, J. Income inequality, distributive justice beliefs, and happiness in China: Evidence from a nationwide survey. Soc. Indic. Res. 2019, 142, 83–105. [Google Scholar] [CrossRef]
  3. Simona-Moussa, J. The subjective well-being of those vulnerable to poverty in Switzerland. J. Happiness Stud. 2020, 21, 1561–1580. [Google Scholar] [CrossRef]
  4. Khan, R.A.; Hussain, S. Book Review: The Quality of Life and Policy Issues among the Middle East and North African Countries. Appl. Res. Qual. Life 2020, 15, 931–933. [Google Scholar] [CrossRef]
  5. Yang, J.; Liu, K.; Zhang, Y. Happiness inequality in China. J. Happiness Stud. 2019, 20, 2747–2771. [Google Scholar] [CrossRef] [Green Version]
  6. Ballas, D. What makes a “happy city”? Cities 2013, 32, S39–S50. [Google Scholar] [CrossRef] [Green Version]
  7. Diener, E.; Emmons, R.A.; Larsen, R.J.; Griffin, S. The satisfaction with life scale. J. Personal. Assess. 1985, 49, 71–75. [Google Scholar] [CrossRef]
  8. Suh, E.; Diener, E.; Oishi, S.; Triandis, H.C. The shifting basis of life satisfaction judgments across cultures: Emotions versus norms. J. Personal. Soc. Psychol. 1998, 74, 482. [Google Scholar] [CrossRef]
  9. Buss, D.M. The evolution of happiness. Am. Psychol. 2000, 55, 15. [Google Scholar] [CrossRef]
  10. Diener, E. Subjective well-being: The science of happiness and a proposal for a national index. Am. Psychol. 2000, 55, 34. [Google Scholar] [CrossRef]
  11. Strack, F.; Argyle, M.; Schwarz, N. Subjective Well-Being: An Interdisciplinary Perspective; Julius-Maximilians-Universität Würzburg: Würzburg, Germany, 2007. [Google Scholar]
  12. Moghnie, L.; Kazarian, S.S. Subjective happiness of Lebanese college youth in Lebanon: Factorial structure and invariance of the Arabic Subjective Happiness Scale. Soc. Indic. Res. 2012, 109, 203–210. [Google Scholar] [CrossRef]
  13. Wang, S.Y.; Wong, Y.J.; Yeh, K.H.; Wang, L. What makes a meaningful life? Examining the effects of interpersonal harmony, dialectical coping, and nonattachment. Asian J. Soc. Psychol. 2018, 21, 198–204. [Google Scholar] [CrossRef]
  14. Węziak-Białowolska, D. Quality of life in cities–Empirical evidence in comparative European perspective. Cities 2016, 58, 87–96. [Google Scholar] [CrossRef]
  15. Florida, R.; Mellander, C.; Rentfrow, P.J. The happiness of cities. Reg. Stud. 2013, 47, 613–627. [Google Scholar] [CrossRef]
  16. Zhang, Y.; Wang, P. The Relationship between the Degree of Urban Development and Human Happiness. In Proceedings of the 2nd International Conference on Social Science, Public Health and Education (SSPHE 2018), Sanya, China, 25–27 November 2018; pp. 399–402. [Google Scholar]
  17. Papachristou, I.A.; Rosas-Casals, M. Cities and quality of life. Quantitative modeling of the emergence of the happiness field in urban studies. Cities 2019, 88, 191–208. [Google Scholar] [CrossRef]
  18. Maricchiolo, F.; Mosca, O.; Lauriola, M.; Krys, K. The role of urbanization of place of living in the relation between individual features and happiness (El papel del desarrollo urbanístico del lugar de residencia en la relación entre las características individuales y la felicidad). Psyecology 2020, 11, 232–259. [Google Scholar] [CrossRef]
  19. Wahl, H.-W.; Iwarsson, S.; Oswald, F. Aging well and the environment: Toward an integrative model and research agenda for the future. Gerontologist 2012, 52, 306–316. [Google Scholar] [CrossRef]
  20. Yin, C.; Shao, C.; Dong, C.; Wang, X. Happiness in urbanizing China: The role of commuting and multi-scale built environment across urban regions. Transp. Res. Part D Transp. Environ. 2019, 74, 306–317. [Google Scholar] [CrossRef]
  21. European Commission. Flash Eurobarometer 419. In Quality of Life in European Cities 2015; ZA6641 Data file Version 1.0.0; European Commission: Brussels, Belgium, 2016. [Google Scholar]
  22. Sarstedt, M.; Ringle, C.M.; Cheah, J.-H.; Ting, H.; Moisescu, O.I.; Radomir, L. Structural model robustness checks in PLS-SEM. Tour. Econ. 2020, 26, 531–554. [Google Scholar] [CrossRef]
  23. Li, X.; Du, J.; Long, H. Mechanism for green development behavior and performance of industrial enterprises (GDBP-IE) using partial least squares structural equation modeling (PLS-SEM). Int. J. Environ. Res. Public Health 2020, 17, 8450. [Google Scholar] [CrossRef]
  24. Ali, F.; Rasoolimanesh, S.M.; Sarstedt, M.; Ringle, C.M.; Ryu, K. An assessment of the use of partial least squares structural equation modeling (PLS-SEM) in hospitality research. Int. J. Contemp. Hosp. Manag. 2018, 38, 514–538. [Google Scholar] [CrossRef] [Green Version]
  25. Veenhoven, R. Inequality Of Happiness in Nations. J. Happiness Stud. 2005, 6, 351–355. [Google Scholar] [CrossRef] [Green Version]
  26. Diener, E.; Seligman, M.E. Beyond money: Toward an economy of well-being. Psychol. Sci. Public Interest 2004, 5, 1–31. [Google Scholar] [CrossRef] [PubMed]
  27. Arechavala, N.S.; Espina, P.Z.; Trapero, B.P. The economic crisis and its effects on the quality of life in the European Union. Soc. Indic. Res. 2015, 120, 323–343. [Google Scholar] [CrossRef]
  28. Diener, E. The remarkable changes in the science of subjective well-being. Perspect. Psychol. Sci. 2013, 8, 663–666. [Google Scholar] [CrossRef]
  29. Diener, E.; Inglehart, R.; Tay, L. Theory and validity of life satisfaction scales. Soc. Indic. Res. 2013, 112, 497–527. [Google Scholar] [CrossRef]
  30. Veenhoven, R. Informed pursuit of happiness: What we should know, do know and can get to know. J. Happiness Stud. 2015, 16, 1035–1071. [Google Scholar] [CrossRef]
  31. Bernini, C.; Emili, S.; Galli, F. Does urbanization matter in the expenditure—Happiness nexus? Pap. Reg. Sci. 2021, 100, 1403–1428. [Google Scholar] [CrossRef]
  32. Moeinaddini, M.; Asadi-Shekari, Z.; Aghaabbasi, M.; Saadi, I.; Shah, M.Z.; Cools, M. Proposing a new score to measure personal happiness by identifying the contributing factors. Measurement 2020, 151, 107115. [Google Scholar] [CrossRef]
  33. Cordero, J.M.; Salinas-Jiménez, J.; Salinas-Jiménez, M.M. Exploring factors affecting the level of happiness across countries: A conditional robust nonparametric frontier analysis. Eur. J. Oper. Res. 2017, 256, 663–672. [Google Scholar] [CrossRef]
  34. Štreimikienė, D.; Barakauskaitė-Jakubauskienė, N. Sustainable development and quality of life in Lithuania compared to other countries. Technol. Econ. Dev. Econ. 2012, 18, 588–607. [Google Scholar] [CrossRef]
  35. Iani, L.; Lauriola, M.; Layous, K.; Sirigatti, S. Happiness in Italy: Translation, factorial structure and norming of the subjective happiness scale in a large community sample. Soc. Indic. Res. 2014, 118, 953–967. [Google Scholar] [CrossRef]
  36. Zagorski, K.; Evans, M.D.; Kelley, J.; Piotrowska, K. Does national income inequality affect individuals’ quality of life in Europe? Inequality, happiness, finances, and health. Soc. Indic. Res. 2014, 117, 1089–1110. [Google Scholar] [CrossRef]
  37. Flynn, P.; Berry, D.; Heintz, T. Sustainability and quality of life indicators: Toward the integration of economic, social and environmental measures. J. Soc. Health 2002, 1, 274–286. [Google Scholar]
  38. Nevado-Peña, D.; López-Ruiz, V.-R.; Alfaro-Navarro, J.-L. Improving quality of life perception with ICT use and technological capacity in Europe. Technol. Forecast. Soc. Chang. 2019, 148, 119734. [Google Scholar] [CrossRef]
  39. European Union. Quality of Life in Cities: Perception Survey in 79 European Cities; Flash Eurobarometer, No. 366; European Union: Brussels, Belgium, 2013. [Google Scholar]
  40. Senasu, K.; Singhapakdi, A. Quality-of-life determinants of happiness in Thailand: The moderating roles of mental and moral capacities. Appl. Res. Qual. Life 2018, 13, 59–87. [Google Scholar] [CrossRef]
  41. Li, J. Why economic growth did not translate into increased happiness: Preliminary results of a multilevel modeling of happiness in China. Soc. Indic. Res. 2016, 128, 241–263. [Google Scholar] [CrossRef]
  42. Bernini, C.; Tampieri, A. Happiness in Italian cities. Reg. Stud. 2019, 53, 1614–1624. [Google Scholar] [CrossRef]
  43. Clark, A.E.; Frijters, P.; Shields, M.A. Relative income, happiness, and utility: An explanation for the Easterlin paradox and other puzzles. J. Econ. Lit. 2008, 46, 95–144. [Google Scholar] [CrossRef] [Green Version]
  44. Eren, K.A.; Aşıcı, A.A. The determinants of happiness in Turkey: Evidence from city-level data. J. Happiness Stud. 2017, 18, 647–669. [Google Scholar] [CrossRef]
  45. Dang, Y.; Chen, L.; Zhang, W.; Zheng, D.; Zhan, D. How does growing city size affect residents’ happiness in urban China? A case study of the Bohai rim area. Habitat Int. 2020, 97, 102120. [Google Scholar] [CrossRef]
  46. Kollamparambil, U. Happiness, happiness inequality and income dynamics in South Africa. J. Happiness Stud. 2020, 21, 201–222. [Google Scholar] [CrossRef]
  47. Lim, H.-E.; Shaw, D.; Liao, P.-S.; Duan, H. The effects of income on happiness in East and South Asia: Societal values matter? J. Happiness Stud. 2020, 21, 391–415. [Google Scholar] [CrossRef]
  48. Delken, E. Happiness in shrinking cities in Germany. J. Happiness Stud. 2008, 9, 213–218. [Google Scholar] [CrossRef] [Green Version]
  49. Amado, C.A.F.; Barreira, A.P.; Santos, S.P.; Guimarães, M.H. Comparing the quality of life of cities that gained and lost population: An assessment with DEA and the Malmquist index. Pap. Reg. Sci. 2019, 98, 2075–2097. [Google Scholar] [CrossRef]
  50. Lenzi, C.; Perucca, G. Are urbanized areas source of life satisfaction? Evidence from EU regions. Pap. Reg. Sci. 2018, 97, S105–S122. [Google Scholar] [CrossRef]
  51. Zhao, P. Too complex to be managed? New trends in peri-urbanisation and its planning in Beijing. Cities 2013, 30, 68–76. [Google Scholar] [CrossRef]
  52. Clark, W.A.; Yi, D.; Huang, Y. Subjective well-being in China’s changing society. Proc. Natl. Acad. Sci. USA 2019, 116, 16799–16804. [Google Scholar] [CrossRef] [Green Version]
  53. Li, C.-L. Quality of life: The perspective of urban park recreation in three Asian cities. J. Outdoor Recreat. Tour. 2020, 29, 100260. [Google Scholar] [CrossRef]
  54. Okulicz-Kozaryn, A.; Mazelis, J.M. Urbanism and happiness: A test of Wirth’s theory of urban life. Urban Studies 2018, 55, 349–364. [Google Scholar] [CrossRef] [Green Version]
  55. Smith, T.; Nelischer, M.; Perkins, N. Quality of an urban community: A framework for understanding the relationship between quality and physical form. Landsc. Urban Plan. 1997, 39, 229–241. [Google Scholar] [CrossRef]
  56. Wey, W.-M.; Huang, J.-Y. Urban sustainable transportation planning strategies for livable City’s quality of life. Habitat Int. 2018, 82, 9–27. [Google Scholar] [CrossRef]
  57. Mouratidis, K. Compact city, urban sprawl, and subjective well-being. Cities 2019, 92, 261–272. [Google Scholar] [CrossRef]
  58. Redmond, L.S.; Mokhtarian, P.L. The positive utility of the commute: Modeling ideal commute time and relative desired commute amount. Transportation 2001, 28, 179–205. [Google Scholar] [CrossRef]
  59. Sandow, E.; Westin, K. The persevering commuter–Duration of long-distance commuting. Transp. Res. Part A Policy Pract. 2010, 44, 433–445. [Google Scholar] [CrossRef]
  60. Duarte, A.; Garcia, C.; Giannarakis, G.; Limão, S.; Polydoropoulou, A.; Litinas, N. New approaches in transportation planning: Happiness and transport economics. NETNOMICS Econ. Res. Electron. Netw. 2010, 11, 5–32. [Google Scholar] [CrossRef] [Green Version]
  61. Abou-Zeid, M.; Ben-Akiva, M. The effect of social comparisons on commute well-being. Transp. Res. Part A Policy Pract. 2011, 45, 345–361. [Google Scholar] [CrossRef]
  62. Veenhoven, R. The four qualities of life. J. Happiness Stud. 2000, 1, 1–39. [Google Scholar] [CrossRef]
  63. Janjani, P. The relationship between social security and life style with life quality and happiness of the women in Kermanshah. J. Clin. Res. Paramed. Sci. 2015, 3, e82127. [Google Scholar]
  64. MacKerron, G.; Mourato, S. Happiness is greater in natural environments. Glob. Environ. Chang. 2013, 23, 992–1000. [Google Scholar] [CrossRef] [Green Version]
  65. Day, R. Place and the experience of air quality. Health Place 2007, 13, 249–260. [Google Scholar] [CrossRef]
  66. Bonaiuto, M.; Fornara, F.; Ariccio, S.; Cancellieri, U.G.; Rahimi, L. Perceived residential environment quality indicators (PREQIs) relevance for UN-HABITAT city prosperity index (CPI). Habitat Int. 2015, 45, 53–63. [Google Scholar] [CrossRef]
  67. Ramírez-Orellana, A.; del Carmen Valls Martínez, M.; Grasso, M.S. Using Higher-Order Constructs to Estimate Health-Disease Status: The Effect of Health System Performance and Sustainability. Mathematics 2021, 9, 1228. [Google Scholar] [CrossRef]
  68. Dash, G.; Paul, J. CB-SEM vs PLS-SEM methods for research in social sciences and technology forecasting. Technol. Forecast. Soc. Chang. 2021, 173, 121092. [Google Scholar] [CrossRef]
  69. Wong, K.K.-K. Partial least squares structural equation modeling (PLS-SEM) techniques using SmartPLS. Mark. Bull. 2013, 24, 1–32. [Google Scholar]
  70. Cronbach, L.J. Coefficient alpha and the internal structure of tests. Psychometrika 1951, 16, 297–334. [Google Scholar] [CrossRef] [Green Version]
  71. Jarvis, C.B.; MacKenzie, S.B.; Podsakoff, P.M. A critical review of construct indicators and measurement model misspecification in marketing and consumer research. J. Consum. Res. 2003, 30, 199–218. [Google Scholar] [CrossRef]
  72. Sarstedt, M.; Hair, J.F.; Ringle, C.M.; Thiele, K.O.; Gudergan, S.P. Estimation issues with PLS and CBSEM: Where the bias lies! J. Bus. Res. 2016, 69, 3998–4010. [Google Scholar] [CrossRef] [Green Version]
  73. Hair, J.F., Jr.; Howard, M.C.; Nitzl, C. Assessing measurement model quality in PLS-SEM using confirmatory composite analysis. J. Bus. Res. 2020, 109, 101–110. [Google Scholar] [CrossRef]
  74. Park, S.; Yoon, H.; Koo, C.; Lee, W.S. Role of the Leisure Attributes of Shared Bicycles in Promoting Leisure Benefits and Quality of Life. Sustainability 2021, 13, 739. [Google Scholar] [CrossRef]
  75. Kaya, B.; Abubakar, A.M.; Behravesh, E.; Yildiz, H.; Mert, I.S. Antecedents of innovative performance: Findings from PLS-SEM and fuzzy sets (fsQCA). J. Bus. Res. 2020, 114, 278–289. [Google Scholar] [CrossRef]
  76. Valls Martínez, M.D.C.; Martín-Cervantes, P.A.; Sánchez Pérez, A.M.; Martínez Victoria, M.D.C. Learning Mathematics of Financial Operations during the COVID-19 Era: An Assessment with Partial Least Squares Structural Equation Modeling. Mathematics 2021, 9, 2120. [Google Scholar] [CrossRef]
  77. Carmines, E.G.; Zeller, R.A. Reliability and Validity Assessment; Sage Publications: Thousand Oaks, CA, USA, 1979. [Google Scholar]
  78. Chin, W.W. Commentary: Issues and opinion on structural equation modeling. MIS Q. 1998, 22, vii–xvi. [Google Scholar]
  79. Fornell, C.; Larcker, D.F. Evaluating structural equation models with unobservable variables and measurement error. J. Mark. Res. 1981, 18, 39–50. [Google Scholar] [CrossRef]
  80. Dijkstra, T.K.; Henseler, J. Consistent partial least squares path modeling. MIS Q. 2015, 39, 297–316. [Google Scholar] [CrossRef]
  81. Barclay, D.; Higgins, C.; Thompson, R. The partial least squares approach to causal modeling: Personal computer adoption and use as illustration. Technol. Stud. 1995, 2, 285–309. [Google Scholar]
  82. Gold, A.H.; Malhotra, A.; Segars, A.H. Knowledge management: An organizational capabilities perspective. J. Manag. Inf. Syst. 2001, 18, 185–214. [Google Scholar] [CrossRef]
  83. Hair, J.F.; Ringle, C.M.; Sarstedt, M. PLS-SEM: Indeed a silver bullet. J. Mark. Theory Pract. 2011, 19, 139–152. [Google Scholar] [CrossRef]
  84. Wang, J.; Wang, Y.; Sun, C.; Chen, X. Does mandatory air quality information disclosure raise happiness? Evidence from China. Energy Econ. 2021, 94, 105094. [Google Scholar] [CrossRef]
  85. Sharma, H.; Aggarwal, A.G. Finding determinants of e-commerce success: A PLS-SEM approach. J. Adv. Manag. Res. 2019, 16, 453–471. [Google Scholar] [CrossRef]
  86. Falk, R.F.; Miller, N.B. A Primer for soft Modeling; University of Akron Press: Akron, OH, USA, 1992. [Google Scholar]
  87. Henseler, J.; Ringle, C.M.; Sarstedt, M. A new criterion for assessing discriminant validity in variance-based structural equation modeling. J. Acad. Mark. Sci. 2015, 43, 115–135. [Google Scholar] [CrossRef] [Green Version]
  88. Hayes, A.F.; Scharkow, M. The relative trustworthiness of inferential tests of the indirect effect in statistical mediation analysis: Does method really matter? Psychol. Sci. 2013, 24, 1918–1927. [Google Scholar] [CrossRef] [PubMed]
  89. Zhao, X.; Lynch Jr, J.G.; Chen, Q. Reconsidering Baron and Kenny: Myths and truths about mediation analysis. J. Consum. Res. 2010, 37, 197–206. [Google Scholar] [CrossRef]
  90. Nitzl, C.; Roldan, J.L.; Cepeda, G. Mediation analysis in partial least squares path modeling: Helping researchers discuss more sophisticated models. Ind. Manag. Data Syst. 2016, 116, 1849–1864. [Google Scholar] [CrossRef]
  91. Carrión, G.C.; Nitzl, C.; Roldán, J.L. Mediation analyses in partial least squares structural equation modeling: Guidelines and empirical examples. In Partial Least Squares Path Modeling; Springer: New York, NY, USA, 2017; pp. 173–195. [Google Scholar]
  92. MacKinnon, D.P.; Lockwood, C.M.; Hoffman, J.M.; West, S.G.; Sheets, V. A comparison of methods to test mediation and other intervening variable effects. Psychol. Methods 2002, 7, 83. [Google Scholar] [CrossRef]
  93. Preacher, K.J.; Hayes, A.F. SPSS and SAS procedures for estimating indirect effects in simple mediation models. Behav. Res. Methods Instrum. Comput. 2004, 36, 717–731. [Google Scholar] [CrossRef] [Green Version]
  94. López-Ruiz, V.-R.; Huete-Alcocer, N.; Alfaro-Navarro, J.-L.; Nevado-Peña, D. The relationship between happiness and quality of life: A model for Spanish society. PLoS ONE 2021, 16, e0259528. [Google Scholar] [CrossRef]
Figure 1. Conceptual model.
Mathematics 10 00367 g001
Figure 2. Estimated model. (Source: Own elaboration).
Mathematics 10 00367 g002
Figure 3. Mediation models. (Source: Own elaboration).
Mathematics 10 00367 g003
Table 1. Latent factors and items.
FactorItemDenominationKMOCronbach’s α
Quality of life
[5,15,16,47]
q2_2It is easy to find a job in…0.7320.708
q3_1Your personal job situation
q3_2The financial situation of your household
q3_3The life you lead
Urban Planning
[17,20,53,60]
q1_1Public transport, for example the bus, tram or metro0.8320.724
q1_2Health care services, doctors and hospitals
q1_3Sports facilities such as sport fields and indoor sport halls
q1_4Cultural facilities such as concert halls, theatres, museums and libraries
q1_6Public spaces such as markets, squares, pedestrian areas
q1_8Availability of retail shops
q1_9Schools and other educational facilities
Safety
[16,17,63]
q2_1I am satisfied to live in…0.8060.780
q2_3The presence of foreigners is good for…
q2_4Foreigners who live in… are well integrated
q2_7I feel safe in…
q2_8I feel safe in my neighborhood
q2_10Generally speaking, most people in… can be trusted
q2_11Generally speaking, most people in my neighborhood can be trusted
Environment
[19,52,64,65]
q1_5The state of the streets and buildings in your neighborhood0.7750.730
q1_7Green spaces such as parks and gardens
q1_10The quality of the air
q1_11The noise level
q1_12Cleanliness
Table 2. Composite reliability and Converging validity.
FactorCronbach’s AlphaComposite ReliabilityAverage Variance Extracted (AVE)Rho_A
Quality of life0.7010.8170.5330.730
Happiness1.0001.0001.0001.000
Environment0.7300.8220.4810.731
Urban Planning0.7250.8090.3790.732
Safety0.7810.8390.4350.811
Table 3. Discriminating validity: Fornell–Larcker Criterion.
Quality of LifeHappinessEnvironmentPlanningSafety
Quality of life0.7300.4880.5220.5860.542
Happiness0.4191.0000.5030.4250.528
Environment0.3770.4320.6930.7710.679
Urban Planning0.4200.3650.5680.6160.569
Safety0.4200.4990.5330.4470.660
Note: The data underlined in the diagonal is the square root of the AVE. The data at the bottom of the diagonal are the correlations between the constructs, and the data at the top of the diagonal are the HTMT values.
Table 4. Structural analysis of the hypothesis contrast.
HypothesisStructural RelationshipPath (β) Standardised* t Value
Bootstrap
Contrast
H1Quality of life -> Happiness0.21019.289 *ACCEPTED
H2Urban Planning -> Happiness0.0484.330 *ACCEPTED
H3Safety -> Happiness0.30126.004 *ACCEPTED
H4Environment -> Happiness0.16414.537 *ACCEPTED
Note: * p < 0.001.
Table 5. Mediating effect of quality of life on happiness.
Simple Mediation* Direct Effects* Indirect Effects (Confidence Interval)ResultsVAF
H2MUrban Planning -> Quality of Life -> Happiness0.2290.13566
(0.1251968–0.1459413)
complementary partial mediation37.20%
H3MSafety -> Quality of Life -> Happiness0.3910.10752
(0.0977916–0.1175247)
complementary partial mediation21.57%
H4MEnvironment -> Quality of Life -> Happiness0.3190.1128
(0.1038034–0.1227278)
complementary partial mediation26.12%
Note: n = 10.000 submuestras: * p < 0.001.
Publisher’s Note: MDPI stays neutral with regard to jurisdictional claims in published maps and institutional affiliations.

