Abstract
This research considers the problem of a price-discriminating monopolist aiming at choosing output and investing in product differentiation to foster consumers perceiving products as being heterogeneous in different market segments. It then introduces bounded rationality and concentrates on the dynamic analysis showing the existence of several dynamic phenomena caused by the interaction between endogenous product differentiation and gradient dynamics. Though product differentiation can generally increase market power and profits, in this context it can generate a lack of coordination between the managers working in each segment.
JEL Classification:
C62; D43; L13
1. Introduction
This article takes a dynamic view of a price-discriminating monopolist that invests in differentiation effort to induce consumers to perceive products as horizontally and vertically differentiated, i.e., the price-discriminating monopolistic industry is producing and selling in two segments horizontally differentiated goods of different qualities [1,2,3,4], and has bounded rational expectations (gradient dynamics). The main innovation relies on considering and comparing different market configurations, namely a monopolistic framework with third-degree price discrimination—occurring when the monopolist charges a different price to different consumer groups.
Though the literature about nonlinear dynamics in markets with imperfect competition is vast, dealing with different aims and objectives—ranging from the pioneering works of [5,6,7] to some more recent works of [8,9,10], the contributions including product differentiation are rarer focusing, amongst others, on quantity-setting firms with heterogeneous (bounded rational or naïve) expectations with linear [11] or nonlinear [12] market demand.
Since the pioneering work of [1], horizontal product differentiation has proven to be a relevant ingredient to change several paradigms in the traditional game-theoretic approach applied to strategic competitive markets in models belonging to strategic competitive markets. In addition, since [13], the literature has extensively focused on the study of the emergence of complex dynamics even in the absence of interactions (nonlinear monopoly) due to the existence of bounded rationality [14,15,16,17,18,19,20]. In this regard, there is also growing attention given in the theoretical and empirical branches of the literature to defining possible heuristics for dealing with decision-making problems under uncertainty ([21,22,23] and references therein).
The present article aims at contributing to the literature on the nonlinear monopoly by providing the mathematical properties of the corresponding dynamic systems by also pinpointing the role of endogenous product differentiation in a third-degree price-discriminating monopolistic market structure. In doing so, it concentrates on the role of the degree of product differentiation as the main parameter to be used for comparison purposes with specific regard to the stability outcomes. There exist some important results depending on the extent of product substitutability. Indeed, the interaction between (endogenous) product differentiation and gradient dynamic is responsible for the existence of several dynamic outcomes that cannot be observed when products are homogeneous.
Though product differentiation is one of the key features of monopolistic competition (several firms produce goods which are close substitutes of one another, and the downward-sloping demand faced by each competing monopolist is more elastic than the demand curve faced by a monopolist), and price discrimination is one of the key features of a “pure” monopolistic market, they both represent useful approaches to marketing used when some of the main pillars of perfect competition are violated. Under horizontal differentiation, products are perceived as heterogeneous based on consumers’ tastes (individual preferences), but consumers are not able to distinguish products based on their relative quality. In that case, there are no differences between firms’ marginal costs. Differently, vertical differentiation allows consumers to distinguish between products of higher or lower quality, which are produced by firms with different marginal costs. Unlike product differentiation, price discrimination allows a monopolistic firm to charge different prices for the same goods to different consumers.
Our work aims at gathering (third-degree) price discrimination and (horizontal and vertical) product differentiation in the same (dynamic) monopolistic setting to capture some aspects of pricing behaviour when a firm has monopoly power. Indeed, the holding monopolist can invest in differentiation effort to increase the degree of product substitutability, and then forces a customer to increase their own marginal willingness to pay. However, the increase in profits is followed by an increase in dynamic complexity, which in turn makes coordination between managers working in different segments more difficult.
The work is also part of an in-depth theoretical research branch focused on the study of the evolution of decision-making processes within firms seeking to identify and disentangle their main characteristics by using the tools of dynamic systems. Coordination actions within firms are necessary to achieve better results. However, increasing the firm’s effort towards product differentiation raises some concerns as it increases the degree of complexity of the system, therefore generating coordination problems for managers in the long term.
The rest of the article is organised as follows. Section 2 presents the static monopolistic setting with third-degree price discrimination and endogenous differentiation effort by pinpointing the main similarities and differences with a quantity-setting (Cournot) duopoly. Section 3 concentrates on market dynamics by assuming bounded rationality (gradient dynamics). Conclusions are given in Section 4.
2. The Static Problem
Consider a monopolistic industry in which the monopolist faces the perspective of charging price discrimination. As is known, there exist three types of price discrimination: first-degree or perfect price discrimination, which is often referred to as personalised pricing;/second-degree price discrimination (product versioning or menu pricing);/third-degree price discrimination (group pricing). In the case of personalised pricing, the firm can sell the product to each customer at a different price allowing it to maximise the price that each customer is willing to pay. In second-degree price discrimination, price varies according to the quantity demanded by the customers. Finally, the third-degree price discrimination allows a firm with market power to charge a different price to different consumer groups, but each consumer (belonging to the same group) pays the same price for each unit of the good. This kind of price discrimination often arises when firms sell differentiated products and it is then related to the consumers’ willingness and ability to pay for a good or service. The present work concentrates on third-degree price discrimination by assuming that the monopolist can identify two market segments, namely segment 1 and segment 2, and charge a different price for each of them.
Following [1], products are differentiated and the normalised linear (inverse) demands, following quadratic preferences, for the product of variety 1 (related to segment 1) and for the product of variety 2 (related to segment 2) are, respectively, given by
and
where (resp. ) denotes the price of product 1 (resp. 2) and represents the marginal willingness to pay of consumers towards products of segment 1 (resp. 2), and are the quantities of the product of varieties 1 and 2 produced by the monopolist, and is the degree of product differentiation (substitutability). When , goods are perceived as totally differentiated, when goods are homogeneous. Parameter d resembles and summarises in a simplified way the cases of horizontal (quantity) and vertical (quality) differentiation. This implies that the price-discriminating monopolistic industry is producing and selling in two segments horizontally differentiated goods of different qualities. Market demands in (1) and (2) follow the usual specification of the representative consumer’s utility function as in the works of [1,2,3,4,24].
Unlike almost all the related industrial economics literature and in line with [25], we assume that product differentiation is endogenous. This in turn implies that the monopolist may seek to foster consumers’ tastes towards product differentiation in both segments through ad hoc investments to increase profits. The total cost of production and the cost of the product differentiation effort of the monopolist (which is a proxy of advertising investments in segmented markets) are, respectively, given by the functions and , where is the total supply, is the marginal cost of output production (following a technology with constant returns to scale) and is a parameter weighting the efficiency of the differentiation technology scaling up/down differentiation investment total costs, eventually representing an exogenous index of technological progress. In this sense, measures the appearance of new, cost-effective technology, weighting the degree to which the available technology for product differentiation affects investment decisions and a firm’s profits. A reduction in can be interpreted as a technological advance so that investing to foster product differentiation becomes cheaper (i.e., the efficiency of differentiation investment increases). We also recall that the lower d, the higher product differentiation (substitutability). The expression representing the cost of product differentiation effort reveals diminishing returns to scale in the differentiation technology. This effort is exerted by the monopolist to achieve the benefit of letting the product be perceived as highly differentiated by the customers belonging to both segments. Given the expressions of market demands for segment 1 and segment 2, this benefit enters with constant returns to scale by eventually increasing the price customers are willing to pay.
Profits can then be written as , where and are given by (1) and (2). The monopolist aims at maximising for the control variables , and d taking the expressions of and into account and knowing that must hold. Formally, the problem is equivalent to
where
First, we pinpoint that the objective function is continuous on D but not differentiable along the boundaries and . Then, we separate the study into sub-cases by solving the optimisation problem in (3) on each region , and eventually consider the solution of the problem on . For analytical and expository purposes we divided the region D into partially overlapping subsets.
Focusing on the problem defined on , we note that is a closed and bounded set. Then, from the extreme value theorem it follows that a solution to the maximisation problem exists. Nonetheless, a detailed study has to be performed because the inspection of the Hessian matrix of shows that the objective function is not concave on . By considering the subsets and of , we have that the objective function takes the optimum at
and
respectively. In these cases, profits are given by
We now introduce the Lagrangian function
As the candidates on the sets and have already been identified from the previous study, we address the necessary optimality conditions assuming the constraints on prices are not binding (, ). The KKT necessary conditions for optimality read as follows
Some solutions of system (7) can be found as the solutions of the following system that also verify the constraints on the control variables
Regarding the solutions of the first equation in (8), we consider the behaviour of the following function
We have that and so at least one root exists and is negative. For two other real solutions to exist, because f has a minimum in and we pinpoint must hold, and in this case the solutions are positive. By applying the Cardano’s formula and considering the constraint we obtain the following expressions of the roots:
Simple considerations suggest that and , with . Direct computation shows that the value of d associated to lies in the interval , while the one associated to lies in the interval if
From the study of (7), we find that the only other candidate is represented by the point
The solution to the optimisation problem can be found by evaluating the objective function at the candidates. From a direct comparison, we find that the optimal solution is represented by (1) and for , and (2) for .
Regarding the other regions, we note that on set the price of product 1 is 0. Therefore, the optimal solution on this set is
Likewise, the solution on is
These points have already been considered in . So, the solutions for identified so far also solve the problem in (3).
3. The Dynamic Model
The solution of the static model is based on the assumption that the monopolist knows the demands for both segments. Then, the firm can optimally choose the resources that should be employed to invest in product differentiation as well as the amount of output for both segments. In this section, we will weaken this hypothesis. Specifically, we will consider that the decision process is not solved in a completely centralised form, but there exists a holding company that chooses optimally the level of product differentiation and the quantities and are chosen in a decentralised way by two managers. Each manager is in charge of trying to obtain the best results in terms of the firm’s profits exclusively on their market without any coordination between the other manager. In addition, both managers will consider how their decisions will affect the level of d chosen by the holding. In other words, each manager takes the level of d as given (see [26] for an analogous mechanism applied to an oligopolistic market in which firms are involved in an advertising investment decision problem).
It is important to pinpoint that, in the present model, we do not take into account problems related to the possibility that a manager can be incentivised through objectives other than profit maximisation. On the issue related to managers’ incentives, one can refer to (1) the pioneering works of [27,28,29] based on a static duopolistic context, and (2) the work of [9] in a dynamic framework, in which the two managers do not coordinate. The lack of knowledge about production decisions of the other manager makes this stage of decision-making on the quantity to be produced similar to a duopolistic context where a component of the demand (the quantity produced by the rival) is generally not known.
Therefore, we assume that in a context of uncertainty the decisions about the quantity to be produced at time follow a naïve rule driven by the sign of the marginal profit at t. As is usual in this literature, time is needed to complete the production process (one period in this discrete-time model). Therefore, at time t the manager must choose the quantity to be produced at time . If the marginal profit is positive (resp. negative), the manager increases (resp. decreases) the quantity produced at time [6]. Definitively, production in segment i at time is given by:
where is the profit obtained in segment i, with and being a parameter measuring the speed at which the decisions on at time change (given ). Substituting out the expression of that can be obtained by the static problem, i.e., , and using the shift operator to simplify notation and refer to the unit-time advancement of , i.e., the state of at time , we obtain the following map:
whose fixed points are
and possibly other fixed points with positive coordinates which will be detailed later.
The naïve mechanism adopted to build on map (16) does not help avoidance of the non-negativity of the trajectories, thus implying the existence of economically non-feasible paths. To fill this gap, we re-write the map in the following way (see [30]):
Figure 1 shows (with different colours) the fate of the trajectories according to the region of the plane where they start. Specifically, trajectories starting from the blue region remain in this area for each iteration and, depending on the initial condition of the system, they converge to one of the attractors of the map; differently, trajectories starting in the yellow or red regions lead to the closure of one (and only one) of the two markets ( from a given t onwards); finally, the dark-grey region describes the initial conditions leading to the closure of both markets ( from a given t onwards). Though from an economic point of view this solution can be explained by the absence of coordination between the two managers, the scenario in which one of the markets will close is not robust as it would be enough for the manager operating in this segment choosing to produce a quantity () slightly larger than zero to let both segments remain open. From a mathematical point of view, this result is motivated by the fact that the attractors located on the axes are in general weak attractors in the Milnor sense (see [31]). For the value of k selected for Figure 1, the immediate basin of attraction of the attractors on the axes intersected by the positive orthant is the empty set. As the parameters vary, including k, it is possible to observe much more complex configurations of the basins. In this case, the mechanism of re-entry into the market in one of the two segments can give rise to complex phenomena, with trajectories involving a sequence of periods of activity/inactivity of one of the segments. This point has been explored in depth by [32], to which we refer to for details.
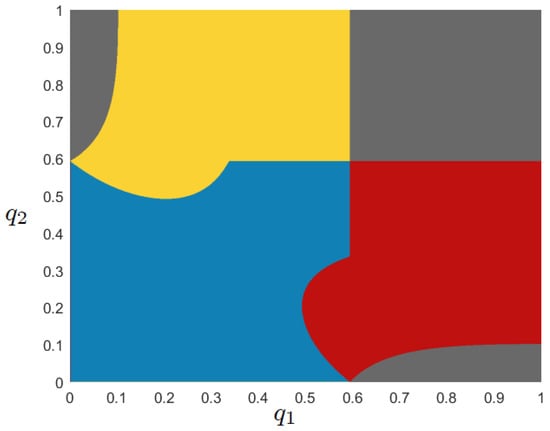
Figure 1.
The blue region bounds the set of initial conditions corresponding to which the related trajectories are characterised by strictly positive coordinates for each iterate. In the other regions, at least one of the two coordinates becomes zero after a certain time threshold. Parameter set: , and .
As we are considering the behaviour of a monopolist, albeit with limited knowledge, we prefer to explore an alternative hypothesis in which even in the presence of a negative marginal profit, the quantity produced at time is always strictly positive. From a mathematical point of view, the dynamics of the system become governed by the following map:
defined on the set
where is a parameter that will be properly set henceforth. Then, the only fixed points of the map are those with strictly positive coordinates.
Now, we first note that map T is symmetric. This means that the is invariant if variables and are swapped, that is where . Therefore, the diagonal is an invariant manifold so that a trajectory starting at lies on for all , namely for all . Synchronised trajectories are governed by restriction , where
By specifying the study of the existence of fixed points for map T to the case of the map , we have the following proposition:
Proposition 1.
Let . Map given in (21) admits the following fixed points:
If then is the unique fixed point of the map.
If then the map admits three fixed points , and .
If then is the unique fixed point of the map.
Figure 2 shows the emergence of the fixed points as varies. Differently, the number of fixed points does not depend on k.
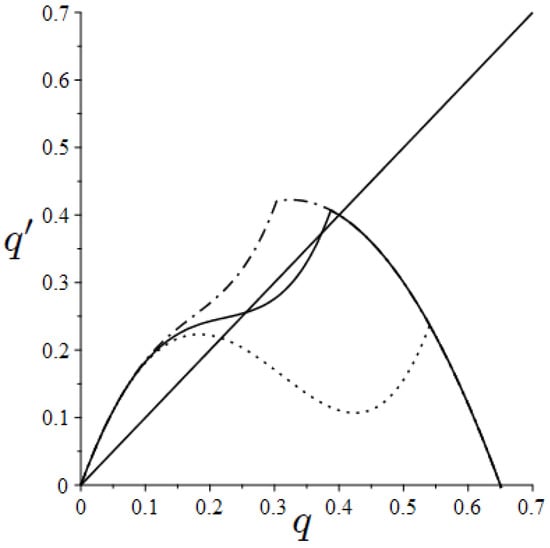
Figure 2.
Stationary points as varies. Parameter set: , and ; (dashdotted line), (solid line), (dotted line).
Regarding the stability properties of the fixed points of map , the next result follows:
Proposition 2.
Let us consider map . Fixed point is attracting for with . Fixed point , when it exists, is always unstable, whereas fixed point , when it exists, is stable if .
Throughout the rest of the article we consider cases in which the lower bound of the map, , does not play any role. In doing so, we will set a sufficiently low value of . By varying the main parameters of the model, map can generate several dynamic phenomena. We classify below some of the most interesting ones.
- Scenario 1. For , the unique fixed point of the map is . As k increases, the fixed point undergoes a flip bifurcation through which it loses its stability. By setting and , Figure 3A shows the role of the speed of adjustment k in generating dynamics converging to cycles of increasing period and eventually converging to a chaotic attractor. Figure 3B presents the cobweb diagram for when a chaotic attractor captures all the initial conditions of map .
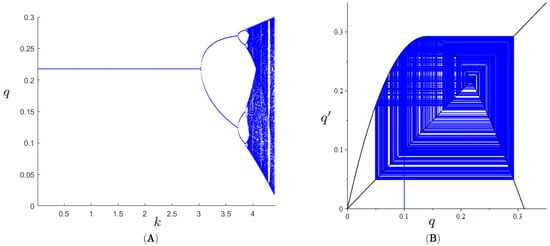
Figure 3.
Panel (A) Bifurcation diagram for k. Panel (B) Cobweb diagram for .
- Scenario 2. For , the unique fixed point of the map is . Like the previous case, the fixed point loses its stability through a flip bifurcation as k increases. The bifurcation diagram plotted in Figure 4 for , and shows a different route to chaos compared to the case discussed so far. Indeed, after the two-period stable cycle, the map shows a different behaviour through the emergence of a six-period stable cycle. This phenomenon is caused by the non-differentiability of the map.
- Scenario 3. For , the map is characterised by three fixed points where the intermediate one is always unstable for any value of k. Let us consider the following parameter set: and . For small values of k, there exist two attracting fixed points. Such a parametric configuration is not presented in any figure. An increase in k () is responsible for the birth of a chaotic attractor around the fixed point (Figure 5A), whereas the fixed point continues to be attracting. For , at the global maximum point of the map, , we have that . Then, after a possibly long transient, the dynamics of the map are captured by the unique attractor of the system (Figure 5B). When k increases further, it is possible to show that also the fixed point loses its stability through a flip bifurcation (not shown in the figure).
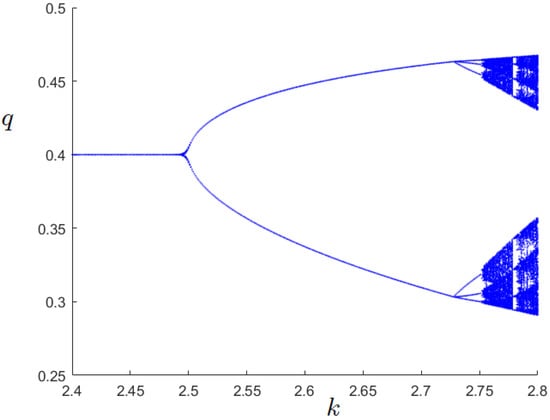
Figure 4.
Bifurcation diagram for k.
Going back to the study of map T, we begin by stating the following result.
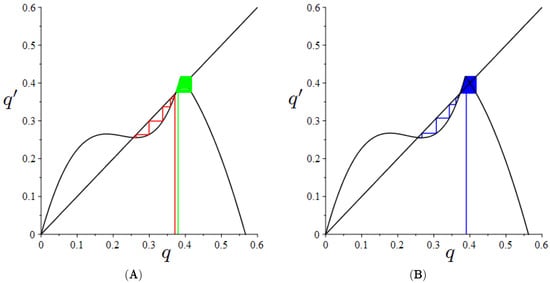
Figure 5.
Panel (A) Cobweb for . Panel (B) Cobweb for .
Proposition 3.
Let Map T given in (19) admits the following fixed points:
If then is the unique fixed point of the map.
If then the map admits three fixed points , and .
If then is the unique fixed point of the map.
From previous results, the fixed point is always unstable, whereas about the fixed point the following result holds.
Proposition 4.
Let and . Then, the fixed point of map T is locally asymptotically stable if . For , both eigenvalues of the Hessian matrix at are .
Due to the complexity of the expressions, we skip the analytical study of the stability of the fixed point .
In what follows, we extend the study of map to the two-dimensional case where the initial conditions are not necessarily located on the diagonal. Figure 6 shows, concerning Scenario 1, that the dynamics on the diagonal well summarise the dynamics of the two-dimensional system. In fact, in this case, we have that the dynamics are attracted by the attractor located on the diagonal. The dynamics of the system are chaotic but synchronised.
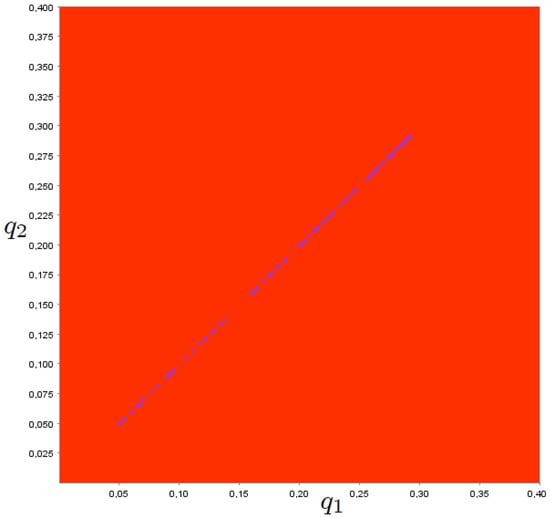
Figure 6.
Phase plane. Parameter set: .
Figure 7 shows, for values of k larger than , that the state plane is characterised by two attractors, one of which is located along the diagonal (six-period cycle) and the other one symmetrical to the diagonal (two-period cycle). Depending on initial conditions, the dynamics can therefore be captured by two different attractors. From an economic point of view, this is characterised by an equilibrium (fixed point) with perfectly differentiated goods (). Therefore, at the steady-state, the firm is a pure monopolist in each sector (i.e., there is no interaction between the two segments). However, the lack of coordination between the managers of segment 1 and segment 2 can generate behaviours that can lead the monopolist to reduce at least in some periods product differentiation (the dynamics on the diagonal: one should note the coordinates of the cycles with low levels of production of both goods). Otherwise, it is possible to observe dynamics characterised by periods in which production in one segment is small and production in the other segment is large in an alternating way (two-period cycle off the diagonal).
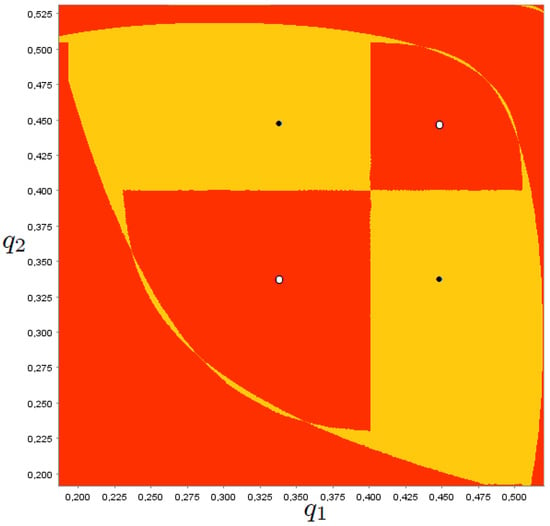
Figure 7.
Phase plane. Parameter set: and .
Finally, Figure 8A shows a phase plane in which there are two attractive fixed points: one characterised by low product differentiation (the equilibrium in the south-west direction), the other one characterised by complete differentiation, i.e., products are homogeneous (the equilibrium in the north-east direction). The low equilibrium profit dominates the other equilibrium for the firm. Nevertheless, the dynamics starting around the suboptimal point may be captured by this attractor. In this case, as k grows the high attractor located on the diagonal loses transverse attractiveness and the dynamics starting in that area of the phase plane are captured by attractors outside the diagonal (Figure 8B). Further increases in k allow the attractor to grow and then collide with the boundary of the basin of attraction causing eventually its disappearance. After this event, all trajectories are captured by the low fixed point with (Figure 8C). In this case, profits are those that would be realised in the centralised case in which the monopolist maximises joint profits by considering product differentiation .
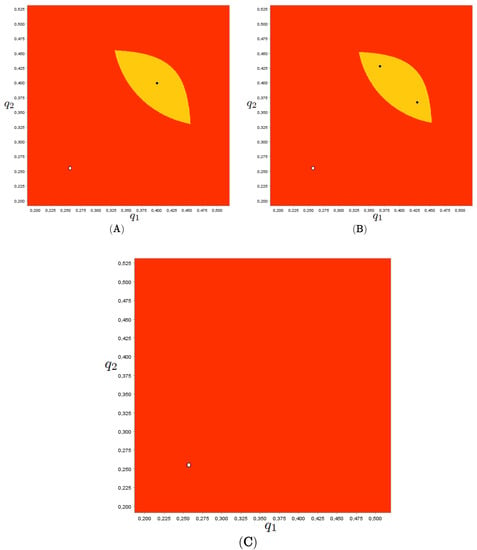
Figure 8.
Phase plane. Parameter set: . Panel (A): . Panel (B):. Panel (C): .
4. Conclusions
This work analysed a monopolistic market in which the monopolist charges third-degree price discrimination, invests in differentiation effort to endogenously induce customers to perceive products as heterogeneous, and then chooses the quantities to be produced and sell in segment 1 and segment 2. It aimed at resembling different features of different market structures, i.e., price discrimination—which is a main characteristic of a monopolistic industry—and product differentiation (horizontal and vertical)–which is a main characteristic of a competing monopolistic industry and/or an oligopolistic industry. Specifically, we considered a two-stage static setting in which, in the first stage, the holding monopolist chooses to foster product substitutability through ad hoc investments (to induce customers towards product substitutability) and, in the second stage, decides on the quantity to be sold in the two segments.
After having characterised the solutions to the static problem, the article concentrated on the analysis of whether results can be achieved when the decision-making system is partially decentralised. It then considered the possibility that decisions on the differentiation effort are taken by the monopolistic firm and production in each segment is delegated to a manager belonging to it. Under bounded rationality, results showed that monopolistic dynamics can have different fates converging towards different attractors characterised by different degrees of product differentiation and profits.
From a policy perspective, though (endogenous) product differentiation is a device that can be used together with price discrimination to increase profits, it may be responsible for lack of coordination between the managers working in each market segment. This can lead to differentiation and production decisions that change continuously and therefore do not stabilise towards the optimum found in the static setting.
More in general, this article aimed at offering a theoretical framework in which monopolistic dynamics can be conceptualised in a model capturing several features of industries that violate in some sense the paradigm of perfect competition. The model can naturally be extended to (1) a framework with monopolistic competition and/or (quantity-setting or price-setting) strategic interaction, and (2) R&D effort along the line of [33,34].
Author Contributions
Formal analysis, M.S.; Writing—original draft, L.G.; Writing—review and editing, A.C. All authors have contributed equally at all stages of research. All authors have read and agreed to the published version of the manuscript.
Funding
Luca Gori, PRA_2020_64, University of Pisa; Mauro Sodini VSB-TUO project SP2021/15 and the Science without borders 2.0 project, CZ.02.2.69/0.0/0.0/18 _053/0016985, Technical University of Ostrava.
Institutional Review Board Statement
Not applicable.
Informed Consent Statement
Not applicable.
Data Availability Statement
Not applicable.
Acknowledgments
The authors gratefully acknowledge four anonymous reviewers for their valuable comments on an earlier draft, allowing a substantial improvement in the quality of the article. Luca Gori and Mauro Sodini acknowledge financial support from the University of Pisa under the “PRA—Progetti di Ricerca di Ateneo” (Institutional Research Grants)—Project No. PRA_2020_64 “Infectious diseases, health and development: economic and legal effects”. Mauro Sodini also acknowledges the support by VSB-TUO project SP2021/15 and the Science without borders 2.0 project, CZ.02.2.69/0.0/0.0/18_053/0016985 within the Operational Programme Research, Development and Education. The usual disclaimer applies.
Conflicts of Interest
The authors declare that they have no conflict of interest.
References
- Singh, N.; Vives, X. Price and quantity competition in a differentiated duopoly. RAND J. Econ. 1984, 15, 546–554. [Google Scholar] [CrossRef]
- Sutton, J. One smart agent. RAND J. Econ. 1997, 28, 605–628. [Google Scholar] [CrossRef]
- Symeonidis, G. Price and nonprice competition with endogenous market structure. J. Econ. Manag. Strategy 2000, 9, 53–83. [Google Scholar] [CrossRef]
- Symeonidis, G. Comparing Cournot and Bertrand equilibria in a differentiated duopoly with product R&D. Int. J. Ind. Organ. 2002, 21, 39–55. [Google Scholar]
- Puu, T. Chaos in duopoly pricing. Chaos Solitons Fractals 1991, 1, 573–581. [Google Scholar] [CrossRef]
- Bischi, G.I.; Stefanini, L.; Gardini, L. Synchronization, intermittency and critical curves in duopoly games. Math. Comput. Simul. 1998, 44, 559–585. [Google Scholar] [CrossRef]
- Bischi, G.I.; Gallegati, M.; Naimzada, A. Symmetry-breaking bifurcations and representative firm in dynamic duopoly games. Ann. Oper. Res. 1999, 89, 253–272. [Google Scholar] [CrossRef]
- Cánovas, J.S.; Puu, T.; Ruíz, M. The Cournot-Theocharis problem reconsidered. Chaos Solitons Fractals 2008, 37, 1025–1039. [Google Scholar] [CrossRef][Green Version]
- Fanti, L.; Gori, L.; Sodini, M. Nonlinear dynamics in a Cournot duopoly with relative profit delegation. Chaos Solitons Fractals 2012, 45, 1469–1478. [Google Scholar] [CrossRef][Green Version]
- Bischi, G.I.; Lamantia, F.; Radi, D. An evolutionary Cournot model with limited market knowledge. J. Econ. Behav. Organ. 2015, 116, 219–238. [Google Scholar] [CrossRef]
- Fanti, L.; Gori, L. The dynamics of a differentiated duopoly with quantity competition. Econ. Model. 2012, 29, 421–427. [Google Scholar] [CrossRef]
- Agliari, A.; Naimzada, A.K.; Pecora, N. Nonlinear dynamics of a Cournot duopoly game with differentiated products. Appl. Math. Comput. 2016, 281, 1–15. [Google Scholar] [CrossRef]
- Puu, T. The chaotic monopolist. Chaos Solitons Fractals 1995, 5, 35–44. [Google Scholar] [CrossRef]
- Matsumoto, A.; Szidarovszky, F. Nonlinear delay monopoly with bounded rationality. Chaos Solitons Fractals 2012, 45, 507–519. [Google Scholar] [CrossRef]
- Matsumoto, A.; Szidarovszky, F. Discrete and continuous dynamics in nonlinear monopolies. Appl. Math. Comput. 2014, 232, 632–642. [Google Scholar] [CrossRef]
- Matsumoto, A.; Szidarovszky, F. Discrete-time delay dynamics of boundedly rational monopoly. Decis. Econ. Financ. 2014, 37, 53–79. [Google Scholar] [CrossRef]
- Matsumoto, A.; Szidarovszky, F. Complex dynamics of monopolies with gradient adjustment. Econ. Model. 2014, 42, 220–229. [Google Scholar] [CrossRef]
- Naimzada, A.; Ricchiuti, G. Monopoly with local knowledge of demand function. Econ. Model. 2011, 28, 299–307. [Google Scholar] [CrossRef]
- Cavalli, F.; Naimzada, A. Effect of price elasticity of demand in monopolies with gradient adjustment. Chaos Solitons Fractals 2015, 76, 47–55. [Google Scholar] [CrossRef][Green Version]
- Tramontana, F. When a boundedly rational monopolist meets consumers with reference dependent preferences. J. Econ. Behav. Organ. 2021, 184, 30–45. [Google Scholar] [CrossRef]
- Kou, G.; Xiao, H.; Cao, M.; Lee, L.H. Optimal computing budget allocation for the vector evaluated genetic algorithm in multi-objective simulation optimization. Automatica 2021, 129, 109599. [Google Scholar] [CrossRef]
- Mestre, R.A. A wavelet approach of investing behaviors and their effects on risk exposures. Financ. Innov. 2021, 7, 24. [Google Scholar] [CrossRef]
- Reichenbach, F.; Walther, M. Signals in equity-based crowdfunding and risk of failure. Financ. Innov. 2021, 7, 54. [Google Scholar] [CrossRef]
- Papadopoulos, K.G.; Petrakis, E.; Skartados, P. Product innovation transfer under passive partial ownership holdings. Econ. Lett. 2019, 177, 22–25. [Google Scholar] [CrossRef]
- Liu, L.; Wang, X.H.; Zheng, C. Endogenous horizontal product differentiation in a mixed duopoly. Rev. Ind. Organ. 2020, 56, 435–462. [Google Scholar] [CrossRef]
- Gori, L.; Sodini, M.; Fanti, L. A nonlinear Cournot duopoly with advertising. Chaos Solitons Fractals 2015, 79, 178–190. [Google Scholar] [CrossRef]
- Vickers, J. Delegation and the theory of the firm. Econ. J. 1985, 95, 138–147. [Google Scholar] [CrossRef]
- Fershtman, C.; Judd, K.L. Equilibrium incentives in oligopoly. Am. Econ. Rev. 1987, 77, 927–940. [Google Scholar]
- Miller, N.; Pazgal, A. Relative performance as a strategic commitment mechanism. Manag. Decis. Econ. 2002, 23, 51–68. [Google Scholar] [CrossRef]
- Fanti, L.; Gori, L.; Sodini, M. Nonlinear dynamics in a Cournot duopoly with isoelastic demand. Math. Comput. Simul. 2015, 108, 129–143. [Google Scholar] [CrossRef]
- Milnor, J. On the concept of attractor. Commun. Math. Phys. 1985, 99, 177–195. [Google Scholar] [CrossRef]
- Gori, L.; Pecora, N.; Sodini, M. Market share delegation in a nonlinear duopoly with quantity competition: The role of dynamic entry barriers. J. Evol. Econ. 2017, 27, 905–931. [Google Scholar] [CrossRef]
- d’Aspremont, C.; Jacquemin, A. Cooperative and noncooperative R&D in duopoly with spill-overs. Am. Econ. Rev. 1988, 78, 1133–1137. [Google Scholar]
- Bacchiega, E.; Lambertini, L.; Mantovani, A. R&D-hindering collusion. BE J. Econ. Anal. Policy 2010, 10, 66. [Google Scholar]
Publisher’s Note: MDPI stays neutral with regard to jurisdictional claims in published maps and institutional affiliations. |
© 2022 by the authors. Licensee MDPI, Basel, Switzerland. This article is an open access article distributed under the terms and conditions of the Creative Commons Attribution (CC BY) license (https://creativecommons.org/licenses/by/4.0/).