Article

Classification of Driver Distraction Risk Levels: Based on Driver’s Gaze and Secondary Driving Tasks

Transportation College, Jilin University, No. 5988 Renmin Street, Changchun 130022, China
*
Author to whom correspondence should be addressed.
Mathematics 2022, 10(24), 4806; https://doi.org/10.3390/math10244806
Submission received: 16 November 2022 / Revised: 13 December 2022 / Accepted: 15 December 2022 / Published: 17 December 2022

Abstract

:
Driver distraction is one of the significant causes of traffic accidents. To improve the accuracy of accident occurrence prediction under driver distraction and to provide graded warnings, it is necessary to classify the level of driver distraction. Based on naturalistic driving study data, distraction risk levels are classified using the driver’s gaze and secondary driving tasks in this paper. The classification results are then combined with road environment factors for accident occurrence prediction. Two ways are suggested to classify driver distraction risk levels in this study: one is to divide it into three levels based on the driver’s gaze and the AttenD algorithm, and the other is to divide it into six levels based on secondary driving tasks and odds ratio. Random Forest, AdaBoost, and XGBoost are used to predict accident occurrence by combining the classification results, driver characteristics, and road environment factors. The results show that the classification of distraction risk levels helps improve the model prediction accuracy. The classification based on the driver’s gaze is better than that based on secondary driving tasks. The classification method can be applied to accident risk prediction and further driving risk warning.

1. Introduction

As the transportation industry continues evolving, the need to deal effectively with road accidents and improve road safety is becoming a significant issue today. The World Health Organization reports that the number of people injured or killed in traffic accidents worldwide is increasing yearly. About 1.2 million people are killed in traffic accidents every year, and tens of millions are injured [1]. Driver distraction is an important reason for traffic accidents. The National Highway Traffic Safety Administration (NHTSA) reported that in 2020, 8% of fatal crashes, 14% of injury crashes, and 13% of police-reported motor vehicle crashes were distraction-affected [2].
NHTSA classified the driver’s distraction into four aspects of auditory, visual, cognition, and manual [3]. During a driver’s driving, multiple distractions will accompany their driving behavior, which will interfere with the driver’s normal driving, called the driver’s secondary task [4,5]. For example, answering phone calls and talking to others involve cognition and auditory distractions. The different categories of distractions mentioned above can also be reflected in the driver’s gaze. Visual distractions take drivers’ eyes off the road [6]. However, cognitive distractions can cause drivers to spend more time focusing on the areas in front of the road and have less time scanning [7]. Therefore, distractions can be identified from the driver’s gaze or their behavior of secondary driving tasks. In particular, developing various existing sensors can help obtain the driver’s gaze and movements, through both of which we can then identify driver distraction states [8,9].
However, from the perspective of traffic safety, the impact of distractions on traffic safety is of more concern than the above classification of distractions. The current research is mainly focused on the impact of distractions on the perception of drivers [10,11], the identification of driver distraction states [12], and the hazards caused by driver distractions on traffic safety [13], etc., so as to prevent traffic accidents caused by driver distractions. Numerous studies have shown that the impact on the risk of accidents is different from the degree of distractions. For example, using mobile phones will increase the risk of an accident by three times [14]. Compared with mobile phone calls, sometimes conversations with others reduce drivers’ negative emotions when driving, reducing the risk of accidents [15]. Operating the player and sending text messages while driving will also increase the risk of accidents [16]. The findings of the different effects of distraction on driving safety mentioned in the above studies are very relevant for driver distraction risk prediction and graded warnings.
However, it is still being determined whether the distractions mentioned above in different studies that increase or decrease the risk of accidents belong to the same level. In real life, drivers have many eye movements and secondary driving tasks. For example, according to the data obtained from a 100-Car Naturalistic Driving Study, there are 56 secondary driving tasks. Therefore, it is necessary to classify the risks of various types of distractions and then predict accidents as well as grade warnings to be effective in real-life monitoring and warning for drivers.
Studies have found that driver distraction is reflected in the driver’s gaze and secondary driving tasks. However, the classification of driver distraction risks is dealt with in a few existing studies. Moreover, due to a large number of drivers’ visual characteristics and secondary driving tasks, the lack of identification of drivers’ risk levels in the daily monitoring of their status, especially professional drivers, may lead to an accident due to untimely warnings. Sometimes it also leads to driver irritability due to too many unnecessary warnings. Therefore, a classification of driver distraction risk states is needed. The risk levels of driver distraction are classified in this paper based on the driver’s gaze and secondary driving tasks. Then the accident that occurred is predicted by combining factors such as the road environment. The validity of the classification of distraction risk levels in this paper was laterally verified from the perspective of prediction accuracy.

2. Literature Review and Main Contributions

In this section, we mainly reviewed the literature on driver distraction and described the contributions made in this paper.

2.1. Driver Distraction

The International Organization for Standardization (ISO) defines driving distraction as a phenomenon in which attention is directed to activities that are not related to normal driving, resulting in a decrease in driving operations [17]. Some scholars also consider distraction to be a form of inattention. Drivers may delay receiving the information needed for safely completing driving tasks because some events, activities, objects, and people inside and outside the vehicle force or induce drivers to divert their attention from driving tasks [18]. Driver distraction is an internal state of driving behavior, which is usually classified as visual (shifting of vision), biomechanical (hand and foot movements), and cognitive (daydreaming and emotional influence) based on their source and performance [8]. Existing studies on distracted driving can be divided into gaze-based and secondary-driving-task-based studies, and both aspects are reviewed in this section.
Driver distraction can be reflected in the driver’s gaze [19]. During normal driving, the driver’s frontal focus points are scattered widely to the peripheral areas [20]. When a driver is distracted, their gaze will deviate from the road, which may even last for more than 30 s [6]. When a driver’s eye is off the road for 2 s, it is considered detrimental to driving safety [21]. Sometimes just a brief glimpse can also be a major cause of accidents [22]. It is also difficult for drivers to notice vehicles other than those in front of themselves when their sight shifts between the road ahead and other directions, which in turn increases the risk of an accident [23].
In fact, although the driver’s gaze can reflect driver distraction, some other distractions, such as being lost in thought, can be important for causing an accident in specific situations, even if the driver’s gaze does not deviate from the road [24]. At this time, we can study drivers’ distractions from the perspective of secondary driving tasks.
Secondary driving tasks can cause driver distraction and reduce drivers’ attention to the road, thereby increasing the crash risk [25]. Several studies have shown that cell phone use, external distractions, and attention to passengers or objects in the vehicle are secondary driving tasks that contribute to driver distraction in crashes [26,27,28]. The presence of billboards on the road can also cause driver distraction, which in turn affects drivers’ speed control [29]. Yang et al. identified seven common driving activities based on deep convolutional neural networks, namely, normal driving, right rearview mirror checking, rearview mirror checking, left rearview mirror checking, using in-vehicle radio devices, texting, and answering a cell phone. Of these secondary driving tasks, the first four are considered normal driving tasks, and the remaining three are classified as distraction groups [30]. Secondary driving tasks not only decrease drivers’ perception [23] but also increase the chance of lateral vehicle drift [6].

2.2. Contributions

This paper classifies distraction risk levels based on the driver’s gaze and secondary driving tasks. After that, various machine learning methods are applied to predict the occurrence of traffic accidents in combination with road environment factors. The contribution of this paper is mainly two-fold. First of all, we proposed two distraction risk classification methods. The AttenD algorithm based on the driver’s gaze and the odds ratio calculation method based on secondary driving tasks is, respectively, applied for the driver’s gaze capture sensors and secondary driving task recognition sensors. We explored a new way of classifying the risk levels of driver distraction. The results can be combined with other factors for accident prediction, which can also be used for the Advanced Driver Assistance System (ADAS) for graded prewarning. Secondly, the above distraction risk classification results are combined with road environment information as influencing factors. After that, random forest, AdaBoost, and XGBoost are applied to discriminate the influencing factors and predict the accident occurrence so as to investigate the prediction accuracy with different models.
In Section 3, distraction risk classifications are performed for the driver’s gaze and secondary driving tasks. In Section 4, different machine learning models are used to make predictions and to compare the prediction accuracy. In Section 5, we discuss the results of the study. Finally, the conclusions and future works are provided.
The logical framework of this paper is shown in Figure 1.

3. Distraction Risk Level Classification Methods

3.1. Experimental Data

The dataset utilized in this paper is data from 100 naturalistic vehicles collected in the “The 100-Car Naturalistic Driving Study”. The study was conducted in Northern Virginia and Washington, D.C. The experiment generated approximately 2 million miles and 43,000 h of driving data. There are three classifications of event severity: crash, near-crash, and baseline. The Virginia Tech Transportation Institute (VTTI) defines the above three event severities as follows [31].
  • Crash: any contact between the subject vehicle and an object, whether moving or stationary, at any speed, with measurable transfer or dissipation of kinetic energy;
  • Near-crash: any situation that requires the subject vehicle or any other vehicle, pedestrian, bicyclist, or animal to quickly evade maneuvers to avoid a crash;
  • Baseline: any “normal driving” and “typical driver behavior” in the sample.
The experiment involved a dataset of 68 crash events, 756 near-crash events, 19,616 baselines, and 24,153 drivers’ eye movements. Each event and baseline have a unique ID. In the subsequent analysis, the crash events and near-crash events are combined and collectively referred to as an event. The occurrence period of the event is the time from the start of the collision or near-collision to the end time. The data collection period for the baseline is 60 s during the normal driving process. The description of the secondary driving tasks was obtained by the researchers through video reduction. The secondary driving task may begin at any point during the 5–6 s prior to the onset of the precipitating event. If there is more than one distraction present, select the most critical or the most direct impact of the event (defined by event outcome or closest in time to the event occurrence).

3.2. Distraction Risk-Level Classification Based on Driver’s Gaze

3.2.1. AttenD Algorithm

Regarding the study of the driver’s gaze, Johansson et al. proposed the concept of visual buffers and the AttenD algorithm [32]. They used the AttenD algorithm to determine the driver’s distraction status based on the gaze. The AttenD algorithm has been applied in previous studies [33,34].
The process of the algorithm is as follows:
  • Initially set the visual buffer time to 2 s;
  • When the driver’s gaze leaves the front of the road, the visual buffer decreases at a rate of 1 s per second;
  • When the driver’s gaze returns to the front of the road, the visual buffer remains unchanged for 0.1 s and rises at 1 s per second beyond 0.1 s;
  • When the driver’s gaze changes to the instrument cluster, rearview mirror, etc., the visual buffer remains unchanged for 1 s. After 1 s, the visual buffer decreases at 1 s per second.
A driver can move their eyes from the road at some time. When looking away, the buffer is depleted. When looking back to the road, the buffer rises back up. If the buffer is empty, the driver is considered to be distracted [33]. The visual buffer is set based mainly on physiological responses to provide a buffer time for the driver to change from driving primary and secondary tasks. The time value of the visual buffer is set mainly based on the fact that a driver’s eye off the road for more than 2 s leads to an uncontrollable separation from the lane and doubles the probability of conflict. In different road setting scenarios, the time value of the driver’s visual buffer can be changed. The AttenD algorithm assumes that the driver’s gaze is consistent with the driver’s concentration position. Moreover, the sight of the instrument cluster, mirror, etc., is a driving need, but it is an abnormal state when it exceeds 1 s. When the driver’s gaze returns to the front of the road, a visual buffer time of 0.1 s is required because the eyes need to refocus on the road as a physiological response. The AttenD algorithm only considers the gaze time and does not consider the scan.
In this paper, based on the above definition of a distraction, the driver’s incomplete distraction state in the algorithm’s application process is identified. Moreover, the driver distraction risk level is classified according to the different distraction states of the driver during the event period.

3.2.2. Gaze Location Categories

For the visual features, the information given in the dataset is event ID, visual action start time, visual action end time, visual action duration, and visual location. Each event data consist of about 30 s of data on average, including about 20 s of data before the event start.
Due to the many types of drivers’ visual behaviors, the driver’s gaze location is divided into three categories, which are ahead, driving needs (excluding ahead), and non-driving needs, by combining the actual situation and the needs of AttenD algorithm. The details are shown in Table 1. Gaze location is the location to which the driver has directed their gaze. The length of a glance is measured in 0.1 s.
According to the AttenD algorithm, to classify the gaze location. The location of forward, left forward, right forward, right window, and left window are the driver in order to observe the road situation must move, that is, classified as ahead; the location of cell phone, interior object, passenger, center stack, closed eyes are affected by other factors during driving as non-driving needs; and the location of the instrument cluster, rearview mirror, left mirror, and right mirror that drivers need to pay attention to during normal driving is classified as driving needs.

3.2.3. Results

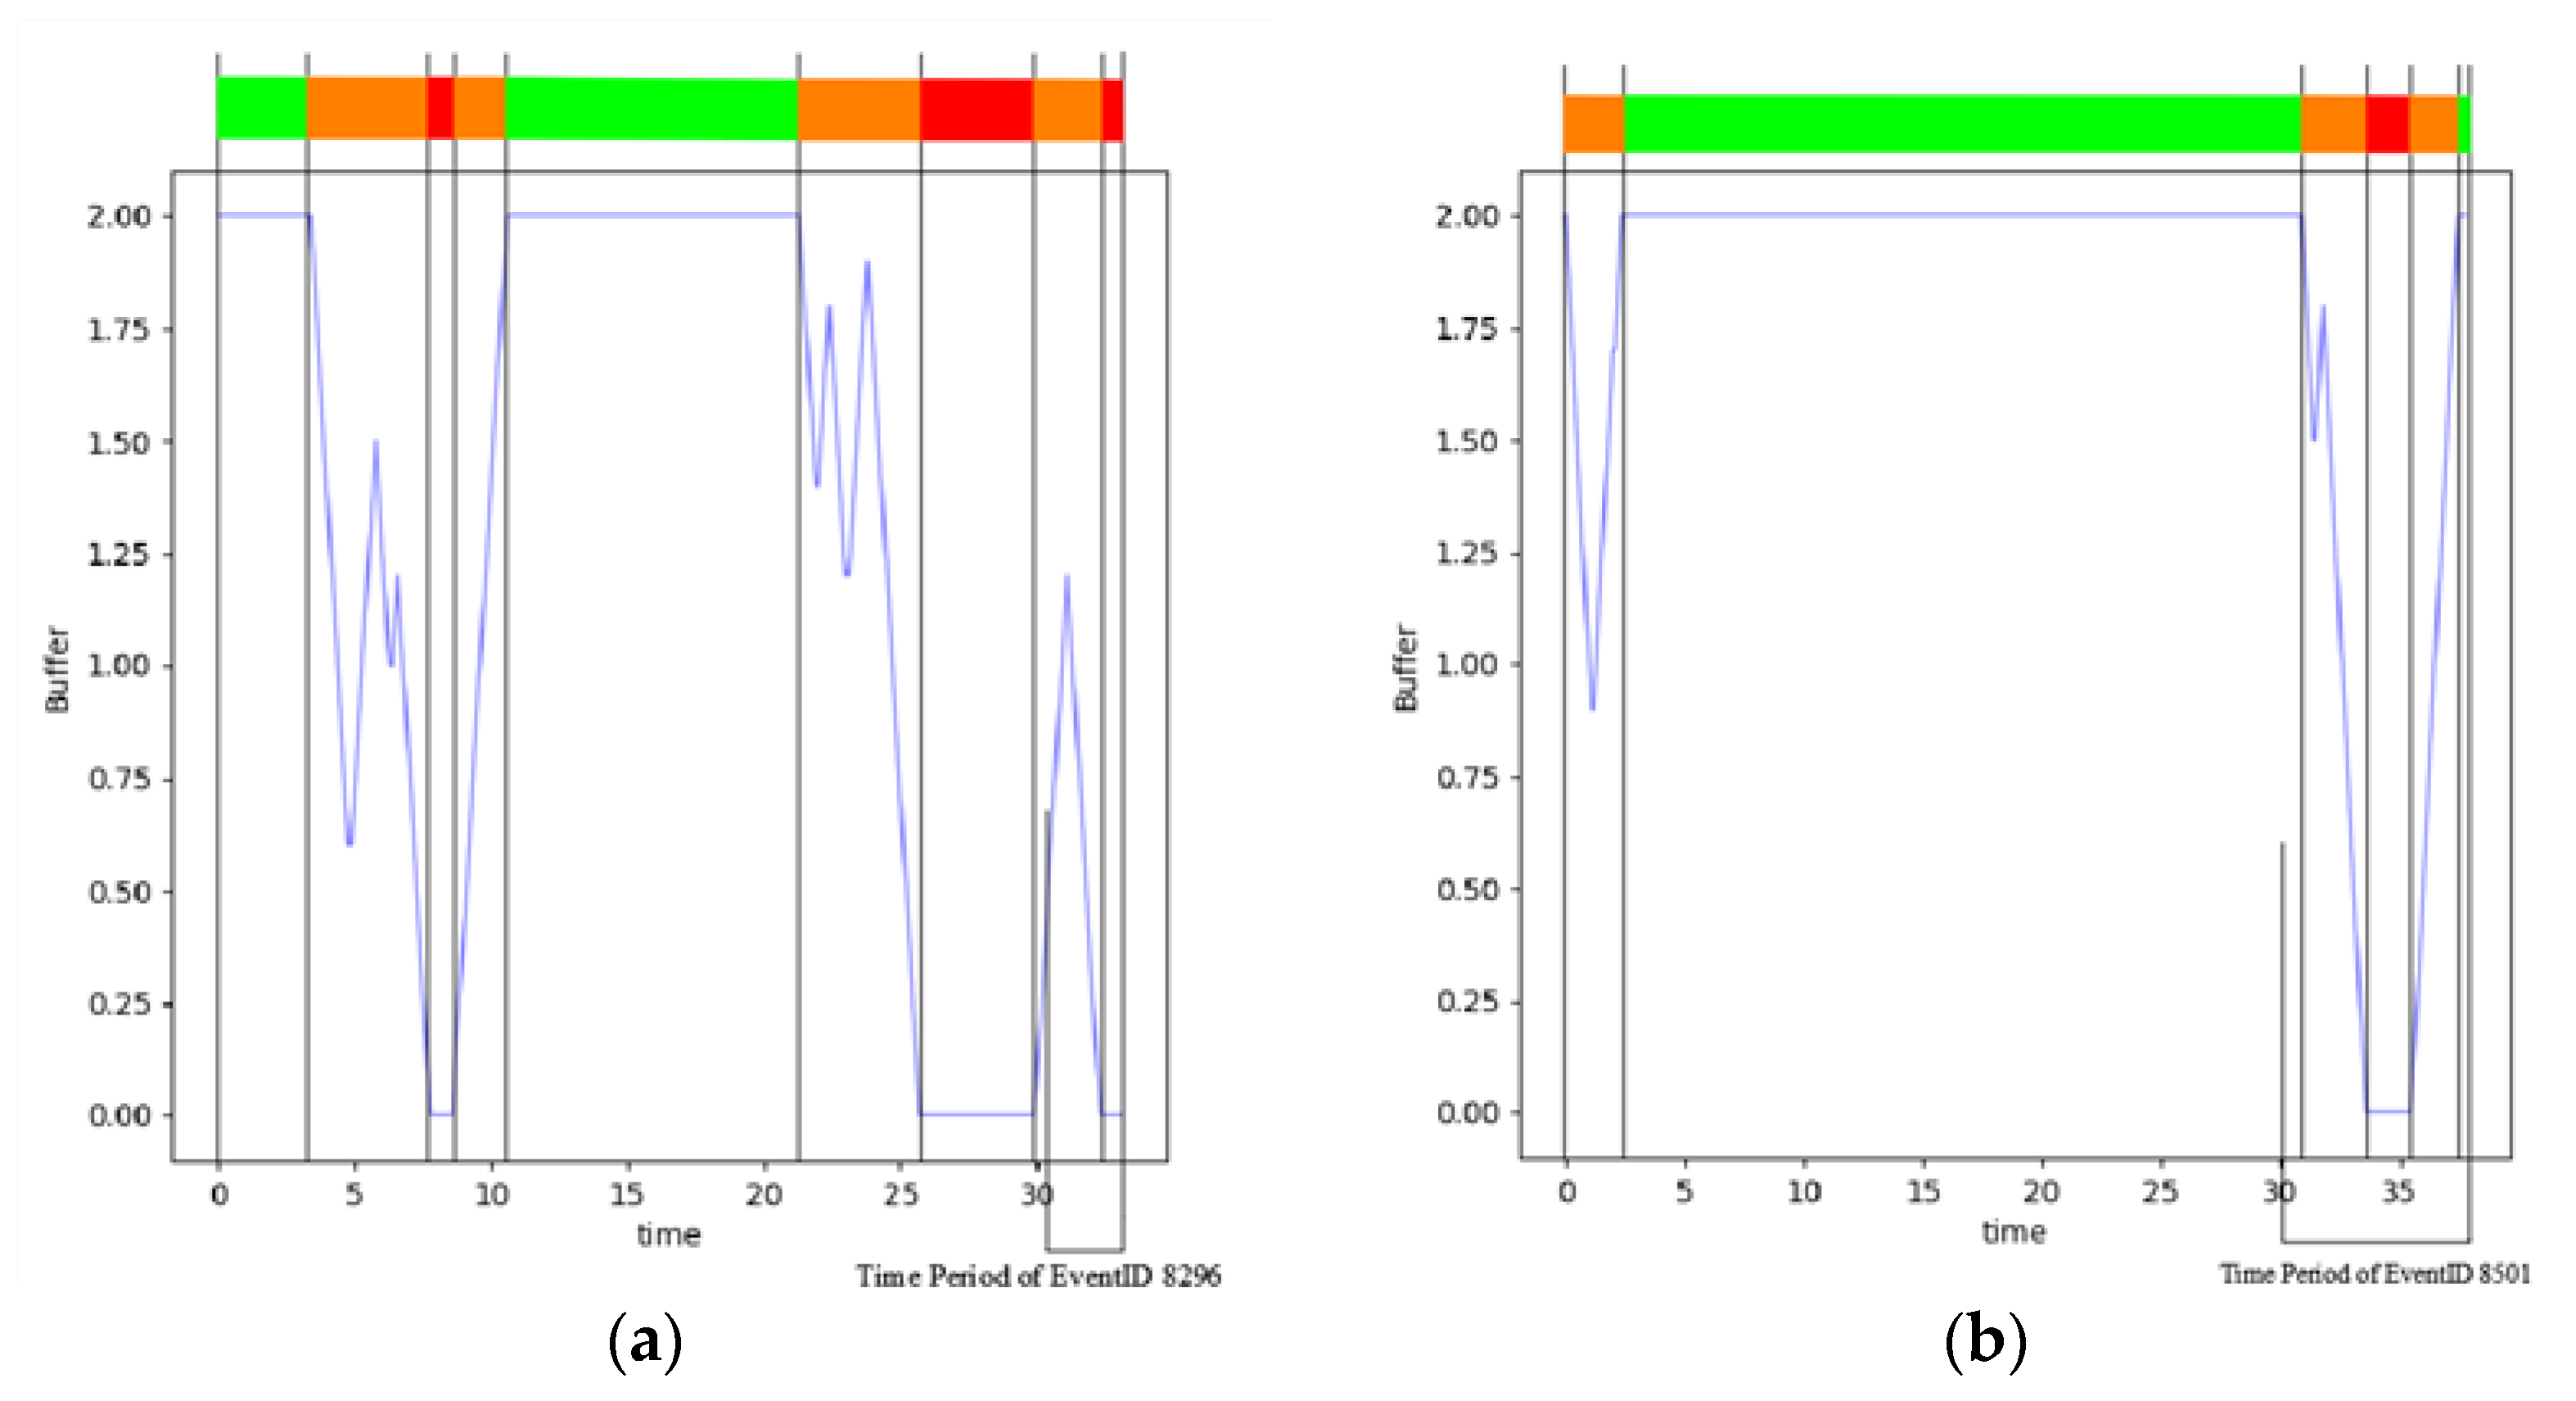
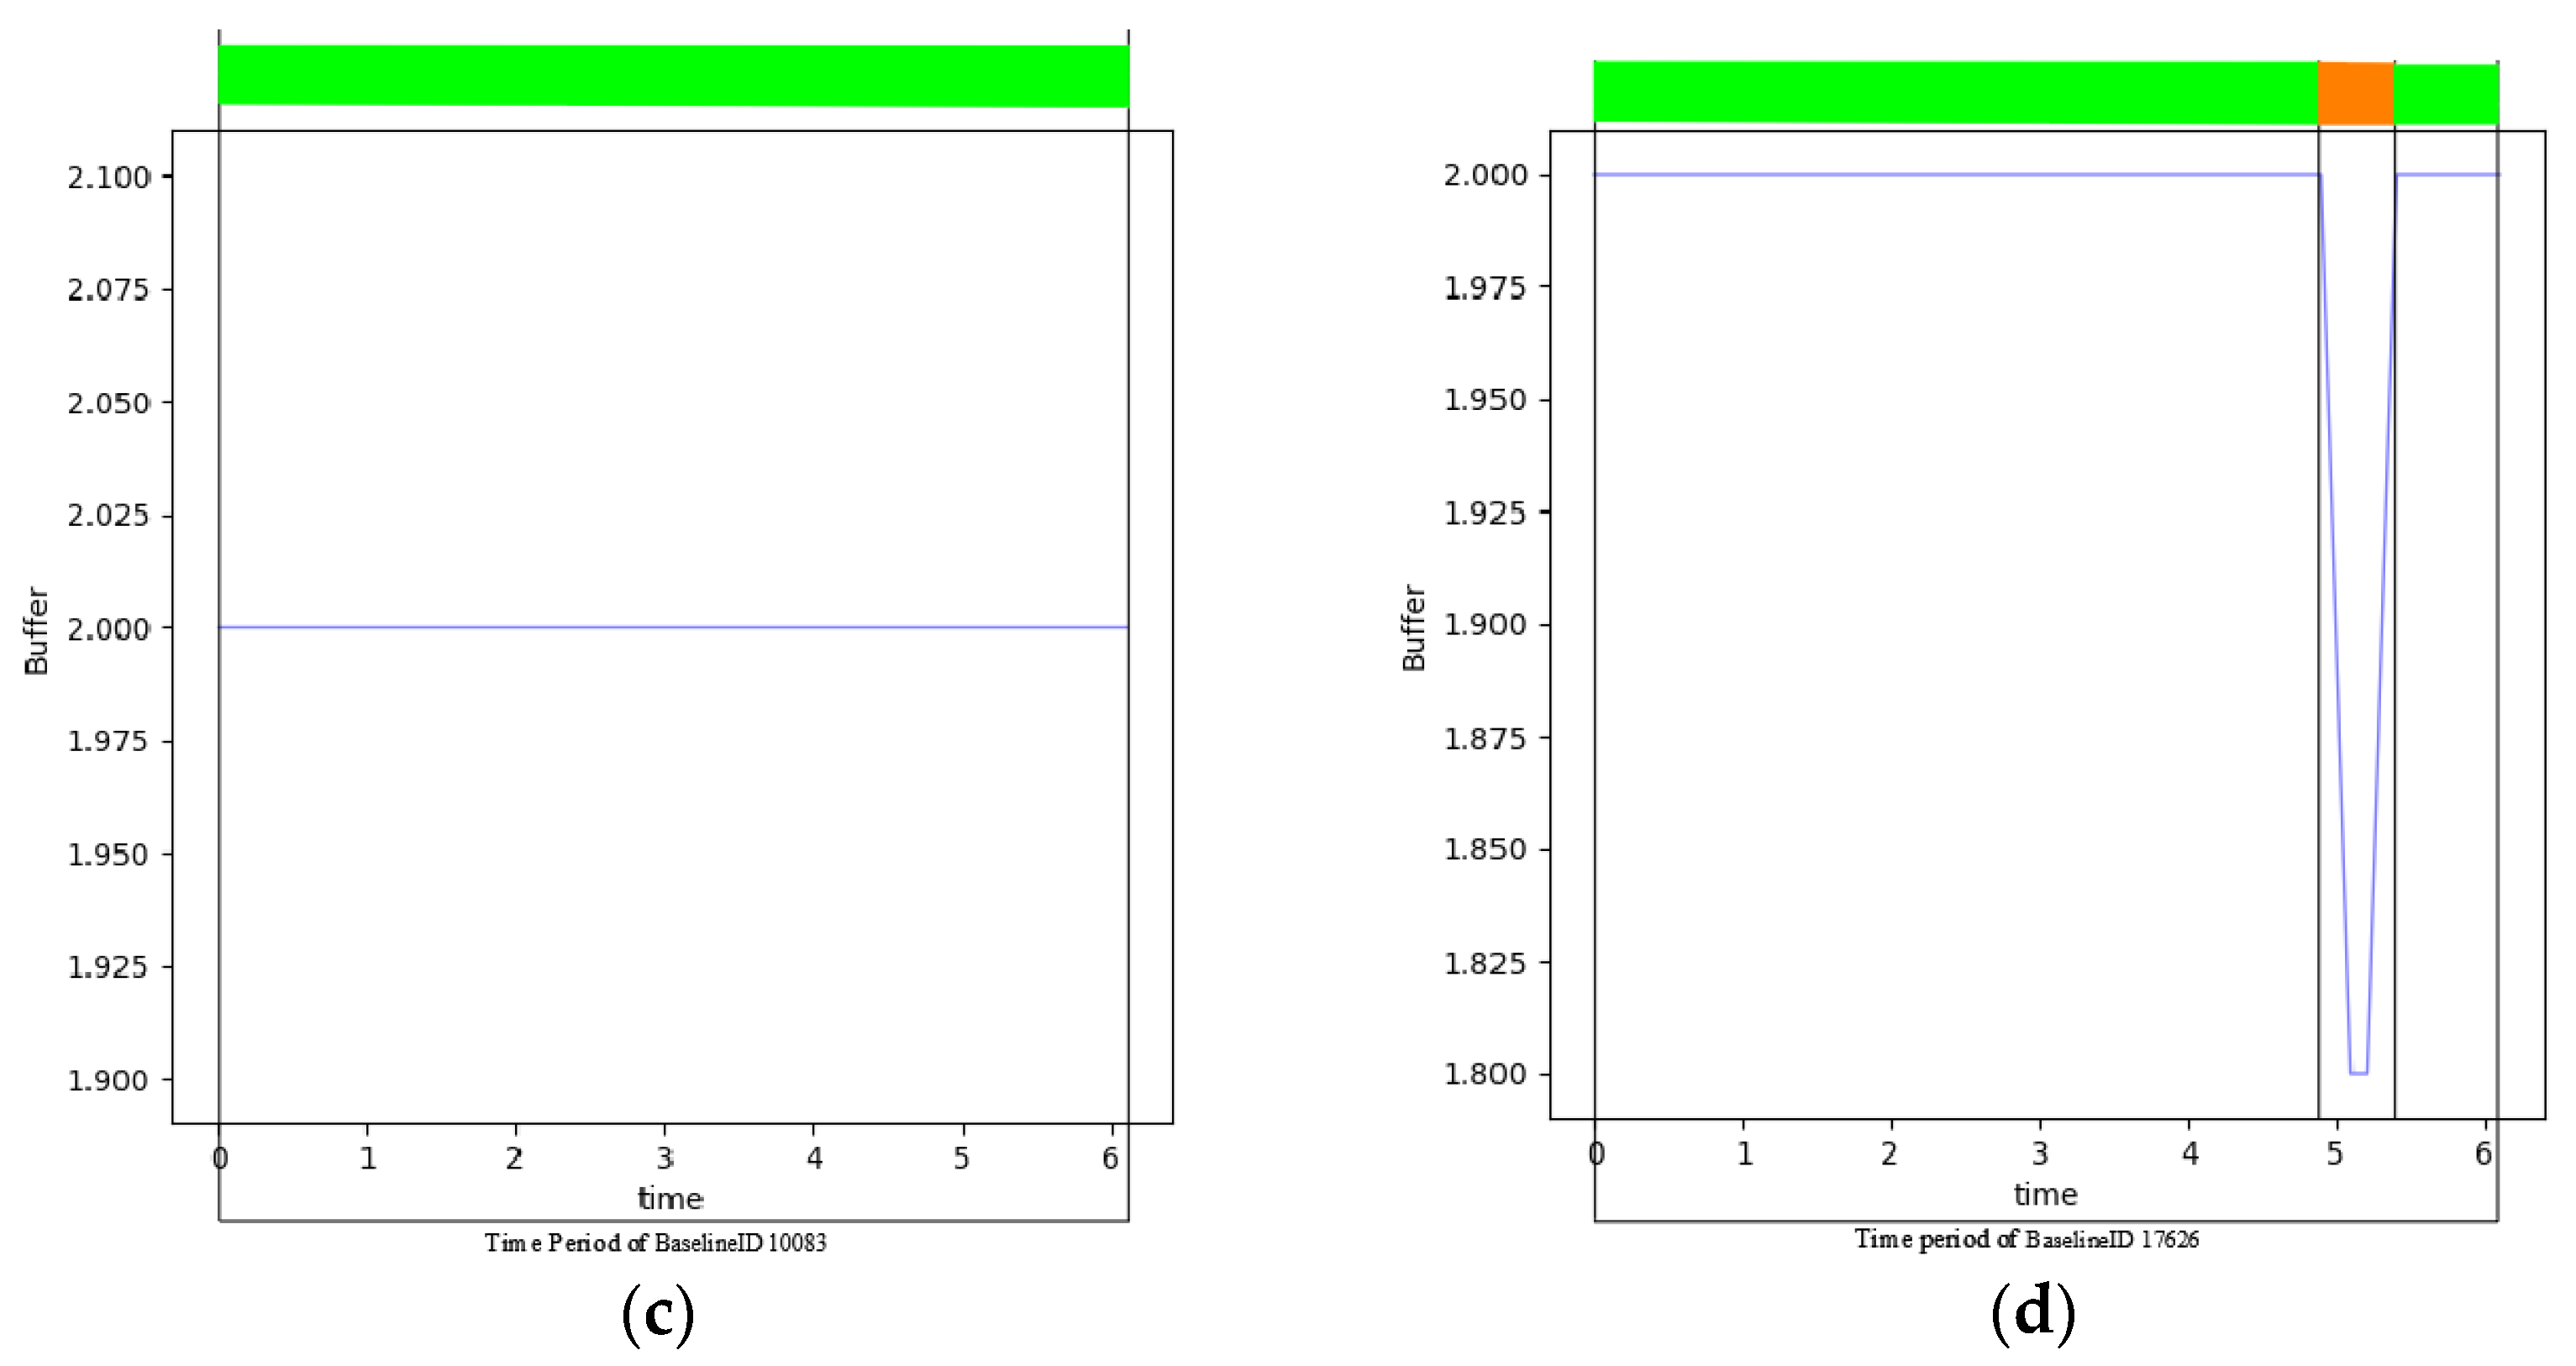
According to the algorithm process, the driver’s visual buffer in each sample can be obtained. Typical samples were selected here for analysis and demonstration. When the visual buffer is 2 s, the driver is considered to be in a non-distracted state. When the visual buffer is between 0 s and 2 s, the driver is considered to be incompletely distracted. When the visual buffer is 0 s, the driver is considered to be fully distracted. The driver’s visual buffer and the identified distractions are shown in Figure 2. Where red means the driver is completely distracted, orange means the driver is incompletely distracted, and green means the driver is driving normally. The drivers of EventID 8296 and EventID 8501 were both fully distracted or incompletely distracted during the event period. The driver of BaselineID 10,083 was undistracted during the data collection period. The driver of BaselineID 17,626 was undistracted most of the time during the data collection period.
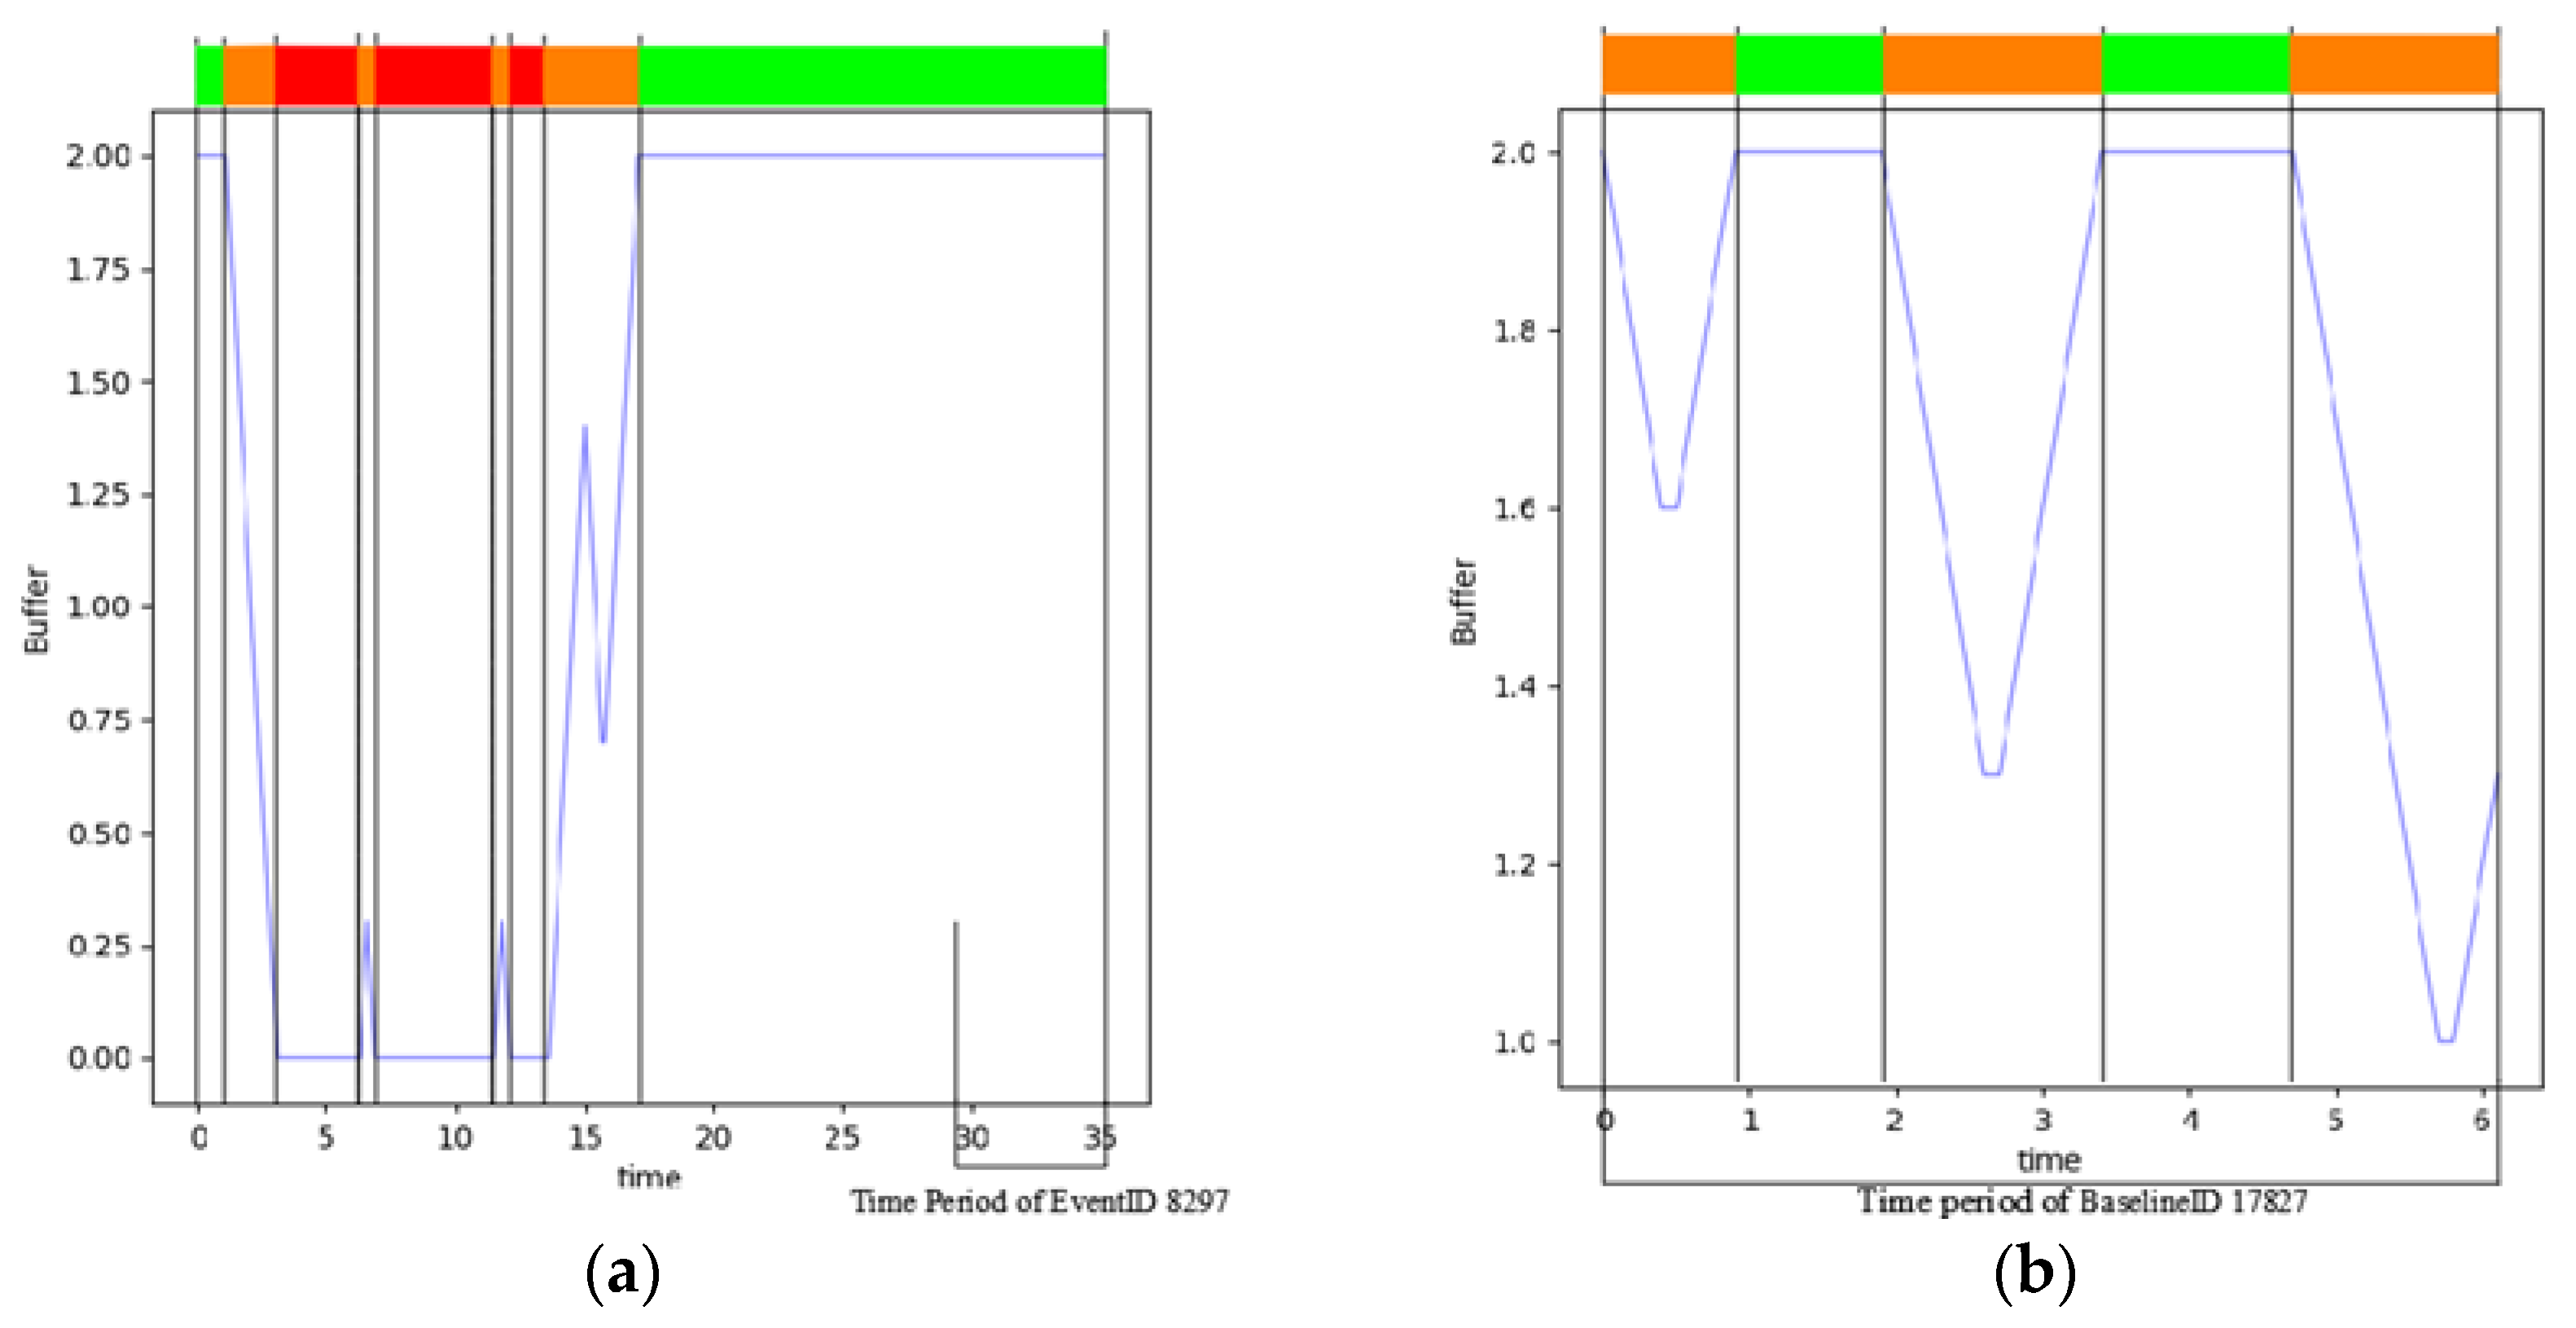
The visualization above shows that the drivers were in a different level of distraction in most events. In most baselines, the drivers were in an undistracted state most of the time. However, some samples have shown different results. As shown in Figure 3, the driver of EventID 8297 was not distracted during the accident period, while the one of BaselineID 17,827 was in a distracted state most of the time. The reason is that there may be other factors in the process of these incidents.
Jenkins demonstrated that approximately 80% of crashes and 65% of near-crashes were associated with driver inattention within three seconds of the start of the conflict [35]. Therefore, we classified the driver distraction risk level in terms of the distraction status during the period of the event. A driver is considered to be in a low-risk state of distraction if the driver’s visual buffer is maintained at 2 s during the event period, i.e., the driver maintained an undistracted state. If the driver has a 0 s visual buffer during the event time period, that is, there is a time when the driver is completely fully distracted, even if only for a moment, the driver is considered to be in a high-risk distraction state. If the driver does not have a 0 s visual buffer appearing during the event period but also has not maintained an undistracted state, the driver is considered to be in a medium-risk distraction state.

3.3. Distraction Risk-Level Classification Based on Secondary Driving Tasks

3.3.1. Secondary Driving Tasks

The dataset contains 56 secondary driving tasks, and each secondary driving task is numbered and shown in Table 2.

3.3.2. Odds Ratio

We used the case–control study in the medical field to study the secondary driving task. A patient currently suffering from a disease is called the case group, and a person who does not have the disease but otherwise has a condition similar to the case group is called the control group. The proportion of exposure to each factor is measured and compared between the two groups. After hypothesis testing, a statistical association between the factors and the disease is considered to exist if it is judged statistically significant. The case–control study generally estimates the strength of the association between a factor and a disease in the form of an odds ratio [36]. When the odds ratio of a factor is greater than 1, the factor is considered to increase the risk of disease.
In this paper, we replaced the case and control groups in the medical field with event and baseline, respectively. Afterward, we compare the frequency of occurrence of secondary driving tasks and undistracted in the two groups. The statistical table obtained is shown in Table 3.
The odds ratio of a secondary driving task is calculated as follows:
a i = n 11 n 12 n 21 n 22 = n 11 n 22 n 12 n 21
where n11 is the number of events in an event in which the driving subtask occurred, n12 is the number of undistracted events in an event, n21 is the number of samples where secondary driving task occurred in baselines, n22 is the number of undistracted samples in baseline, and ai is the value of odds ratio of the number of the secondary driving task.
Similar to the use of the odds ratio in case–control studies in the medical field, in this paper, when the calculation of the odds ratio is less than 1, it indicates that the secondary driving task does not increase the risk of an accident occurring. When the calculated result of the dominance ratio is greater than 1, it indicates that the secondary driving task increases the risk of an accident. The 95 percent confidence limit intervals can also be calculated to improve the accuracy of the distraction risk level classification. The obtained upper confidence limit (UCL) and lower confidence limit (LCL) can help us further classify. By combining the odds ratio results and the 95 percent confidence limits, the driver distraction risk level classification according to secondary driving tasks can be obtained as shown in Table 4.
Since some of the secondary driving tasks in the data exist only in event or baseline, which means that the value 0 appears in the statistics, at this time, the odds ratio cannot be used to classify. In this paper, these secondary driving tasks are classified into new categories: relatively dangerous and relatively safe distraction states. The classification criteria are shown in Table 5. It should be noted that the driver distraction risk level determined by the classification was the result of a comparison with undistracted.

3.3.3. Results

According to Table 3, the frequency of each secondary driving task in the event and baseline in Table 2 can be counted. After that, the odds ratio of each secondary driving task can be calculated using Equation (1). The obtained partial results are shown in Table 6. Here, we used these tasks as examples for descriptive analysis.
The classification results are shown in Table 6, where the secondary driving task is replaced by the number. Table 7 shows the classification of driver distraction states for some tasks. Here, we used these tasks as examples for descriptive analysis. The odds ratios of “Lost in thought” and “Appling make-up” are 12.33 and 1.17, which are greater than 1, indicating that these two secondary driving tasks increase the risk of events. In addition, in the case of “Lost in thought”, the probability of an event is 12.33 times higher than that of undistracted samples. The probability of an event with “Appling make-up” is 1.17 times higher than that of undistracted samples. However, since the lower confidence limit for “Lost in thought” is greater than 1 and the lower confidence limit for “Appling make-up” is less than 1, “Lost in thought” has a significant change in a crash or near-crash, i.e., more likely to be involved in an event. When a driver is lost in thought, he is in a high-risk distraction state. When a driver is applying make-up, they are in a medium-risk distraction state.
The odds ratios of “Eating without utensils” and “Smoking cigar/cigarette” are 0.86 and 0.44, respectively, which are less than 1, indicating that these two tasks do not increase the risk of events. However, since the upper confidence limit of the driving subtask “Eating without utensils” is greater than 1 and the upper confidence limit for the driving subtask “Smoking cigar/cigarette” is less than 1; “Eating without utensils” has a higher risk, i.e., it is more likely to be involved in an event. When a driver is eating without utensils, they are in a low-risk distraction state. When a driver is smoking a cigar/cigarette, they are in a no-risk distraction state.
Since “Looked but did not see” was only present in events and “Lighting cigar/cigarette” was only present in baselines in the dataset, it cannot classify these two types of secondary driving tasks based on the odds ratio. Here, the classification was performed directly according to the event to which the secondary driving tasks belong. The classification results showed that “Looked but did not see” had a greater effect on the risk, while “Lighting cigar/cigarette” had a smaller effect on the risk. In this case, when a driver looks but does not see, they are in a relatively dangerous distraction state. When a driver is lighting a cigar/cigarette, they are in a relatively safe distraction state.
According to the classification principles in Table 4 and Table 5, the classification results for all secondary driving tasks can be obtained after obtaining the odds ratio and confidence limits, as shown in Table 7. Each secondary driving task is replaced by its number in Table 2.

4. Accident Occurrence Prediction

Since natural driving data may contain a large number of variables that affect the risk of a crash, an increasing number of studies have used various machine learning (ML) techniques because of their ability to handle complex multidimensional data, high training, testing accuracy, and short prediction time [25]. Common prediction models for accident occurrence include logit, decision tree, Bayesian network, random forest, AdaBoost, XGBoost, etc. Compared with the traditional logit models, machine learning models can effectively check the number of noise, extreme values, and missing values [37]. Based on the one-year crash database from Colorado State Patrol, Chen et al. used logit models to predict road traffic accidents by combining traffic volume, road condition, and other traffic environment parameters [38]. Chen and Wang adopted the accident data of the Statewide Integrated Traffic Records System and used AdaBoost to explore accident risk factors. The results showed that AdaBoost was sensitive to noise values and outliers and had good performance [39]. Malik et al. compared six machine learning algorithms, such as AdaBoost, random forest, and decision tree, based on the road accident dataset published by the Department of Transport UK. Among them, the random forest had the highest prediction accuracy [40]. Osman et al. trained and compared six machine learning algorithms such as K-nearest neighbors (KNN), random forest (RF), support vector machine (SVM), and AdaBoost using the SHRP2 NDS vehicle kinematics data, in which the accuracy of AdaBoost was better than the others [41]. Based on data that were collected on the South African Accident Report, Malkoate et al. compared two models, multiple logistic regression and XGBoost, and concluded that XGBoost was superior to multiple regression [42]. By using data collected from The 100-Car Naturalistic Driving Study, Guo et al. used a logit model to make predictions [43]. Xiong et al. combined fused rough sets with Bayesian networks to make predictions [44].
The models in the above studies are widely used in accident prediction. In this paper, three of the above models were selected to predict the occurrence of accidents: random forest, AdaBoost, and XGBoost. We combined road environment factors, driver characteristics, and driver distraction risk level classification in Section 3 to discriminate and predict the influencing factors on accident occurrence.
Since some samples in the dataset do not have driver visual data, samples containing both driver visual feature data and secondary driving tasks were first screened out for further analysis. Finally, 714 events and 3517 baselines were obtained.

4.1. Factors Influencing the Occurrence of Accidents

This section focuses on the factors contained in the dataset that may have an impact on traffic events among 4231 samples.

4.1.1. Driver Characteristics

The age distribution of drivers in the dataset is shown in Figure 4. In this paper, we referred to the United Nations age classification method [45] and divided the ages within the dataset into four segments: 18–24,25–44,45–64, and 65+.
In addition to age, the dataset also contains the driver’s gender and whether the driver wears a seat belt or not.
In Section 3, driver distraction based on the driver’s gaze was divided into three risk levels, which are high-risk, medium-risk, and low-risk. Driver distraction based on secondary driving tasks was divided into six levels, which are high-risk, medium-risk, low-risk, no-risk, relatively dangerous, and relatively safe, as detailed in Table 8.

4.1.2. Road Environment Factors

In traffic accidents, in addition to subjective driver factors, road environment factors are also considered to have a greater likelihood of contributing to injuries and fatalities [46]. Robert et al. explored that an increase in the number of lanes was positively associated with the number of fatalities in traffic accidents; an increase in lane width was positively associated with fatalities; an increase in the width of the outside shoulder was negatively associated with accident rates [47]. Kenta et al. explored that lighting condition variables had a significant effect on the severity of both multi-vehicle and pedestrian or bicycle-related accidents at night, while weather conditions also had a large impact on accidents [48]. Usman et al. demonstrated that the risk of accidents with minor injuries was higher during snowy periods in winter than in summer [49]. Khorashad et al. studied the occurrence of accidents in urban versus rural areas by analyzing four years of accident data from California, USA, and explored that there were significant differences in the number and type of accidents between urban and rural areas. Complex interactions between driver behavior and factors such as environment and road geometry play an important role in the severity of driver injuries [50]. Deo et al. demonstrated that factors such as speed limit and lane width all have an impact on bus crashes [51]. Therefore, in addition to driver distraction factors, road environment factors are also extremely important for the study of traffic accident risk.
Besides driver-related information, the dataset also contains surface conditions, traffic flow, travel lanes, traffic density, traffic control, relation to junction, alignment, locality, weather, and lighting. Each attribute contains 5 to 8 sub-attributes. Details are shown in Table 9.

4.2. Prediction Model

In this paper, we used random forest, Adaboost, and XGboost to train on 4231 data. The accuracy of the prediction model depends mainly on the size of the data, the characteristics of the data, and the relationship between the input and output parameters [52]. The model’s explanatory variables in this paper are the five driver characteristics and the ten road environment characteristics mentioned in Section 4.1.1 and Section 4.2.2. The model’s dependent variable is event severity, which takes the values of the event and baseline.
In the three models, the data are divided into a training set and a test set at a ratio of 8:2. In this paper, the ROC curve, AUC, and prediction accuracy are used to evaluate the three models.
While training the model, the feature importance, which is the average of the information gain optimization brought by each feature, is calculated. This function can be implemented by directly calling the relevant default function from SKLEARN.

4.2.1. Hyperparameter Optimization

Since there are many hyperparameters in the model and different hyperparameters can cause different results in the model. Therefore, the hyperparameters need to be optimized. In this paper, the grid search method was used to optimize the model hyperparameters. The GridSearchCV function is applied to give the optimal parameters according to the AUC values. Among all the hyperparameters, n_estimators and max_features in the random forest are mainly optimized, and other parameters are set according to the default parameters of the model. For AdaBoost, the n_estimators and learning_rate parameters are optimized. For XGboost, the n_estimators and learning_rate parameters are optimized. The optimization results are shown in Table 10. Figure 5 is the heat map of AUC values for different combinations of hyperparameters of the three models.

4.2.2. Results

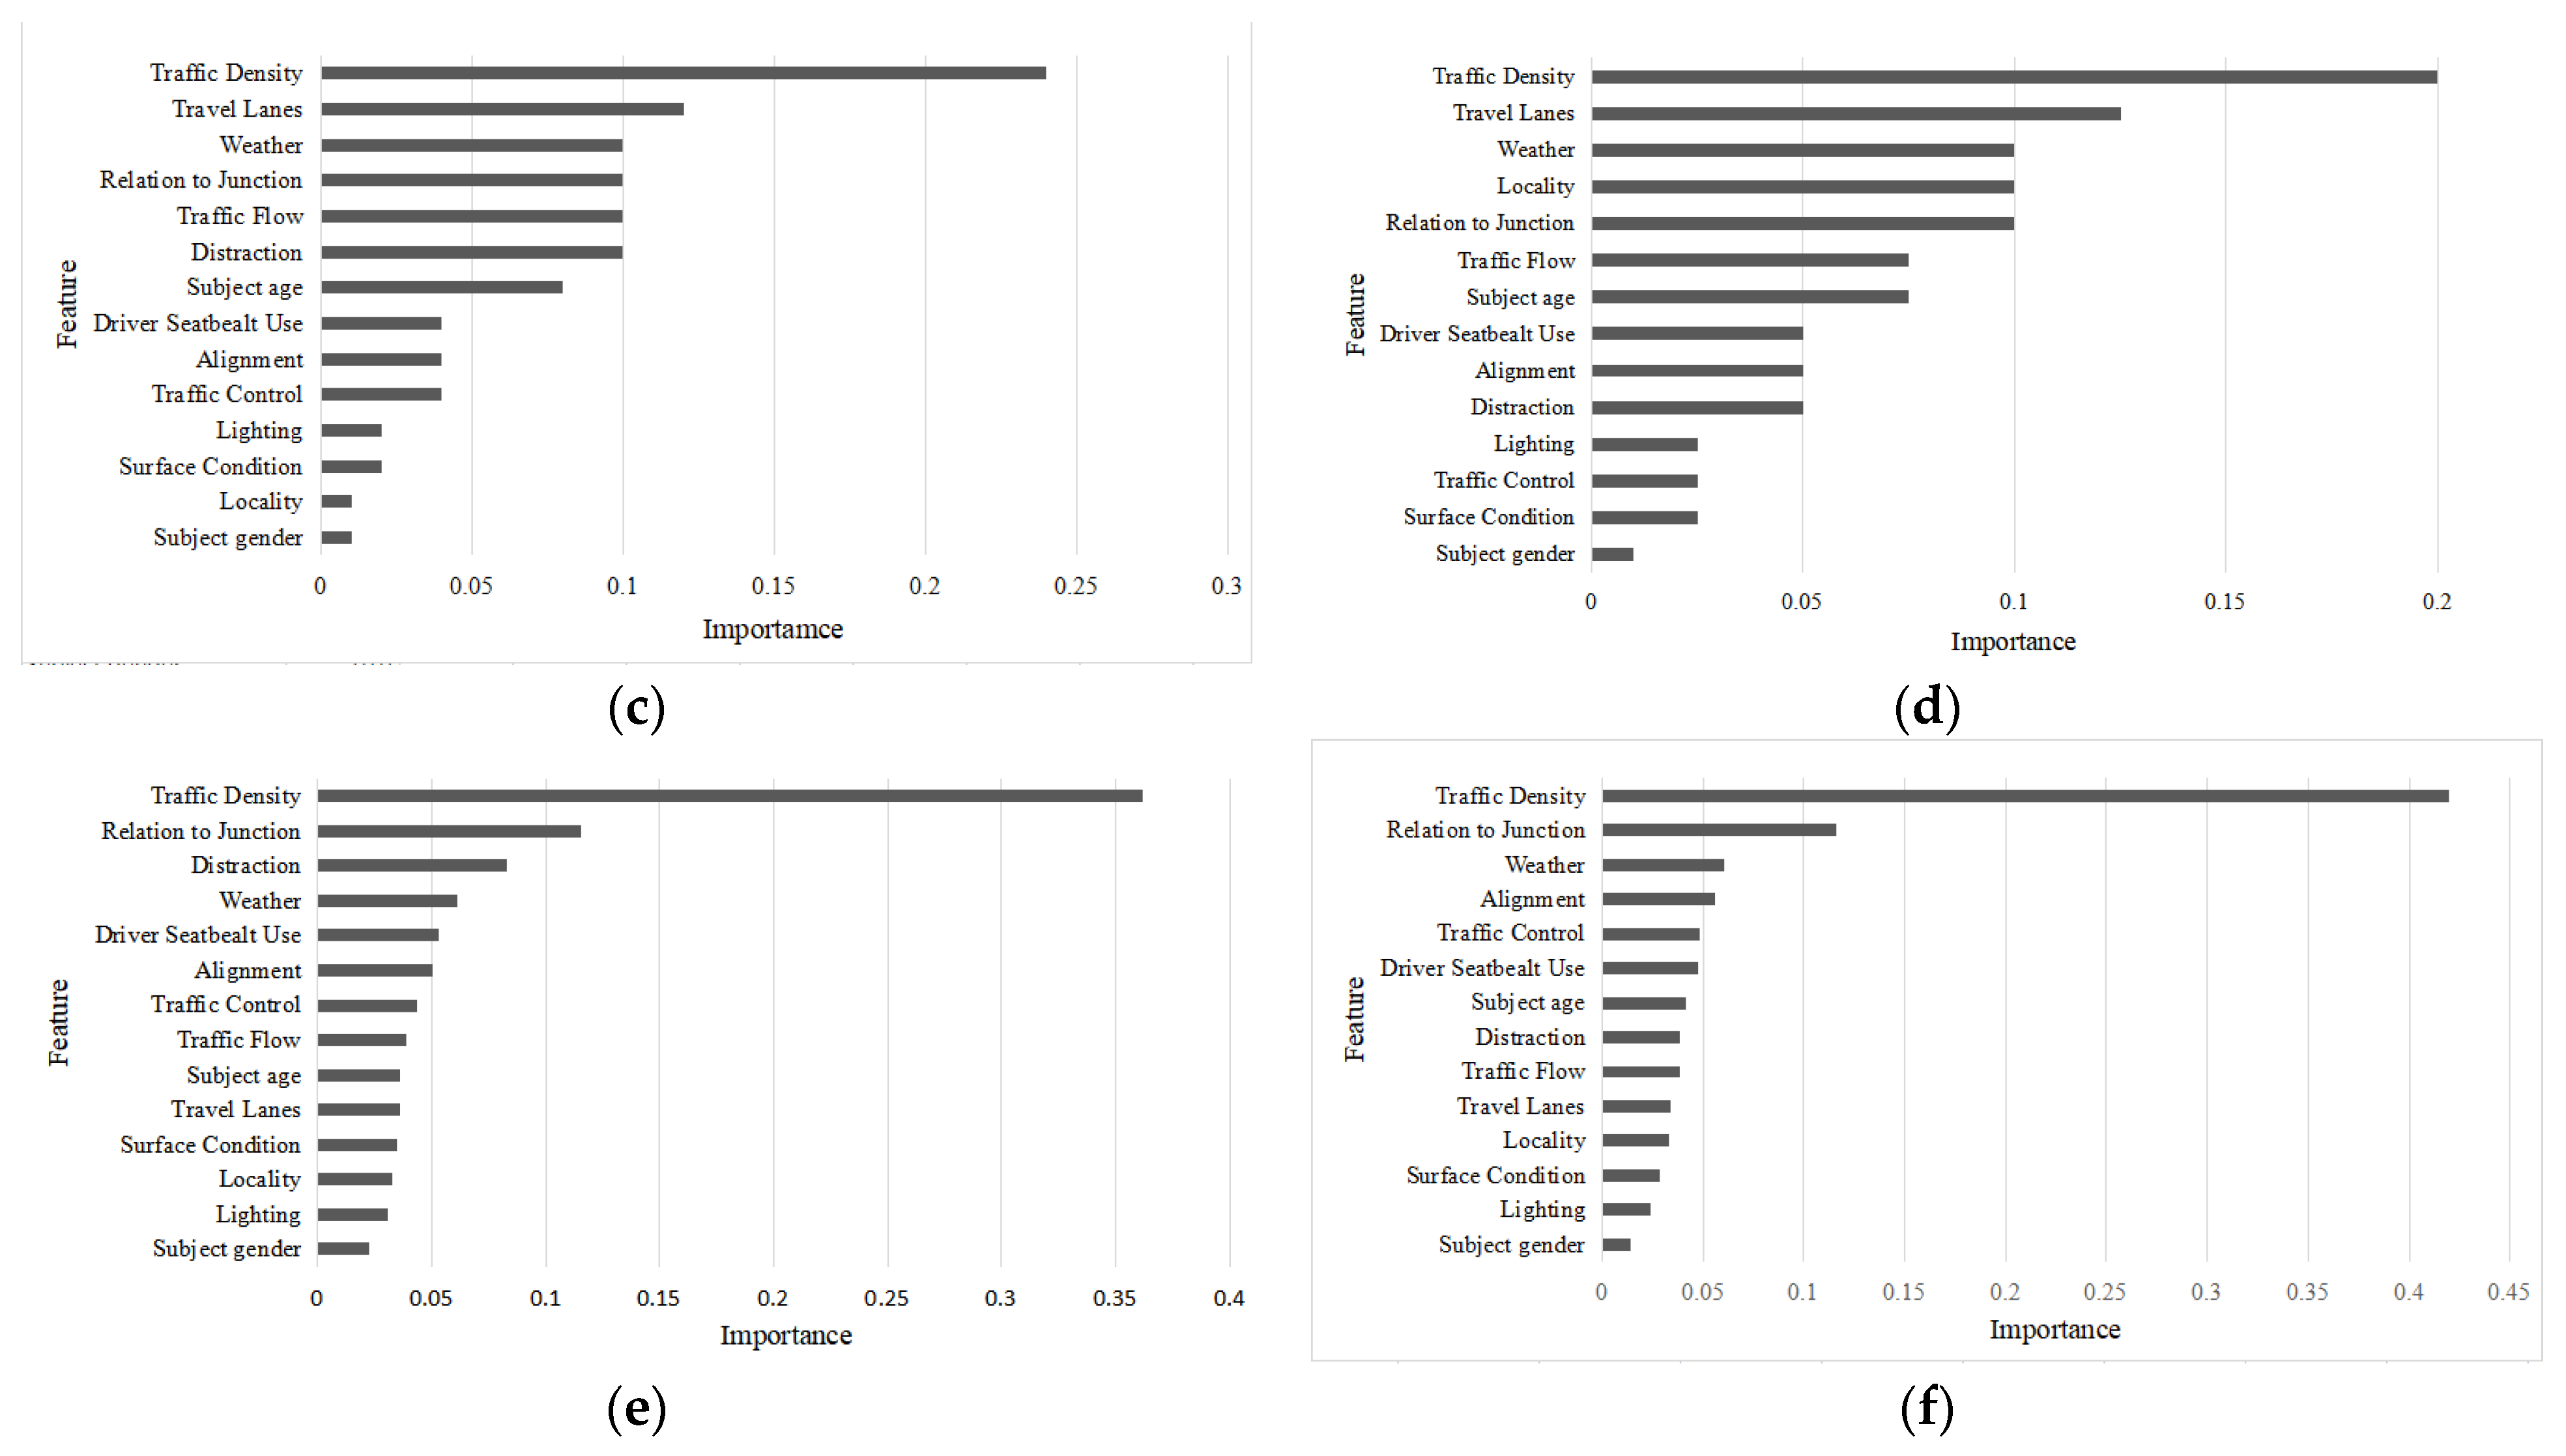
The feature importance is shown in Figure 6. The results of the random forest model show that traffic density, relation to the junction, driver distraction, and travel lanes were the factors that had a greater influence on the occurrence of accidents, while weather and surface conditions did not have a significant influence on the occurrence of accidents. The results of AdaBoost show that traffic density, travel lanes, weather, and relationship to the junction are the factors that have a greater influence on the occurrence of accidents, while driver gender and surface condition have little influence. The results of XGBoost show that traffic density, relation to the junction, weather, and driver distraction are the four factors that have a greater influence on the occurrence of events, while driver gender, lighting condition, and surface condition have little influence.

4.2.3. Comparison of Prediction Model Results

The accuracy of the three models is shown in Table 11. Here, not only the distractions classified by driver sight and secondary driving tasks but also the results without classification of the secondary driving tasks are shown. Moreover, the prediction accuracy of the random forest is taken as the mean of the five model-fitting results.
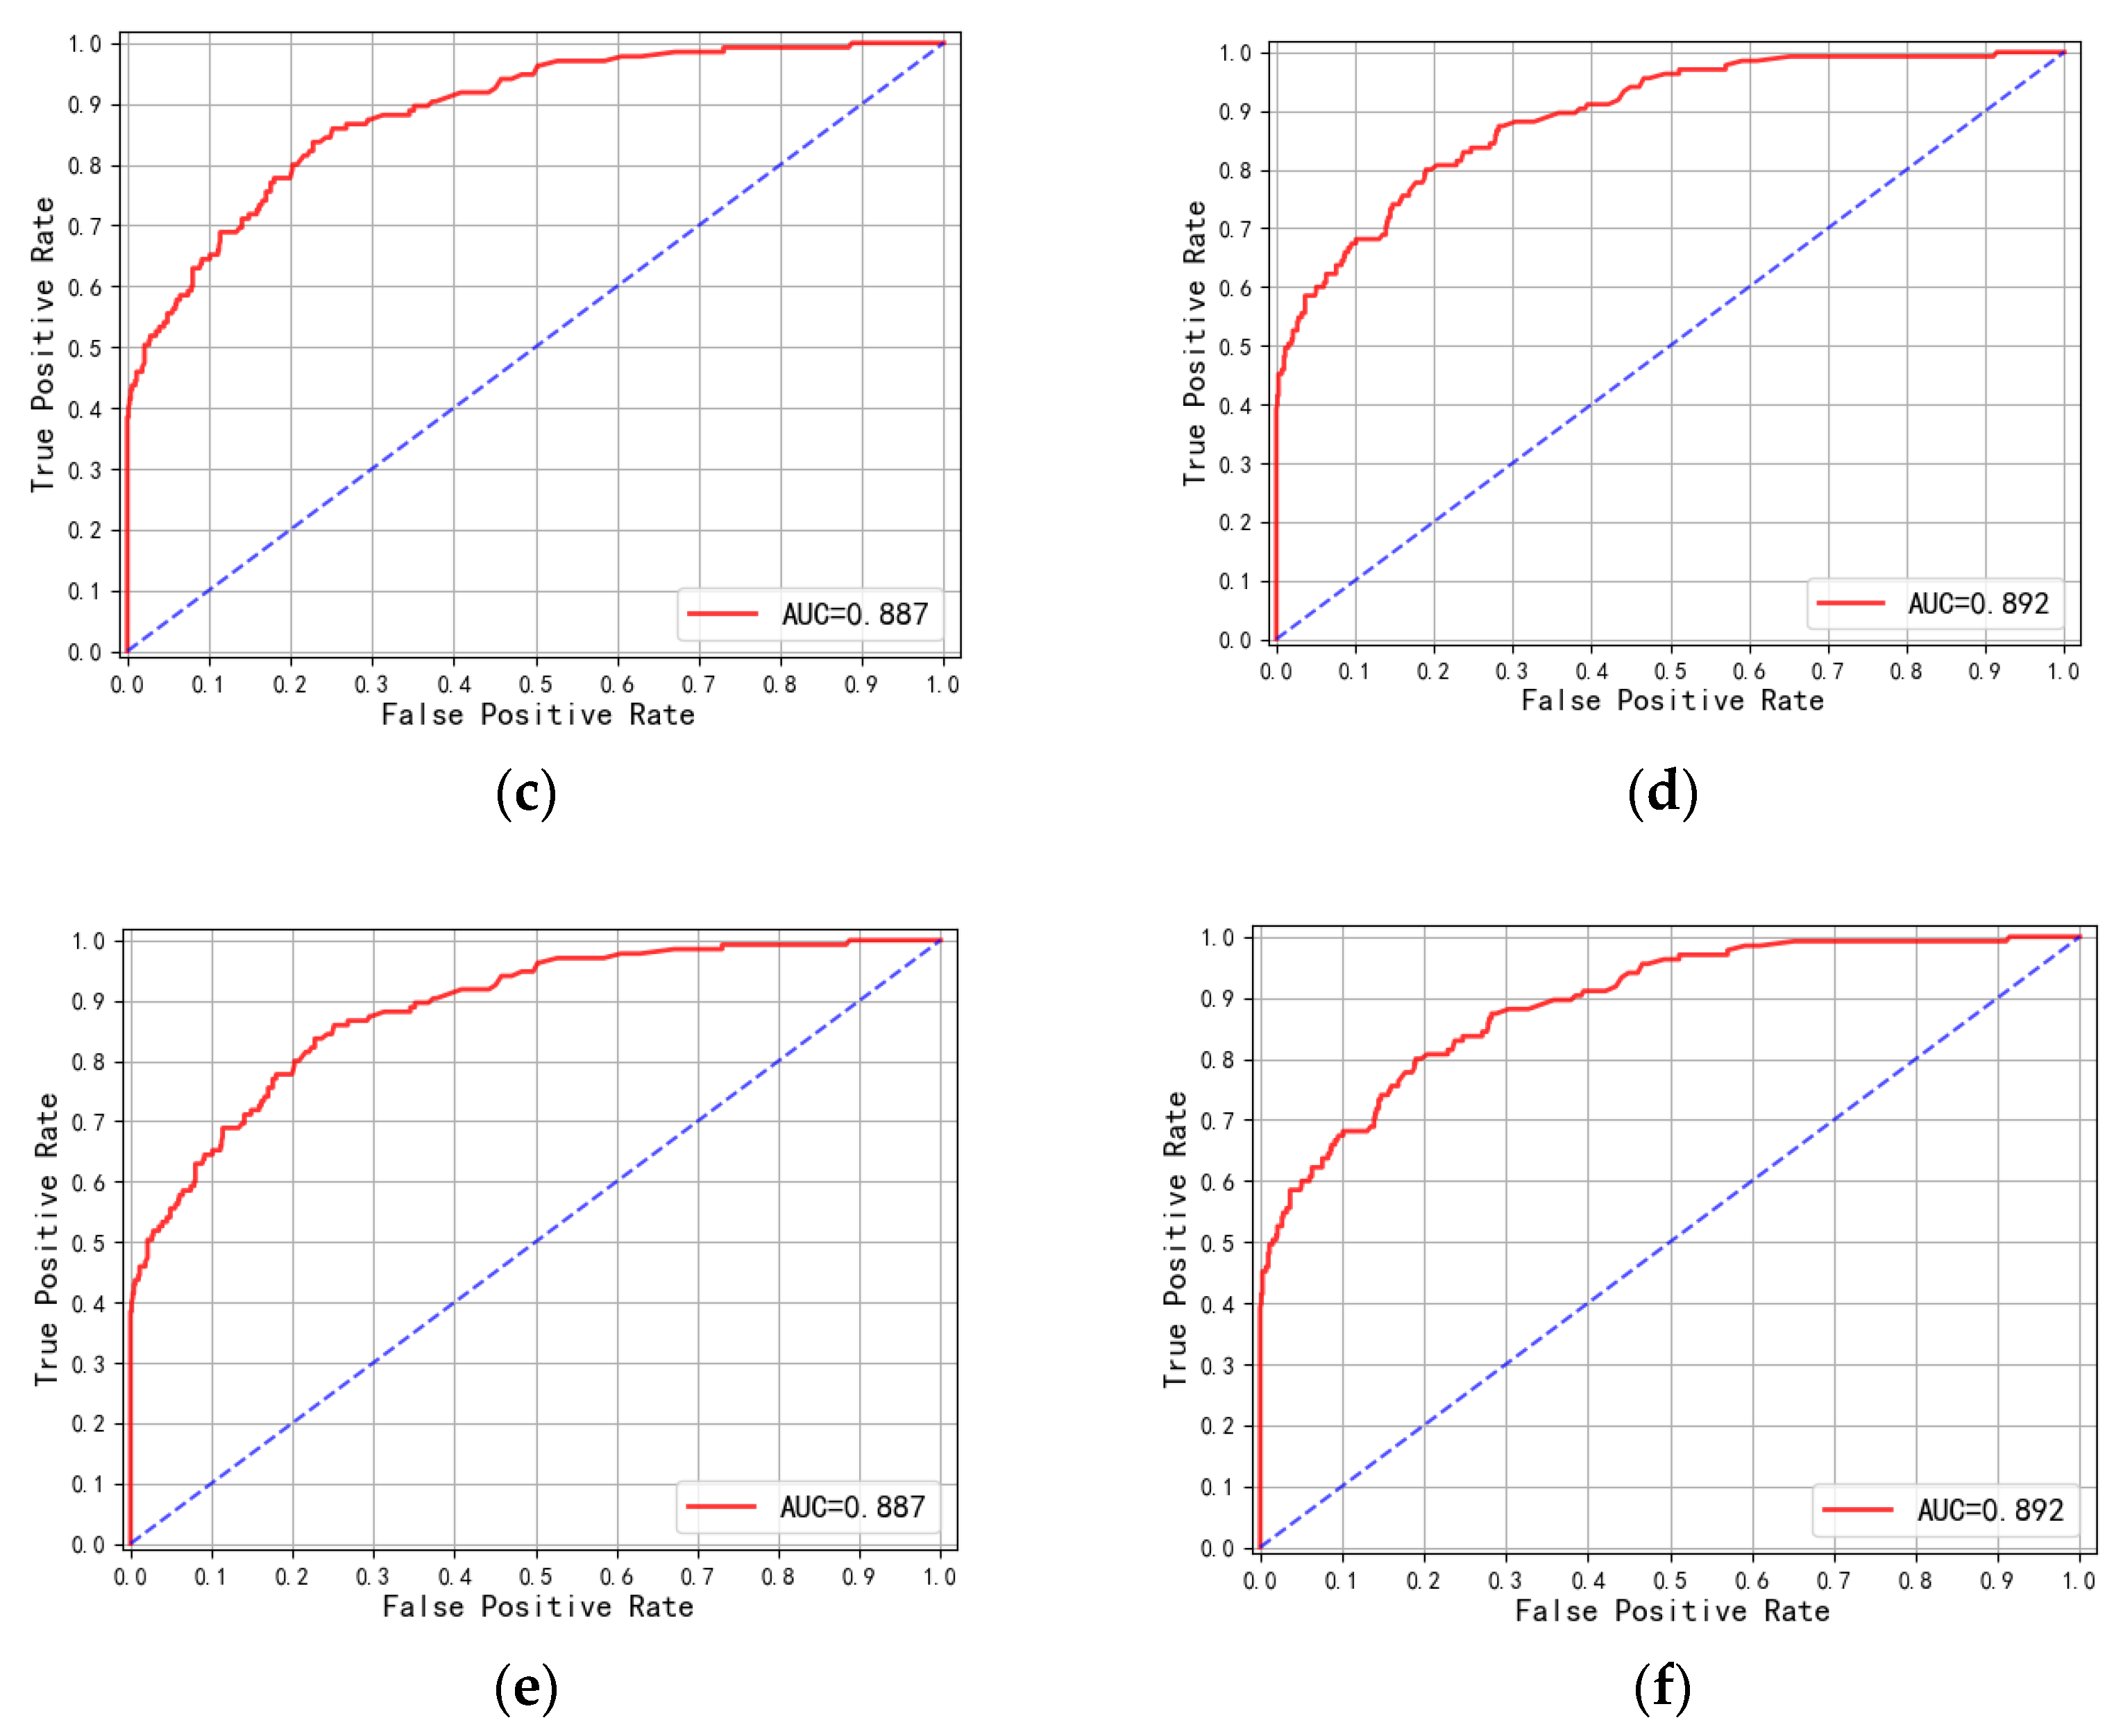
In addition, the ROC curves of the models with the AUC values are shown in Figure 7. Since the AUC values of all models are close to 1, it can be assumed that the goodness of fit of all models is good, i.e., the models have good predictions for the target variables. Because the results of each fit of the random forest are different, the ROC curves here are randomly selected results.
It can be found that the prediction accuracy of the model based on distraction classification of the driver’s gaze is higher than the prediction accuracy of the model based on secondary driving tasks. Moreover, the models that classified distractions predicted significantly better than the models that did not classify them. The results also prove that our classification based on the secondary driving tasks in Table 4 and Table 5 is valid.
For the comparison between the three models, the prediction accuracy of XGBoost is higher than that of AdaBoost and random forest. The prediction accuracy of all models is around 90%, demonstrating that AdaBoost, random forest, and XGBoost can all be used for event risk prediction with higher prediction accuracy. However, XGBoost shows superior performance.

5. Discussion

Driver distraction risk classification based on the driver’s gaze works well in accident occurrence prediction. For the visual behaviors of the drivers involved in the event, most drivers had a visual buffer of fewer than 2 s during the event. Some drivers had a visual buffer of 2 s but still had an event. This may be due to the fact that they are “mentally” distracted (daydreaming, lost in thought, etc.), even though they are looking ahead and maintaining a safe driving posture [53]. Therefore, the identification of distracted drivers also relies on the analysis of secondary driving tasks in some cases.
In the analysis of secondary driving tasks, we found that the driving subtasks that cause high-risk distraction are lost in thought, reading, and dialing hand-held cell phones, which are consistent with the findings of [54]. The odds ratio of lost in thought is 12.33, which is the largest. This suggests that lost in thought is the most dangerous secondary driving task. The secondary driving tasks of the medium and low-risk distraction are generally driver actions (dancing, eating, etc.) and most operations of in-car devices (adjusting the air conditioning, inserting or retrieving CDs, etc.). The secondary driving tasks of the no-risk distraction were mainly reflected in the driver’s verbal communication with others, either to themselves, to the passengers in the car, or over the phone, which is consistent with the findings of [55]. Moreover, similar to the findings of [56], smoking does not increase the risk of events. However, some of the current driver monitoring systems include driver smoking as one of the detection items, which can cause drivers to resent it.
Among the factors influencing the occurrence of events, we focused on the features in the model with the highest prediction accuracy, i.e., XGBoost. The results based on the distraction risk level classification of the driver’s gaze show that traffic density, relation to the junction, weather, and driver behavior are the four factors with more significant influence, which is consistent with the studies of [57,58]. In addition to the distracted drivers we mentioned in Section 2, which affects traffic safety, increased traffic density also increases the chance of accidents [59]. Collisions are also more likely to occur at the junction [60]. Compared to sunny weather, bad weather exposes drivers to a higher risk of road accidents [61] but may not increase the severity of accidents [62]. However, the results of this paper showed that road conditions had less influence on accident occurrence, which is contrary to the findings of [63]. It may be because the data from intercity rural roads were mainly analyzed in [63] and were relatively broad in scope. In contrast, the study area of the dataset used in this paper is only one region. The results of this paper show that the driver’s gender has a small effect on the occurrence of accidents, which is consistent with [64,65]. Although lighting has a negligible impact on accident occurrence in this paper, many studies suggest that poor lighting increases the probability of accidents. Wanvik suggested that accident risk increases by 145% on unlit rural roads, while the value of accident risk increases by 17% on lit rural roads [66]. Yannis found that road lighting helps reduce accidents, and the absence of street lighting at night significantly impacted the number of fatalities and serious injuries [67]. Therefore, we cannot ignore the importance of lighting.
All models have AUC values close to 0.9, i.e., these models have good prediction results. AUC is scale-invariant and classification-threshold-invariant. However, AUC is not always desirable. For example, we cannot obtain accurate prediction probability output from the AUC values. In terms of prediction accuracy, models based on distraction classification of driver’s gaze are higher than models based on secondary driving tasks. The prediction accuracy of the model with classifications of distractions is significantly better than those of the model without classification, which also means that the two methods we proposed for classifying driver distraction risk levels are reliable. We compared the model prediction accuracy of two articles that used the same dataset as this paper, as shown in Table 12. The results show that our models are better, and the accuracy of XGBoost can achieve 90.67%.

6. Conclusions and Future Works

This paper was based on naturalistic driving data for processing and analysis. After processing the natural driving study data, the driver distraction risk levels were first classified in terms of the driver’s gaze and secondary driving tasks. We analyzed drivers’ vision changes based on the AttenD algorithm using the concept of visual buffers. When applying this algorithm, we proposed the driver’s incomplete distraction state and finally classified the distraction risk as high-risk, medium-risk, and low-risk according to the driver’s different distraction states during the event period. For secondary driving tasks, the distraction risk levels were classified into six levels using the concept of odds ratio combined with a confidence limit of 95%, according to the case–control study in the medical field. The six levels were high-risk, medium-risk, low-risk, no-risk, relatively dangerous, and relatively safe. It should be noted that the driver distraction risk levels determined by the classification were the result of a comparison with undistracted samples. After that, the results of two distraction classifications, driver characters, and road environment factors were used as influencing factors to predict the traffic accident risks using random forest, AdaBoost, and XGBoost. Furthermore, the results of distraction classification based on the driver’s gaze had a higher prediction accuracy than the model using distraction classifications of secondary driving tasks. Moreover, the models that classified distraction risk levels predicted significantly better than those that did not classify them. The accuracy of all three machine learning models was about 90%, but XGBoost showed superior performance. Compared with previous studies using the same dataset as this paper, the prediction accuracy of the three models based on driver distraction classification in this paper is higher than that in previous studies. In other words, the two driver distraction classification methods proposed in this paper are valid.
The classification of driver distraction risk levels in this paper can be used for the monitoring and early warning of driver distraction states. When different sensors are used to monitor driver distraction, if drivers’ movements can be collected through videos, their distraction risk levels can be discerned based on the classification of the secondary driving tasks in this paper. Suppose that drivers’ eye movements can be collected using devices such as eye-tracking devices; in that case, the distracted driver risk levels can be discriminated against based on the classification of the driver’s gaze in this paper. In different situations, we can use and select two types of monitoring devices for distraction classification, considering the cost-benefit effect. This paper provides theoretical support for proactive intervention in traffic safety. The results can be used for accident risk prediction and graded warnings based on the classification of distraction risk levels.
There are also some limits in this paper. Due to the limitations of the dataset, we lack more comprehensive information on drivers’ emotions, driving age, and driving hours, which may also influence the occurrence of accidents. In future work, we can consider vehicle characteristics as influencing factors and explore the correlation among the influencing factors.

Author Contributions

Conceptualization, L.Z., Y.Z. and T.D.; methodology, Y.Z. and F.M.; software, Y.Z.; validation, Y.Z., Y.L. and S.C.; formal analysis, Y.Z.; investigation, L.Z.; resources, L.Z.; data curation, Y.Z.; writing—original draft preparation, Y.Z.; writing—review and editing, Y.Z.; visualization, Y.Z. and F.M.; supervision, L.Z.; project administration, L.Z. and T.D.; funding acquisition, L.Z. All authors have read and agreed to the published version of the manuscript.

Funding

This research was funded by the National Key R&D Program of China [2021YFC3001500]; Scientific and Technological Developing Scheme of Jilin Province [20200403049SF]; the Graduate Innovation Fund of Jilin University [2022156].

Institutional Review Board Statement

Not applicable.

Informed Consent Statement

Not applicable.

Data Availability Statement

The data presented in this study are openly available in [VTTI Data Warehouse] at [https://doi.org/10.15787/VTT1/CEU6RB].

Conflicts of Interest

The authors declare no conflict of interest.

References

  1. Siya, A.; Ssentongo, B.; Abila, D.B.; Kato, A.M.; Onyuth, H.; Mutekanga, D.; Ongom, I.; Aryampika, E.; Lukwa, A.T. Perceived factors associated with boda-boda (motorcycle) accidents in Kampala, Uganda. Traffic Inj. Prev. 2019, 20, S133–S136. [Google Scholar] [CrossRef] [PubMed]
  2. NHTSA’s National Center for Statistics and Analysis. Distracted Driving 2020 (Research Note. Report No. DOT HS 813 309). Available online: https://crashstats.nhtsa.dot.gov/Api/Public/ViewPublication/813309 (accessed on 5 December 2022).
  3. Liberty, E.; Mazzae, E.; Garrott, W.; Goodman, M. NHTSA Driver Distraction Research: Past Present and Future. In Proceedings of the 17th International Technical Conference on the Enhanced Safety of Vehicles, Amsterdam, The Netherlands, 4–7 June 2001. [Google Scholar]
  4. Jegham, I.; Ben Khalifa, A.; Alouani, I.; Mahjoub, M.A. A novel public dataset for multimodal multiview and multispectral driver distraction analysis: 3MDAD. Signal Process. Image Commun. 2020, 88, 115960. [Google Scholar] [CrossRef]
  5. Wester, A.E.; Bockner, K.B.E.; Volkerts, E.R.; Verster, J.C.; Kenemans, J.L. Event-related potentials and secondary task. performance during simulated driving. Accid. Anal. Prev. 2008, 40, 1–7. [Google Scholar] [CrossRef] [PubMed] [Green Version]
  6. Yang, S.; Kuo, J.; Lenné, M.G. Effects of Distraction in On-Road Level 2 Automated Driving: Impacts on Glance Behavior and Takeover Performance. Hum. Factors 2021, 63, 1485–1497. [Google Scholar] [CrossRef] [PubMed]
  7. Harbluk, J.L.; Noy, Y.I.; Trbovich, P.L.; Eizenman, M. An on-road assessment of cognitive distraction: Impacts on drivers’ visual behavior and braking performance. Accid. Anal. Prev. 2007, 39, 372–379. [Google Scholar] [CrossRef]
  8. Su, L.; Sun, C.; Cao, D.; Khajepour, A. Efficient Driver Anomaly Detection via Conditional Temporal Proposal and Classification Network. IEEE Trans. Comput. Soc. Syst. 2022, 1–10. [Google Scholar] [CrossRef]
  9. Raouf, I.; Khan, A.; Khalid, S.; Sohail, M.; Azad, M.M.; Kim, H.S. Sensor-Based Prognostic Health Management of Advanced Driver Assistance System for Autonomous Vehicles: A Recent Survey. Mathematics 2022, 10, 3233. [Google Scholar] [CrossRef]
  10. Rogers, M.; Zhang, Y.; Kaber, D.; Liang, Y.; Gangakhedkar, S. The Effects of Visual and Cognitive Distraction on Driver Situation Awareness; Springer: Berlin/Heidelberg, Germany, 2011; pp. 186–195. [Google Scholar]
  11. Gao, J.; Davis, G.A. Using naturalistic driving study data to investigate the impact of driver distraction on driver’s brake reaction time in freeway rear-end events in car-following situation. J. Saf. Res. 2017, 63, 195–204. [Google Scholar] [CrossRef]
  12. Kashevnik, A.; Shchedrin, R.; Kaiser, C.; Stocker, A. Driver Distraction Detection Methods: A Literature Review and Framework. IEEE Access 2021, 9, 60063–60076. [Google Scholar] [CrossRef]
  13. Chand, A.; Bhasi, A.B. Effect of Driver Distraction Contributing Factors on Accident Causations—A Review. AIP Conf. Proc. 2019, 2134, 060004. [Google Scholar] [CrossRef]
  14. Elvik, R. Effects of Mobile Phone Use on Accident Risk Problems of Meta-Analysis When Studies Are Few and Bad. Transp. Res. Rec. 2011, 2236, 20–26. [Google Scholar] [CrossRef]
  15. Drews, F.A.; Pasupathi, M.; Strayer, D.L. Passenger and cell phone conversations in simulated driving. J. Exp. Psychol. Appl. 2008, 14, 392–400. [Google Scholar] [CrossRef] [PubMed]
  16. Choudhary, P.; Velaga, N.R. Performance Degradation During Sudden Hazardous Events: A Comparative Analysis of Use of a Phone and a Music Player During Driving. Ieee Trans. Intell. Transp. Syst. 2019, 20, 4055–4065. [Google Scholar] [CrossRef]
  17. Pettitt, M.; Burnett, G.; Stevens, A. Defining Driver Distraction. In Proceedings of the 12th World Congress on Intelligent Transport Systems, San Francisco, CA, USA, 6–10 November 2005. [Google Scholar]
  18. Wu, Q. An Overview of Driving Distraction Measure Methods. In Proceedings of the 10th IEEE International Conference on Computer-Aided Industrial Design and Conceptual Design, Wenzhou, China, 26–29 November 2009; pp. 2391–2394. [Google Scholar]
  19. Yekhshatyan, L.; Lee, J.D. Changes in the Correlation Between Eye and Steering Movements Indicate Driver Distraction. IEEE Trans. Intell. Transp. Syst. 2013, 14, 136–145. [Google Scholar] [CrossRef]
  20. Miyaji, M.; Kawanaka, H.; Oguri, K. Driver’s cognitive distraction detection using physiological features by the adaboost. In Proceedings of the 2009 12th International IEEE Conference on Intelligent Transportation Systems, St Louis, MO, USA, 4–7 October 2009; pp. 1–6. [Google Scholar]
  21. Tivesten, E.; Dozza, M. Driving context and visual-manual phone tasks influence glance behavior in naturalistic driving. Transp. Res. Part F-Traffic Psychol. Behav. 2014, 26, 258–272. [Google Scholar] [CrossRef] [Green Version]
  22. Victor, T.; Dozza, M.; Bärgman, J.; Boda, C.-N.; Engström, J.; Markkula, G. Analysis of Naturalistic Driving Study Data: Safer Glances, Driver Inattention, and Crash Risk; TRB: Washington, DC, USA, 2014. [Google Scholar]
  23. Sodhi, M.; Reimer, B.; Llamazares, I. Glance analysis of driver eye movements to evaluate distraction. Behav. Res. Methods Instrum. Comput. 2002, 34, 529–538. [Google Scholar] [CrossRef] [Green Version]
  24. Strayer, D.L.; Turrill, J.; Cooper, J.M.; Coleman, J.R.; Medeiros-Ward, N.; Biondi, F. Assessing Cognitive Distraction in the Automobile. Human Factors 2015, 57, 1300–1324. [Google Scholar] [CrossRef] [Green Version]
  25. Kong, X.; Das, S.; Zhang, Y. Mining patterns of near-crash events with and without secondary tasks. Accid. Anal. Prev. 2021, 157, 106162. [Google Scholar] [CrossRef]
  26. Carney, C.; Harland, K.K.; McGehee, D.V. Using event-triggered naturalistic data to examine the prevalence of teen driver distractions in rear-end crashes. J. Saf. Res. 2016, 57, 47–52. [Google Scholar] [CrossRef]
  27. Neyens, D.M.; Boyle, L.N. The effect of distractions on the crash types of teenage drivers. Accid. Anal. Prev. 2007, 39, 206–212. [Google Scholar] [CrossRef]
  28. Liang, O.S.; Yang, C.S.C. Determining the risk of driver-at-fault events associated with common distraction types using naturalistic driving data. J. Saf. Res. 2021, 79, 45–50. [Google Scholar] [CrossRef] [PubMed]
  29. Pešić, D.; Pešić, D.; Trifunović, A.; Čičević, S. Application of Logistic Regression Model to Assess the Impact of Smartwatch on Improving Road Traffic Safety: A Driving Simulator Study. Mathematics 2022, 10, 1403. [Google Scholar] [CrossRef]
  30. Xing, Y.; Lv, C.; Wang, H.; Cao, D.; Velenis, E.; Wang, F.Y. Driver Activity Recognition for Intelligent Vehicles: A Deep Learning Approach. IEEE Trans. Veh. Technol. 2019, 68, 5379–5390. [Google Scholar] [CrossRef] [Green Version]
  31. Bharadwaj, N.; Edara, P.; Sun, C. Sleep disorders and risk of traffic crashes: A naturalistic driving study analysis. Saf. Sci. 2021, 140, 105295. [Google Scholar] [CrossRef]
  32. Kircher, K.; Ahlström, C. Issues Related to the Driver Distraction Detection Algorithm AttenD. In Proceedings of the 1st International Conference on Driver Distraction and Inattention (DDI 2009), Gothenburg, Sweden, 28–29 September 2009. [Google Scholar]
  33. Ahlstrom, C.; Georgoulas, G.; Kircher, K. Towards a Context-Dependent Multi-Buffer Driver Distraction Detection Algorithm. IEEE Trans. Intell. Transp. Syst. 2022, 23, 4778–4790. [Google Scholar] [CrossRef]
  34. Yao, Y.; Zhao, X.H.; Feng, X.F.; Rong, J. Assessment of Secondary Tasks Based on Drivers’ Eye-Movement Features. IEEE Access 2020, 8, 136108–136118. [Google Scholar] [CrossRef]
  35. Jenkins, S.; Codjoe, J.; Alecsandru, C.; Ishak, S. Exploration of the SHRP 2 NDS: Development of a Distracted Driving Prediction Model. In Proceedings of the Advances in Human Aspects of Transportation, Cham, Germany, 7 July 2016; pp. 231–242. [Google Scholar]
  36. Dupépé, E.B.; Kicielinski, K.P.; Gordon, A.S.; Walters, B.C. What is a Case-Control Study? Neurosurgery 2019, 84, 819–826. [Google Scholar] [CrossRef]
  37. Yang, L.; Aghaabbasi, M.; Ali, M.; Jan, A.; Bouallegue, B.; Javed, M.F.; Salem, N.M. Comparative Analysis of the Optimized KNN, SVM, and Ensemble DT Models Using Bayesian Optimization for Predicting Pedestrian Fatalities: An Advance towards Realizing the Sustainable Safety of Pedestrians. Sustainability 2022, 14, 10467. [Google Scholar] [CrossRef]
  38. Chen, F.; Chen, S.; Ma, X. Analysis of hourly crash likelihood using unbalanced panel data mixed logit model and real-time driving environmental big data. J. Saf. Res. 2018, 65, 153–159. [Google Scholar] [CrossRef]
  39. Chen, L.H.; Wang, P. Risk Factor Analysis of Traffic Accident for Different Age Group Based on Adaptive Boosting. In Proceedings of the 4th International Conference on Transportation Information and Safety (ICTIS), Banff, Canada, 8–10 August 2017; pp. 812–817. [Google Scholar]
  40. Malik, S.; El Sayed, H.; Khan, M.A.; Khan, M.J. Road Accident Severity Prediction—A Comparative Analysis of Machine Learning Algorithms. In Proceedings of the IEEE Global Conference on Artificial Intelligence and Internet of Things (GCAIoT), Dubai, The United Arab Emirates, 12–16 December 2021; pp. 69–74. [Google Scholar]
  41. Osman, O.; Hajij, M.; Bakhit, P.; Ishak, S. Prediction of Near-Crashes from Observed Vehicle Kinematics using Machine Learning. Transp. Res. Rec. J. Transp. Res. Board 2019, 2673, 036119811986262. [Google Scholar] [CrossRef]
  42. Mokoatle, M.; Marivate, D.; Bukohwo, E. Predicting Road Traffic Accident Severity using Accident Report Data in South Africa. In Proceedings of the 20th Annual International Conference on Digital Government Research, New York, NY, USA, 18–20 June 2019; pp. 11–17. [Google Scholar]
  43. Guo, F.; Fang, Y.J. Individual driver risk assessment using naturalistic driving data. Accid. Anal. Prev. 2013, 61, 3–9. [Google Scholar] [CrossRef] [PubMed]
  44. Xiong, X.; Chen, L.; Liang, J. Analysis of Roadway Traffic Accidents Based on Rough Sets and Bayesian Networks. PROMET-Traffic Transp. 2018, 30, 71. [Google Scholar] [CrossRef]
  45. Australian Bureau of Statistics. Age Standard. Available online: https://www.abs.gov.au/statistics/standards/age-standard/latest-release#cite-window1 (accessed on 5 December 2022).
  46. Ma, Z.; Shao, C.; Yue, H.; Ma, S. Analysis of the Logistic Model for Accident Severity on Urban Road Environment. In Proceedings of the 2009 IEEE Intelligent Vehicles Symposium, Xi’an, China, 3–5 June 2009; pp. 983–987. [Google Scholar]
  47. Noland, R.B.; Oh, L. The effect of infrastructure and demographic change on traffic-related fatalities and crashes: A case study of Illinois county-level data. Accid. Anal. Prev. 2004, 36, 525–532. [Google Scholar] [CrossRef]
  48. Hyodo, S.; Hasegawa, K. Factors Affecting Analysis of the Severity of Accidents in Cold and Snowy Areas Using the Ordered Probit Model. Asian Transp. Stud. 2021, 7, 100035. [Google Scholar] [CrossRef]
  49. Usman, T.; Fu, L.; Miranda-Moreno, L.F. Quantifying safety benefit of winter road maintenance: Accident frequency modeling. Accid. Anal. Prev. 2010, 42, 1878–1887. [Google Scholar] [CrossRef] [PubMed]
  50. Khorashadi, A.; Niemeier, D.; Shankar, V.; Mannering, F. Differences in rural and urban driver-injury severities in accidents involving large-trucks: An exploratory analysis. Accid. Anal. Prev. 2005, 37, 910–921. [Google Scholar] [CrossRef]
  51. Chimba, D.; Sando, T.; Kwigizile, V. Effect of bus size and operation to crash occurrences. Accid. Anal. Prev. 2010, 42, 2063–2067. [Google Scholar] [CrossRef]
  52. Awan, H.H.; Hussain, A.; Javed, M.F.; Qiu, Y.J.; Alrowais, R.; Mohamed, A.M.; Fathi, D.; Alzahrani, A.M. Predicting Marshall Flow and Marshall Stability of Asphalt Pavements Using Multi Expression Programming. Buildings 2022, 12, 314. [Google Scholar] [CrossRef]
  53. Eraqi, H.M.; Abouelnaga, Y.; Saad, M.H.; Moustafa, M.N. Driver Distraction Identification with an Ensemble of Convolutional Neural Networks. J. Adv. Transp. 2019, 2019, 4125865. [Google Scholar] [CrossRef]
  54. Klauer, S.; Neale, V.; Dingus, T.; Ramsey, D.; Sudweeks, J. Driver Inattention: A Contributing Factor to Crashes and Near-Crashes. Proc. Hum. Factors Ergon. Soc. Annu. Meet. 2005, 49, 1922–1926. [Google Scholar] [CrossRef]
  55. Née, M.; Contrand, B.; Orriols, L.; Gil-Jardiné, C.; Galéra, C.; Lagarde, E. Road safety and distraction, results from a responsibility case-control study among a sample of road users interviewed at the emergency room. Accid. Anal. Prev. 2019, 122, 19–24. [Google Scholar] [CrossRef] [PubMed]
  56. Violanti, J.M.; Marshall, J.R. Cellular phones and traffic accidents: An epidemiological approach. Accid. Anal. Prev. 1996, 28, 265–270. [Google Scholar] [CrossRef] [PubMed]
  57. Mousa, S.R.; Bakhit, P.R.; Ishak, S. An extreme gradient boosting method for identifying the factors contributing to crash/near-crash events: A naturalistic driving study. Can. J. Civ. Eng. 2019, 46, 712–721. [Google Scholar] [CrossRef]
  58. Naji, H.A.H.; Xue, Q.; Lyu, N.; Wu, C.; Zheng, K. Evaluating the Driving Risk of Near-Crash Events Using a Mixed-Ordered Logit Model. Sustainability 2018, 10, 2868. [Google Scholar] [CrossRef] [Green Version]
  59. Akalin, K.B.; Karacasu, M.; Altin, A.Y.; Ergul, B. Curve Estimation of Number of People Killed in Traffic Accidents in Turkey. In Proceedings of the World Multidisciplinary Earth Sciences symposium (WMESS), Prague, Czech Republic, 5–9 September 2016. [Google Scholar]
  60. Clarke, D.D.; Ward, P.; Bartle, C.; Truman, W. The role of motorcyclist and other driver behaviour in two types of serious accident in the UK. Accid. Anal. Prev. 2007, 39, 974–981. [Google Scholar] [CrossRef]
  61. Fior, J.; Cagliero, L. Correlating Extreme Weather Conditions With Road Traffic Safety: A Unified Latent Space Model. IEEE Access 2022, 10, 73005–73018. [Google Scholar] [CrossRef]
  62. Edwards, J.B. The relationship between road accident severity and recorded weather. J. Saf. Res. 1998, 29, 249–262. [Google Scholar] [CrossRef]
  63. Jamal, A.; Zahid, M.; Tauhidur Rahman, M.; Al-Ahmadi, H.M.; Almoshaogeh, M.; Farooq, D.; Ahmad, M. Injury severity prediction of traffic crashes with ensemble machine learning techniques: A comparative study. Int. J. Inj. Contr. Saf. Promot. 2021, 28, 408–427. [Google Scholar] [CrossRef]
  64. Janicak, C.A. Differences in relative risks for fatal occupational highway transportation accidents. J. Saf. Res. 2003, 34, 539–545. [Google Scholar] [CrossRef]
  65. Zhang, R.; Qu, X. The effects of gender, age and personality traits on risky driving behaviors. J. Shenzhen Univ. Sci. Eng. 2016, 33, 646. [Google Scholar] [CrossRef]
  66. Wanvik, P.O. Effects of road lighting: An analysis based on Dutch accident statistics 1987–2006. Accid. Anal. Prev. 2009, 41, 123–128. [Google Scholar] [CrossRef] [PubMed]
  67. Yannis, G.; Kondyli, A.; Mitzalis, N. Effect of lighting on frequency and severity of road accidents. Proc. Inst. Civ. Eng.-Transp. 2013, 166, 271–281. [Google Scholar] [CrossRef]
  68. Xiong, X.X.; Chen, L.; Liang, J. Vehicle Driving Risk Prediction Based on Markov Chain Model. Discret. Dyn. Nat. Soc. 2018, 2018, 4954621. [Google Scholar] [CrossRef]
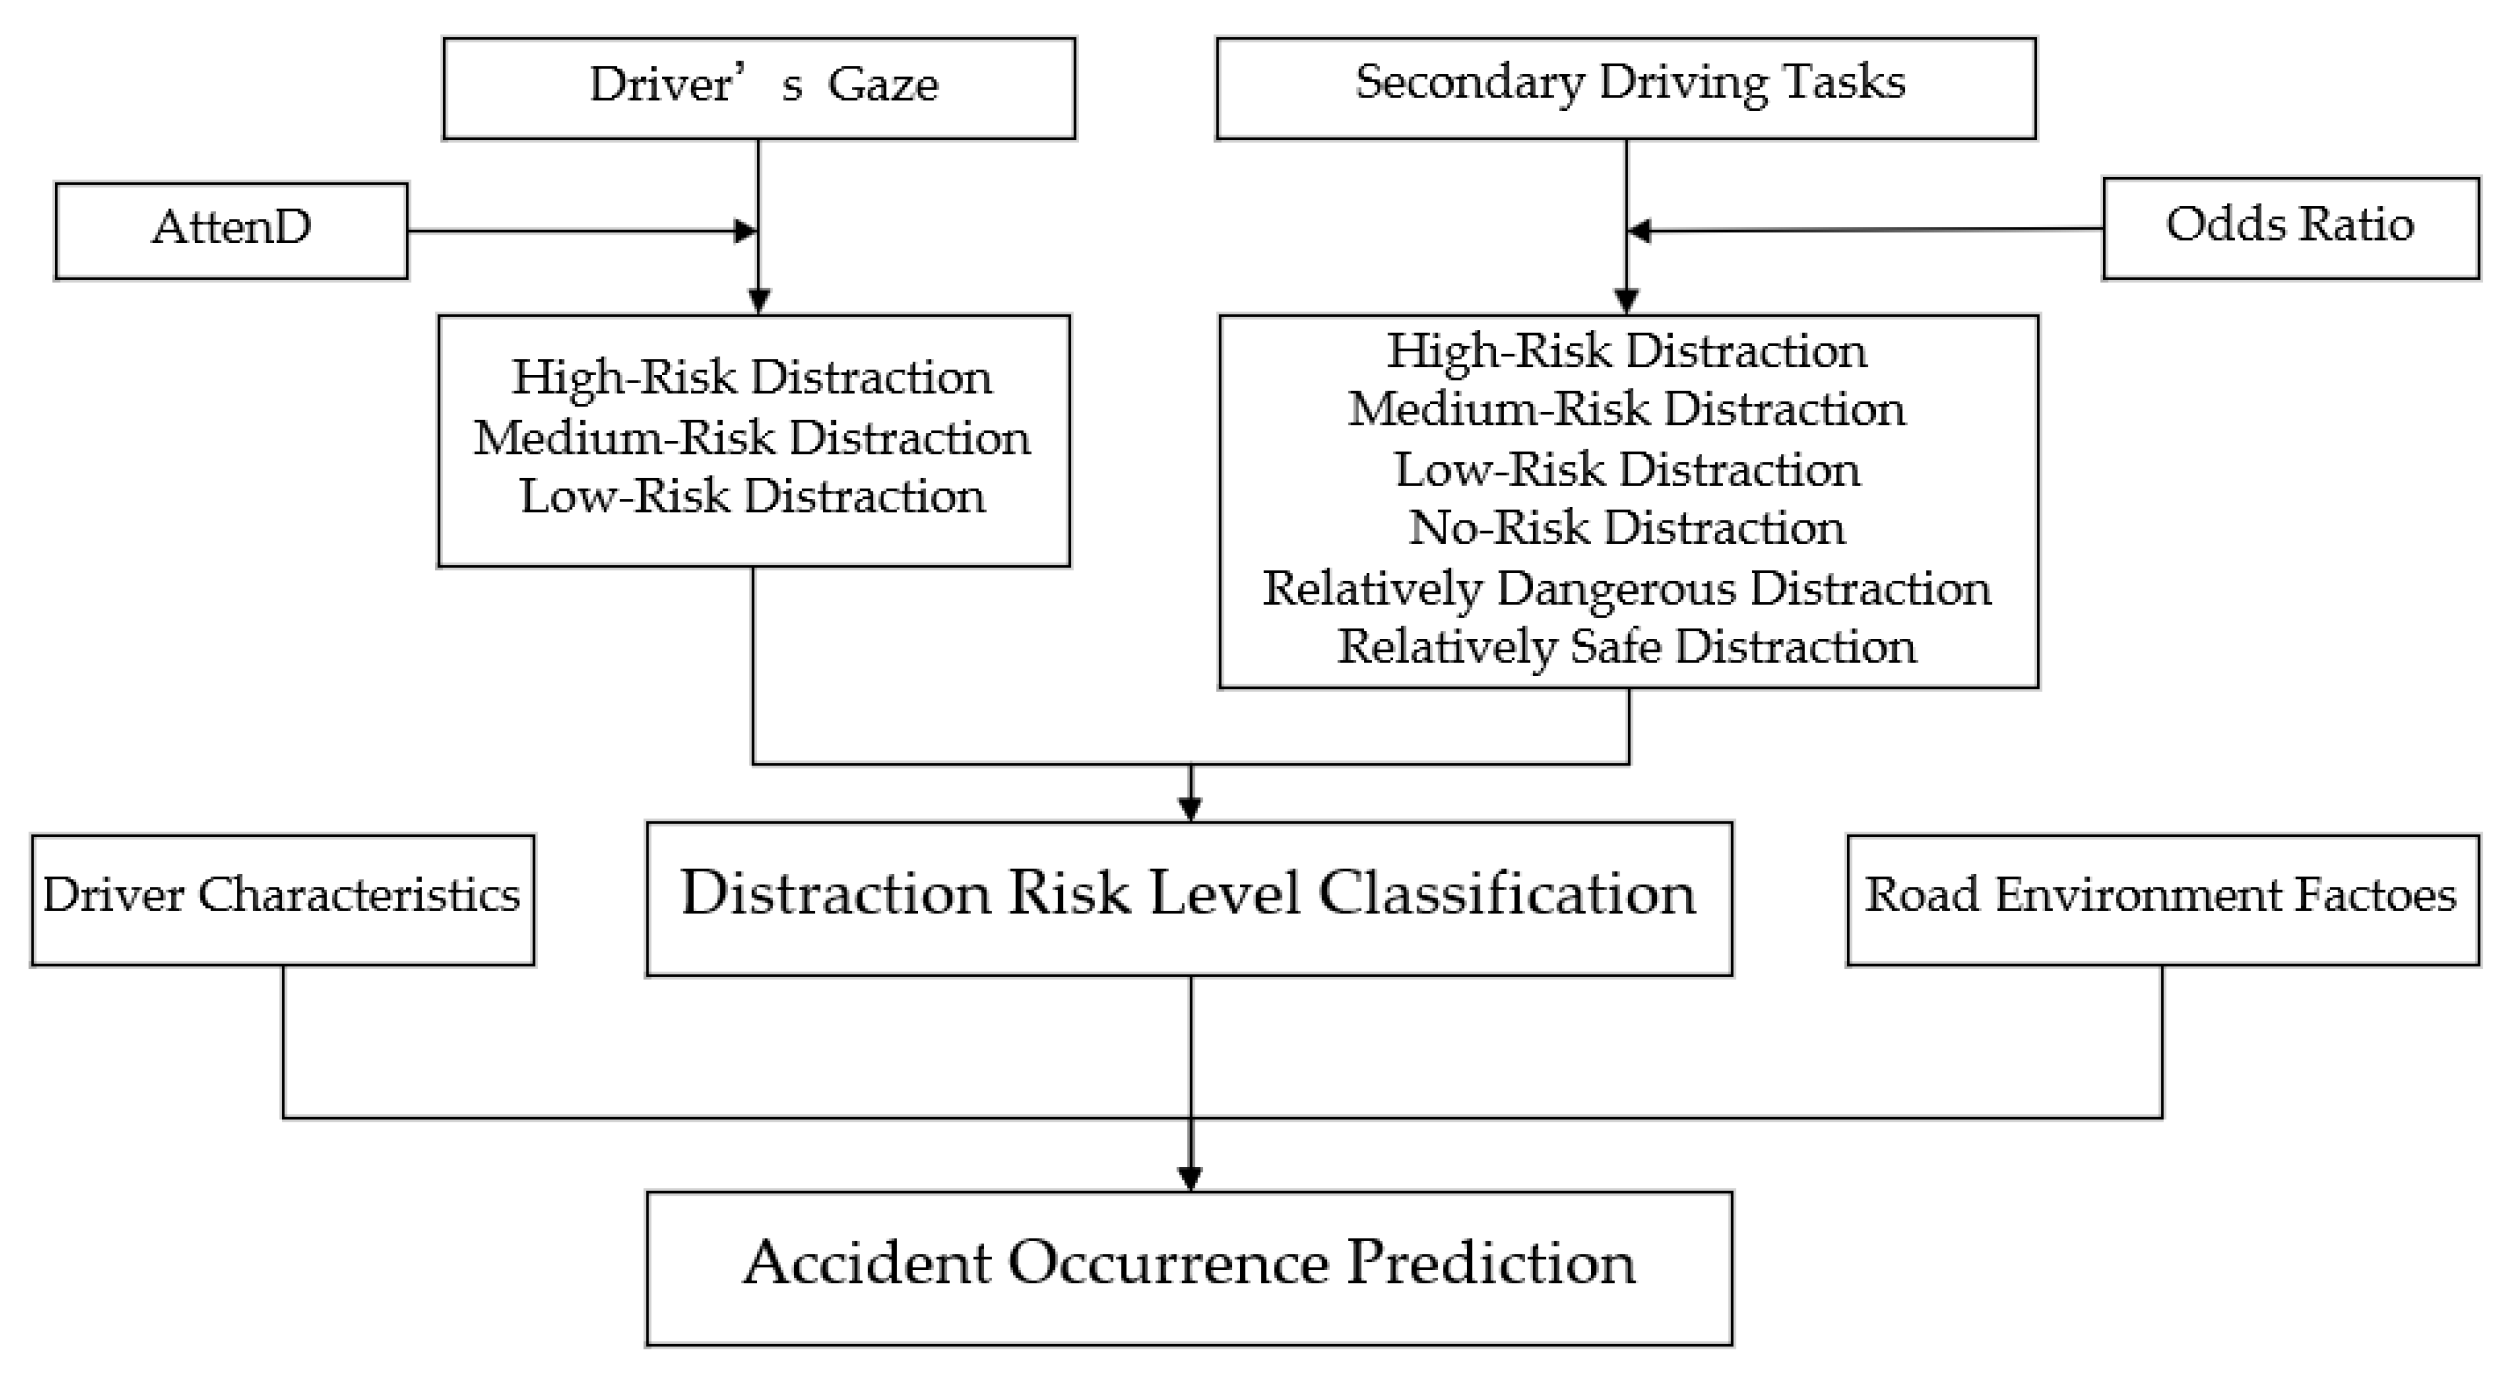
Figure 1. Logical framework.
Mathematics 10 04806 g001
Figure 2. Changes in drivers’ visual buffers and distractions in different IDs: (a) EventID 8296 Driver Visual Buffer; (b) EventID 8501 Driver Visual Buffer; (c) BaselineID 10,083 Driver Visual Buffer; (d) BaselineID 17,626 Driver Visual Buffer.
Mathematics 10 04806 g002aMathematics 10 04806 g002b
Figure 3. Changes in drivers’ visual buffer and distractions in different IDs: (a) EventID 8297 Driver Visual Buffer; (b) BaselineID 17,827 Driver Visual Buffer.
Mathematics 10 04806 g003
Figure 4. Driver age distribution.
Mathematics 10 04806 g004
Figure 5. AUC values for different combinations of hyperparameters in Random Forest, AdaBoost, and XGBoost: (a) gaze—random forest; (b) secondary driving task—random forest; (c) gaze—AdaBoost; (d) secondary driving task—AdaBoost; (e) gaze—XGBoost; (f) secondary driving task—XGBoost.
Mathematics 10 04806 g005aMathematics 10 04806 g005b
Figure 6. Importance of model feature: (a) gaze—random forest; (b) secondary driving task—random forest; (c) gaze—AdaBoost; (d) secondary driving task—AdaBoost; (e) gaze—XGBoost; (f) secondary driving task—XGBoost.
Mathematics 10 04806 g006aMathematics 10 04806 g006b
Figure 7. ROC curves and AUC values of random forest, AdaBoost, XGBoost: (a) gaze—random forest; (b) secondary driving task—random forest; (c) gaze—AdaBoost; (d) secondary driving task—AdaBoost; (e) gaze—XGBoost; (f) secondary driving task—XGBoost.
Mathematics 10 04806 g007aMathematics 10 04806 g007b
Table 1. Gaze location category.
CategoryGaze LocationDefinitions
AheadForwardAny glance out the straight forward windshield. When the vehicle is turning, these glances may not be directed straight forward but toward the vehicle’s heading.
Left ForwardAny glance out the left forward windshield.
Right ForwardAny glance out the right forward windshield.
Right WindowAny glance to the right side window.
Left WindowAny glance to the left side window.
Non-driving NeedsEyes ClosedAny time that the participant’s eyes are closed outside of normal blinking.
Cell PhoneAny glance at a cell phone, no matter where it is located.
Interior ObjectAny glance at an identifiable object in the vehicle other than a cell phone.
PassengerAny glance to a passenger, whether in the front seat or rear seat of the vehicle.
Center StackAny glance at the vehicle’s center stack.
Driving NeedsInstrument clusterAny glance to the instrument cluster underneath the dashboard.
Rearview mirrorAny glance to the rearview mirror or equipment located around it.
Left MirrorAny glance to the left side mirror.
Right MirrorAny glance to the right side mirror.
Table 2. Number of secondary driving task.
No.Secondary Driving TaskCountPercentage
1Lost in thought60.06%
2Reading620.60%
3Dialing hand-held cell phone1051.02%
4Talking/singing5935.76%
5Smoking cigar/cigarette2031.97%
6Biting nails/cuticles1010.98%
7Passenger in adjacent seat149914.55%
8Talking/listening on cell phone8978.71%
9Adjusting radio4374.24%
10Adjusting other devices integral to vehicle1561.51%
11Other external distraction5074.92%
12Inattention to the Forward Roadway Left mirror7877.64%
13Inattention to the Forward Roadway Center mirror162815.80%
14Inattention to the Forward Roadway Right mirror2062.00%
15Eating without utensils2302.23%
16Drinking with lid and straw300.29%
17Drinking from an open container550.53%
18Combing/brushing/fixing hair570.55%
19Other personal hygiene2472.40%
20Passenger in rear seat580.56%
21Child in rear seat350.34%
22Reaching for object (not cell phone)1411.37%
23Cell phone-Other850.83%
24Adjusting climate control610.59%
25Inattention to the Forward Roadway Left window8298.05%
26Dancing420.41%
27Cognitive-Other190.18%
28Applying make-up460.45%
29Moving object in vehicle80.08%
30Animal/Object in Vehicle-- Other2011.95%
31Locating/reaching/answering cell phone180.17%
32Operating PDA50.05%
33Inserting/retrieving CD50.05%
34Looking at pedestrian130.13%
35Inattention to the Forward Roadway Right window3032.94%
36Eating with utensils2302.23%
37Reaching for cigar/cigarette90.09%
38Lighting cigar/cigarette100.10%
39Shaving10.01%
40Brushing/flossing teeth240.23%
41Removing/adjusting jewelry140.14%
42Removing/inserting contact lenses100.10%
43fatigue4584.45%
44Child in adjacent seat30.03%
45Pet in vehicle70.07%
46Dialing hand-held cell phone using quick keys10.01%
47Dialing hands-free cell phone using voice-activated software10.01%
48PDA-other30.03%
49Viewing PDA10.01%
50Inserting/retrieving cassette20.02%
51Looking at an object670.65%
52Distracted by construction30.03%
53Looked but did not see20.02%
54Insect in vehicle10.01%
55Looking at previous crash or incident10.01%
Table 3. Frequency of one secondary driving task and undistracted samples under events and baselines.
Frequency of Secondary Driving TasksFrequency of Undistracted Samples
Frequency of Events n 11 n 12
Frequency of Baselines n 21 n 22
Table 4. Secondary driving task category criteria.
CategoryCategory Criteria
High-Risk Distractionai > 1, LCL > 1
Medium-Risk Distractionai > 1, LCL < 1
Low-Risk Distractionai < 1, UCL > 1
No-Risk Distractionai < 1, UCL < 1
Table 5. Secondary driving task category criteria with the presence of value 0.
CategoryCategory Criteria
Relatively Dangerous DistractionSecondary Driving Task Only Present in Event
Relatively Safe DistractionSecondary Driving Task Only Present in Baseline
Table 6. Odds ratio calculation results of some secondary driving tasks.
Secondary Driving TaskCategoryOdds RatioUCLLCL
Lost in thoughtHigh-Risk Distraction12.3361.352.48
Applying make-upMedium-Risk Distraction1.173.300.42
Eating without utensilsLow-Risk Distraction0.861.470.50
Smoking cigar/cigaretteNo-Risk Distraction0.440.940.20
Looked but did not seeRelatively Dangerous Distraction---
Lighting cigar/cigaretteRelatively Safe Distraction---
Table 7. Secondary driving task category.
CategoryNumber of the Secondary Driving Tasks
High-Risk DistractionNo. 1–3
Medium-Risk DistractionNo. 26–35
Low-Risk DistractionNo. 15–25
No-Risk DistractionNo. 4–14
Relatively Dangerous DistractionNo. 53–55
Relatively Safe DistractionNo. 36–52
Table 8. Driver characteristics.
AttributesSubcategoriesCountPercentage
Age18–24192045.38%
25–44140833.38%
45–6483519.74%
65+681.61%
GenderMale245758.07%
Female177441.93%
Driver Seatbelt UseLap/shoulder belt358184.64%
None used65015.36%
Driver Distraction Classification Based on Driver’s GazeHigh–Risk Distraction1363.21%
Medium–Risk Distraction269463.67%
Low–Risk Distraction140133.11%
Driver distraction classification based on secondary driving tasksHigh–Risk Distraction671.58%
Medium–Risk Distraction2114.99%
Low–Risk Distraction53012.53%
No–Risk Distraction323776.51%
Relatively Dangerous Distraction40.09%
Relatively Safe Distraction1824.30%
Table 9. Road environment factors.
AttributesSubcategoriesCountPercentage
Surface ConditionDry378289.39%
Wet4149.78%
Snowy270.64%
Icy70.17%
Muddy10.02%
Traffic DensityA213250.39%
B180742.71%
C1774.18%
D651.54%
E220.52%
F280.66%
Traffic FlowDivided (median strip or barrier)270864.00%
Not divided128630.39%
One-way traffic1383.26%
No lanes992.34%
Traffic ControlTraffic signal3508.27%
No traffic control367486.84%
Stop sign330.78%
Traffic lanes marked1313.10%
Yield sign170.40%
Officer or watchman20.05%
One-way road or street20.05%
Other220.52%
Relation to JunctionNon-Junction343281.12%
Intersection-related2295.41%
Intersection3137.40%
Entrance/exit ramp1373.24%
Driveway, alley access, etc.160.38%
Parking lot811.91%
Interchange Area160.38%
Other70.17%
AlignmentStraight level362685.70%
Straight grade952.25%
Curve level47511.23%
Curve grade340.80%
Straight hillcrest10.02%
Travel Lanes050.12%
11994.70%
2212250.15%
3118227.94%
459514.06%
51132.67%
6130.31%
710.02%
810.02%
Locality8+50.12%
Business/industrial140333.16%
Interstate116327.49%
Residential44310.47%
Open Country116227.46%
Church20.05%
Construction Zone170.40%
School40.09%
Other370.87%
LightingDaylight279866.13%
Darkness, lighted74817.68%
Darkness, not lighted4119.71%
Dusk2596.12%
Dawn150.35%
WeatherClear366786.65%
Cloudy2265.34%
Raining3237.63%
Mist40.09%
Snowing120.28%
Table 10. Optimal hyperparameter values.
ModelHyperparameterGazeSecondary Driving Task
Random Forestn_estimators40100
max_features68
AdaBoostn_estimators5040
learning_rate0.61
XGBoostn_estimators10040
learning_rate0.110.15
Table 11. Prediction accuracy.
ModelCategoryAccuracyAUC
Random ForestGaze89.30% 0.861
Secondary Driving Task88.90% 0.857
Secondary Driving Task Without Classification88.68% 0.835
AdaBoostGaze89.96%0.887
Secondary Driving Task89.72%0.892
Secondary Driving Task Without Classification89.61%0.850
XGBoostGaze90.67%0.874
Secondary Driving Task90.67%0.872
Secondary Driving Task Without Classification89.84%0.868
Table 12. Comparison of model algorithms accuracy.
StudyModelAccuracy
[44]Bayesian Networks60.4%
[68]Markov Chain Model85.3%
Our paperGaze—Random Forest89.30%
Secondary Driving Task—Random Forest88.90%
Gaze—AdaBoost89.96%
Secondary Driving Task—AdaBoost89.72%
Gaze—XGBoost90.67%
Secondary Driving Task—XGBoost90.67%
Publisher’s Note: MDPI stays neutral with regard to jurisdictional claims in published maps and institutional affiliations.