Abstract
Three-dimensional subcooled flow boiling of R134a in a horizontal tube was simulated by a VOF (volume of fluid) model combined with the level set method. Bubble characteristics were explored at heat flux of 0.3 MW/m2, inlet subcooling of 3 K, and inlet velocity of 0.4 m/s. It was observed that five representative bubbles occurred in subcooled flow boiling, including sliding bubble, coalescing bubble, non-departed bubble, bouncing bubble, and continuous-boiling bubble. The results showed that the bubble radial velocity was an important factor of bubble departure after a sliding process. Moreover, the effect of heat flux, inlet velocity, and inlet subcooling on bubble departure diameter were investigated. The departure diameter increased with increasing inlet velocity from 0.2 to 0.4 m/s and heat flux from 0.2 to 0.4 MW/m2, while diameter decreased with inlet subcooling from 3 to 10 K. Finally, based on the influence of heat flux, inlet velocity, and inlet subcooling on average departure diameter of the bubble except the coalescing bubble, a model was proposed to predict the average departure diameter. The deviation of the model was within 5%.
MSC:
80M12
1. Introduction
Compared with saturated boiling, subcooled flow boiling shows better heat transfer ability. Bubble generation requires lots of latent heat and transports energy from then hot region to cold bulk liquid in subcooled flow boiling [1,2]. Subcooled flow boiling is applied to many fields, for instance, refrigeration, electronic cooling, aerospace, nuclear, and biological engineering [3,4]. Researchers have paid more attention to study bubbles in subcooled flow boiling, because better understanding and prediction of bubbles are critical for heat transfer mechanism and enhancement in subcooled flow boiling [5].
The visualization is absolutely necessary for studying bubbles in subcooled flow boiling. In recent decades, the process of subcooled flow boiling was observed and investigated through high-speed camera visualization, which made progress in understanding onset of boiling (ONB), bubble growth, bubble sliding, and bubble departure. Yang et al. [6] studied upward subcooled flow boiling in a narrow channel through experiments at mass flux of 122 to 657 kg/(m2·s), subcooling of 4.7 to 33.3 K, and heat flux of 0.17 to 2.89 kW/m2. It was concluded that the ONB relied strongly on wall superheat and heat flux. The mass flux, wall superheat, and subcooling had considerable impact on bubble departure diameter. Liu et al. [7] carried out a visual experiment to study bubble size in vertical subcooled flow boiling. It was observed that bubbles slid long distances along the heating wall without increasing size at heat flux of 0.15 MW/m2. However, the bubble size increased with sliding at heat flux of 0.3 MW/m2. It was found that bubble size increased with increasing heat flux of 0.15 to 0.3 MW/m2, while it decreased with increasing system pressure of 0.1 to 1.0 MPa, subcooling of 10 to 30 K, and mass flux of 800 to 900 kg/(m2·s). Yuan et al. [8] researched the bubble sliding process in a vertical rectangular narrow channel in subcooled flow boiling. The working conditions were at mass flux of 117.49 to 300.84 kg/(m2·s), subcooling of 20 to 36 K, and heat flux of 64.57 to 147.82 kW/m2. The results showed that both bubble speed and sliding distance increased with increasing mainstream velocity. Cao et al. [1] gave a very detailed description of bubble deformation at a velocity of 0.1 to 0.8 m/s and subcooling of 5 to 50 K. It was found that the very weak deforming phenomena was observed at low subcooling. Zhou et al. [9] established a bubble dynamics model on the basis of visual experimental results, which could predict the bubble departure diameter well. Omar et al. [10] investigated bubble departure in subcooled flow boiling, and a new empirical correlation was proposed to predict bubble departure. There are more researchers exploring bubble through experimental visualization, such as Lie and Lin [11], Fu et al. [12], and so on. As reviewed above, exploring subcooled flow boiling through high-speed camera visualization has been reported widely. However, there are many limiting and uncertain factors in the high-speed visualization experiment; the cost of the experiment is high, the experimental period is long, and experimental results are not controllable.
In recent years, it has been popular to develop numerical solutions to achieve the visualization of subcooled flow boiling [13]. Compared with experiments, the numerical simulation has great advantages, including low cost, good controllability, and short time frame. The software CFD (Computational Fluid Dynamics) is used in the research of subcooled flow boiling because the bubble is tracked by the volume of fluid (VOF) model [14,15,16]. In addition, the level set method also plays a role in bubble tracking [17,18]. Zhuan and Wang [19] simulated subcooled flow boiling in a microchannel by a VOF model; the process of bubble growth, condensation, and collapse were observed. It was concluded that bubble growth, condensation, and collapse were affected by subcooling, departure size, heat flux, and mass flux. At high subcooling, the surface tension acting on a bubble is very great. The flow pattern observed in simulation corresponded to the experiment in a certain range. Guo et al. [20] researched bubble dynamics in a one-side heating wall and built a bubble growth model with a VOF model. The results showed that the fluid field was divided into three zones, including bubble generating zone, growth zone, and annihilation zone, and the three zones changed with bubble motion. Wei et al. [21] used a VOF model to investigate bubbles in subcooled flow boiling under swing motion. Bubble coalescence, sliding, and departure were observed; meanwhile, bubble departure and reattachment were occurring occasionally. Lee et al. [22] simulated bubble growth on a microfinned face by using the level set method. The bubble shape was tracked well. The effect of a fin on bubble growth was studied to find the optimal conditions for heat transfer enhancement. The VOF model is widely used compared with the level set method, which is especially applied to shape changes. In addition, more studies tend to use water as the working fluid. Though researchers have made some progress in understanding subcooled flow boiling through the VOF model or the level set method, simulations are still being conducted.
In this paper, both the VOF model combined and the level set method were adopted in a numerical simulation. In addition, the refrigerant R134a was selected as the working fluid for its wide heat transfer applications. R134a has been widely used in commercial refrigeration, but few studies have examined subcooled boiling of R134a. The study of R134a subcooled boiling is of great significance for improving system performance in the field of low carbon and energy saving for our study, the boiling process of subcooled flow boiling of R134a in a three-dimensional horizontal tube was simulated. The bubble characteristics in subcooled flow boiling were discussed, and, the influence of inlet velocity, heat flux, and subcooling on bubble departure diameter were investigated.
2. Numerical Solution
2.1. Geometrical Configuration
A three-dimensional horizontal tube model was established to simulate the subcooled flow boiling as shown in Figure 1. The diameter of the inner heating wall and the outer adiabatic wall were 10 mm and 16 mm, respectively, and the length was 100 mm. The mesh used in the simulation was a structured O-grid, which ensured the precision and stability of the numerical solution. Considering the minimal value of bubble departure diameter, the height of the first layer of mesh on the heating wall was determined by experimental data.

Figure 1.
Three-dimensional horizontal tube model.
2.2. The VOF Model
In this paper, the visual simulation of flow boiling was performed by using a VOF model combined with the level set method. The VOF model has the advantage of mass conservation in interface capture aspect, but it is not ideal in a complex interface simulation. The level set method has a strong ability to handle complex interfaces, but the disadvantage is that mass is not conserved. The combination of a VOF model and level set can simulate the bubble characteristics well.
In a VOF model, the interface is tracked by obtaining the volume fraction α in each computational cell [14], and the volume fraction α is,
where α = 1 means the computational cell is occupied by liquid. α = 0 means the computational cell is occupied by vapor; α between 0 and 1 represents the vapor–liquid interface.
The continuity equation for the vapor phase is,
The continuity equation for the liquid phase is,
where αl is the liquid fraction, αv is the vapor fraction, is the fluid velocity vector [m/s], ρv is the vapor density [kg/m3], ρl is the liquid density [kg/m3], SM-lv is the mass source from liquid phase to vapor phase [kg/(m3s)], t is time [s], and SM-vl is the mass source from vapor phase to liquid phase [kg/(m3s)].
The velocity field obtained by solving the single momentum equation in the whole domain is shared among the phases. The momentum equation shown below depends on the volume fraction of all phases of the physical properties ρ and μ. The liquid phase and vapor phase share the same set of momentum and energy equations. The momentum equation is,
The energy equation is,
where p is the pressure of interface [N/m2], is the transpose part of the strain rate tensor, g is the acceleration of gravity [m/s2], μeff is the effective dynamic viscosity [Ns/m2], λeff is the effective thermal conductivity [W/mK], is the surface tension per unit volume of fluid [N/m3], and SE is the energy source term that is loaded by the UDF (user defined function) [W/m3].
The effective viscosity μeff is,
The effective thermal conductivity λeff is,
where vt is the turbulent kinematic viscosity [m2/s], and Prt is the turbulent Prandtl number. The Prt is obtained by referring to Weigand et al. [23].
In Equations (5) and (6), where ρ is the mixture density [kg/m3], λ is the mixture conductivity [W/mK], is the mixture velocity [m/s], μ is the mixture viscosity [Ns/m2], T is the mixture temperature [K], and cp is the mixture specific heat capacity [J/kgK]. They are acquired by the volume average method, that is,
2.3. The Level Set Method
The level set method defines a symbolic distance function ϕ to track the phase interface [24], and the bubble surface or liquid–vapor interface is tracked by the level set function ϕ, which is defined as a signed distance from the interface. The negative sign is chosen for the vapor phase and the positive sign for the liquid phase. In each simulation, the level set looks for ϕ = 0 to track the gas–liquid interface, and the expression equation is,
where d(x, Γ(t)) is the distance from x to Γ(t), and Γ(t) is the zero iso-surface of ϕ(x,t), which is defined as,
The control equation for vapor based on the level set method is,
The curvature and unit normal vector of the interface are,
Considering numerical difficulty caused by a sudden change of a physical property on the interface, the smooth Heaviside function is,
where ε is the thickness of the interface [m].
The density and viscosity smoothed are,
The fluid momentum equation combined with the level set method is [25],
2.4. Surface Tension
The surface tension is the most important force to impact bubble behaviors, including nucleation of small-sized, activation of nucleation cavities, bubble growth, and bubble departure. The continuous surface force (CSF) model takes into account the impact of surface tension, which transfers the surface tension into body force [26]. The CSF model is added to the momentum equation as a source term. The equation of the source term in Equation (5) is defined as:
where σ is the coefficient of surface tension [N/m], kl is the surface curvature [1/m], which is defined in terms of the divergence of the unit normal vector , kl and defined as,
the equation of the south term in Equation (23) is,
where δ is defined by averages of the Heaviside function, and the Heaviside function is,
2.5. Phase Changing Model
In the study of pure working fluid boiling simulation, researchers have proposed several phase changing models from different perspectives, such as a dynamic model, a two-fluid model, an energy model, etc. Considering the motion of bubbles, the Lee [27] model was adopted as the phase change model. The Lee model is a dynamic model which is driven by temperature difference and has obvious physical sense. Whether the boiling appears or not depends entirely on the difference between the fluid and the saturated temperature. The specific form of the source item is as follows [27]:
The liquid phase source term is,
The vapor phase source term is,
The energy source term is,
where η is the phase change mass transfer coefficient [s−1], and Tsat is the saturation temperature [K], h is the latent heat [J/kg].
The phase change mass transfer coefficient is important for convergence of the simulation and the temperature of the interface, which is small for simulation of boiling while large for condensation [21,28], De Schepper et al.’s [29] value = 0.1 was used in this work. The results showed that the temperature of the interface kept at the saturated temperature, and the simulation could converge well.
2.6. Turbulent Flow Model
The transition Reynolds number in the small channel is smaller than that in the conventional channel. Meanwhile, the turbulence model is also suitable for the small Reynolds number due to the disturbance of bubbles [30]. We define the Reynolds number as follows:
where V is the inlet velocity [m/s], and d is the hydraulic diameter [m].
Considering the shear effect caused by turbulence near the wall during subcooled boiling, it is necessary to choose a turbulent model for the prediction of boiling. The SST k − ω model considers the effect of shear stress and combines the k − ω model in the near-wall low Reynolds number region, which greatly improves the accuracy and stability of turbulence simulation [31]. Therefore, the SST k − ω model was adopted in the simulation, and the transport equation regarding k and ω are,
where k is the turbulent kinetic energy [m2/s2], ω is the turbulent vortex frequency, is the reciprocal of effective turbulent Prandtl number of the turbulent vortex frequency, is the reciprocal of the effective turbulent Prandtl number of turbulent kinetic energy, Gk is the generation term of turbulent kinetic energy caused by time-average velocity gradient, Gω is the generation term of turbulent vortex frequency, Yk is the dissipation term of turbulent kinetic energy, Yω is the dissipation term of turbulent vortex frequency, and Dω is the cross diffusion term. For the specific definition of the above content, see reference [32].
The turbulent kinematic viscosity is,
where is 0.31, S is the strain rate, a* = 1, and F2 refers to [32].
The of the first cell was controlled to by adjusting the cell distance to adjacent walls. According to the characteristics of flow boiling, the bubble departs from the boundary layer that belongs to the buffer layer. The buffer layer region is the region where viscosity and Reynold stress are obvious. Therefore, the first layer cell uses to ensure that the near-wall region is within the buffer region [33]. The equation of is,
where uτ is the shear velocity [m/s], y is the boundary layer length [m], and v is the kinematic viscosity [m2/s].
2.7. Operation and Boundary Conditions
The R134a was chosen as the working fluid in the simulation, and the saturated temperature was 288.15 K. The thermophysical properties of the working fluid was acquired by consulting REFPROP. Table 1 shows the properties of the working fluid. The specific heat capacity cp varied with fluid temperature, so it was set by means of piecewise-linear in the simulation.

Table 1.
The properties of the working fluid.
In the simulation, the second boundary condition was selected for the inner wall and the outer wall; that is, the given heat flux q was 200, 300, and 400 KW/m2, respectively, the outer wall was adiabatic, and the given heat flux was 0 KW/m2. In addition, the wall contact angle was 17°, and no slip was along the wall. The inlet boundary was set as mass-flow-inlet. The mass flux was calculated by combining the inlet velocity, fluid density, and cross-sectional area. The inlet velocities were 0.2, 0.3, and 0.4 m/s, respectively. The inlet temperature was set to 3 K, 6 K, and 10 K, respectively. The outlet boundary was the pressure outlet and set to 1 atmospheric pressure.
2.8. Solution Methods
Solution methods including PISO [34] were chosen for calculation, PRESTO! [35] was chosen for pressure interpolation, and geo-reconstruct was chosen for interface reconstruction. A better simulation scheme was obtained after debugging, and more details are shown in Table 2.

Table 2.
More details of setting.
3. Results and Discussion
3.1. Validation of the Numerical Model
It was discovered that bubbles were not regular spheres when departed from theheating wall; therefore, the equivalent departure diameter was used to calculate departure diameter. The bubble departure diameter is defined as the diameter of the bubble measured by a digital image obtained by the CFD software at the departure time. The departure time is when the bubble stays on the heating wall in the previous frame image and leaves the heating wall in the latter frame. The bubble departs between two frames, and the previous frame is used as the bubble departure time. The time interval between frames was 0.5 ms in the simulation. The calculation of departure diameter followed Han and Griffitth [36], and the equation is,
where a is the bubble width [m], and b is the bubble height [m].
Average departure diameter is,
The validity of the numerical model was tested by experimental data from Chen et al.’s [37] experiment and was carried out at an inlet velocity of 0.4 m/s, inlet subcooling of 3 K, saturated temperature of 288.15 K, and narrow gap of 1 mm. The R134a was used as the working fluid. The visualization of the boiling process was observed by a high-speed camera, and the experiment showed the change of average departure diameter under different heat fluxes. The simulation of subcooled flow boiling was performed in accordance with the above experimental condition. Firstly, the height of the first layer mesh on the heating wall was set to 0.1 mm by referring to minimal departure diameter. The turbulent model met the simulation requirement due to the value of which varied from 4 to 16, which belongs to the buffer region. Then, the average bubble departure diameter under different heat fluxes was compared between the simulation results and experimental data as shown in Figure 2. It was found that the average departure diameter from the simulation had a good agreement with the experimental data. It was proved that the numerical solution was effective.
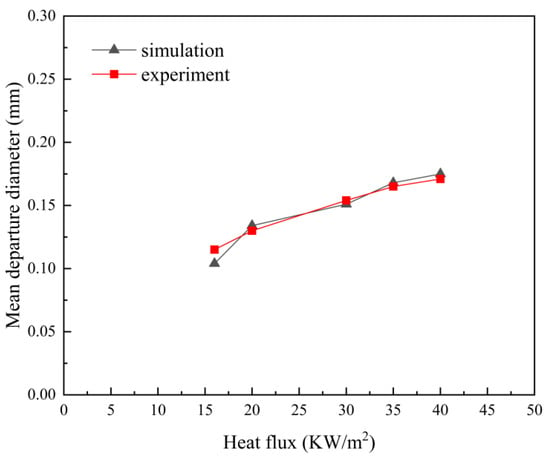
Figure 2.
The average bubble departure diameter under different heat fluxes is compared between simulation results and the experimental data.
3.2. Characteristics of Boiling Process
A three-dimensional horizontal tube model was established to simulate the subcooled flow boiling as shown in Figure 1. A simulation case was finished to explore bubble characteristics in subcooled flow boiling under heat flux of 0.3 MW/m2, inlet subcooling of 3 K, and inlet velocity of 0.4 m/s.
The developing process of 13 bubbles was observed in the case. Furthermore, 5 representative bubbles were investigated, including a sliding bubble, a coalescing bubble, a non-departed bubble, a bouncing bubble, and continuous-boiling bubbles. Figure 3 shows the developing process of the sliding bubble (in the red rectangular frame). The image of the bubble shows that the bubble experienced nucleation, sliding, departure, and collapse. It can be seen from Figure 3 that the bubble nucleated at 6.5 ms. After that, the bubble slid until at 14.5 ms it began to depart and collapse. Obviously, the sliding dominated the growth process of the sliding bubble. Figure 4 shows the variation of size of the sliding bubble; it was found that the sliding bubble size increased with sliding. There is an isothermal line of 288.818 K near the heating surface from Figure 5 indicating that an overheating layer provided the bubble sliding process with an overheating environment. At the same time, the bubble collapsed after departing from heating, which reflects the characteristics of subcooled flow boiling. Figure 6 presents the developing process of a coalescing bubble (in the red rectangular frame). Compared with the sliding bubble, the bubble coalesces with other bubbles during the sliding process. From Figure 6, two adjacent small bubbles were independent at 7 ms, which then coalesced in one bubble at 8 ms. It is inferred that adequate bubble nucleation causes bubble coalescence.
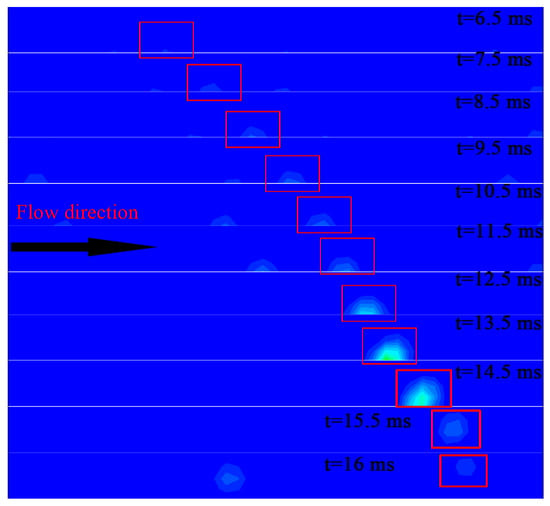
Figure 3.
The developing process of the sliding bubble with time.
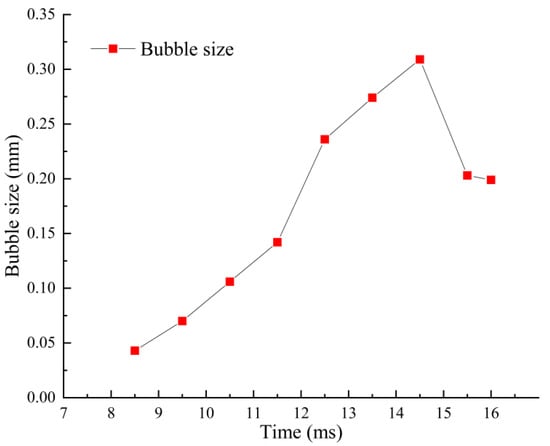
Figure 4.
The variation in the size of a sliding bubble.
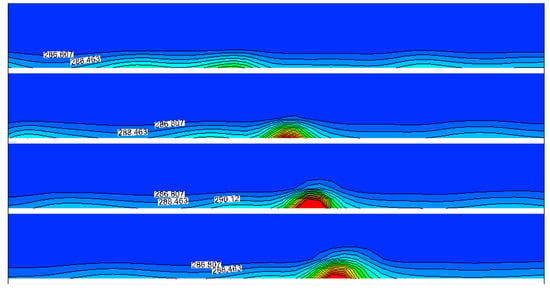
Figure 5.
The isothermal line of a sliding bubble near the heating surface.
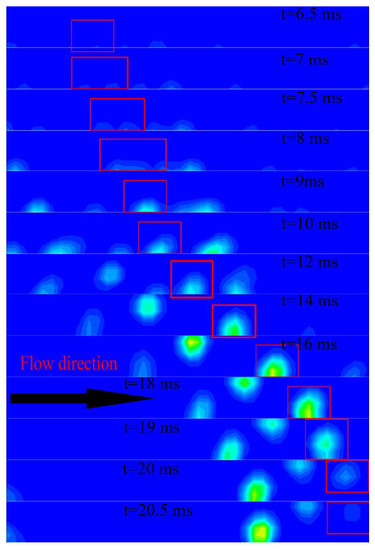
Figure 6.
The developing process of coalescing bubble with time.
Coalescing bubbles and sliding bubbles are common in subcooled boiling. An occasional bubble behavior also found is the non-departed bubble. Figure 7 exhibits the non-departed bubble (in the red rectangular frame) that does not depart from the heating wall but collapses directly on the wall. This may be related to the local heat transfer difference and flow field difference. The trend of axial and radial velocities of the above three bubbles during sliding is shown in Figure 8. The variation trends of the axial velocity of the abovementioned three bubbles are consistent, while the radial velocity variation is different. The radial velocity of sliding and coalescing bubbles increase during the sliding process, but the radial velocity of the non-departed bubble decreases during sliding process. It is concluded that increasing radial velocity is the direct reason of bubble departure. In addition, the change of surface tension caused by the change of temperature field affects bubble departure. Obviously, it is shown in Figure 5 that the temperature field of the bubble decreases as a whole when the bubble is departing, which weakens the hindrance of surface tension. Surface tension is the main reason for non-departed bubbles. Analysis of Figure 8 shows that the axial bubble velocity decreases during sliding; this deceleration behavior may provide an environment for bubble growth during sliding.
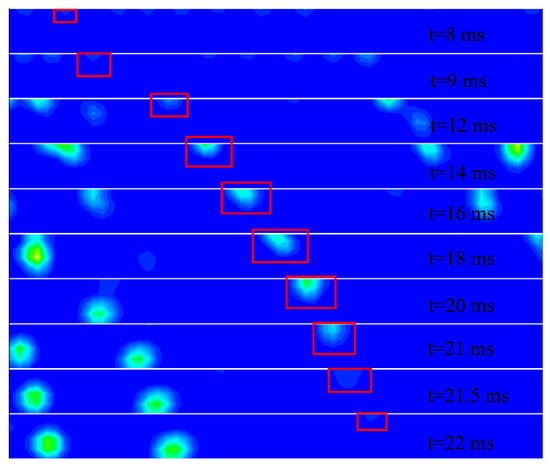
Figure 7.
The developing process of a non-departed bubble with time.
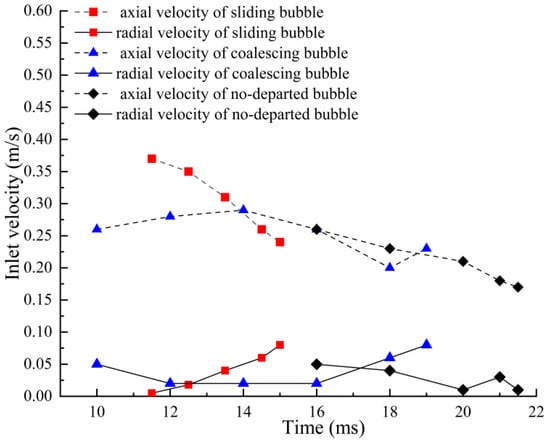
Figure 8.
The trend of axial and radial velocities of a sliding bubble, a coalescing bubble and a non-departed bubble during sliding.
With bubble departure as the time node, the developing process of two kinds of remaining bubbles occurs after bubble departure, including bouncing and continuous-boiling bubbles. The developing process these bubbles is shown in Figure 9 and Figure 10. The bouncing bubble experiences complex changes after departing as shown in Figure 9. The bubble begins to depart at 14.5 ms, but does not collapse immediately after departing. It keeps close to the heating wall and the bubble size increases from 15.5 to 30 ms. However, the bouncing bubble is condensed and its size greatly reduces from 30 to 41 ms. It can be observed that the bouncing bubble reattached to the heating face at 2 ms, and the bubble continued to slide and grow after reattaching. The bouncing bubble was also observed in early research of Okawa et al.’s [38] experiment. Experimental and simulation results show that the bubble size is condensed before reattaching with the heating wall. The surface tension acting on the bubble after condensation is obvious, which made the bubble reattach to the heating wall. Finally, the continuous-boiling bubble is described in Figure 10. At 17.5 ms, the bubble begins to depart from the heating wall, leaving a small amount of vapor attached to the wall, which will grow up to be a bubble. A portion of vapor was also left behind when the bouncing bubble departed in Figure 9, but the continuous boiling did not appear, which may be related to wall temperature and flow field conditions. In the existing theoretical research, a small amount of bubble vapor remaining in the heating wall is also one of the causes of bubble nucleation.
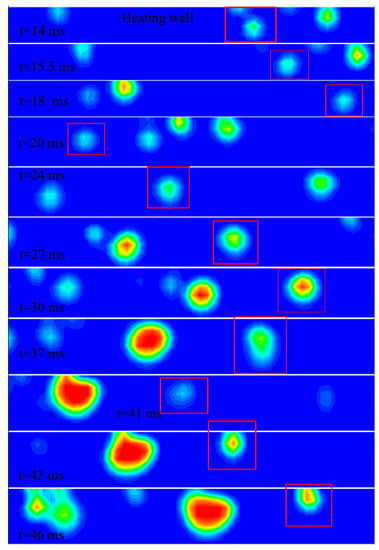
Figure 9.
The developing process of a bouncing bubble with time.
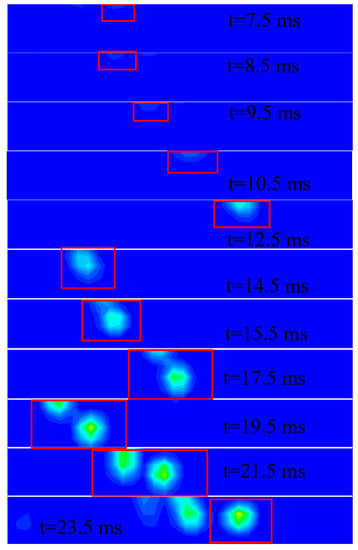
Figure 10.
The developing process of a continuous-boiling bubble with time.
Except for the five bubbles described above, the characteristic of all bubble departure was investigated. Figure 11 shows the bubble departure diameter of 12 bubbles at a heat flux of 0.3 MW/m2, inlet velocity of 0.4 m/s, and inlet subcooling of 3 K. As can be seen from Figure 11, the bubble departure diameter is widely in the range of 0.25 to 0.35 mm. However, there are bubbles with diameters above 0.4 mm and below 0.25 mm. This is because different bubble nucleation points have different positions, and the difference between the local heat transfer and the flow field velocity in different positions makes the characteristics of bubble departure quite different. The heat flux, inlet velocity, and inlet subcooling are important factors affecting bubble departure, which are discussed in the next section.
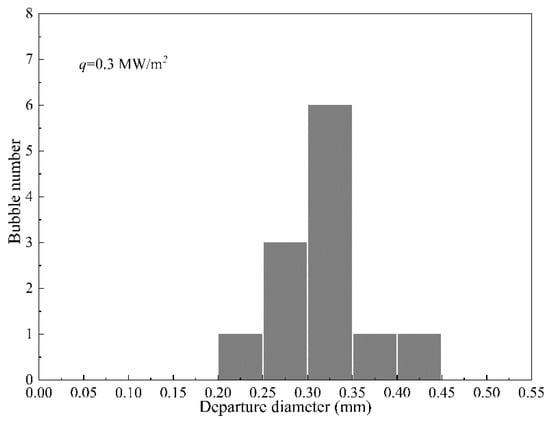
Figure 11.
Bubble departure diameter at heat flux of 0.3 MW/m2, inlet velocity of 0.4 m/s, and inlet subcooling of 3 K.
3.3. Bubble Departure Diameter
The complete boiling process of bubbles was observed to explore the influence of different factors on bubble departure diameter. Firstly, the effect of heat flux on bubble departure diameter was investigated. Figure 11 and Figure 12 show bubble departure diameter at different heat flux, inlet subcooling of 3 K, and inlet velocity of 0.4 m/s. The bubble departure diameter is between 0.15 and 0.475 mm when the heat flux is 0.2 MW/m2 as shown in Figure 12a, and most bubbles are between 0.2 and 0.35 mm. The bubble departure diameter is in the range of 0.2 and 0.45 mm when the heat flux increases to 0.3 MW as shown in Figure 11, and most bubbles are in range of 0.25 and 0.35 mm. The bubble departure diameter is between 0.25 and 0.5 mm when the heat flux is up to 0.4 MW as shown in Figure 12b, and most bubbles are between 0.3 and 0.35 mm. By comparison, the bubble departure diameter increases as the heat flux increases. Apparently, the heat absorbed by bubbles increases as heat flux increases, which causes the increased departure diameter. In addition, the maximum departure diameter of some bubbles can exceed 0.4 mm, which are attributed to coalescence.
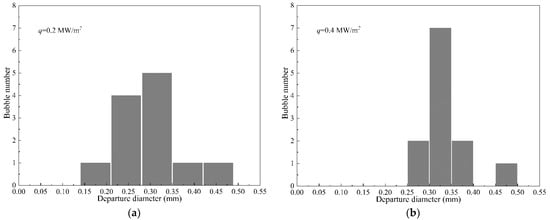
Figure 12.
Bubble departure diameter at different heat flux, (V = 0.4 m/s, ΔTsub = 3 K): (a) bubble departure diameter at heat flux of 0.2 MW/m2; (b) bubble departure diameter at heat flux of 0.4 MW/m2.
Figure 13a–c illustrate bubble departure diameter at different inlet velocities, simultaneously, keepings the heat flux of 0.2 MW/m2 and subcooling of 3 K constant. At the lower inlet velocity of 0.2 m/s, bubbles have departure diameters more than 0.15 mm and less than 0.35 mm. With the velocity raised to 0.3 m/s, bubbles have departure diameters more than 0.2 mm and less than 0.35 mm. Most of the bubbles are in the range of 0.25 to 0.35 mm when inlet velocity is up to 0.4 m/s, and the maximum diameter of the bubble is over 0.4 mm. By comparing departure diameter of the three inlet velocities, it is inferred that departure diameter is increased by larger inlet velocity. It is explained that increasing inlet velocity gives bubbles the energy to obtain larger sliding velocity. Therefore, the bubble with larger velocity slides a longer distance and further increases the bubble departure diameter.
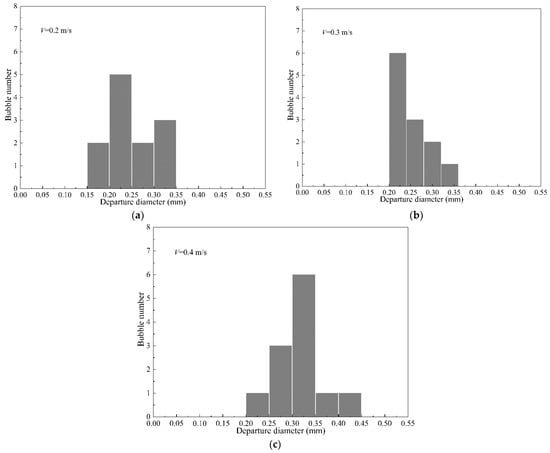
Figure 13.
Bubble departure diameter at different inlet velocities, (q = 0.3 MW/m2, ΔTsub = 3 K): (a) bubble departure diameter at inlet velocity of 0.2 m/s; (b) bubble departure diameter at inlet velocity of 0.3 m/s; (c) bubble departure diameter at inlet velocity of 0.4 m/s.
The effect of subcooling on bubble departure diameter is investigated at three inlet subcooling of 3 K, 6 K, and 10 K with constant heat flux of 0.3 MW/m2 and velocity of 0.4 m/s, as shown in Figure 14. In low subcooling of 3 K, most bubbles range from 0.25 to 0.35 mm as shown in Figure 14a. In high subcooling of 10 K, most bubbles range from 0 and 0.3 mm as shown in Figure 14c. Under the condition of 6 K, the bubble departure diameter ranges from 0.2 to 0.4 mm. According to the comparison of three inlet subcooling of 3 K, 6 K, and 10 K, the bubble departure diameter decreases with increasing inlet subcooling. The departure diameter decreases with the increase of inlet subcooling due to the condensation of subcooled mainstream. However, several bubbles have large departure diameter at subcooling of 6 K and 10 K. On the one hand, the coalescence of bubbles increases the bubble size during sliding; on the other hand, the influence of inlet velocity and heat flux are prominent for departure diameter.
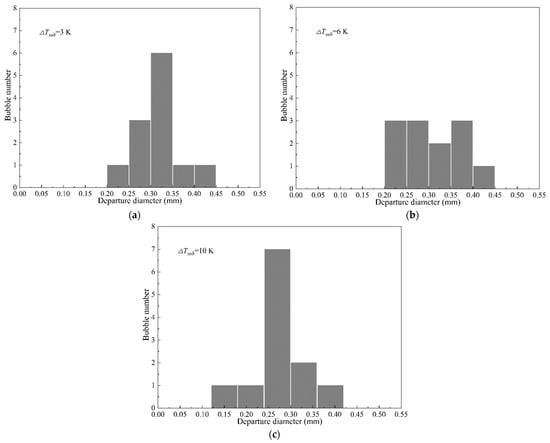
Figure 14.
Bubble departure diameter at different inlet subcooling, (q = 0.3 MW/m2, V = 0.4 m/s): (a) bubble departure diameter at inlet subcooling of 3 K; (b) bubble departure diameter at inlet subcooling of 6 K; (c) bubble departure diameter at inlet subcooling of 10 K.
3.4. The Prediction of Departure Diameter
Considering the difference of departure diameter among bubbles, as well as the complexity of departure diameter caused by the coalescence of bubbles, the average departure diameter of bubbles is used to study predicted correlation. Figure 15 displays the effect of different factors on average departure diameter, heat flux, inlet velocity, and inlet subcooling included. The results show that departure diameter of sliding bubbles increases with increasing heat flux, inlet velocity, and decreasing inlet subcooling. Through Figure 15, on the one hand, it can be seen from a single operating condition (red dotted line or blue dotted line) that the x-axis variable has an effect on the average bubble detachment diameter. On the other hand, it illustrates that heat flux, inlet velocity, and subcooling have a common effect on bubble departure diameter. When the velocity, heat flux, and subcooling increase to a certain value, there will be a certain interaction between them, resulting in either an increase or a slowdown of the trend. Therefore, the dimensionless number Bo, Re, Jαsub, and D* regarding heat flux, velocity, subcooling, and bubble departure diameter are introduced to investigate the combined effects.
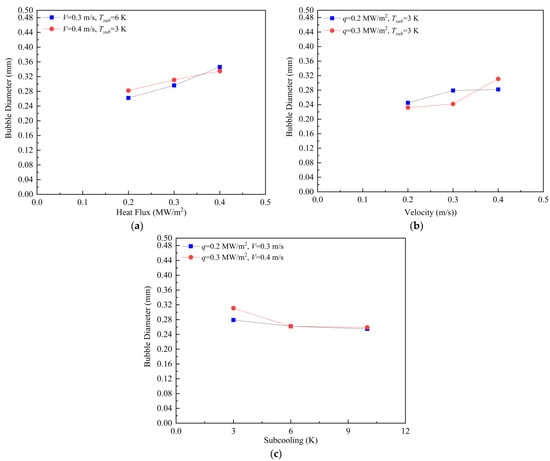
Figure 15.
The effect of different factors on average departure diameter: (a) the effect of heat flux; (b) the effect of inlet velocity; (c) the effect of inlet subcooling.
The model of Zeitoun and Shoukri [39] was used to predict bubble departure diameter regarding sliding. The equation of Zeitoun and Shoukri [39] includes the above dimensionless numbers as given in Equation (35). Figure 16 presents the comparison of departure diameter of the simulation with the predicted departure diameter obtained by the Equation (38). It is inferred that the equation cannot predict the bubble departure diameter well due to overpredicting departure size and showing great deviation compared with 5% deviation. The main possible reason is that the equation was developed for water, and the working condition was at mass flux of 156.15 to 403 kg/(m2·s), subcooling of 11.6 to 31.1 K, and heat flux of 286.68 to 603.24 kW/m2.
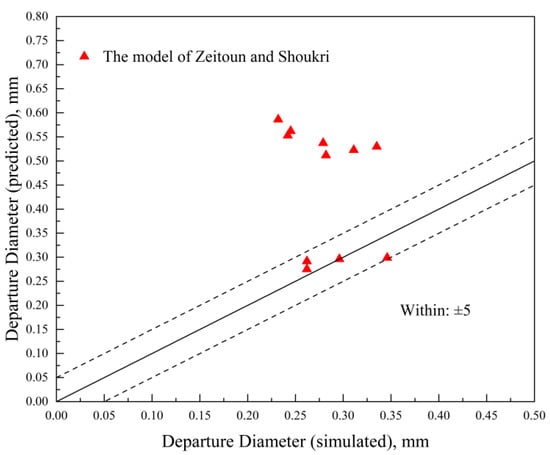
Figure 16.
The comparison of departure diameter of the simulation with the predicted departure diameter obtained by the Zeitoun and Shoukri equation.
A model is proposed for predicting the bubble departure diameter. The dimensionless bubble diameter in horizontal subcooled flow boiling of R134a can be correlated as Equation (36). The model proposed predicts the bubble departure diameter of the simulation results and the experiment data very well as shown in Figure 17, and nearly all values are within the deviation of ±5%. The straight line indicates that the predicted value is the same as the experimental or simulated value. Furthermore, the equation is applied to the condition of heat flux ranging from 0.2 to 0.4 MW, inlet velocity ranging from 0.2 to 0.4 m/s, and inlet subcooling varying from 3 to 10 K.
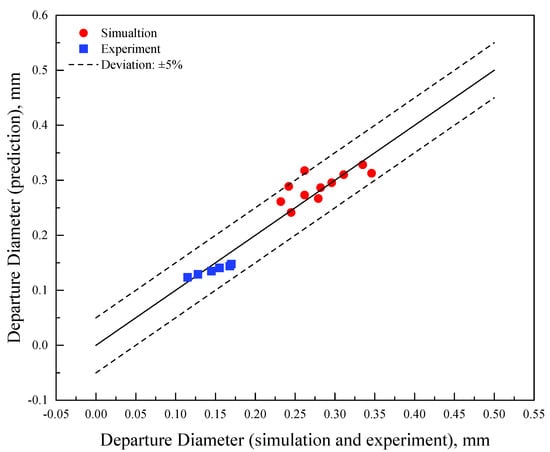
Figure 17.
The proposed model predicted the bubble departure diameter of the simulation results and the experiment data.
4. Conclusions
The boiling process of subcooled flow boiling of R134a in a three-dimensional horizontal tube was investigated by a VOF model combined with the level set method at conditions of heat flux from 200 to 300 kW/m2, velocity from 0.2 to 0.4 m/s, inlet subcooling from 3 to 10 K, and saturated temperature of 288.15 K. The major conclusions are given as follows.
- (1)
- Five major bubbles, including sliding, coalescing, non-departed, bouncing, and continuous-boiling bubbles, were observed in a subcooled boiling process at heat flux 0.3 MW/m2, inlet subcooling of 3 K, and inlet velocity of 0.4 m/s. The sliding bubble underwent nucleation, sliding, departure, and collapse, and sliding dominated the growth process. The heat flux input provides an overheated environment for bubble growth in the sliding process. The increasing of bubble radial velocity accelerates bubble departure.
- (2)
- The bubble departure diameter of R134a varied from 0.2 to 0.4 mm at different working conditions. The larger departure diameter was related to coalescence during sliding. The departure diameter increased with increasing heat flux because the bubble absorbs heat from the heating wall during the sliding process. The bubble velocity is subjected to the inlet velocity, and the departure diameter increases with increasing inlet velocity. Because the mainstream temperature affects bubble growth during the sliding process, the bubble departure diameter decreases with increasing inlet subcooling.
- (3)
- Based on the influence of heat flux, inlet velocity, and inlet subcooling on average departure diameter of bubble except coalescing bubbles, a model is proposed to predict the average bubble departure diameter. The deviation of the model is within 5%, which can be used to predict bubble departure diameter.
- (4)
- In the future, the developing process and mechanism of coalescing bubbles will be further studied to better understand and control the subcooled boiling process.
Author Contributions
Conceptualization, B.W.; methodology, B.W.; software, K.L., B.Y. and Y.S.; validation, B.W., K.L., B.Y. and Y.S.; formal analysis, B.W.; investigation, B.W.; resources, J.W. and J.X.; data curation, B.W.; writing—original draft preparation, B.W.; writing—review and editing, B.W. and J.W.; supervision, J.X.; project administration, J.X.; funding acquisition, J.X. All authors have read and agreed to the published version of the manuscript.
Funding
This research was funded by the National Key R&D Program of China, grant number 2019YFD0901604; Science and Technology Innovation Action Plan of the Shanghai Science and Technology Commission, grant number 19DZ1207503; and the Public Service Platform Project of the Shanghai Science and Technology Commission, grant number 20DZ2292200.
Data Availability Statement
Not applicable.
Conflicts of Interest
The authors declare no conflict of interest.
Abbreviations
The following subscripts are used in this manuscript:
| Subscripts | |
| ave | average |
| d | depart |
| eff | effective |
| l | liquid |
| level | level set |
| p | pressure |
| sat | saturation |
| sub | subcooling |
| t | turbulent |
| v | vapor |
| vol | volume |
References
- Cao, Y.; Kawara, Z.; Yokomine, T.; Kunugi, T. Visualization study on bubble dynamical behavior in subcooled flow boiling under various subcooling degree and flowrates. Int. J. Heat Mass Transf. 2016, 93, 839–852. [Google Scholar] [CrossRef]
- Clough, M.J. Precision Cooling of A Four Valve per Cylinder Engine; SAE: Warrendale, PA, USA, 1993. [Google Scholar]
- Pipathattakul, M.; Mahian, O.; Dalkilic, A.S.; Wongwises, S. Effects of the gap size on the flow pattern maps in a mini-gap annular channel. Exp. Therm. Fluid Sci. 2014, 57, 420–424. [Google Scholar] [CrossRef]
- Yan, J.; Xie, J. Comparative proteome analysis of shewanella putrefaciens WS13 mature biofilm under cold stress. Front. Microbiol. 2020, 11, 1225. [Google Scholar] [CrossRef] [PubMed]
- Mohanty, R.L.; Das, M.K. A critical review on bubble dynamics parameters influencing boiling heat transfer. Renew. Sustain. Energy Rev. 2017, 78, 466–494. [Google Scholar] [CrossRef]
- Yang, L.X.; Guo, A.; Liu, D. Experimental investigation of subcooled vertical upward flow boiling in a narrow rectangular channel. Exp. Heat Transf. 2016, 29, 221–243. [Google Scholar] [CrossRef]
- Liu, W.; Liu, H.; Chen, D.; Qin, J.; Yan, P.; Liu, H. Visual experimental study on bubble characteristics near the heating wall in subcooled flow boiling. Prog. Nucl. Energy 2021, 140, 103898. [Google Scholar] [CrossRef]
- Yuan, D.; Pan, L.; Wei, J.; Chen, D. Bubble sliding process on subcooling flow boiling in vertical rectangular narrow channel. In Proceedings of the 18th International Conference on Nuclear Engineering, Xi’an, China, 17–21 May 2010; pp. 1037–1047. [Google Scholar]
- Zhou, P.; Huang, R.; Huang, S.; Zhang, Y.; Rao, X. Experimental investigation on bubble contact diameter and bubble departure diameter in horizontal subcooled flow boiling. Int. J. Heat Mass Transf. 2020, 149, 119105. [Google Scholar] [CrossRef]
- Al-Yahia, O.S.; Yoon, H.J.; Jo, D. Bubble dynamic parameters during subcooled flow boiling under uniform and non-uniform transverse heat distribution. Int. J. Heat Mass Transf. 2019, 143, 118508. [Google Scholar] [CrossRef]
- Lie, Y.M.; Lin, T.F. Subcooled flow boiling heat transfer and associated bubble characteristics of R-134a in a narrow annular duct. Int. J. Heat Mass Transf. 2006, 49, 2077–2089. [Google Scholar] [CrossRef]
- Fu, X.; Zhang, P.; Huang, C.J.; Wang, R.Z. Bubble growth, departure and the following flow pattern evolution during flow boiling in a mini-tube. Int. J. Heat Mass Transf. 2010, 53, 4819–4831. [Google Scholar] [CrossRef]
- Xie, P.; Ding, H.; Ingham, D.B.; Ma, L.; Pourkashanian, M. Analysis and prediction of the gas-liquid interfacial area for droplets impact on solid surfaces. Appl. Therm. Eng. 2020, 178, 115583. [Google Scholar] [CrossRef]
- Hirt, C.W.; Nichols, B.D. Volume of fluid (VOF) method for the dynamics of free boundaries. J. Comput. Phys. 1981, 39, 201–225. [Google Scholar] [CrossRef]
- Povolny, A.; Cuhra, M. Two-phase CFD of channel boiling for boiling transition problems. In Proceedings of the 22nd International Conference on Nuclear Engineering (ICONE22), Prague, Czech Republic, 7–11 July 2014; ASME: Houston, TX, USA, 2014. [Google Scholar]
- Sontireddy, V.R.; Hari, S. Subcooled boiling: Validation by using different CFD models. In Proceedings of the 23rd Annual IEEE International Conference on High Performance Computing, Data, and Analytics (HiPCW), Intel, Hyderabad, India, 19–22 December 2016; pp. 90–99. [Google Scholar]
- Wu, J.; Dhir, V.K.; Qian, J. Numerical simulation of subcooled nucleate boiling by coupling level-set method with moving-mesh method. Numer. Heat Transf. Part B-Fundam. 2007, 51, 535–563. [Google Scholar] [CrossRef]
- Kim, K.; Son, G. Numerical analysis of film boiling in liquid jet impingement. Numer. Heat Transf. Part A Appl. 2013, 64, 695–709. [Google Scholar] [CrossRef]
- Zhuan, R.; Wang, W. Simulation of subcooled flow boiling in a micro-channel. Int. J. Refrig. 2011, 34, 781–795. [Google Scholar] [CrossRef]
- Guo, L.; Zhang, S.; Chen, Y.; Cheng, L. Research of flow boiling bubble dynamics in vertical rectangular mini-channel. In Proceedings of the 2010 Asia-Pacific Conference on Power Electronics and Design, Wuhan, China, 30–31 May 2010; pp. 16–19. [Google Scholar]
- Wei, J.; Pan, L.; Chen, D.; Zhang, H.; Xu, J.; Huang, Y. Numerical simulation of bubble behaviors in subcooled flow boiling under swing motion. Nucl. Eng. Des. 2011, 241, 2898–2908. [Google Scholar] [CrossRef]
- Lee, W.; Son, G.; Yoon, H.Y. Numerical study of bubble growth and boiling heat transfer on a microfinned surface. Int. Commun. Heat Mass Transf. 2012, 39, 52–57. [Google Scholar] [CrossRef]
- Weigand, B.; Ferguson, J.R.; Crawford, M.E. An extended Kays and Crawford turbulent Prandtl number model. Int. J. Heat Mass Transf. 1997, 40, 4191–4196. [Google Scholar] [CrossRef]
- Osher, S.; Sethian, J.A. Fronts propagating with curvature-dependent speed: Algorithms based on Hamilton-Jacobi formulations. J. Comput. Phys. 1988, 79, 12–49. [Google Scholar] [CrossRef]
- Wang, Y.; Cai, J. Numerical investigation on bubble evolution during nucleate boiling using diffuse interface method. Int. J. Heat Mass Transf. 2017, 112, 28–38. [Google Scholar] [CrossRef]
- Vachaparambil, K.J.; Einarsrud, K.E. Comparison of surface tension models for the volume of fluid method. Processes 2019, 7, 542. [Google Scholar] [CrossRef]
- Lee, W.H. A Pressure Iteration Scheme for Two-Phase Flow Modeling. In Computational Methods for Two-Phase Flow and Particle Transport; World Scientific: Singapore, 2002. [Google Scholar]
- Zhang, J.; Li, W.; Minkowycz, W.J. Numerical simulation of condensation for R410A at varying saturation temperatures in mini/micro tubes. Numer. Heat Transf. Part A Appl. 2016, 69, 464–478. [Google Scholar] [CrossRef]
- De Schepper, S.C.K.; Heynderickx, G.J.; Marin, G.B. Modeling the evaporation of a hydrocarbon feedstock in the convection section of a steam cracker. Comput. Chem. Eng. 2009, 33, 122–132. [Google Scholar] [CrossRef]
- Huang, X.J.; Wu, X.; Zhu, Y. Numerical investigation on R32 flow boiling in smooth mini-tube. K. Cheng Je Wu Li Hsueh Pao/J. Eng. Thermophys. 2014, 35, 2265–2268. [Google Scholar]
- Ma, H.; Cai, W.; Chen, J.; Yao, Y.; Jiang, Y. Numerical investigation on saturated boiling and heat transfer correlations in a vertical rectangular minichannel. Int. J. Therm. Sci. 2016, 102, 285–299. [Google Scholar] [CrossRef]
- Wilcox, D.C. Multiscale model for turbulent flows. In Proceedings of the 24th AIAA Aerospace Sciences Meeting, Reno, NV, USA, 6–9 January 1986. [Google Scholar]
- Owoeye, E.J. Bubble Transport in Subcooled Flow Boiling; University of Florida: Gainesville, FL, USA, 2015. [Google Scholar]
- Issa, R.I. Solution of the implicitly discretised fluid flow equations by operator-splitting. J. Comput. Phys. 1986, 62, 40–65. [Google Scholar] [CrossRef]
- Chen, Z.-Y.; Xue, C.; Chen, S.-M.; Lu, B.-H.; Wu, Y.-C.; Ding, J.-C.; Huang, S.-H.; Guo, G.-P. Quantum Approach to Accelerate Finite Volume Method on Steady Computational Fluid Dynamics Problems. Quantum Inf. Process. 2022, 21, 137. [Google Scholar] [CrossRef]
- Chi-Yeh, H.; Griffith, P. The mechanism of heat transfer in nucleate pool boiling—Part I: Bubble initiaton, growth and departure. Int. J. Heat Mass Transf. 1965, 8, 887–904. [Google Scholar] [CrossRef]
- Chen, C.A.; Li, K.W.; Lin, T.F.; Li, W.-K.; Yan, W.-M. Study on heat transfer and bubble behavior inside horizontal annuli: Experimental comparison of R-134a, R-407C, and R-410A subcooled flow boiling. Case Stud. Therm. Eng. 2021, 24, 100875. [Google Scholar] [CrossRef]
- Okawa, T.; Ishida, T.; Kataoka, I.; Mori, M. Bubble rise characteristics after the departure from a nucleation site in vertical upflow boiling of subcooled water. Nucl. Eng. Des. 2005, 235, 1149–1161. [Google Scholar] [CrossRef]
- Zeitoun, O.; Shoukri, M. Bubble behavior and mean diameter in subcooled flow boiling. J. Heat Transf. 1996, 118, 110–116. [Google Scholar] [CrossRef]
Publisher’s Note: MDPI stays neutral with regard to jurisdictional claims in published maps and institutional affiliations. |
© 2022 by the authors. Licensee MDPI, Basel, Switzerland. This article is an open access article distributed under the terms and conditions of the Creative Commons Attribution (CC BY) license (https://creativecommons.org/licenses/by/4.0/).